
Abstract
Excessive exposure to copper, a redox-active metal, generates free radicals, which can cause cellular damage. In this study, we aim to identify the proteins that are up- or downregulated by copper exposure in human embryonic carcinoma (NCCIT) cells and to understand the mechanisms that play a role in the copper-induced stress response. After exposure to copper ions, the cells showed upregulated levels of 78 kDa glucose-regulated protein, fibrillin 1, CWC22 spliceosome-associated protein (KIAA1604), heat shock protein (HSP) 60, and HSP70, while the tumor necrosis factor receptor-associated factor 6, vimentin, 14-3-3 protein zeta, and RAC-beta (AKT2) serine/threonine protein kinase were downregulated. The GeneGo Process Networks of the proteins upregulated by copper ions were analyzed, and the 3 highest-scoring networks from the proteins upregulated by copper ions are presented here. In particular, the increased level of HSP70 in response to copper ions occurred in a dose-dependent manner, indicating that HSP70 could be a potential biomarker for copper toxicity in mammalian cells.
Introduction
Copper is required by eukaryotic and prokaryotic organisms and can be both beneficial and harmful. Copper, a redox-active metal, serves as a catalytic and structural cofactor for enzymes and plays a role in the control of cellular biochemical and regulatory functions, including oxygen transport, energy generation, peptide hormone maturation, and signal transduction. 1 Excessive exposure to copper, however, can induce the generation of toxic free radicals. These free radicals can result in direct damage to a wide range of molecules, including proteins, lipids, and DNA. Cellular copper homeostasis in organisms is associated with proteins called “copper chaperones,” which are conserved in most organisms. 2 However, homeostatic control mechanisms in cells can be hindered upon exposure to excess copper due to damage to the DNA, proteins, and other macromolecules. 3 Therefore, it is important for the cells to maintain a proper intracellular copper concentration via a coordinated network of copper-binding or -transporting proteins in order to balance the excretion and the absorption of copper. 1,4
Defects in the copper homeostasis in cells can cause disease in humans. 5 –7 For example, Menkes disease is caused by the hyperaccumulation of copper in the intestines and a severe copper deficiency in the peripheral tissues and accompanying deficits in copper-dependent enzymes, such as the P-type copper-transporting adenosine triphosphatase (ATPase) pumps that are encoded by ATP7B. 6 Cellular copper concentration has also been reported to affect the proliferation and differentiation of stem cells under in vitro cell culture conditions. 8,9 In a previous study, 9 cord blood-derived CD34+ cells cultured following exposure to copper demonstrated a lower growth rate than the control cells, suggesting that treatment with copper negatively affected the proliferation of the stem cells.
Proteins that are associated with copper homeostasis have been investigated for their functions as copper-related proteins and their suitability to serve as biomarkers of copper contamination. 10 –12 Recently, the protein abundance profiles of copper-related proteins have been studied using proteomic techniques such as 2-dimensional gel electrophoresis (2DE) and matrix-assisted laser desorption ionization-time-of-flight mass spectrometry (MALDI-TOF MS), which can be used to monitor the abundance of thousands of proteins simultaneously. 4,13 Previous work has found that exposing the Hepa-T1 hepatocyte cell line to copper led to a differential abundance of 93 different proteins in a dose-dependent manner. 13 These proteins were associated with lipid metabolism, connective tissue development, and/or cell cycle control. Regulation of their abundance by copper exposure implies that their cellular functions are affected by copper toxicity. However, additional proteomic techniques are still needed to search for new biomarkers of copper toxicity in various cell types.
Human embryonic carcinoma (NCCIT) cells have an unlimited capacity for self-renewal, exhibit pluripotent gene expression profiles that are similar to embryonic stem cells, and can differentiate into derivatives of all 3 germ layers. 14,15 The NCCIT cells, which were derived from a malignant teratocarcinoma, show a gene expression profile that is similar to those of poorly differentiated, aggressive human tumors and could be used to find potential targets for future cancer therapies. Both embryonic stem cells and embryonic carcinoma cells express the core stemness transcription factors Nanog, Oct4, and Sox2, which are important for the stem transcriptional regulatory network. Based on these characteristics, therefore, both cell types can be classified in the same category. 16,17 In this study, we used proteomic techniques to identify proteins that were up- or downregulated after exposing NCCIT cells to copper. In the future, these proteins may help us to understand the mechanisms related to copper toxicity.
Materials and Methods
Materials
The NCCIT cells (CRL-2073) were purchased from ATCC (Manassas, Virginia). RPMI 1640, fetal bovine serum (FBS), and penicillin–streptomycin solution were purchased from Invitrogen (Carlsbad, California). The antibodies for HSP70 (sc-24) and 14-3-3 protein zeta (sc-1020) were obtained from Santa Cruz Technology (Santa Cruz, California). Copper compounds (CuSO4) were purchased from Sigma-Aldrich (St Louis, Missouri).
Cell Culture and Copper Ion Treatment
Cells were cultured in RPMI 1640 media supplemented with 10% FBS, 100 U/mL penicillin, and 10 μg/mL streptomycin ([P/S] Invitrogen, Carlsbad, California) at 37°C in a humidified, 5% CO2 atmosphere. The culture medium was replaced every 3 days until the cells reached greater than 90% confluence. The adherent cells were then harvested by detaching them with a 0.25% trypsin/EDTA solution, and 1 × 10⁶ NCCIT cells were plated in 100-mm tissue culture dishes (Nunc, Kamstrupvej, Denmark). After a 24-hour preliminary incubation, the cells were incubated with copper ions (40 μmol/L or as indicated) for 0.5, 1, and 2 days.
Cell Viability Test
The viability of the cells was evaluated using a Premix WST-1 Cell Proliferation Assay System (Takara BIO, Shiga, Japan). After exposing the cells to copper ions (5, 10, 20, 30, 40, 60, or 80 μmol/L) for 0.5, 1, 2, or 3 days, the culture medium was removed and the cells were washed with phosphate-buffered saline (PBS). Fresh culture medium containing 10% of the WST-1 reagent was then added, and the cells were incubated for 2 hours. The results of the WST-1 assay were measured using a Model 680 Microplate Reader (Bio-Rad, Hercules, California).
Two-Dimensional Gel Electrophoresis Analysis
Protein samples for 2DE were prepared by extracting the protein from the cells as previously described. 15 The protein concentrations were measured by the Bradford assay (Sigma-Aldrich) with a 10-fold dilution of the protein samples with 2 mg/mL bovine serum albumin ([BSA]; Pierce Biotechnology, Inc, Rockford, Illinois) as a standard. The 2DE was performed as described previously. 18 Immobilized pH gradient (IPG) dry strips (pH 4.0-7.0, 7 cm, Bio-Rad Laboratories, Hercules, California) were equilibrated for 12 to 16 hours in 9.5 mol/L urea containing 2% 3([3-cholamidopropyl]dimethylammonio)-propanesulfonic acid and 40 mmol/L dithiothreitol (DTT) and then loaded with 200 μg of the sample. Isoelectric focusing (IEF) was performed at 20°C using a Protean IEF Cell (Bio-Rad Laboratories, Hercules, California) according to the manufacturer’s instructions. Electrophoresis was performed stepwise, with a total voltage of 68 000 V at 20°C for a total of 18 hours. Step 1: 300 V for 3 hours; step 2: 1000 V for 6 hours; step 3: 8000 V for 6 hours; and step 4: 8000 V for 6 hours. The focused IPG strips were reduced (2% DTT) and alkalized (2.5% iodoacetamide) in equilibration buffer (6 mol/L urea; 0.375 mol/L Tris–HCl, pH 8.8; 2% sodium dodecyl sulfate [SDS]; 20% glycerol) just prior to being loaded onto a 12%, 7 cm polyacrylamide gel. The strips were overlaid with 1% agarose in SDS running buffer (25 mmol/L Tris, 192 mmol/L glycine, and 0.1% SDS) and run in an Ettan DALTsix electrophoresis unit (GE Healthcare, Wauwatosa, Wisconsin) at a constant power of 3 W per gel at 15°C until the blue dye front ran off the bottom of the gels. Next, the 2DE gels were stained with Coomassie blue. Analysis of the digitized images was performed using PDQuest software (version 7.3, Bio-Rad Laboratories, Hercules, California) to quantify the spot densities. We performed 3 independent 2DE analyses and found that the gel images were similar for the individual experiments. The relative spot volume of each protein was compared with the normalized protein volume to determine the relative protein levels indicated by the individual spots.
In-Gel Digestion
The protein spots were enzymatically digested in-gel with modified porcine trypsin (Promega, Madison, Wisconsin) in a manner similar to that previously described. 19 The gel pieces were washed with 50% acetonitrile to remove the SDS and salt and then stained, dried to remove the solvent, rehydrated in a trypsin solution (8-10 ng/μL) and incubated for 8 to 10 hours at 37°C. The proteolytic reaction was terminated by the addition of 5 μL of 0.5% trifluoroacetic acid. The tryptic peptides were recovered by extraction in 50% aqueous acetonitrile, and the aqueous phase extractions from the replicate gel pieces were combined. An aliquot of this solution was mixed with an equal volume of a saturated solution of α-cyano-4-hydroxycinnamic acid in 50% aqueous acetonitrile, and 15 μL of the mixture was spotted on the target plate.
The MALDI-TOF MS Analysis and Database Search
The peptide analysis was performed using an Ultraflex MALDI-TOF MS (Bruker Daltonics, Bremen, Germany). In brief, the peptides were evaporated with an N2 laser at 337 nm using a delayed extraction approach and were accelerated with a 20 kV injection pulse for the TOF analysis. Each spectrum represents the cumulative average of 300 laser shots. The ProFound search program, developed by Rockefeller University (http://prowl.rockefeller.edu/prowl-cgi/profound.exe), was used to identify proteins by peptide mass fingerprinting. The spectra were calibrated using the trypsin autodigestion ion peak signals (m/z 842.510 and 2211.1046) as internal standards.
Pathway Network Analysis
An integrated pathway enrichment analysis was performed using the knowledge-based canonical pathways and the endogenous metabolic pathways in the MetaCore pathway analysis software (GeneGO Inc, St Joseph, Michigan). In brief, the differentially expressed proteins were mapped into biological networks with a manually curated proprietary database and pathway analysis tool known as MetaCore (GeneGo). The gene symbols for the differentially expressed proteins were uploaded into the database. For enrichment analysis, the gene IDs of the uploaded files were matched with the gene IDs from functional ontologies in MetaCore that included categories such as canonical pathway maps (GeneGo maps), GeneGo cellular processes, gene ontology (GO) cellular processes, and diseases. The canonical pathway maps represent a set of approximately 500 signaling and metabolic maps of human biology. Analyze networks, transcription regulation, and direct interactions algorithms were used to analyze the data. The analysis of network algorithms, a variant of the shortest paths algorithm, uses the relative enrichment and the relative saturation of the proteins to generate subnetworks that are prioritized by their number of canonical pathways.
Immunocytochemistry
The NCCIT cells were plated onto coverslips that were precoated with poly-
Western Blot Analysis
Extraction of total protein from the cells was performed using radioimmunoprecipitation buffer (50 mmol/L Tris–HCl, pH 7.5; 150 mmol/L NaCl; 1% [v/v] Nonidet P-40 [NP-40]; 0.5% sodium deoxycholate; 0.1% SDS and protease inhibitors). The extracted proteins were separated by SDS-polyacrylamide gel electrophoresis and transferred to polyvinylidene fluoride membranes. The membranes were incubated overnight at 4°C with either a polyclonal mouse anti-HSP70 antibody (1:1000) or a polyclonal rabbit anti-14-3-3 protein zeta antibody (1:1000) followed by incubation with horseradish peroxidase-conjugated anti-mouse or anti-rabbit IgG (1:2000). After washing with tris-buffered saline and Tween 20, the proteins were visualized with ECL Western Blotting Detection Reagents (GE Healthcare).
Statistical Analysis
The data are reported as the means ± standard error of the mean. The statistical analyses were performed using the SPSS 17.0 program (SPSS Inc, Chicago, Illinois, http://www.spss.com). The data were analyzed using 1-way analysis of variance followed by Tukey honestly significant difference post hoc test; P <.05 were considered significant.
Results
Copper Ion Cytotoxicity in NCCIT Cells
To evaluate the cytotoxic effect of copper ions on NCCIT cells, we treated the cells with different doses (5, 10, 20, 30, 40, 60, and 80 μmol/L) of copper ions for 0.5, 1, 2, and 3 days. The proliferation rates of the NCCIT cells were maintained by treating with 5 to 40 μmol/L copper ions for up to 2 days, indicating that proliferation of cells is attenuated by low concentration of copper ion; however, the copper-exposed cells exhibited increased proliferation after 3 days compared with the cells exposed for 0.5 day because the cells obtained copper tolerance (Figure 1A) Treatment with copper ion concentrations of 60 and 80 μmol/L caused the number of cells to remain static or decrease, suggesting that these concentrations may lead to cell death. As shown in Figure 1B, the morphology of the cells that were exposed to 40 μmol/L copper ions for 2 days was no different from that of the control cells. Exposure to 80 μmol/L copper ions, however, resulted in a number of dead and floating cells. Therefore, as 40 μmol/L was the concentration of copper ions that not only caused attenuation of cell growth but also contributed to cellular tolerance against cytotoxicity by copper, we adopted 40 μmol/L copper ions to analyze the proteins that respond to the copper ion-induced stress in NCCIT cells.
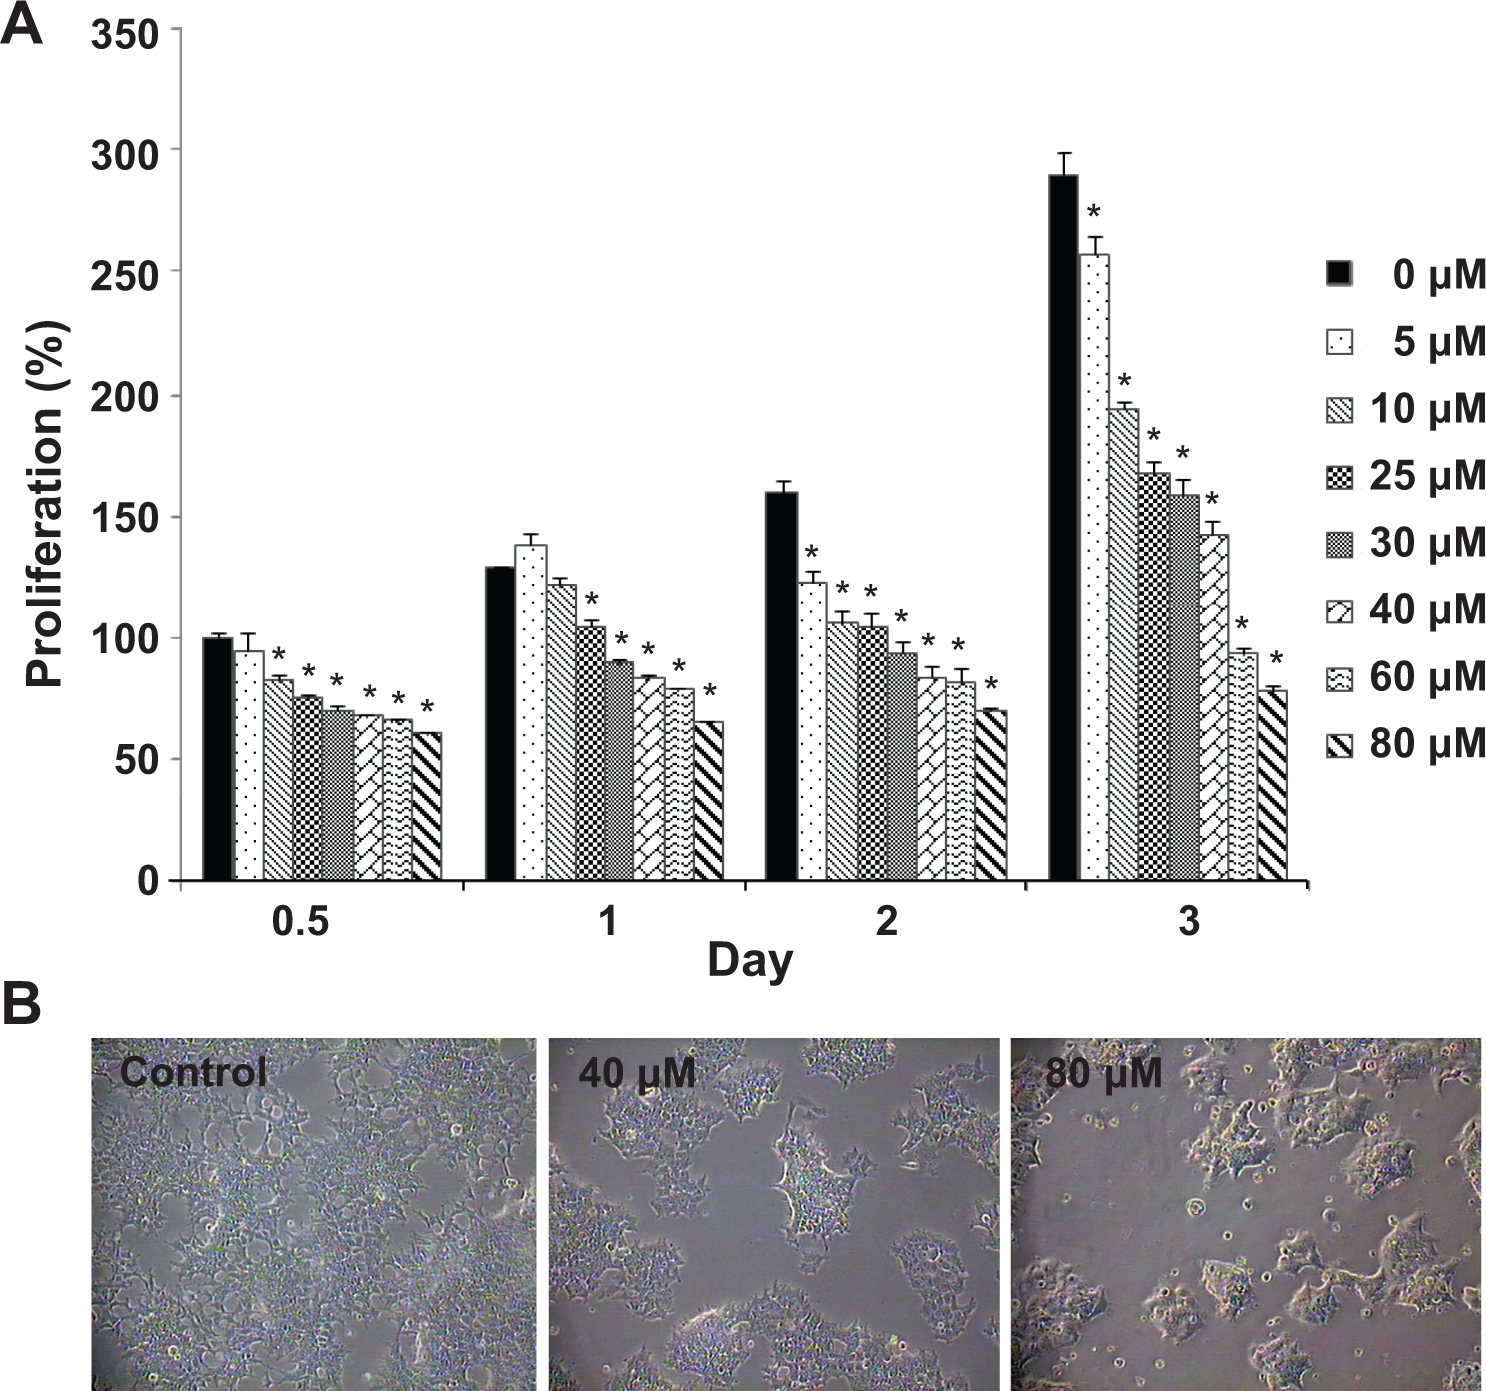
The effect of copper ions on the proliferation of human embryonic carcinoma (NCCIT) cells. The NCCIT cells were exposed to different doses of copper ions for 0.5, 1, 2, or 3 days, after which the copper ion toxicity was evaluated. A, The proliferation and the viability of the cells were measured using the WST-1 assay. Values are expressed as mean ± standard error of the mean ([SEM] n = 3). *Significantly different from 0 μmol/L by one-way analysis of variance (ANOVA), followed by Tukey honestly significant difference (HSD) post hoc test (*P < 0.05). B, The morphology of the cells after exposure to copper ions (40 and 80 μmol/L) for 2 days.
Effect of Copper Ions on Protein Levels in NCCIT Cells
We performed a 2DE assay to analyze the protein abundance profile in NCCIT cells after 40 μmol/L copper ion exposure for 2 days. Of the several hundred spots in the 2DE gel, 54 and 68 spots from the control and copper ion-treated cells, respectively, showed differential intensities (data not shown). Using the 2DE data, we identified the proteins that were up- and downregulated in the copper ion-treated cells compared with the control cells and indicated these proteins in Tables 1 and 2, respectively. Among the proteins upregulated in the presence of copper ions were dedicator of cytokinesis 8 (DOCK8), CWC22 spliceosome-associated protein (KIAA1604), oxygen-regulated protein precursor, 78 kDa glucose-regulated protein (GRP78), heat shock protein 60 (HSP60), ALDH1L1 protein, ZNF451 protein, and fibrillin 1. These proteins were upregulated more than 100-fold (Table 1). In addition, a well-known chaperone, HSP70, was upregulated 2-fold in the copper ion-treated cells. Because GRP78, HSP60, and HSP70 were upregulated in the copper ion-treated cells, we conclude that the cells may activate a stress response mechanism upon exposure to copper compounds.
A Summary of the Proteins Found to be Upregulated in the Copper Ion-Treated NCCIT Cells Compared With the Control Cells a
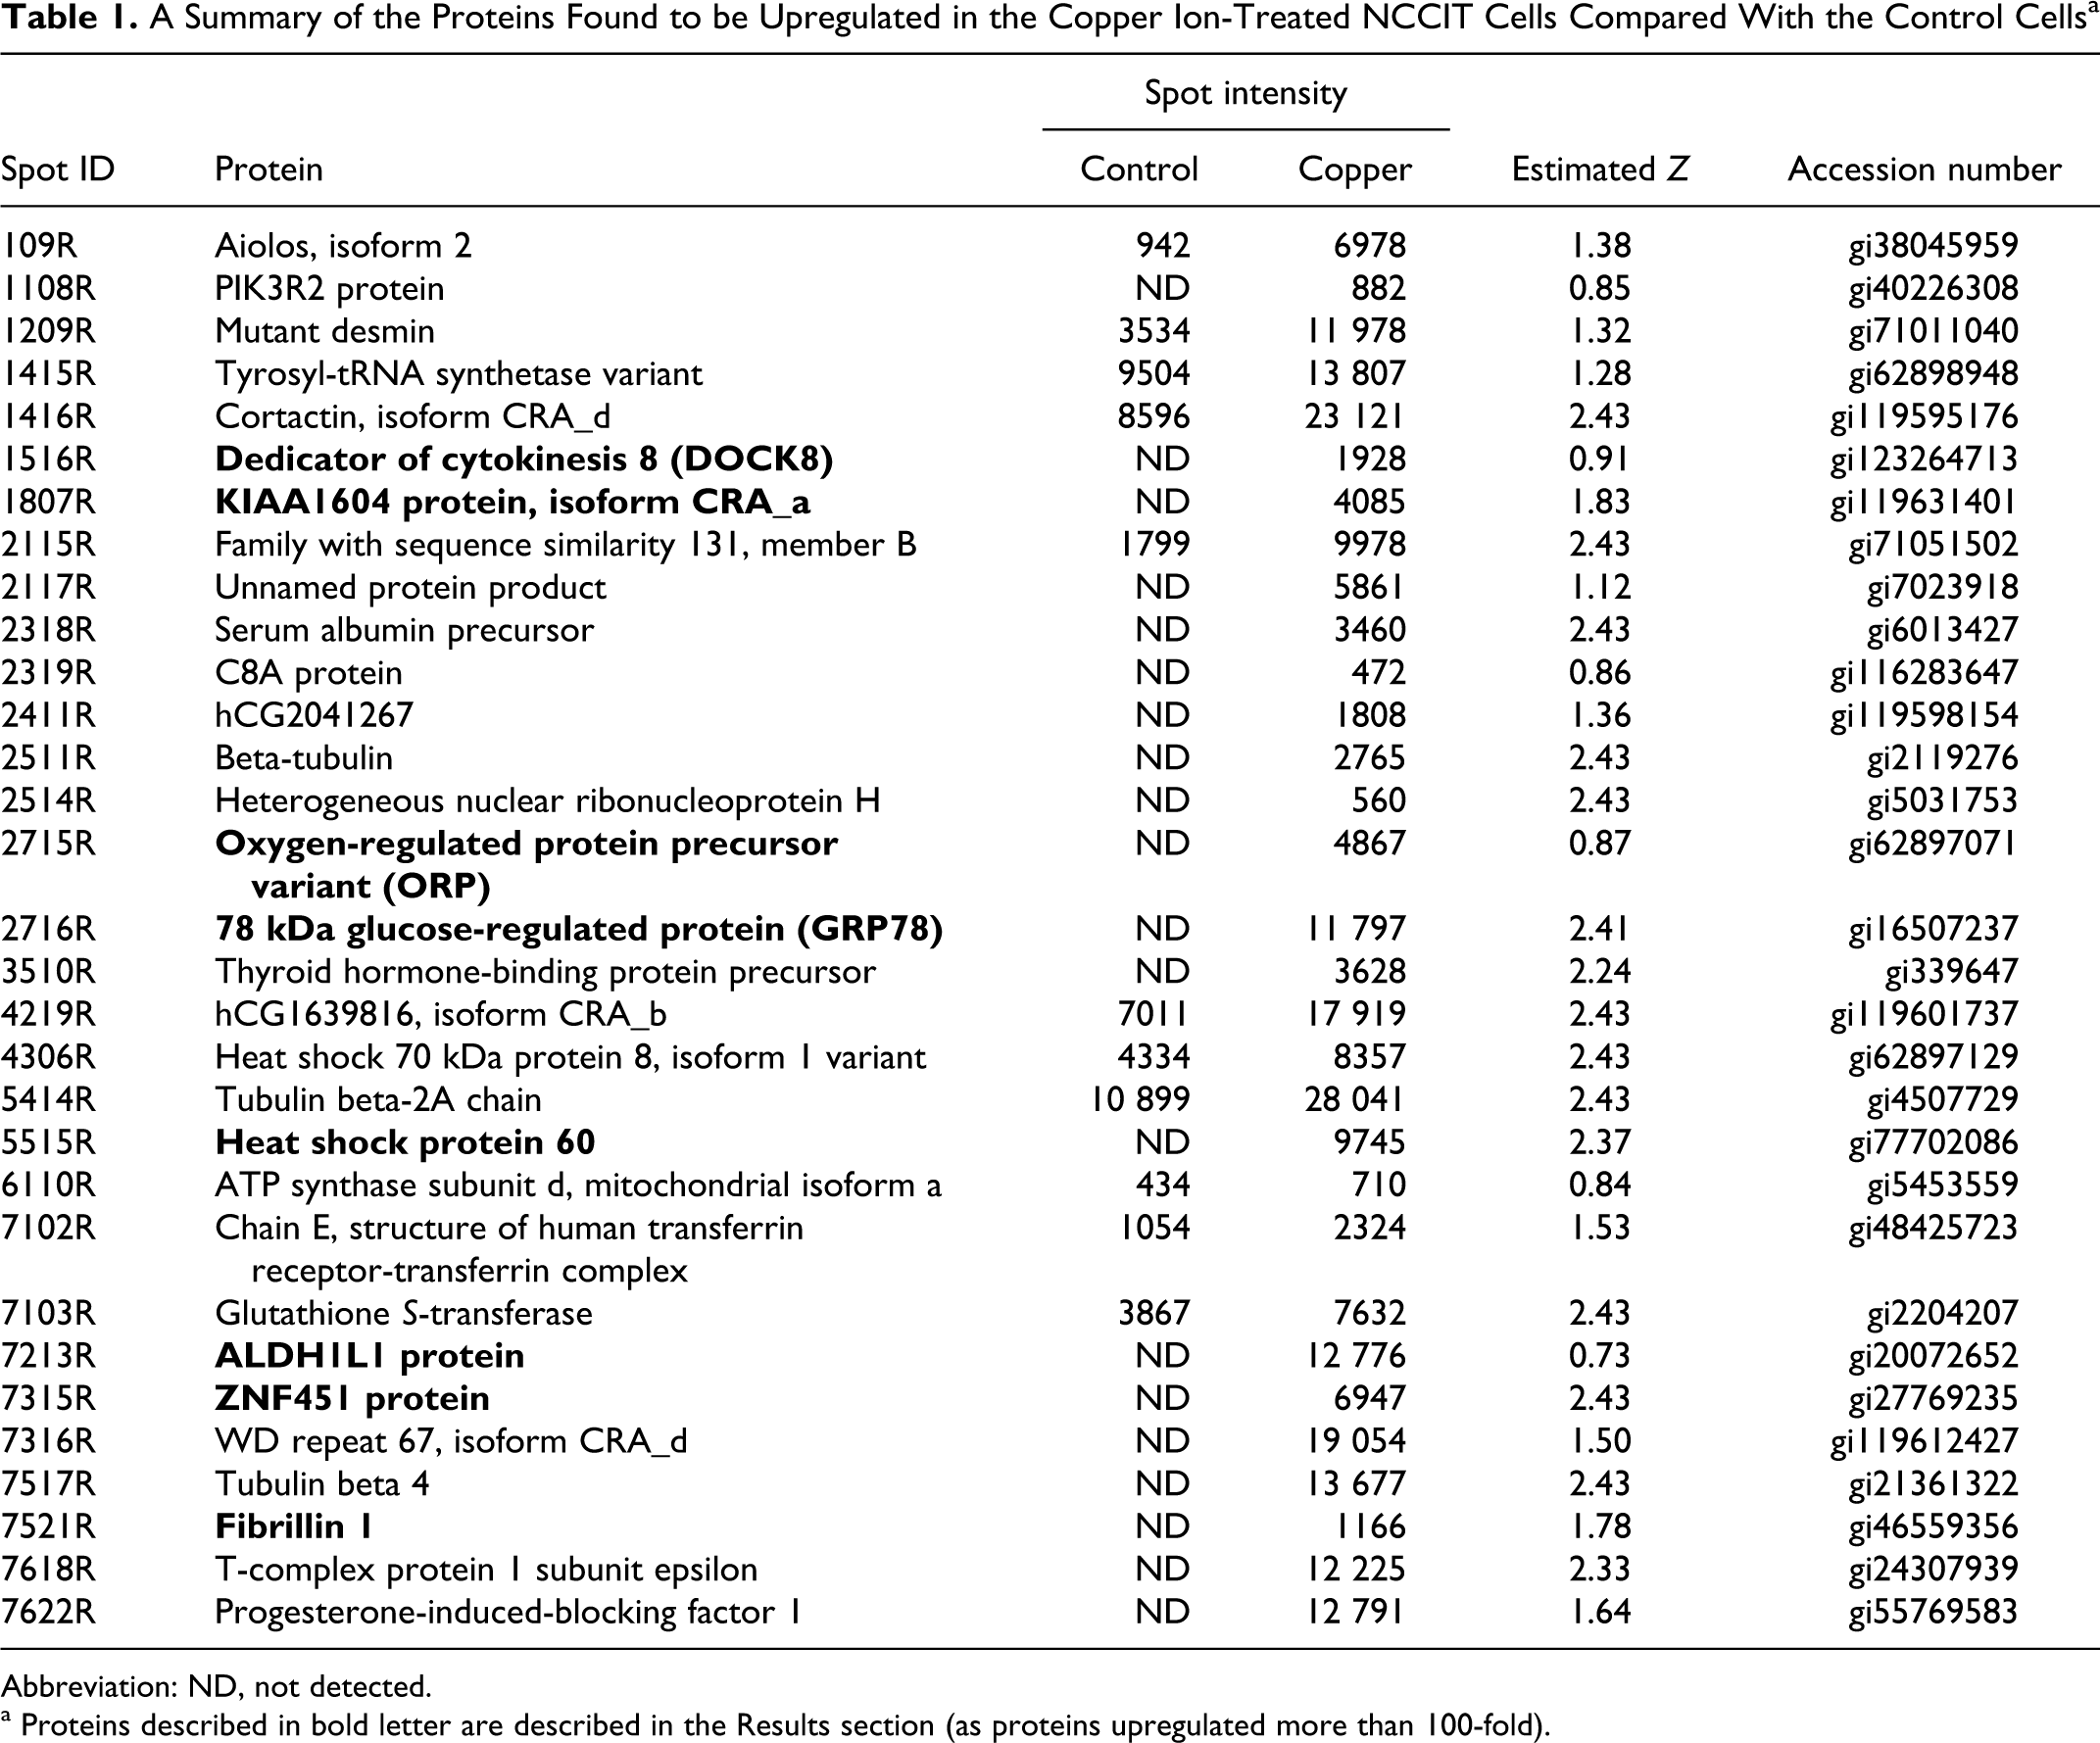
Abbreviation: ND, not detected.
a Proteins described in bold letter are described in the Results section (as proteins upregulated more than 100-fold).
A Summary of the Proteins Found to be Downregulated in the Copper Ion-Treated NCCIT Cells Compared With the Control Cells a
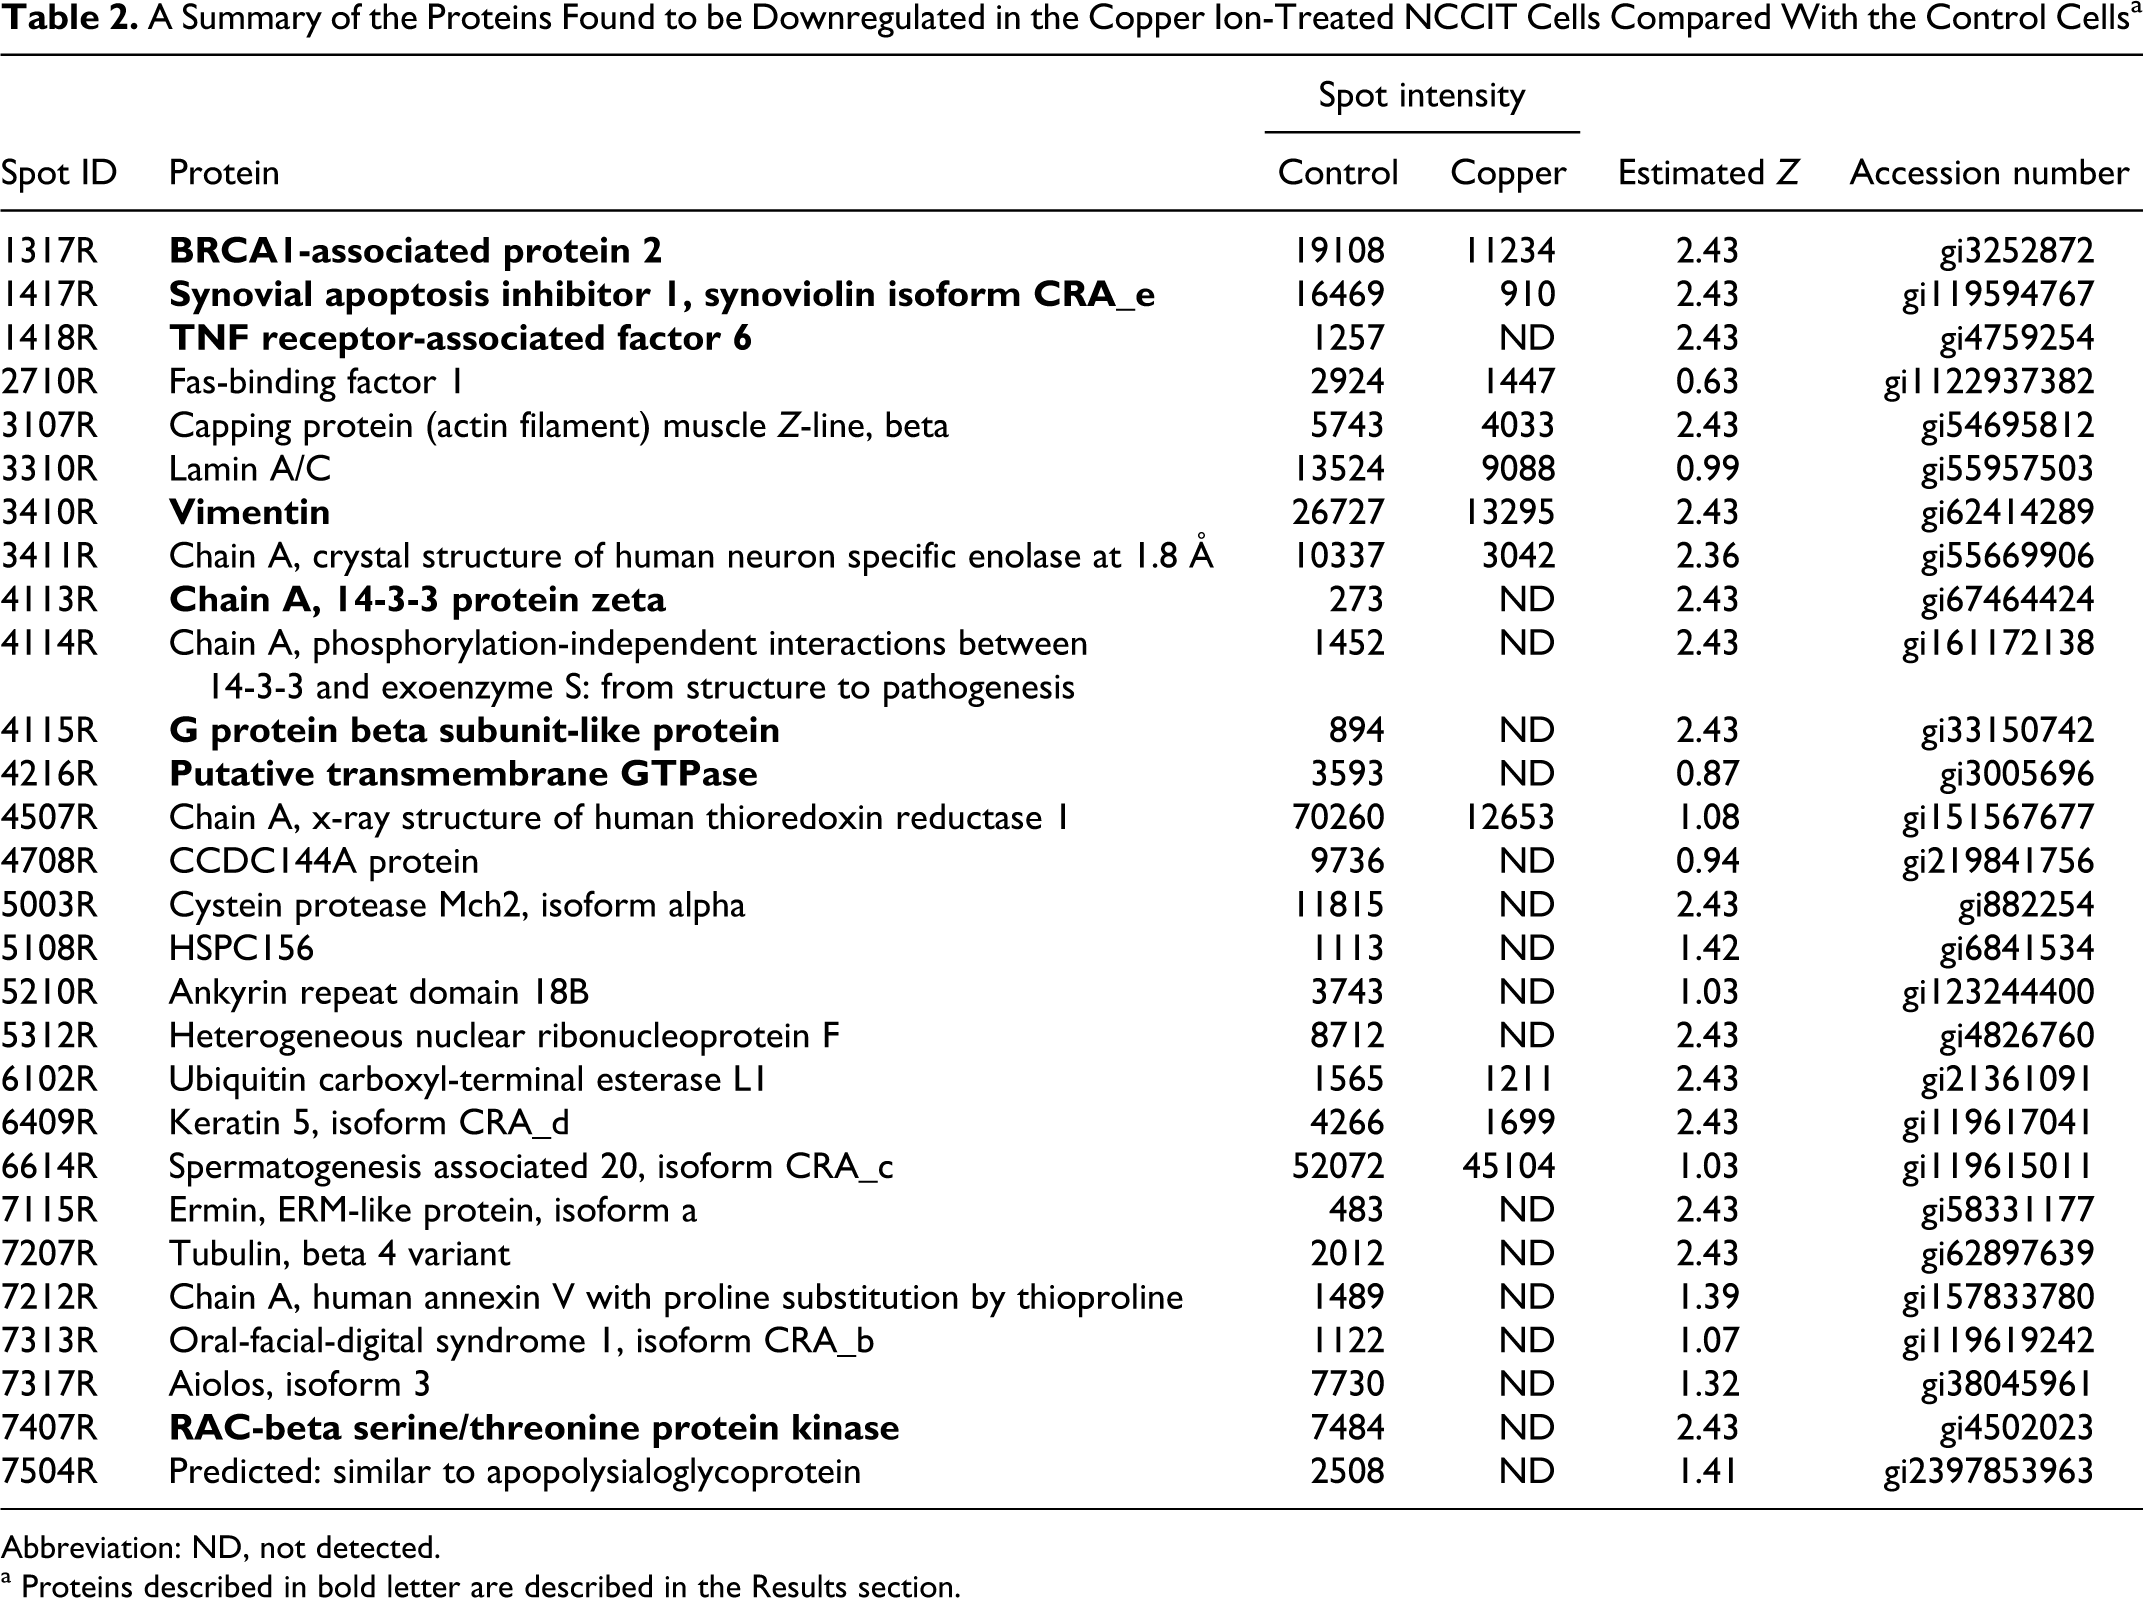
Abbreviation: ND, not detected.
a Proteins described in bold letter are described in the Results section.
Proteins downregulated following copper ion exposure included breast cancer 1 (BRCA1)-associated protein 2, synovial apoptosis inhibitor 1 (synoviolin isoform CRA_e), tumor necrosis factor (TNF) receptor-associated factor 6, vimentin, 14-3-3 protein zeta, G protein beta-subunit-like protein, a putative transmembrane guanine triphosphatase (GTPase), and RAC-beta (AKT2) serine/threonine protein kinase (Table 2).
Identification of the Potential Network of Proteins Regulated by Copper Ions
We used the MetaCore pathway analysis software (GeneGo Inc) to identify the GeneGo Process Networks for the proteins that were upregulated by exposure to copper ions. The MetaCore database is suitable for a manually curated data set and includes an interaction database that contains >90% of human proteins with known functions. 20 We identified the highest-scoring networks that were common to both the control and copper ion-treated NCCIT cells through comparative analysis of the cell types. The 3 highest-scoring networks are displayed in Figure 2. The highest-scoring network included GRP78, HSP60, fibrillin 1, zinc finger protein 239 (ZNF239), v-akt murine thymoma vial oncogene homolog 2 (AKT2) and TNF receptor-associated factor 6 (TRAF6), which were all regulated by exposure to copper ions (Figure 2A). The second highest-scoring network included Aiolos, p53, AKT (PKB), Caspase-6 and syntaxin binding protein 6 (STXBP6), which were also regulated by copper ion exposure (Figure 2B). The third highest-scoring network included SERPINB9, Desmin, synovial apoptosis inhibitor 1 (SYVN1), surfactant protein A1 (SP-A), SMT3 suppressor of mif two 3 (SUMO-3), which are involved in mechanisms that are regulated by copper ions (Figure 2C).
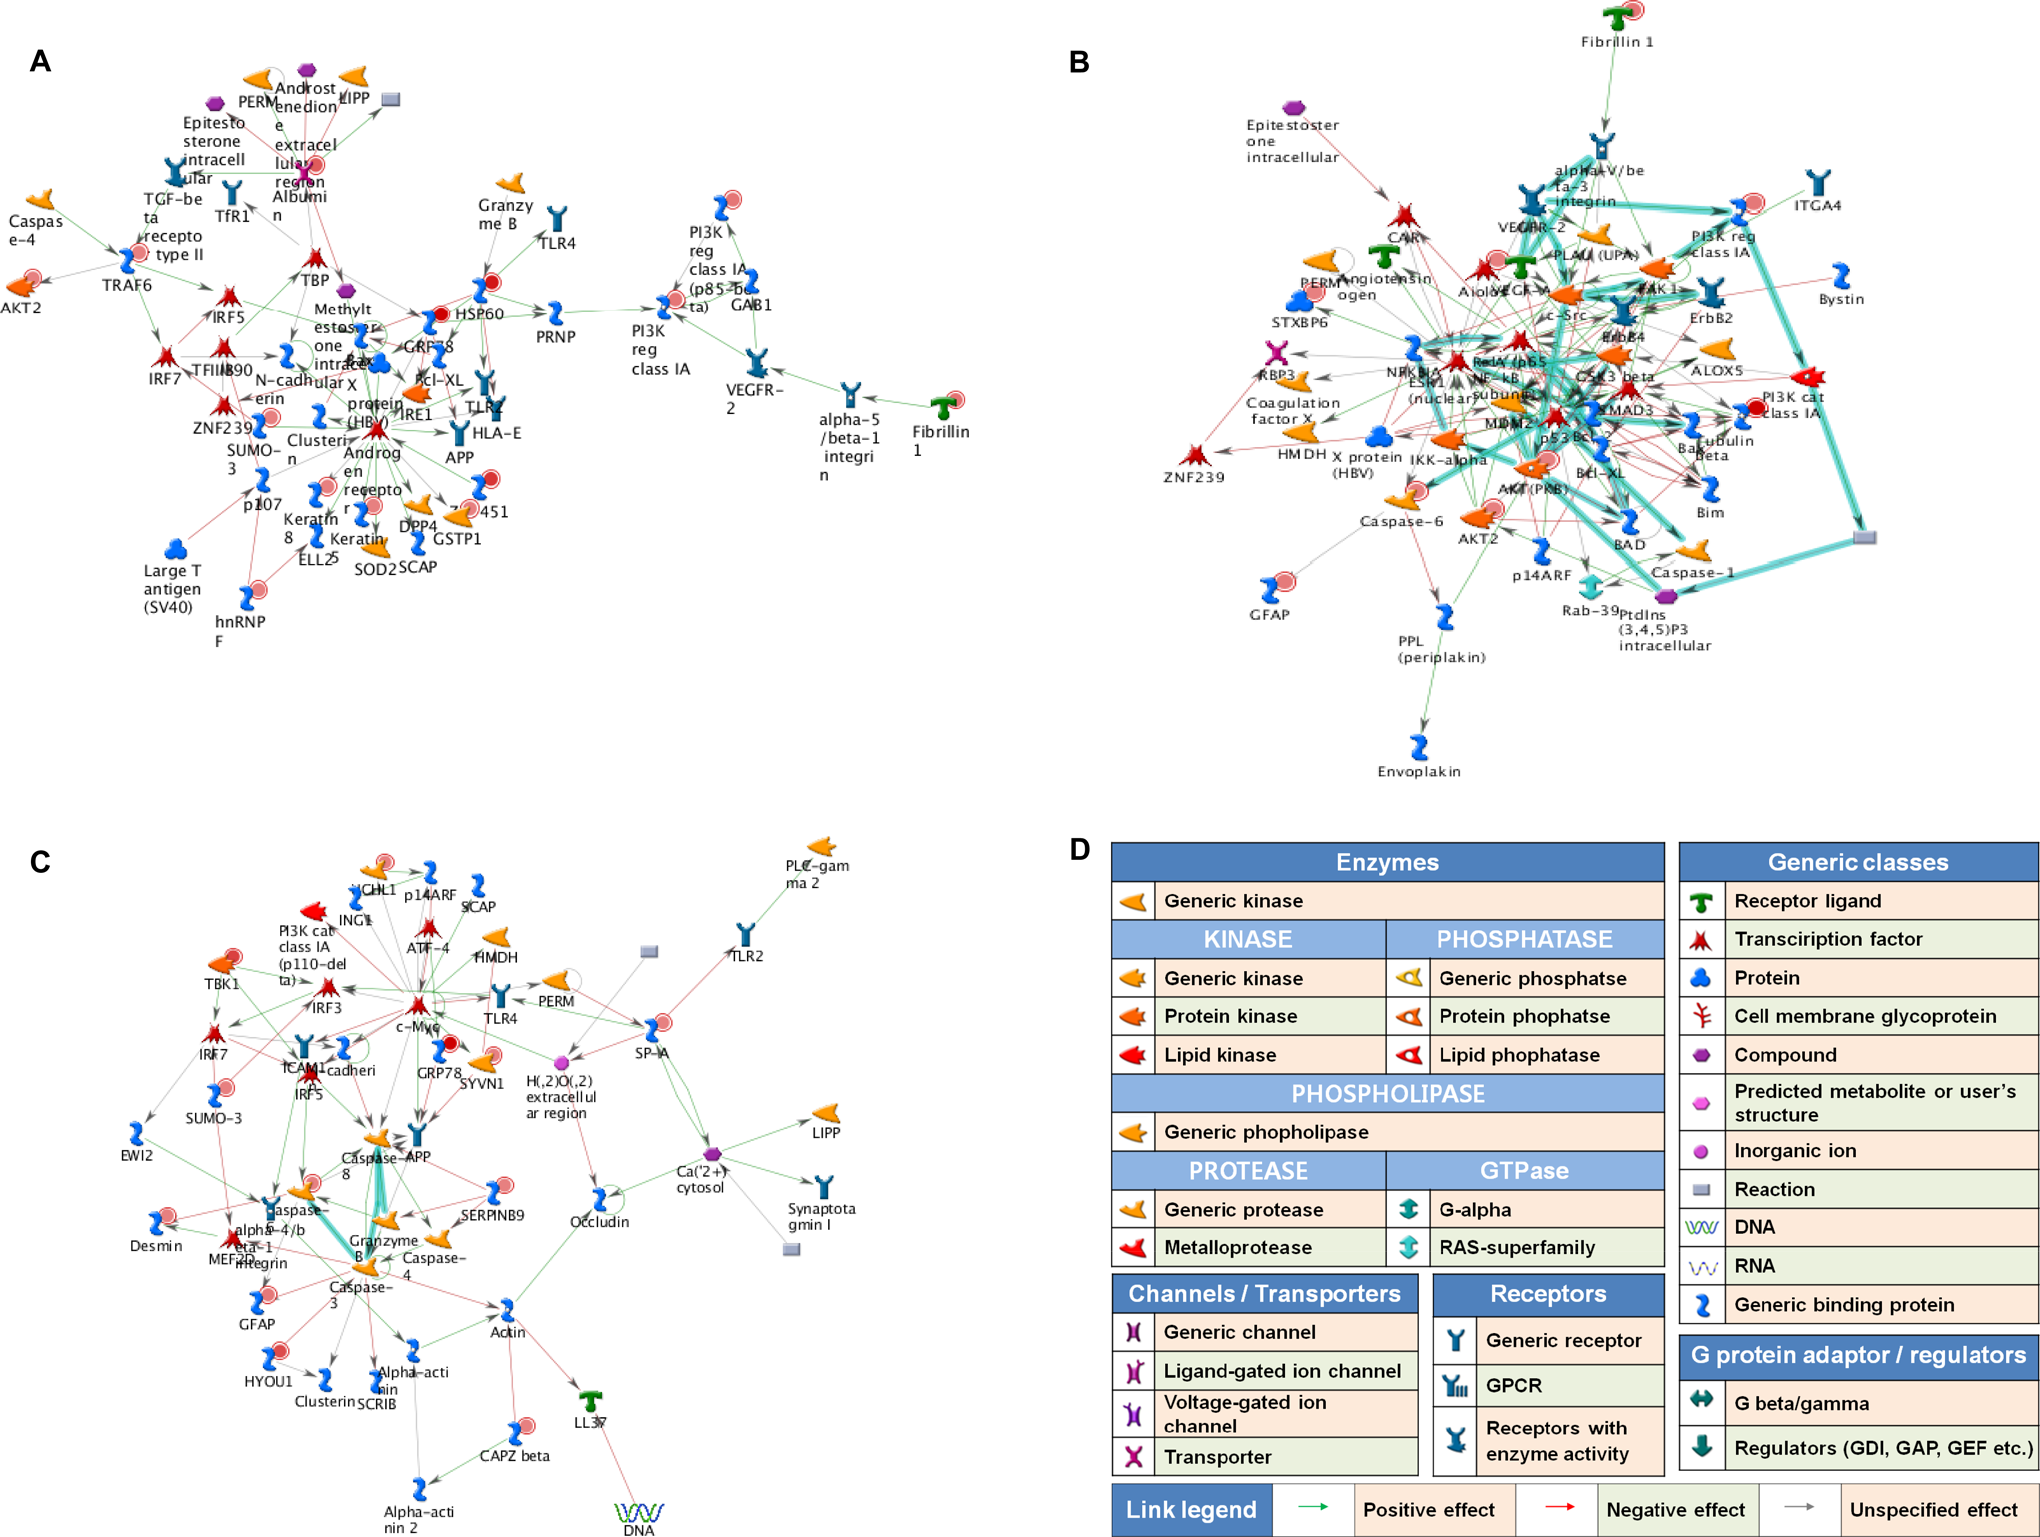
The 3 highest-scoring networks for regulation by copper ions. After exposing human embryonic carcinoma (NCCIT) cells to copper ions (40 μmol/L) for 2 days, the upregulated proteins were analyzed to identify networks using the analyze networks algorithm implemented in MetaCore. The highest (A), second highest (B), and third highest (C) scoring networks are shown. D, All network legends. Thick cyan lines indicate fragments of canonical pathways. Upregulated proteins are marked with red circles.
Effect of Copper Ions on the Abundance of HSP70 and 14-3-3 Protein Zeta
Following exposure of NCCIT cells to 40 μmol/L copper ions, we measured the levels of HSP70 and 14-3-3 protein zeta using immunocytochemistry and Western blot analysis. The level of HSP70 was higher in the cells treated with copper ions for 2 days compared with the control cells (Figures 3A and 4A), consistent with the 2DE data (Table 1). However, when we measured the protein levels of HSP70 with a time course following copper ion treatment (0.5, 1, 2, and 3 days), we found that the level of HSP70 was the highest at day 0.5 and then continuously decreased through day 3 (Figure 4A). This suggests that HSP70 is transiently upregulated soon after exposure to copper ions. In addition, when we measured the HSP70 protein levels after treatment with different concentrations of copper ions (0, 10, 20, 30, 40, 60, and 80 μmol/L), the amount of HSP70 increased in a dose-dependent manner (Figure 4B).
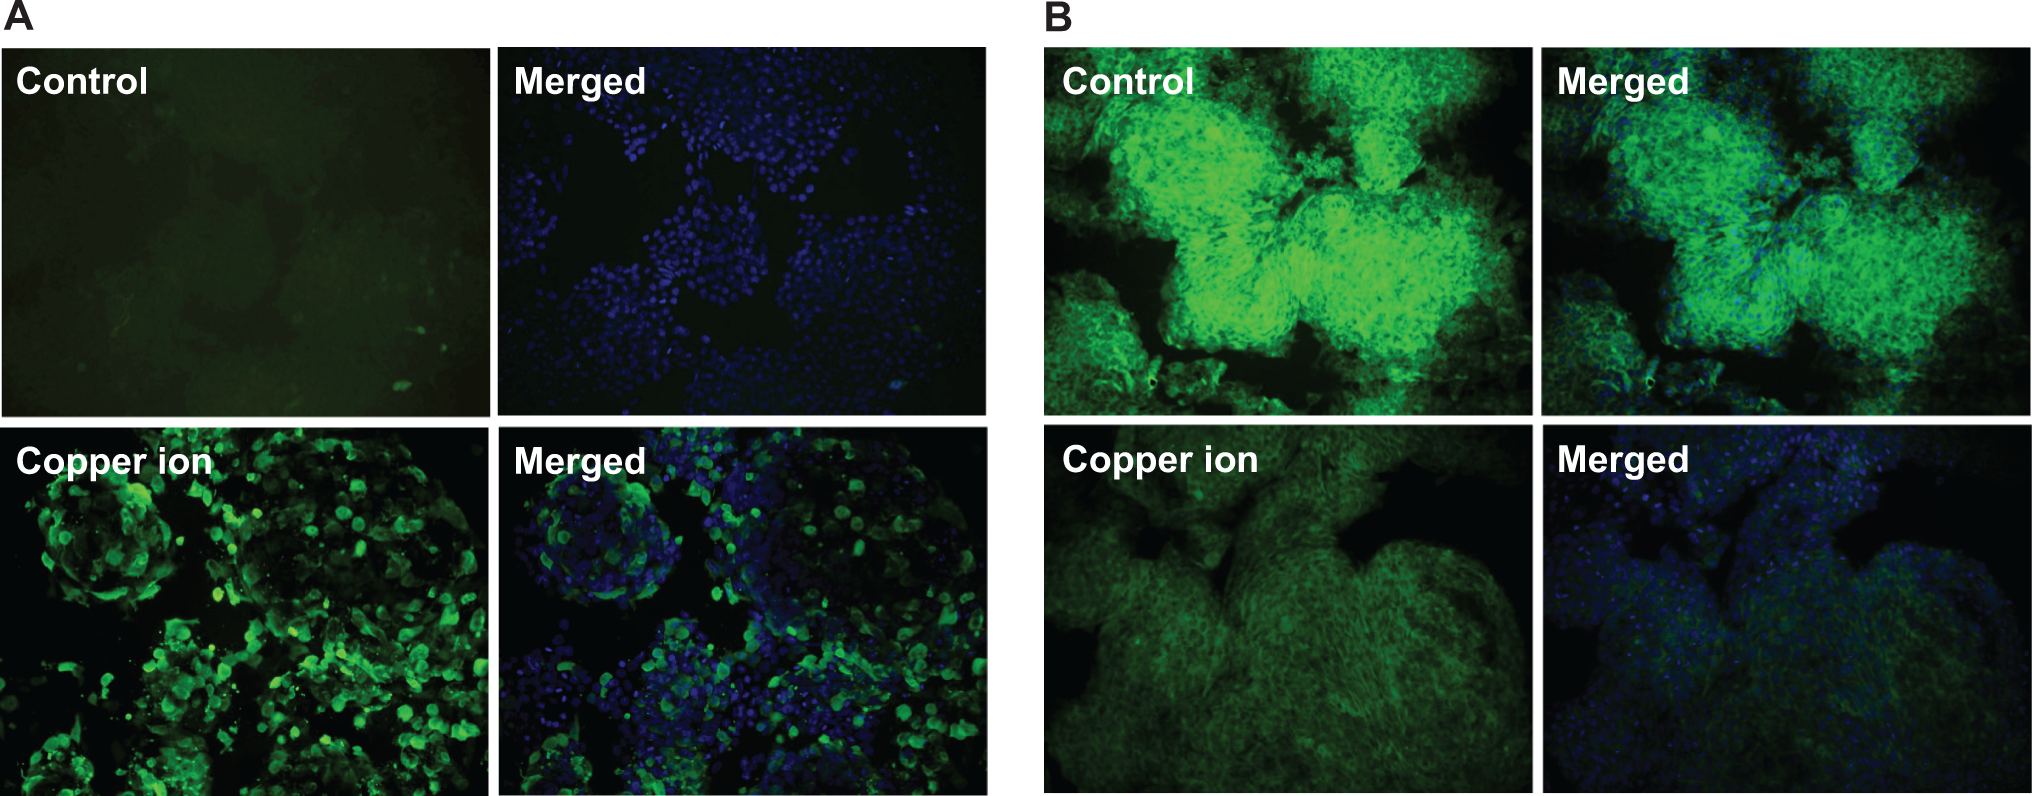
The protein localization of heat shock protein (HSP)70 and 14-3-3 protein zeta in human embryonic carcinoma (NCCIT) cells after exposure to copper ion. The NCCIT cells were treated with 40 μmol/L copper ions for 2 days. After fixation, the cells were incubated with either a polyclonal mouse anti-HSP70 or a polyclonal rabbit anti-14-3-3 protein zeta antibody. A, Protein localization of HSP70 in control and copper ion-treated cells after 2 days of culture. B, Protein localization of 14-3-3 protein zeta in control and copper ion-treated cells cultured for 2 days. Images are shown at ×100 magnification.
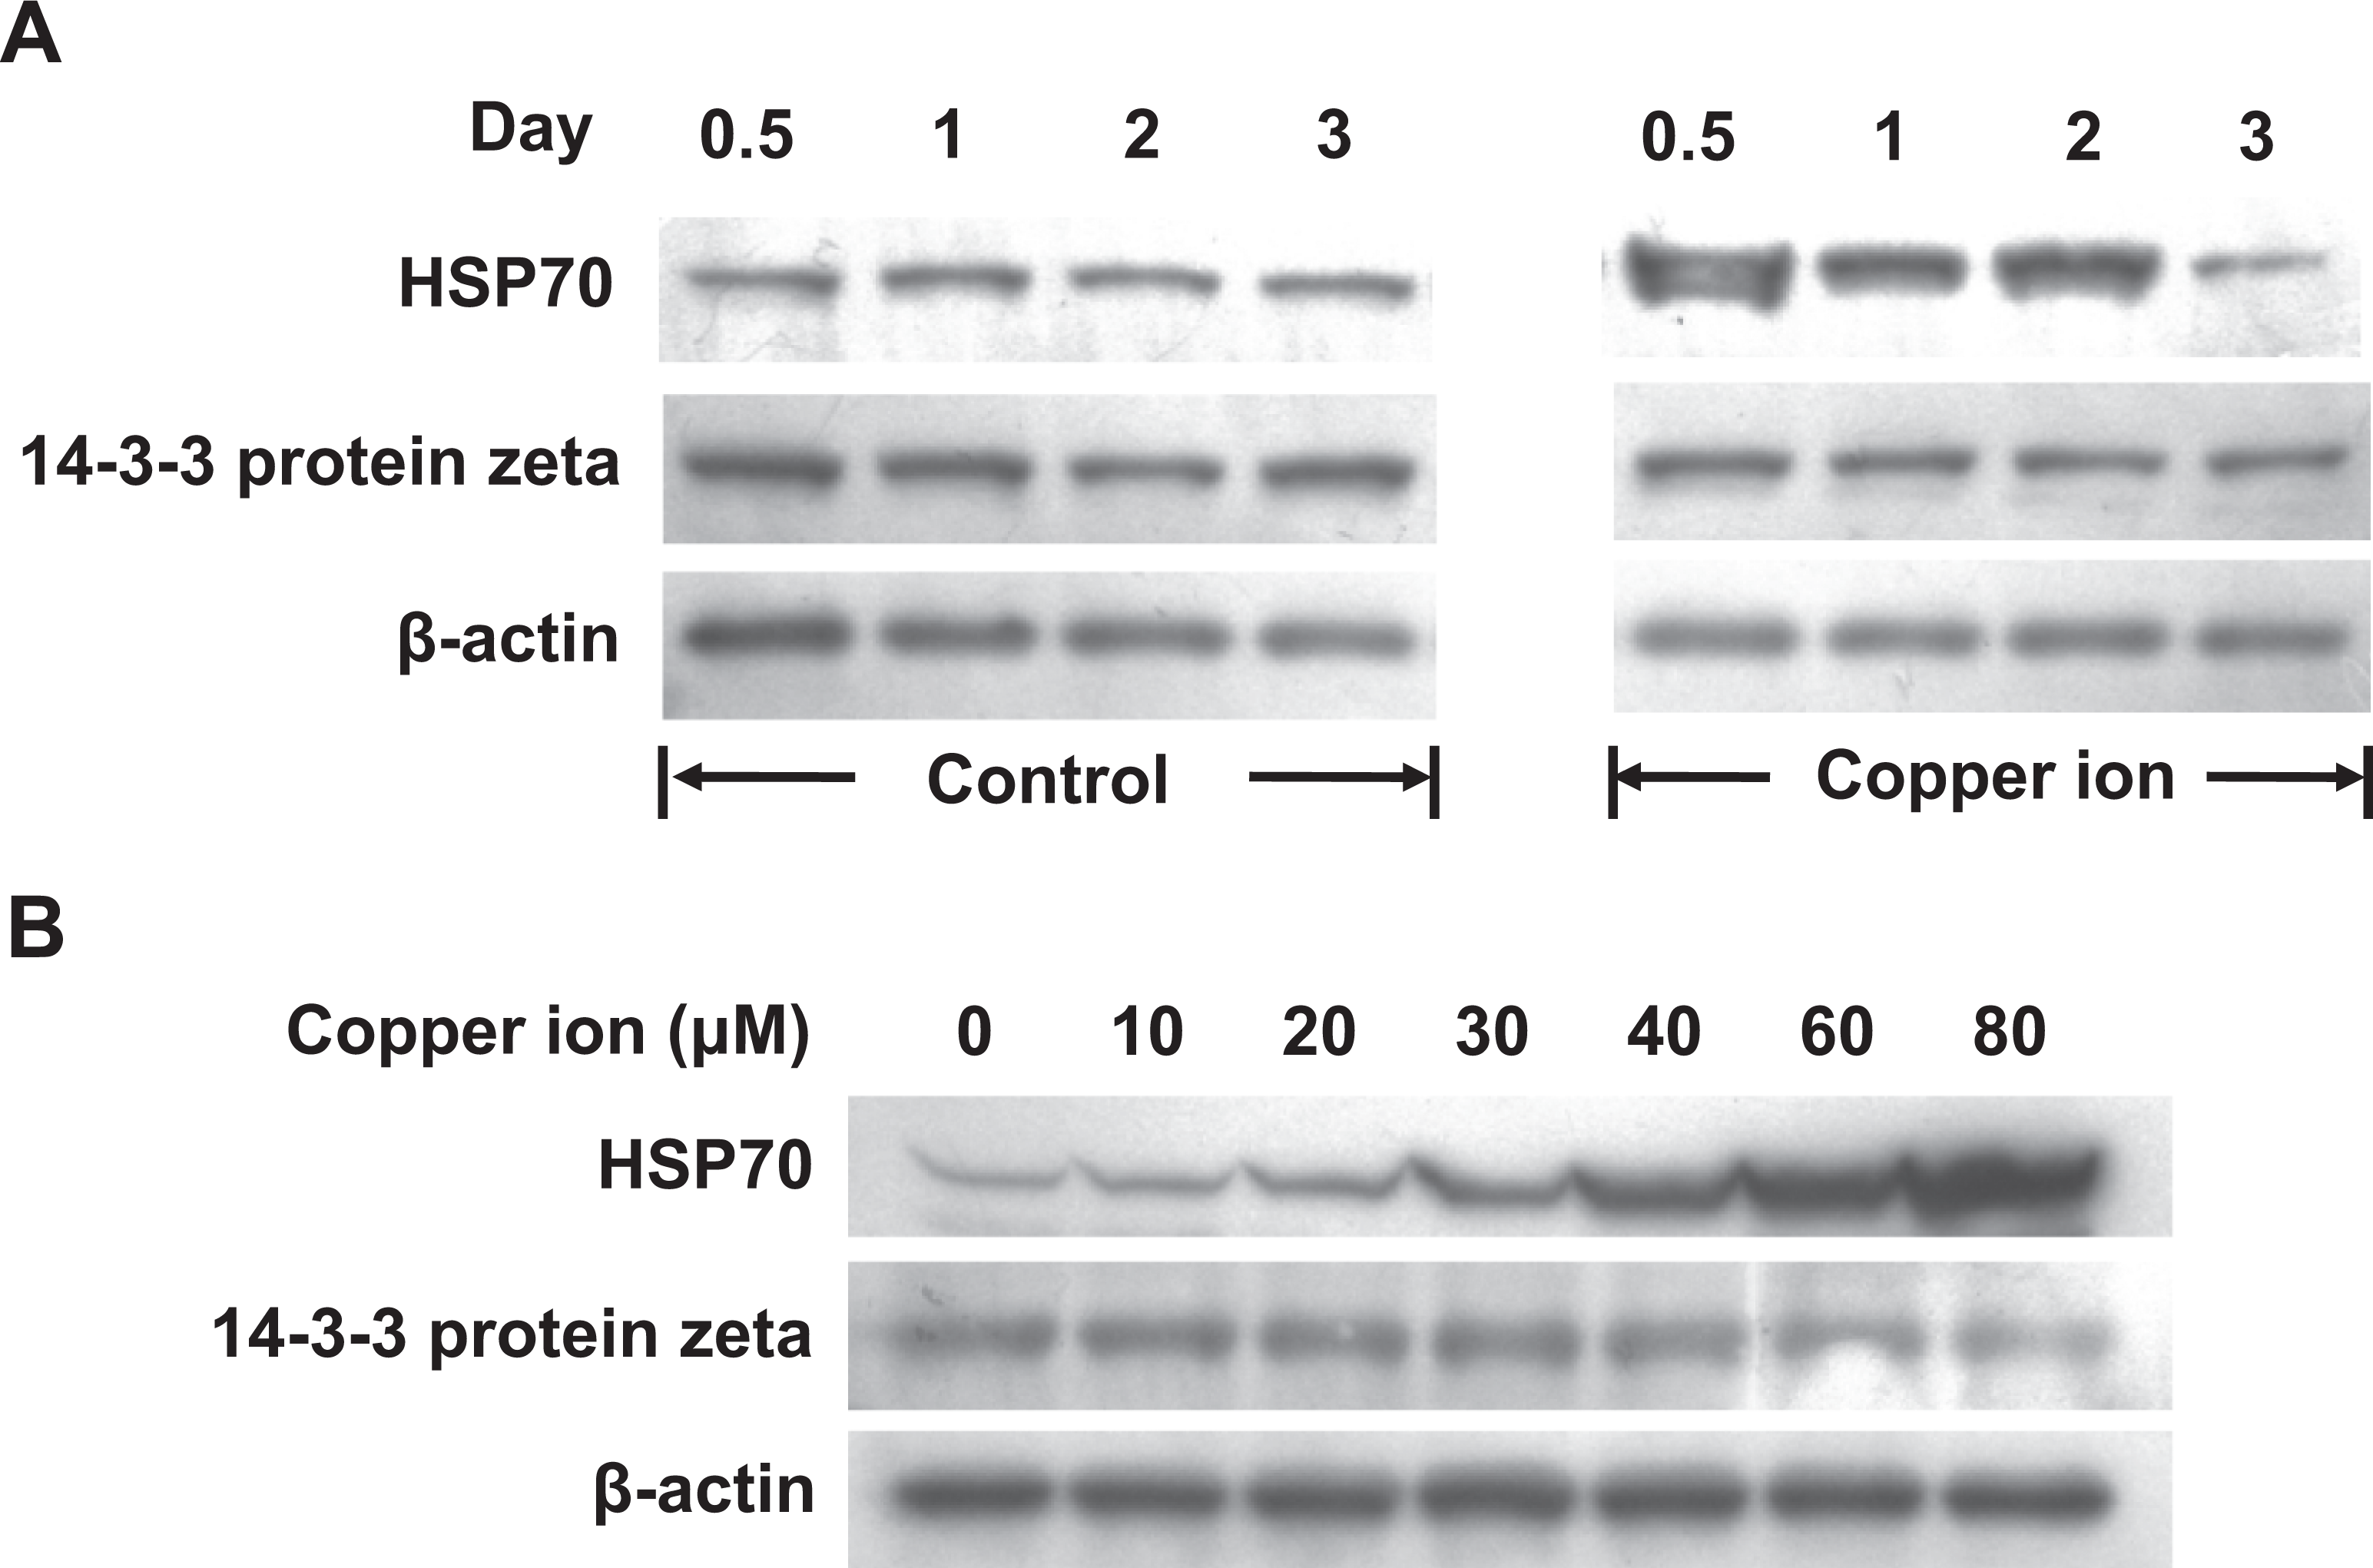
The effect of copper ions on the protein levels of heat shock protein (HSP) 70 and 14-3-3 protein zeta in human embryonic carcinoma (NCCIT) cells. After exposing NCCIT cells to copper ions for different times (0.5, 1, 2, and 3 days) or at different doses (0, 5, 10, 20, 30, 40, 60, and 80 μmol/L), the protein levels of HSP70 and 14-3-3 protein zeta were measured by western blot. β-Actin was used as an internal control. A, Protein levels of HSP70 and 14-3-3 protein zeta in control and 40 μmol/L copper ion-treated cells cultured for 0.5, 1, 2, and 3 days. B, Protein levels of HSP70 and 14-3-3 protein zeta in control and copper ion (5, 10, 20, 30, 40, 60, and 80 μmol/L)-treated cells cultured for 2 days.
The level of 14-3-3 protein zeta was lower in the cells treated with copper ions for 2 days compared with the control cells (Figure 3B); this result was consistent with the 2DE data (Table 2). After treatment with copper ions for different lengths of time (0.5, 1, 2, and 3 days), the level of 14-3-3 protein zeta gradually decreased over time (Figure 4A). We also evaluated the amounts of 14-3-3 protein zeta in response to different doses of copper ions. The amount of 14-3-3 protein zeta decreased as the copper ion concentration was increased from 40 to 80 μmol/L (Figure 4B).
Discussion
Excessive exposure of cells to copper induces cellular damage, including direct damage to proteins, lipids, and DNA, which results in the destruction of cellular copper homeostasis. 1 Cellular copper homeostasis is associated with proteins called copper chaperones. 2 Disruption of this homeostasis can inhibit adaptive response of these chaperones to environmental, physiological, or pathological conditions. Due to the importance of copper homeostasis, it is important for a cell to regulate the coordinated network of copper-regulating proteins and the level of copper in the cell to inhibit copper toxicity. Identifying novel candidate proteins associated with copper homeostasis is important for researchers to better understand how copper homeostasis is maintained. Therefore, to identify the proteins that are associated with copper toxicity in stem cells, we used proteomic techniques to identify proteins that were up- and downregulated by copper in NCCIT cells.
We observed that exposure to 40 μmol/L copper ions decreased the rate of NCCIT cell growth by approximately 2-fold compared with the control conditions, while the cell morphologies of the control and copper ion-treated cells showed no differences, indicating that 40 μmol/L copper ions in the cells caused the attenuation of cell growth. Therefore, based on the result of copper ion cytotoxicity test, identifying the type of proteins that are associated with copper toxicity in embryonic stem cells is valuable.
We found that exposure to copper ions resulted in the upregulation of DOCK8 and fibrillin 1. The DOCK8 is located at the chromosomal locus 9p24, and the functional characterization of the protein has been minimal. 21,22 Ruusala and Aspenstrom 21 demonstrated that DOCK8 interacts with CDC42, a small GTPase of the Rho-subfamily, and is localized at cell edges in areas that are undergoing lamellipodia formation, suggesting that DOCK8 plays a potential role in the organization of filamentous actin. Takahashi et al 22 showed that the level of DOCK8 in lung cancer cell lines was increased by treatment with trichostatin A, which inhibits the eukaryotic cell cycle at the beginning of the growth stage. This finding shows that the level of DOCK8 is inversely proportional to the rate of cell proliferation, which is consistent with our result in which the cell proliferation rate decreased as DOCK8 levels increased. Fibrillin 1 belongs to the fibrillin family of glycoproteins, which forms the structural framework for extracellular microfibrils. 23 Based on the increase in fibrillin 1 following exposure to copper ion treatment noted in our study, it is likely that exposure to 40 μmol/L copper ions causes the structural alteration in the cells, even though the cellular morphology at the same concentration was not different from that of the control cells.
We noted the upregulation of HSPs, such as HSP60 and HSP70, in NCCIT cells following copper ion exposure. The HSPs, which are known chaperone proteins, play a vital role in the transport, folding, and assembly of proteins and are induced under abnormal conditions by various casual agents, such as metals, and oxidative stress. 24 The HSP60 and HSP70 families regulate protein homeostasis via the stabilization and refolding of damaged proteins and target misfolded proteins to specific degradation pathways. 25 In this study, HSP60 was nearly undetectable in the 2DE prior to copper ion exposure and drastically increased by more than 9000-fold following copper ion exposure, indicating that the cells were in a very stressful condition. Previous studies have reported that the expression of HSP60 is regulated in response to copper ion treatment. 26,27 In a study by Kammenga et al, 27 copper ion exposure in the nematode Plectus acuminatus caused an upregulation of HSP60, indicating that HSP60 may be a potential biomarker for toxic stress, including exposure to high levels of copper. In contrast, Chairi et al 26 demonstrated that 2 of 3 types of flatfish showed a decrease in HSP60 6 days after treatment with copper ions, despite high and cumulative levels of genotoxicity throughout the 6 days in all 3 types of flatfish. Their findings suggest that metallothionein provides an acquired tolerance to stress and protection against copper as opposed to an HSP-mediated protection system in 2 types of flatfish. However, upon exposure to stress agents, cells typically upregulate the majority of HSPs prior to acquiring a tolerance for the stress agent. Our study showed that HSP60 was upregulated 2 days after the cells were exposed to copper ions. Based on these findings, we suggest that the reduction in the copper ion treatment time in the study by Chairi et al 26 may have altered the HSP60 expression pattern.
We also saw an increase in the HSP70 levels in cells that were treated with 40 μmol/L copper ions for 2 days relative to the control cells. The copper ion-induced expression of HSP70 was highest at day 0.5; after that the level of HSP70 decreased as a function of time, indicating that the level of HSP70 was acutely increased following the exposure to copper ion to protect the cell against copper toxicity. Furthermore, treatment with various concentrations of copper ions (0, 10, 20, 30, 40, 60, and 80 μmol/L) for 2 days caused an increase in HSP70 levels in a dose-dependent manner. Interestingly, although treatment with 80 μmol/L copper caused growth arrest and the death of NCCIT cells, the amount of HSP70 was greatest at this concentration. Other studies have also reported an increase in HSP70 in response to copper ion exposure in a variety of human tissue-derived cell lines. 15,28 –30 In a previous study, 29 copper ion exposure for 1 day caused an increase in the expression of HSP70 in macrophages (human monocytic cell line, THP-1). Furthermore, human lung epithelial cells (A459) exposed to copper oxide nanoparticles for 1 day exhibited higher levels of HSP70 than the control cells. 28 Even human liver carcinoma (HepG2) cells showed an increase in the expression of HSP70 and other stress-induced genes (c-fos, p53, and GADD153) 2 days after copper oxide nanoparticle exposure. The transport system used to move copper ions from the extracellular region to the intracellular one in human cells is unique, and free intracellular copper ions are able to bind, unfold, or crosslink intracellular proteins, resulting in their loss of function and the production of damaged proteins. 2 Therefore, the upregulation of HSP70 in human tissue-derived cells in response to copper ion exposure implies that HSP70 is very important for regulating copper homeostasis in human cells and could be a potential biomarker for copper toxicity.
In this study, we identified and described the 3 highest-scoring networks that were associated with exposure to copper ions by analyzing the proteins that are upregulated in response to treatment with copper ions. This network analysis can provide primary information regarding the physical connectivity and functional relationships among the proteins that are upregulated by copper.
We observed that 14-3-3 protein zeta was decreased in NCCIT cells 2 days after exposure to 40 μmol/L copper ions. Furthermore, when we investigated the abundant change in 14-3-3 protein zeta in response to different doses of copper ions, the amount of 14-3-3 protein zeta was found to continually decrease as the copper ion concentration increased from 40 to 80 μmol/L. This suggests that at 40 μmol/L, copper ions begin to affect the amount of 14-3-3 protein zeta in the cells. The 14-3-3 proteins, a family of highly conserved, acidic proteins, are expressed in all eukaryotic cells and control enzymatic activity, the subcellular localization of proteins and protein–protein interactions involved in various cellular functions, including nutrient sensing, the cell cycle, and apoptosis.
31
,32
To date, 7 isoforms (beta, epsilon, eta, gamma, tau, zeta, and sigma) of the 14-3-3 proteins have been identified in mammals. A previous study
33
demonstrated that a decrease in 14-3-3 protein zeta not only activates the endoplasmic reticulum stress response to kainic acid but also causes selective cell death in mouse hippocampal cultures, suggesting that the reduced levels of 14-3-3 protein zeta increases a cell’s vulnerability to excitotoxicity. N-methyl-
In conclusion, we identified proteins that are up- and downregulated in NCCIT cells upon copper stress. The HSPs, including HSP60 and HSP70, were upregulated by the exposure to copper ions, while 14-3-3 protein zeta was downregulated. Our findings suggest that HSP70 is a potential biomarker for copper toxicity in embryonic stem cells or embryonic carcinoma cells such as NCCIT cells.
Footnotes
Acknowledgments
We thank Professor Adam Turner for kindly reviewing our article.
Dal Mu Ri Han and Mi Ran Choi contributed equally to this work.
Declaration of Conflicting Interests
The authors declared no potential conflicts of interests with respect to the authorship and/or publication of this article.
Funding
The authors disclosed receipt of the following financial support for the research, authorship, and/or publication of this article: the National Research Foundation of Korea Grant funded by the Korean Government (No. 2011-0030768) and a grant of the Korean Health Technology R&D Project, Ministry for Health, Welfare & Family Affairs, Republic of Korea (A101712).