
Abstract
We sought to explore the mechanism by which kolaviron (Kol) protects against atrazine (ATZ)-induced toxicity of cultured interstitial Leydig cells (ILCs). In our experiments, treatment with Kol improved Leydig cell viability and significantly reduced malondialdehyde (MDA) and reactive oxygen species (ROS) levels. Further investigations revealed a reduction in glutathione peroxidase (GSH-Px), glutathione reductase (GR), glutathione-S-transferase (GST) and elevation of superoxide dismutase 1 (SOD-1) and superoxide dismutase 2 (SOD-2) as measured by messenger RNA (mRNA) expression. Additionally, the ATZ-induced alterations in the mRNA transcript copy numbers of steroidogenesis genes: steroidogenic acute regulatory protein (StAR), cytochrome P450 side-chain cleavage enzyme (CYP11A1), and 3β-hydroxysteroid dehydrogenase (3β-HSD) were shifted toward the control values by Kol. Taken together, these findings indicate that Kol protects ILCs from ATZ-induced toxicity via the reduction in ROS and MDA levels and induce normalization of mRNA levels of all the tested genes.
Introduction
Garcinia kola Heckel (Guttiferae) is a largely cultivated tree and highly valued in west and central Africa for its edible nuts. The nut, commonly known, as “bitter kola” is eaten by many and it is a major kola substitute offered to guests at home and shared at social ceremonies in many parts of Nigeria. Garcinia kola has been found to be useful in traditional medicine for prophylaxis and cure of diseases throughout west and central Africa. The seeds have been used for the treatment of catarrh, pains, laryngitis, liver disorders, cough, and hoarseness of voice. 1 Kol (Figure 1) is the most predominant biflavanones found in G kola. 1 Kol have been reported to have various bioactivities such as antihepatotoxic, antinephrotoxic, and antimicrobial. 2 Some of our previous studies have demonstrated the protective effects of Kol against oxidative stress induced by several chemical toxicants including butyl phthalate and atrazine (ATZ) in both in vitro and in vivo experimental models. 3,4 Furthermore, Kol has been shown to inhibit carcinogen-induced genotoxicity in human liver-derived HepG2 cells. 5 All these pharmacological effects of Kol are ascribed in part to its antioxidant activity. 5
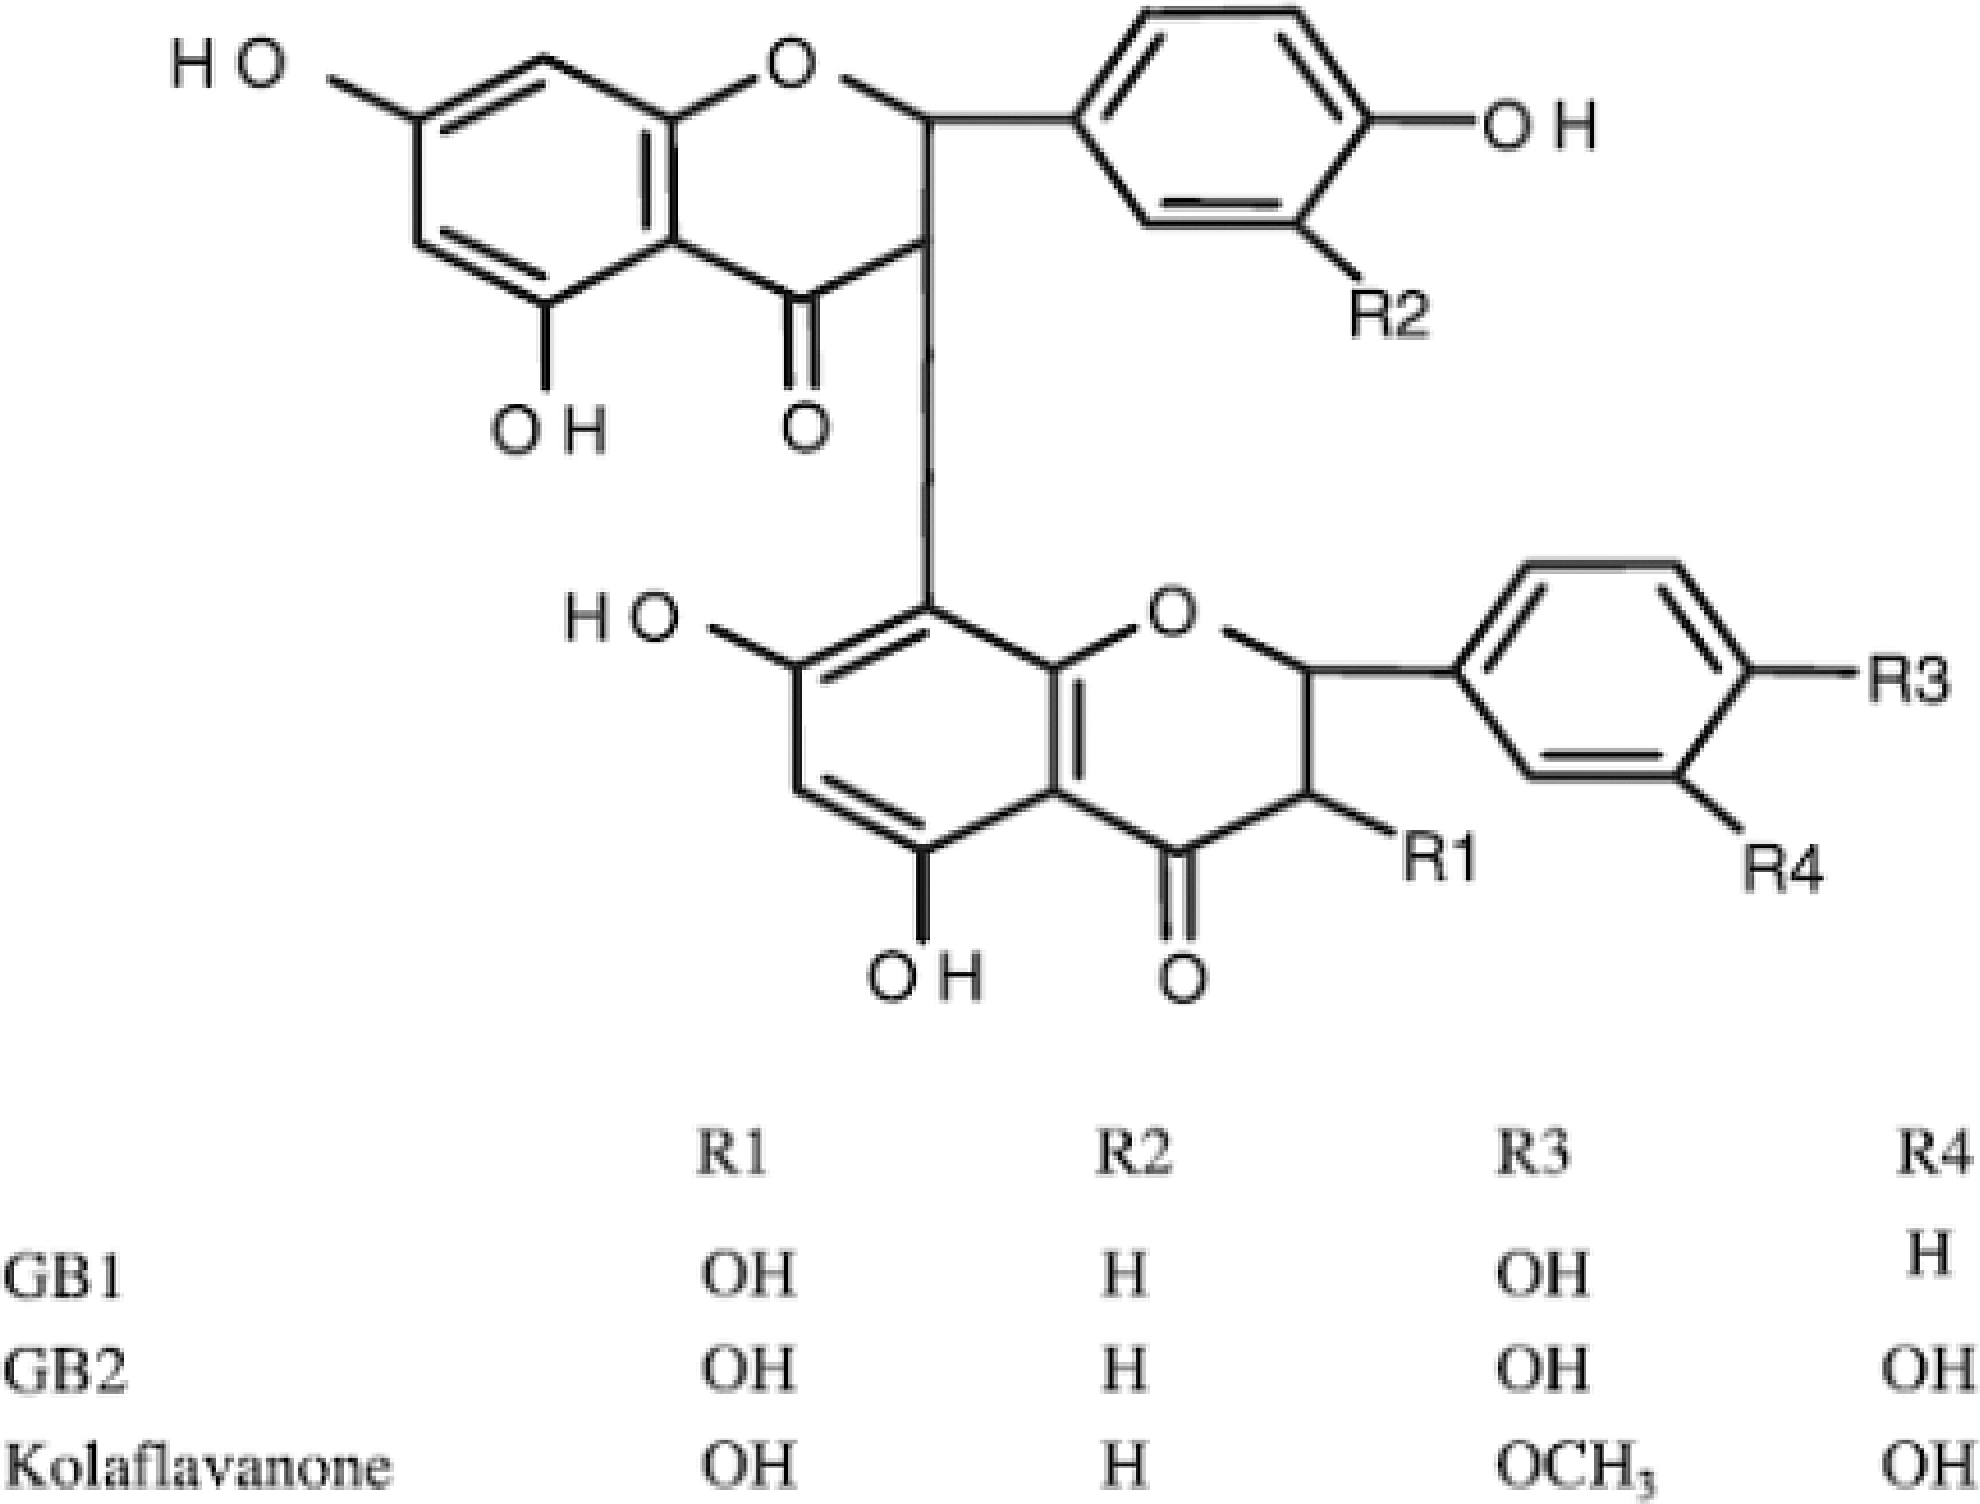
Chemical structure of kolaviron.
Atrazine is currently one of the most widely used herbicide in the world and is the most frequently detected herbicide in regular drinking water, where its level sometime reaches 3 ppb. 6 It is applied to control broad-leaved and grassy weeds in corns, sugarcane, sorghum, and other crops, both prior to and following emergence. As a result of the widespread use and the interference of ATZ with different living systems, there is an increasing interest in their biochemical and cytotoxicity effects. 7 –9 The cytotoxicity effects might occur through the induction of oxidative stress and apoptosis with possible involvement of overproduction of reactive oxygen species (ROS). 4,10
Atrazine can activate aromatase expression resulting in low testosterone levels. 11 This action causes a number of alterations in humans and animals, including decreased semen quality 12 and developmental delays and abnormalities. 13 It has been reported that ATZ depletes antioxidant enzymes and increase levels of lipid peroxidation. 4 In addition, ATZ led to degenerative changes in both Leydig and Sertoli cells of rats and disrupted germ cell development. 14 Moreover, ATZ affects cell growth, proliferation, and differentiation in several experimental models exposed to ATZ in vitro. 9,15,16
In the present study, the toxicity of ATZ was further investigated using a ILC culture model. Kol, because of its antioxidant properties, was chosen to examine its attenuating effect on cytotoxicity caused by ATZ. In addition to the analysis of cytotoxicity and ROS levels, the MDA content was measured as an end product of lipid peroxidation. The defense systems against free radical attack were assessed by the measurement of both the activities and mRNA expressions of glutathione peroxidase (GSH-Px) and glutathione reductase (GR). Additionally, the messenger RNA (mRNA) expression of other antioxidant genes superoxide dismutase (SOD)-1, SOD-2, and glutathione-S-transferase (GST) and the steroidogenesis genes steroidogenic acute regulatory protein (StAR), cytochrome P450 side-chain cleavage enzyme (CYP11A1), and 3β-hydroxysteroid dehydrogenase (3β-HSD) were also monitored. These results would help to identify dietary sources that would provide protection against testicular toxicity induced by environmental contaminants such as ATZ and to generate reliable data for toxicological risk evaluation and management.
Materials and Methods
Chemicals
Atrazine was obtained from Sigma-Aldrich, Laborchemikalien GmbH, Germany; Sigma Chemical Company Pvt. Ltd. St. Louis, MO, USA; TRIzol (Genei); high-capacity complementary DNA (cDNA) reverse transcription kit with RNAse inhibitor and Power SYBR Green polymerase chain reaction (PCR) Master Mix were purchased from the Applied Biosystems (Foster City, California), and Coralville Integrated DNA Technologies, Inc. (Coralville, Iowa, USA), whereas primers for real-time PCR were obtained from the Integrated DNA Technologies, San Diego, CA. Dulbecco Modified Eagle Medium/Nutrient Mixture F-12 Ham (1:1; DMEM/F12) was purchased from Invitrogen Corporation, Auckland, New Zealand. Hank balanced salt solution (HBSS), bovine serum albumin (BSA), and dimethylsulfoxide (DMSO) were purchased from Sigma Chemical Company (St Louis, MO). Collagenase type IV and 3-(4,5-dimethylthiazol-2-yl-2,5-diphenyl tetrazolium bromide (MTT) were purchased from Sisco Research Laboratories, India. All other reagents were of analytical grade.
Extraction of Kol
Kol was isolated according to published procedure. 1 Briefly, the powdered seeds were extracted with light petroleum ether (bp 40°C -60°C) in a soxhlet for 24 hours. The defatted dried marc was repacked and extracted with acetone. The extract was concentrated and diluted twice its volume with water and extracted with ethylacetate (6 × 300 mL). The concentrated ethylacetate yielded a golden yellow solid termed Kol which consist of Garcinia biflavonoid GB-1(3′′,4′,4′′′,5,5′′,7,7′′-heptahydroxy-3,8′′ biflavanone), GB-2 (3′′,4′,4′′′,5,5′′,5′′′,7,7′′-octa-hydroxy-3,8′′-biflavanone), and kolaflavanone (3′′,4′,4′′′,5,5′′,5′′′,7,7′′octahydroxy-4′′′-methoxy-3,8′′-biflavanone) as reported previously. 1
Primary Interstitial Leydig Cells’ Isolation and Cell Culture
Interstitial Leydig cells (ILCs) were isolated from the testes of 28-day-old Wistar rats as previously described. 8 Briefly, testes were removed from 5 male rats and put in HBSS containing 0.1% BSA and 25 mg/L soybean trypsin inhibitor (SBI). Subsequently, testes were decapsulated and subjected to enzymatic digestion in HBSS containing 0.25 mg/mL collagenase and 25 mg/L SBI at 37oC in a shaking water bath (80 cycles/min). After 45 minutes, the tube was removed from the water bath and HBSS was added until a total volume of 50 mL was reached. The larger tubular fragments were allowed to settle under unit gravity for 10 minutes. The supernatant was removed and again the fragments and cell clumps in this supernatant were allowed to settle for 10 minutes. From this tube, the supernatant was collected, filtered through a nylon mesh to remove debris, and centrifuged for 5 minutes at 800 g. After centrifugation, the supernatant was removed and the pellet was resuspended in DMEM-F12. The supernatant collected after centrifugation was centrifuged again for 5 minutes at 800 g, and this pellet was also resuspended in the culture medium. Both cell suspensions were put together. The cells were seeded either in 6-well plates on glass coverslips at a density of 1 × 10⁵ cells/well or in 96-well plates at a density of 1 × 10⁴cells per well or in T-75 cm2 or T-25 cm2 flasks (Nunc International, Rochester, New York) at a density of 106 cells/flask. The cell viability (over 98%) was determined using the Trypan blue method. 4 The 3β-HSD staining method 8 was used to measure the proportion of Leydig cells in the preparation. When the cells (1 × 10⁵ cells/mL) were incubated for 90 minutes at 37oC with 0.05 mol/L phosphate-buffered saline (PBS), pH 7.4, containing 0.2 mg/mL of nitroblue tetrazolium, 0.4 mmol/L etiocholanolone, and 1 mg/mL of nicotinamide adenine dinucleotide (NAD), a blue formazan deposit was seen in the Leydig cells. The proportion of Leydig cells in the preparation, determined using a hemocytometer, was approximately 89% ± 3% (n = 3).
Cell Treatment
Stock solutions of Kol and ATZ were prepared in DMSO in so much that the addition of 0.01% DMSO (a concentration that did not affect cell viability) resulted in the final concentrations of 50 μg ATZ per mL (232 µmol/L) of cell suspension. Two-day cultured ILCs grown in DMEM/F12 supplemented with 10% fetal bovine serum, 0.2% sodium bicarbonate, and antibiotic/antimycotic (10×, 1 mL/100 mL of medium; Invitrogen Life Technologies, Grand Island, New York, USA) were exposed to ATZ (232 μmol/L) and different concentrations of Kol (10, 30, 60, 90 μmol/L) alone or in combination. Cells (1 × 10⁶/mL culture medium/dish) treated with ATZ alone or in combination with Kol (60 μmol/L) for 6 hours were used for the measurement of mRNAs for StAR, 3β-HSD, CYP11A1, SD-1, SD-2, GSH-Px, GR, and GST. Untreated cells whose values were not different from the vehicle-treated cells (DMSO) provided the baseline for each end point examined (data not shown). Several reports in other model systems have verified that this dose of Kol (60 μmol/L) is nontoxic to cells and consistently prevented oxyradical damage in both human and rat cells. 5 At the end of 24 hours of incubation period, the media were removed and cultured cells were washed and resuspended in an appropriate volume of PBS to determine the GSH-Px and GR activities as well as the MDA concentrations. Generation of ROS was measured at 1, 3, and 6 hours. In a preliminary study, about 95% of cells remained alive after 6 hours of treatment with 232 μmol/L ATZ (data not shown). Therefore, the 6-hour culture period was chosen for the gene expression study. This concentration of ATZ (232 μmol/L) was chosen based on its cytotoxicity to an in vitro cell culture model, and it approximated the testicular concentration of ATZ that affected Leydig cell function (steroidogenesis). 8
Determination of Cell Viability by MTT Assay
Cell viability was quantified by measurement of the mitochondrial reduction in MTT to produce a dark-blue formazan product. 8 Briefly, ILCs (1 × 10⁴ cells/well) were treated with chemicals at the indicated concentrations and were maintained for the indicated time periods in 96-well plates. MTT (0.5 mg/mL) was added to each well. After incubating for 4 hours at 37oC, the medium was removed and 200 µL DMSO was added to solubilize the formazan crystals. The color developed was measured at 570 nm using a multiplate reader (Synergy HT; Bio-Tek, Winooski, VT, USA and Invitrogen Life Technologies, USA). Cell viability was expressed as the proportion of absorbance values to the control group.
Determination of Thiobarbituric Acid Reactive Substances
Malondialdehyde (MDA) is a breakdown product of the oxidative degradation of cell membrane lipids and is generally considered an indicator of lipid peroxidation. In the present study, lipid peroxidation was thus evaluated by measuring MDA concentrations as previously reported. 4 The method was based on the spectrophotometric measurement of the color produced during the reaction of thiobarbituric acid (TBA) with MDA. The MDA concentrations were calculated by the absorbance of TBA reactive substances (TBARS) at 532 nm and were expressed in pmol MDA formed/mg protein. Analyses were performed in triplicates.
Determination of GSH-Px and GR Activities
Both GSH-Px and GR play an important role in maintaining the cellular redox status of reduced GSH. The activity of GSH-Px was assessed as described previously. 4 The activity of GSH-Px was determined at 412 nm and expressed as µg GSH consumed/min per mg protein. Glutathione reductase activity was performed as described previously. 4 Briefly, 0.1 mL nicotinamide adenine dinucleotidephosphate (NADPH) was added to the reaction mixture containing 0.5 mL cell extract, 0.7 mL sodium phosphate buffer, 0.5 mL of 25 mmol/L EDTA,0.2 mL of 12.5 mmol/L oxidized glutathione. Glutathione reductase activity was measured at 340 nm and expressed as µmol NADPH oxidized/min per mg protein.
Measurement of Intracellular ROS Levels
After treatment with 50 µg/mL (232 µmol/L) ATZ and Kol (60 µmol/L) for 1 hour, 3 hours, and 6 hours alone or in combination, the cells were incubated with 20 µmol/L of the fluorescent dye 2′, 7′-dichlorodihydrofluorescein diacetate (H2DCF-DA) for 30 minutes. The H2DCF-DA is a nonpolar compound which upon incorporation into cells is converted into a membrane-impermeable, nonfluorescent polar compound, H2DCF, by the action of cellular esterases. The fluorescence intensity was measured with excitation and emission wavelengths of 485 nm and 528 nm, respectively, in multiplate reader (Synergy HT, Bio-Tek). The DCF fluorescence intensity was proportional to the amount of ROS formed intracellularly. 4
Quantitative Real-Time PCR
The treated cells (1 × 10⁵ cells/mL) were dissolved in TRIzol reagent and total RNA was extracted according to the manufacturer’s instructions. Purified RNA with a 1.6 to 1.8 A260/A280 ratio was used in this study. Real-time PCR was conducted for mRNA quantification. Briefly, 1 μg total cellular RNA was reverse transcribed into cDNA in a 20 μL reaction mixture containing random primers and MultiScribe reverse transcriptase (Applied Biosystems), according to the supplier’s instructions. Reverse transcription was estimated at 25oC for 10 minutes, 37oC for 120 minutes and followed by 85oC for 5 seconds in the Bio-Rad thermal cycler. Real-time PCR was performed with the 7900HT Fast Real-Time PCR system (Applied Biosystems). The SYBR Green PCR Master Mix reagent kits were used according to the supplier’s instructions for quantification of gene expression. Rat specific primers were designed for the relevant genes on the basis of the published sequence of StAR (F-CTGCTAGACCAGCCCATGGAC and R-TGATTTCCTTGACATTTGGGTTCC) 8 ; 3β-HSD (F-AGCAAAAAGATGGCCGAGAA and R- GGCACAAGTATGCAATGTGCC) 8 ; CYP11A1 (F-GGAGGAGATCGTGGACCCTGA and R- TGGAGGCATGTTGAGCATGG) 8 ; GSH-Px (F-CGGTTTCCCGTGCAATCAGT and R-ACACCGGGGACCAAATGATG) 17 ; GR (F-AGCCCACAGCGGAAGTCAAC and R-CAATGTAACCGGCACCCACA) 17 ; GST (F-CCTGCCTGGGCATCTGAAAC and R-GCACTGAGGCGAGCCACATA) 17 ; SOD-1 (F-GCGGTGAACCAGTTGTGGTG and R- AGCCACATTGCCCAGGTCTC) 17 ; and SOD-2 (F-AGCTGCACCACAGCAAGCAC and R-TCCACCACCCTTAGGGCTCA). 17 The primers for the housekeeping gene β-actin (F-GGAAATCGTGCGTGACATTAAAG and R- CGGCAGTGGCCATCTCTT) were designed using software Primer Express 3.0 (Applied Biosystems) and full genes sequences from National Center for Biotechnology Information Entrez Nucleotide Database (www.ncbi.nlm.nih.gov/sites/entrez).
Thermal cycling conditions determined in ABI Prism 7900HT Sequence Detection System (SDS) were as follows: 95oC for 2 minutes; 1 cycle of 30seconds denaturation at 94oC, 60 seconds annealing at 42oC and 90 seconds extension at 72oC; 40 cycles of 30 seconds denaturation at 94oC, 30 seconds annealing at 60oC, and 90 seconds extension at 72oC; and 1 cycle of 10 minutes at 72oC. After real-time PCR, a melting curve analysis was conducted to demonstrate the specificity of the PCR product, which was displayed by a single peak for all investigated genes (data not shown). The calculation of the relative expression levels of each target was conducted based on the cycle threshold (Ct) method. The Ct for each sample was calculated using the SDS Relative Quantification Manager Software (Applied Biosystem) with an automatic fluorescence threshold (ΔRn) setting. The relative expression ratio (R) of a target gene is expressed in a sample versus a control in comparison to β-actin gene and calculated based on the following equation: ΔCt = (Ct, target gene − Ct, β-actin); ΔΔCt = ΔCt treatment − ΔCt control; R = 2−ΔΔCt.
Statistical Analysis
All data were presented as the mean ± standard error of the mean (SEM). The data were calculated by taking the mean of 3 independent experiments. Data were subjected to statistical analysis via 1-way analysis of variance (ANOVA) followed by Dunnett with GraphPad Prism 5.0 software (GraphPad Software, Inc, San Diego, California). Mean values were considered to be statistically significant at P < .05.
Results
Kol Protects Against Decreased Cell Viability Caused by ATZ
In order to check the viability of the cells in the cultures, MTT reduction was performed in rat ILCs treated with ATZ and Kol (60 μmol/L). The viability of the cells exposed to different concentrations of Kol (10-90 μmol/L) as revealed by the MTT assay is summarized in Figure 2A. We found that Kol alone without ATZ treatment had no effect on cell viability (Figure 2A). The viability of the cells exposed to 232 μmol/L ATZ was 19% below control values at 24 hours posttreatment. This increased to 27% at 48 hours posttreatment. This indicates that ATZ inhibited Leydig cell viability in a time-dependent manner. The decreased cell viability was prevented on treatment with Kol (60 μmol/L).
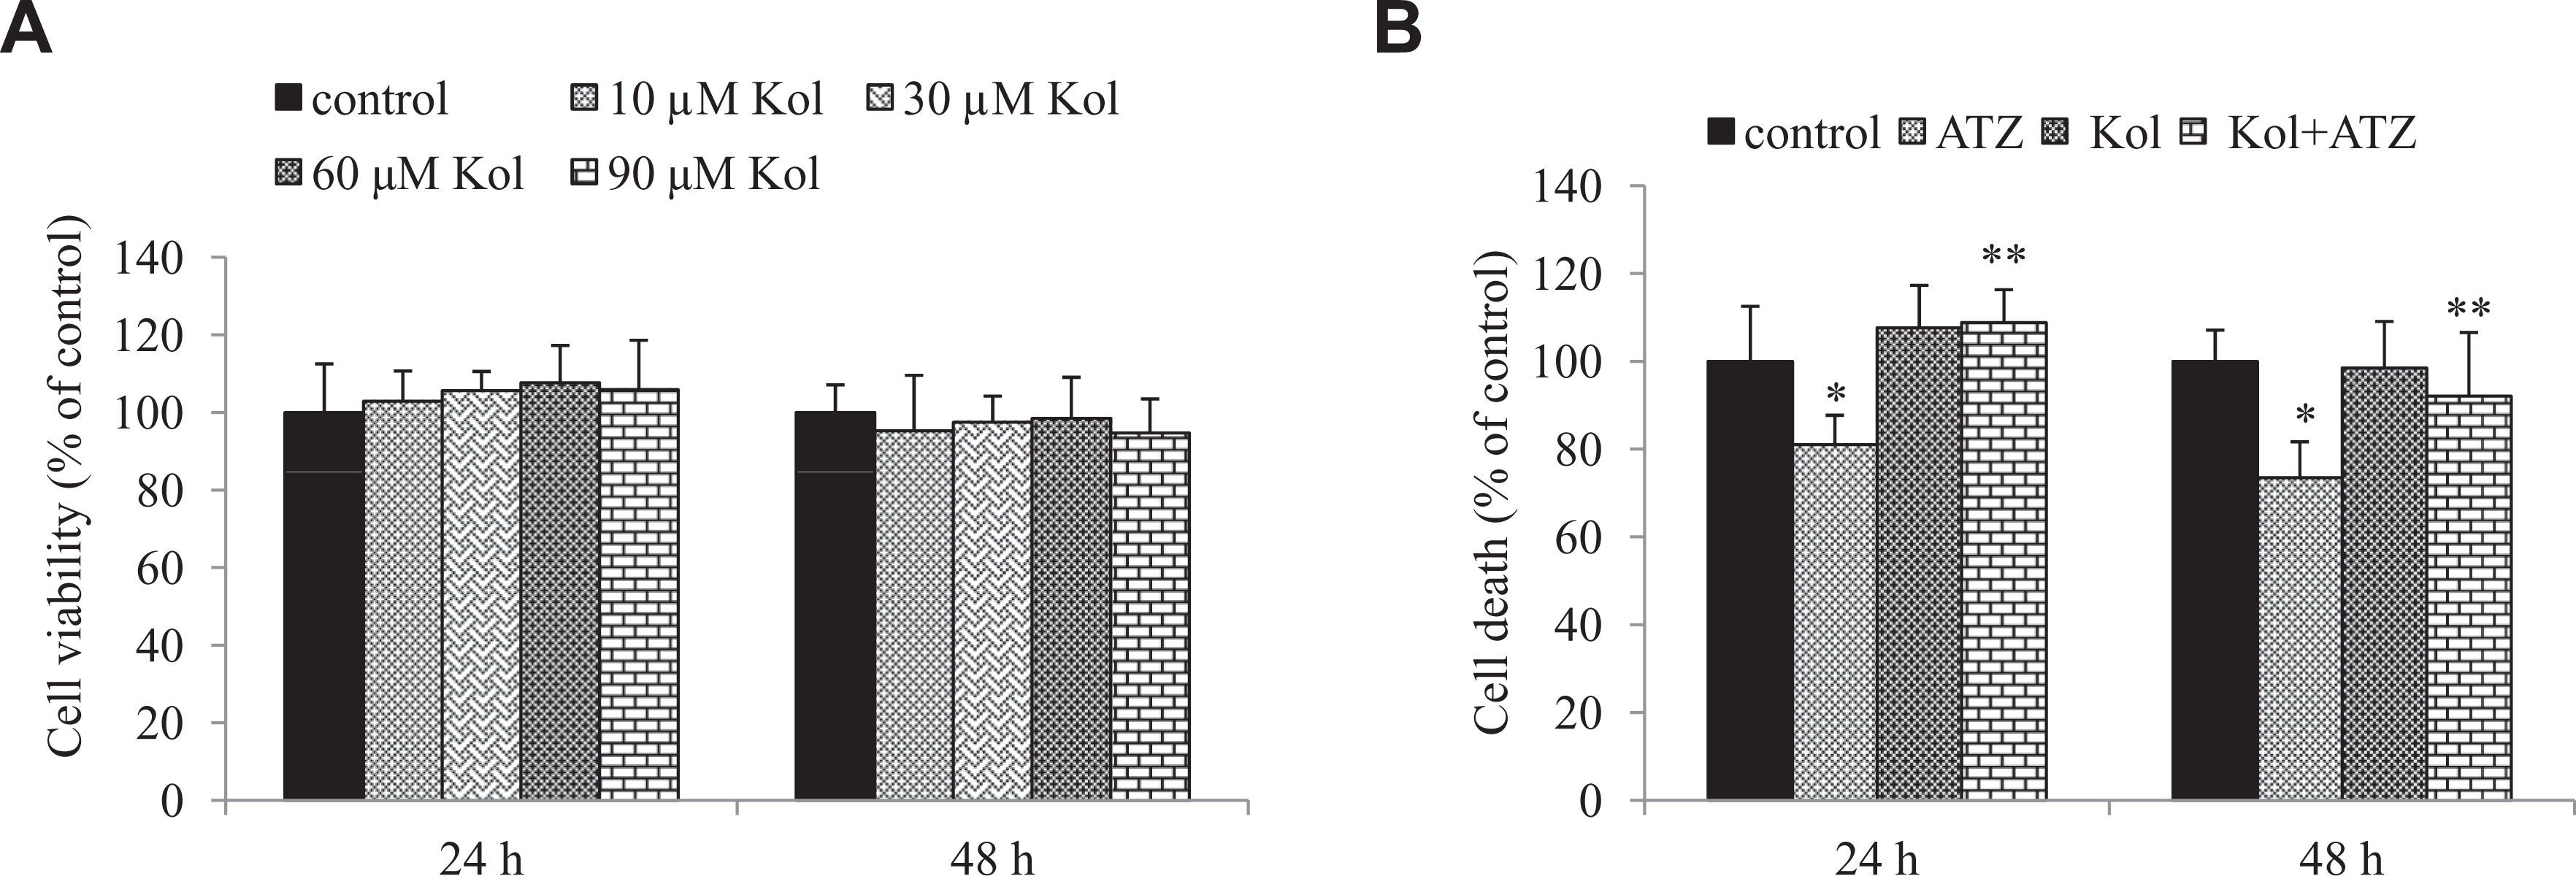
Cell viability of cultured interstitial Leydig cells (1 × 10⁴ cells per well) incubated for 24 and 48 hours after Kol treatment (A) and combined with atrazine (ATZ) (B) as determined by the methylthiazol tetrazolium bromide salt assay. Data are representative of 3 independent experiments. All values are mean ± standard error (SE) * Relative to control. **Relative to atrazine group (P < .05).
Kol Protects Against ATZ-Induced Oxidative Stress and Expression of Antioxidant Genes
The TBARS level in cells incubated with ATZ for 24 hours showed a significant increase in comparison to the level in control cells. A similar increase was observed in the activity of GSH-Px and GR in cells treated with ATZ compared to the level found in control cells not treated with ATZ (Figure 3A-C). Treatment with Kol prevented the increased MDA level and activities of GSH-Px and GR. To check the mechanism underlying the ATZ-induced oxidative stress, we measured the mRNA expression levels of the antioxidant genes using real-time PCR method. Treatment with ATZ (232 μmol/L) significantly upregulated the mRNA expressions of the antioxidant genes (GSH-Px, GR, and GST) and downregulated the mRNA transcript levels of SOD-1 and SOD-2 after 6 hours (Figure 4A and B). Treatment with Kol (60 μmol/L) significantly downregulated the expressions of GSH-Px by ~3-fold, GR by 3-fold, and GST by 2-fold and upregulated the mRNA expressions of SOD-1 and SOD-2 by 3.4- and 2.7-fold, respectively.
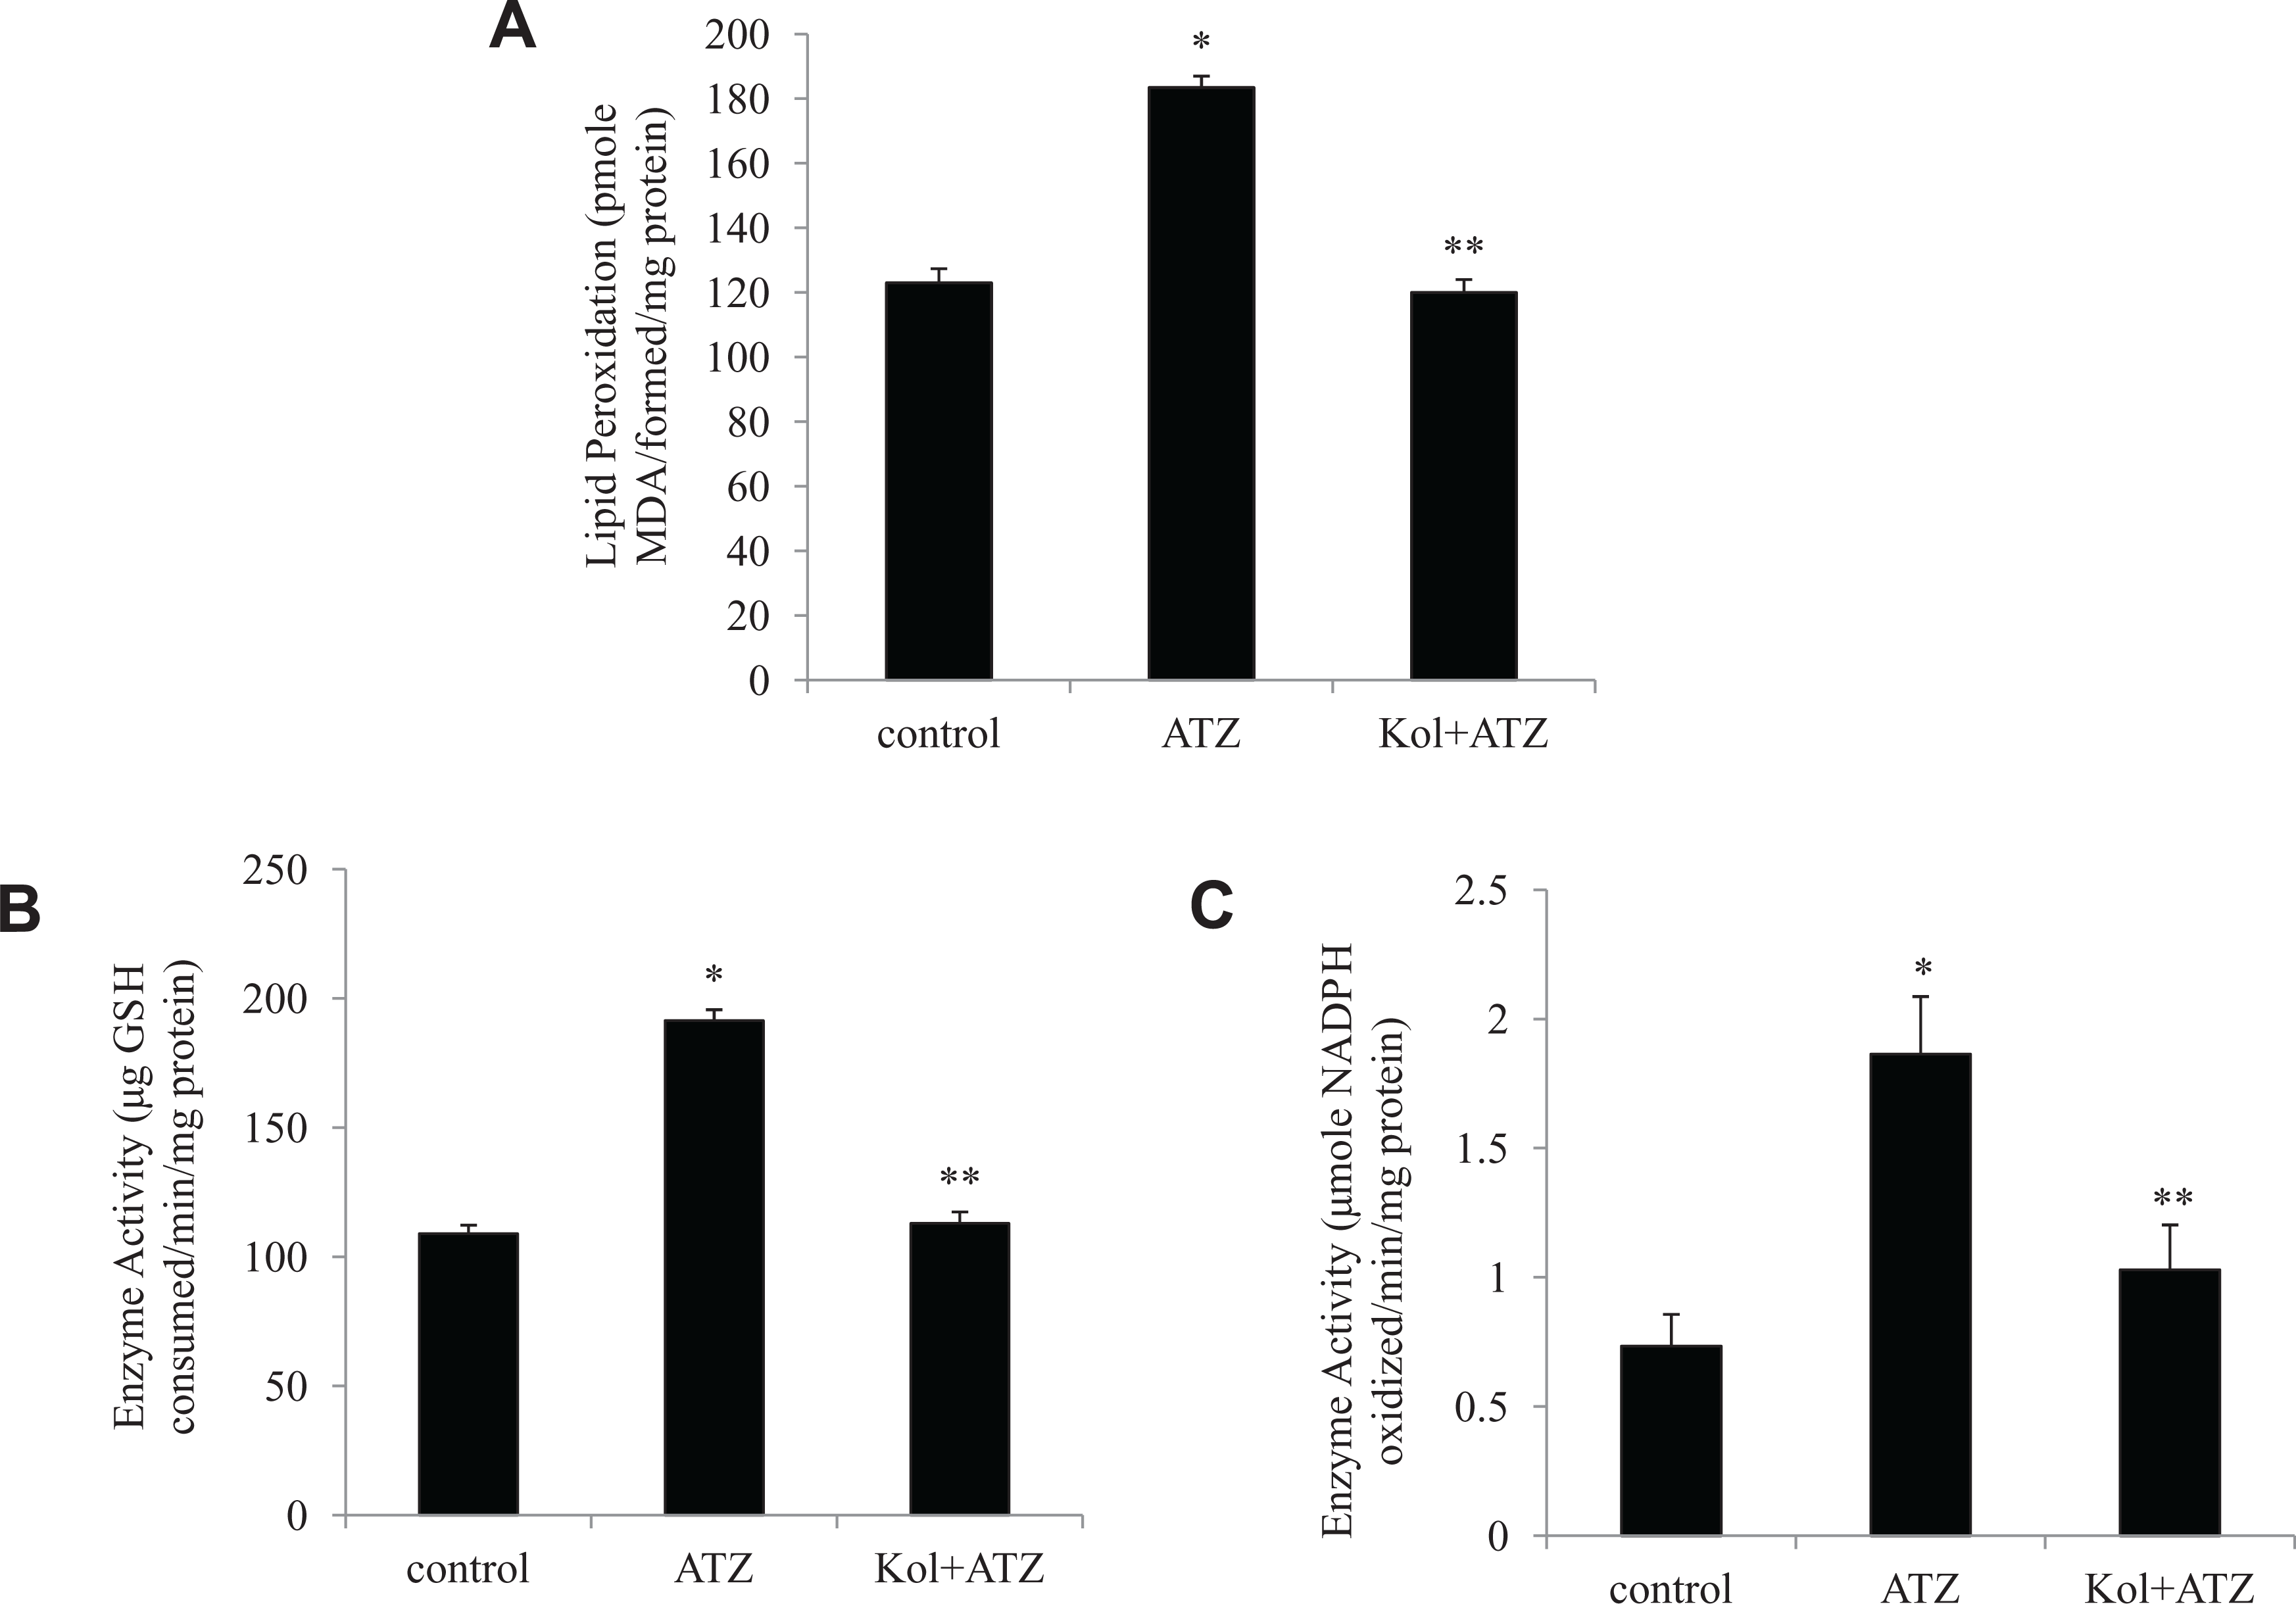
Kolaviron (Kol) protects against atrazine (ATZ)-induced malondialdehyde formation (A) glutathione peroxidase (B) and glutathione reductase activities (C) in cultured ILCs (1 × 10⁴ cells per well) after 24 hours of culture. Values are represented as mean ± standard error (SE) of 3 separate experiments. *Relative to control. **Relative to atrazine group (P < .05).
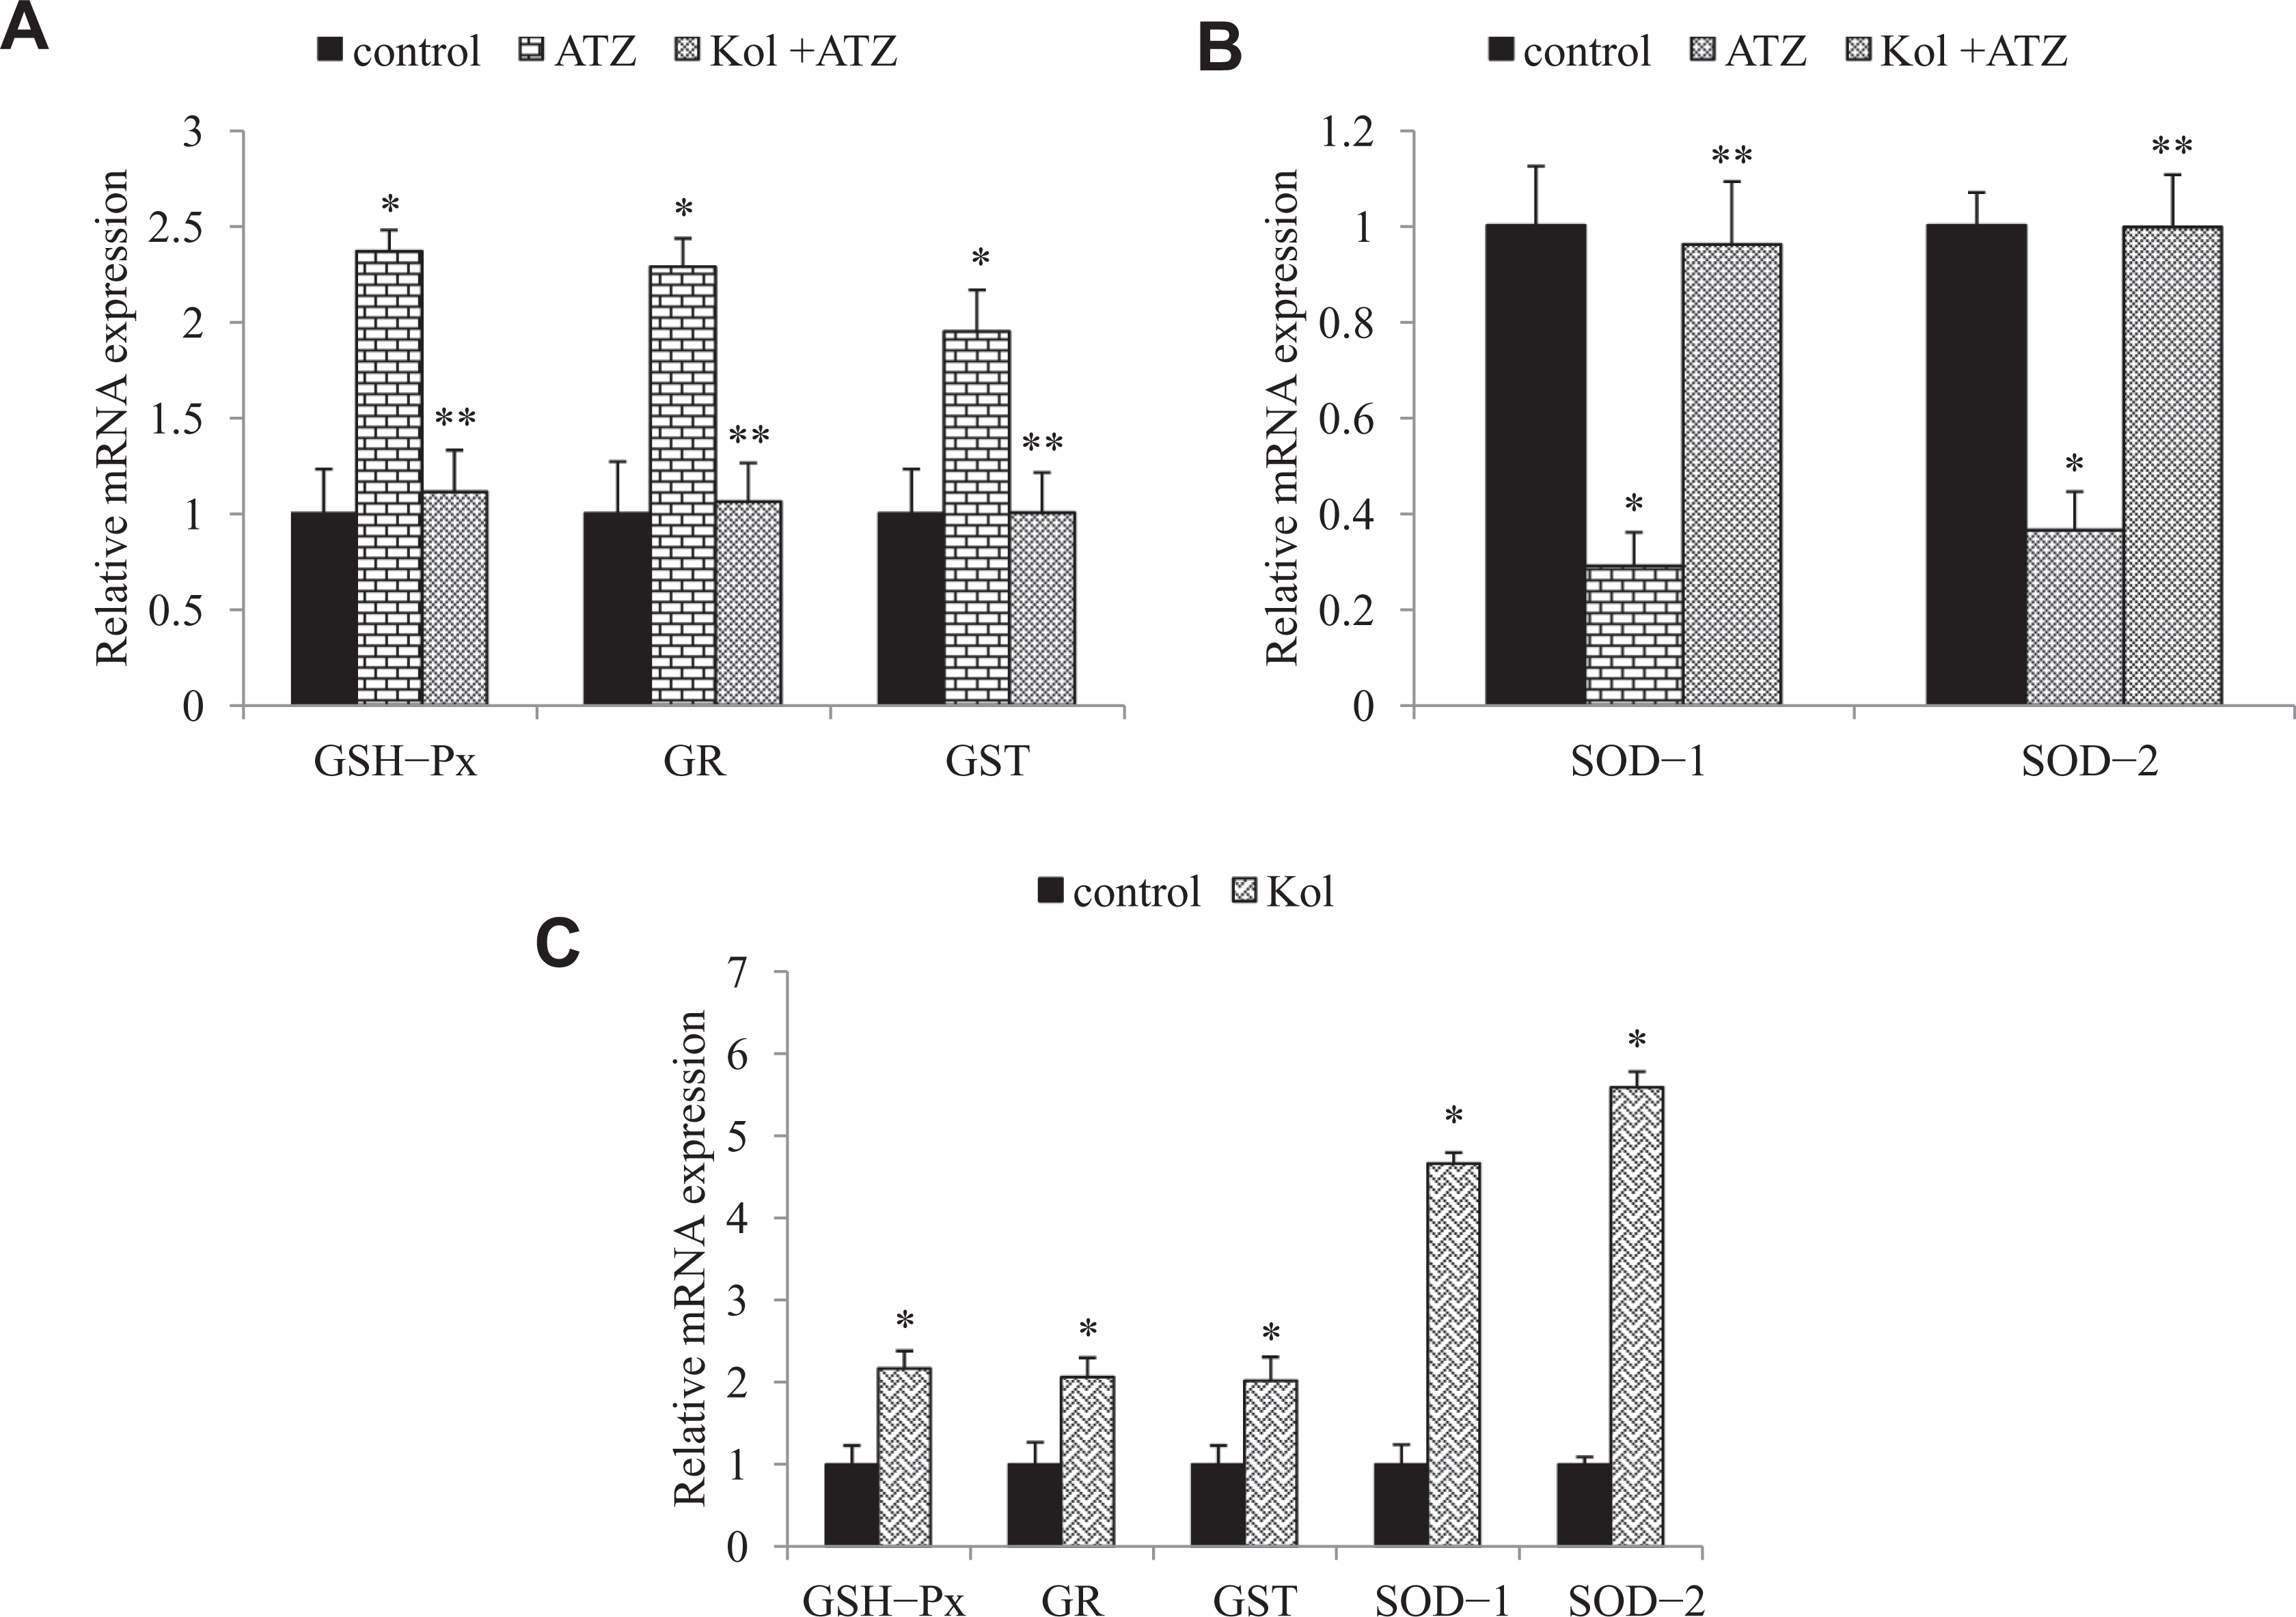
Kolaviron (Kol) protects against atrazine (ATZ)-induced messenger RNA (mRNA) levels of antioxidant enzymes in cultured ILCs. (A) Relative mRNA expression for GSH-Px, GR, GST (B), for SOD-1 and SOD-2 in ILCs exposed to a combination of ATZ and kol for 6 hours. (c) The ILCs were treated with Kol for 1 hour and mRNA levels of GSH-Px, GR, GST, SOD-1, and SOD-2 was determined by SYBR green real-time PCR analyses. The total RNA isolated from the cells was reverse transcribed and the cDNA obtained was subjected to RT-PCRq. Quantitative real-time PCR was performed in triplicate by SYBR Green dye method using ABI PRISM 7900HT Sequence Detection System (Applied Biosystems). Actin-β was used as an internal control to normalize the data, and the ATZ-induced alterations in mRNA expression are expressed in relative quantity (RQ) compared with respective unexposed control groups. Reliability of specific products was checked by melting curve analysis as well as running the product onto 2% agarose gel. *Relative to control. ** Relative to atrazine group (P < .05). Each data point represents mean ± SE from 3 separate experiments. ILCs indicates interstitial Leydig cells; cDNA, complementary DNA; GSH-Px, glutathione peroxidase; GR, glutathione reductase; GST, glutathione-S-transferase; SOD, superoxide dismutase; PCR, polymerase chain reaction; RT-PCRq, Quantitative real-time PCR.
Kol Increases mRNA Expression of Antioxidant Genes
A major protective strategy against oxidizing substances able to damage cells is the induction of the mRNA expression of antioxidant genes. Therefore, we examined whether Kol may activate the mRNA expression of GSH-Px, GR, GST, SOD-1, and SOD-2. To this end, ILCs were treated with 60 μmol/L of Kol for 1 hour and the mRNA transcript copy numbers were evaluated. The expressions of the antioxidant genes were significantly increased by treating cells with Kol. The mRNA expressions of the GSH metabolizing enzymes (GSH-Px, GR, and GST) were increased ~2-fold, whereas SOD-1 and SOD-2 expressions were increased 5- and 6-fold, respectively (Figure 4C).
Kol Protects Against ATZ-Induced intracellular ROS Production
No detectable change in ROS levels were observed at 1 hour of culture. Significant increases in ROS levels became obvious from 3 hour culture onward. ROS levels were 127% at 3 hours and then increased to 145% at 6 hours when compared to the control cells (P < .05). However, in combination with Kol, ROS generation decreased significantly (Figure 5).
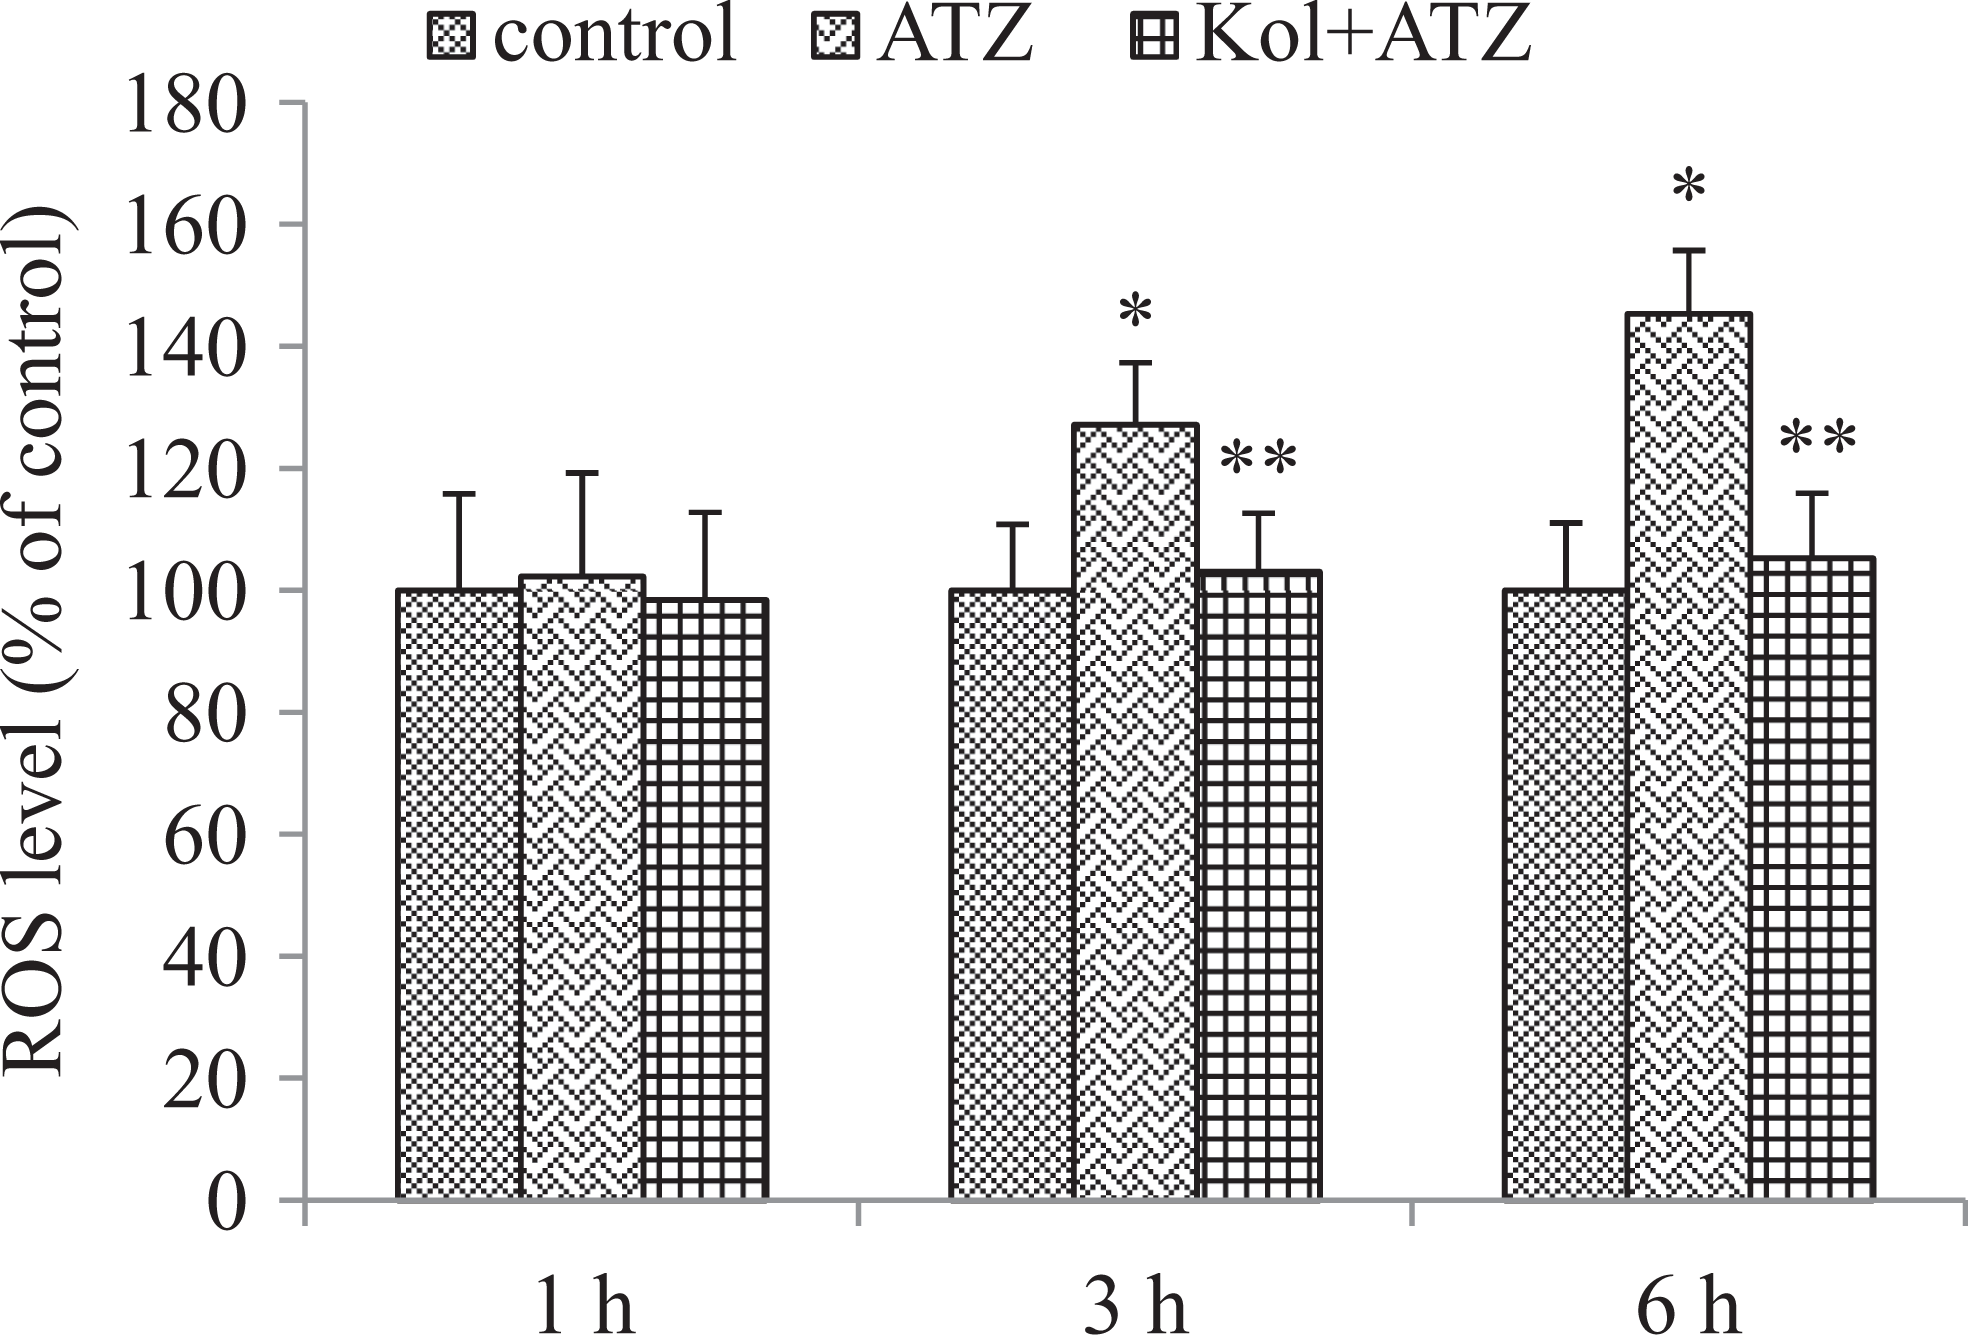
Kolaviron (Kol) protects against atrazine (ATZ)-induced ROS production in cultured ILCs (1 × 10⁴ cells/well). ROS levels were determined by fluorescence spectroscopy using the H2DCF-DA fluoresecent dye. The amount of intracellular ROS is expressed relative to that in controls. Data were presented as mean ± SE of 3 independent experiments. *Relative to control. ** Relative to atrazine group (P < .05). ILCs indicates interstitial Leydig cells; ROS, reactive oxygen species; H2DCF-DA, ′, 7′-dichlorodihydrofluorescein diacetate; SE, standard error.
Kol Protects Against Steroidogenesis Gene Expression Induced by ATZ
In order to explore the molecular mechanism of ATZ activity and the protective effects of Kol, we evaluated also the expression of genes related to steroidogenesis in cultured Leydig cells. At 6 hours of culture, ATZ (232 μmol/L) increased the mRNA expression of 3β-HSD (~25-fold of control; Figure 6A), StAR (~8-fold of control; Figure 6B), and CYP11A1 (~3-fold of control; Figure 6C). Treatment with Kol (60 μmol/L) normalizes the expressions of these genes to the control values (Figure 6A-C).
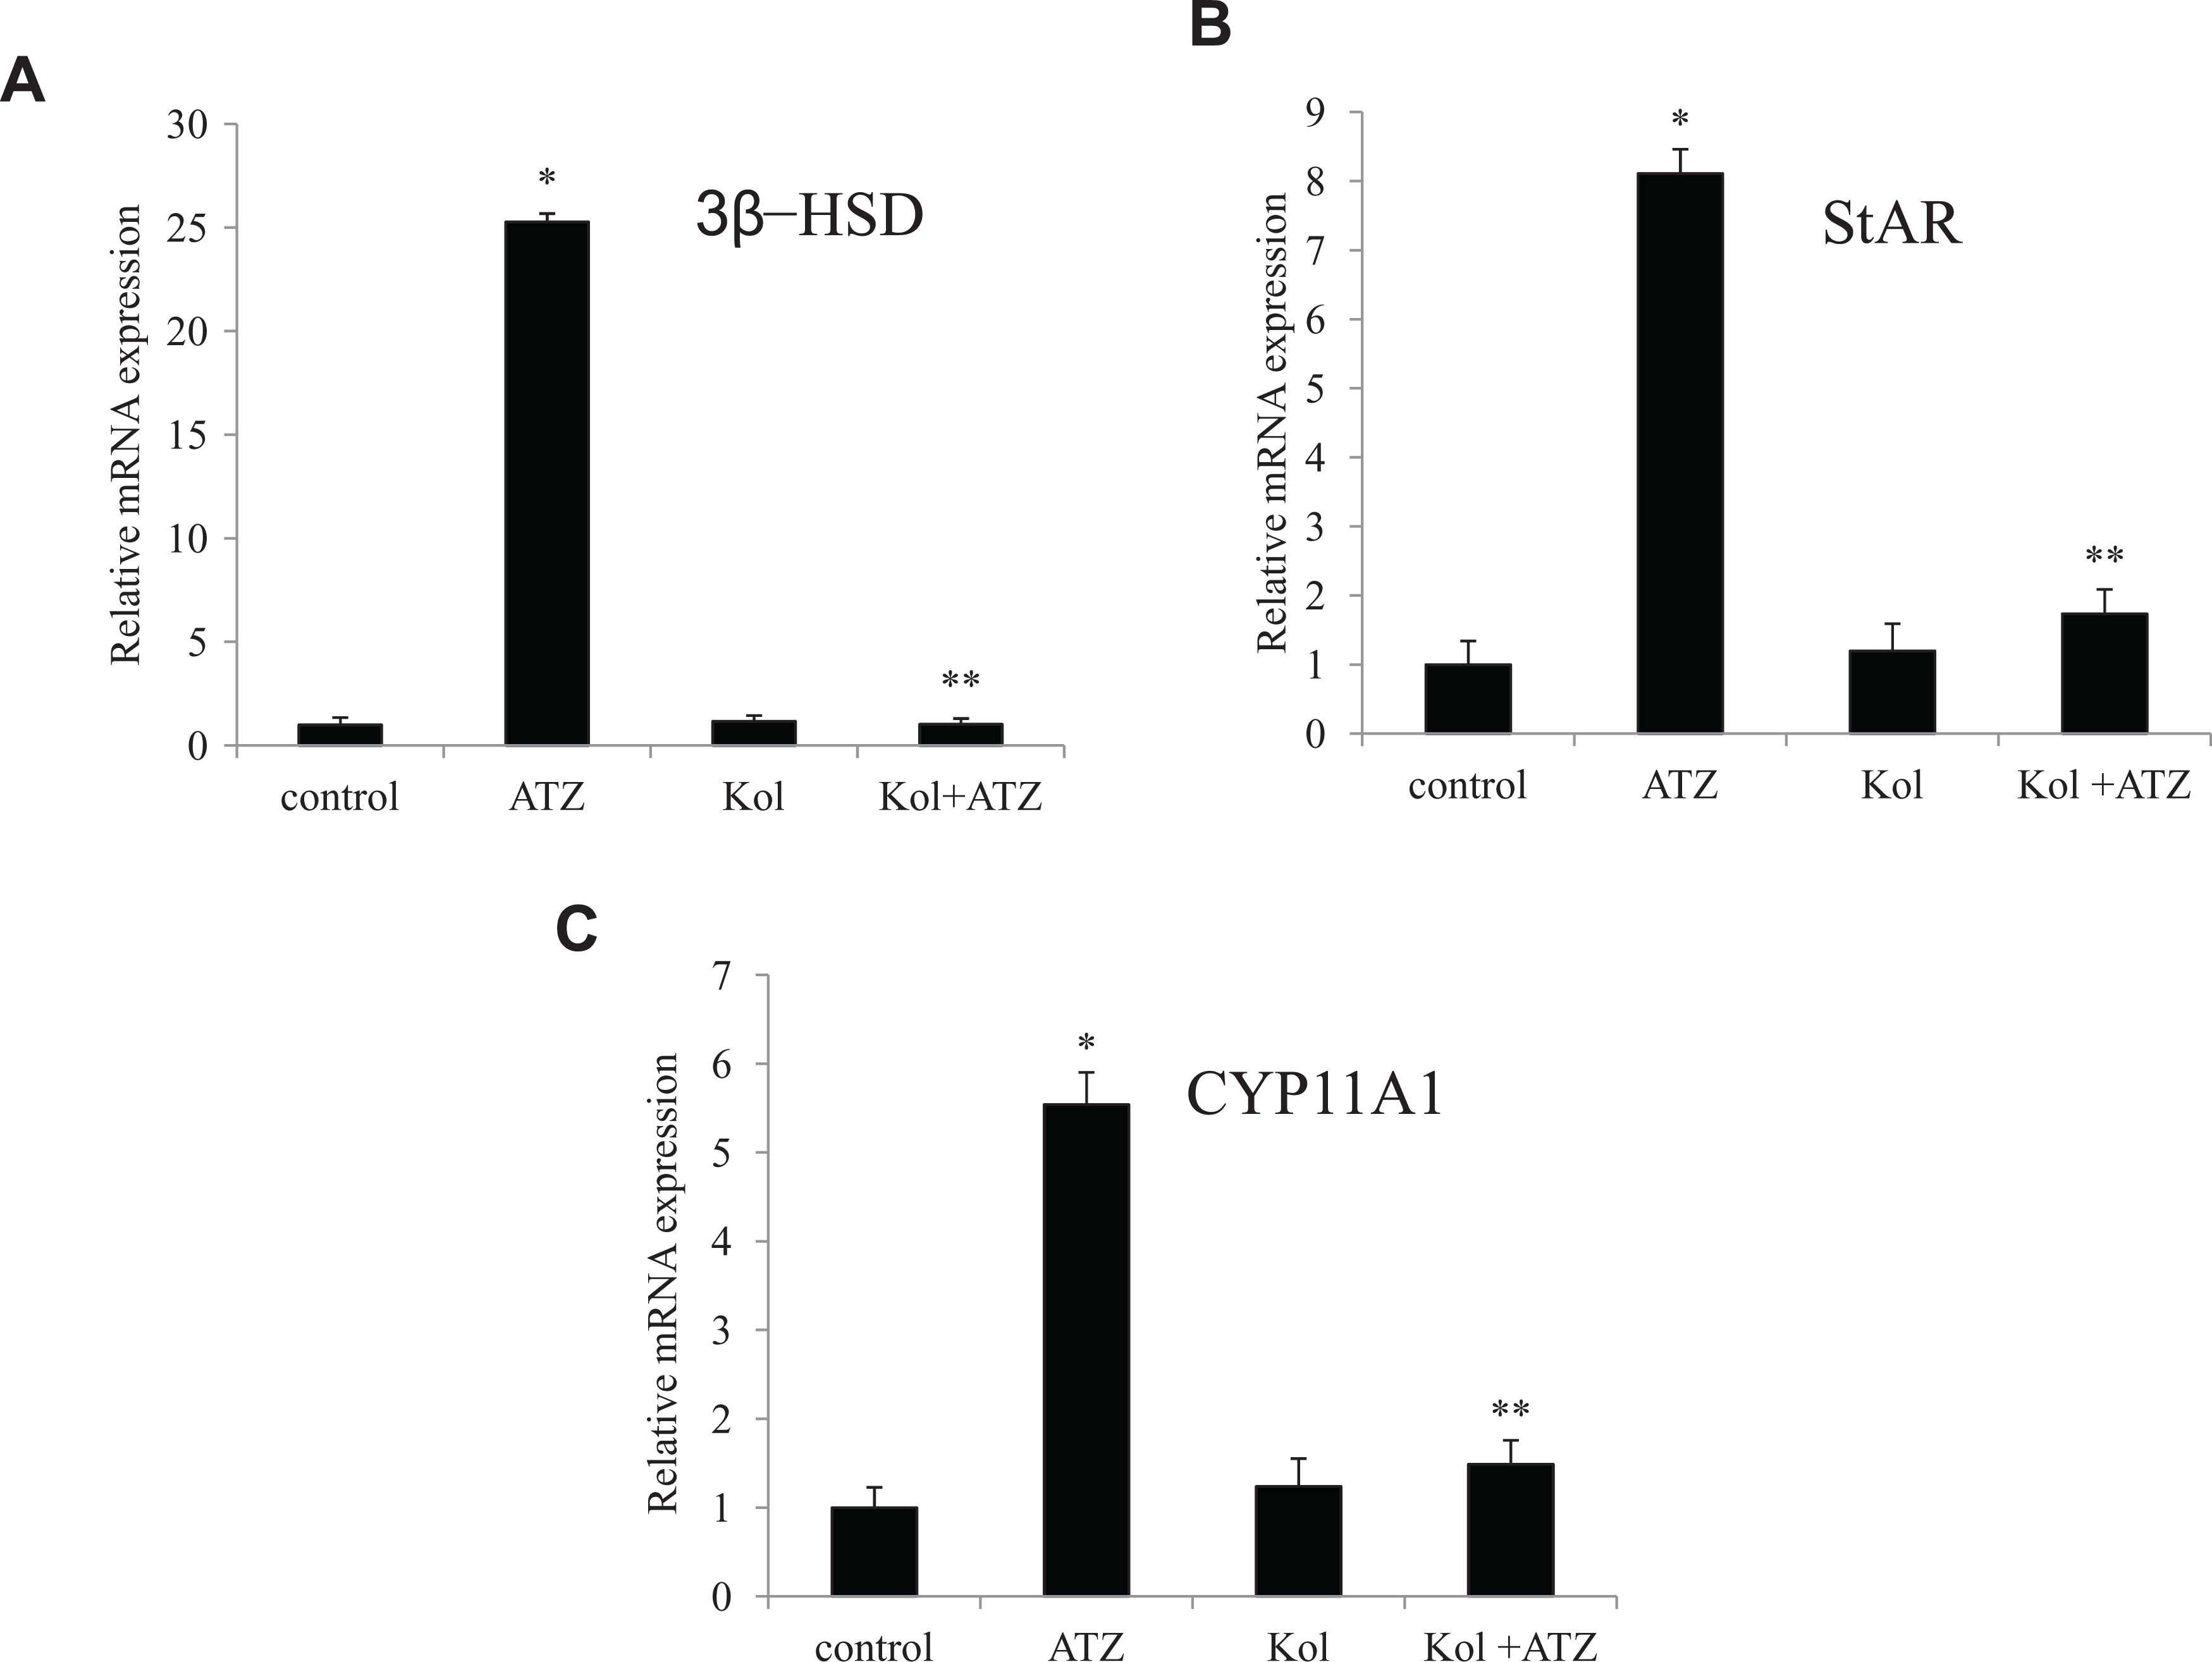
Kolaviron (Kol) protects against atrazine (ATZ)-induced mRNA levels of steroidogenesis genes in cultured ILCs. (A) Relative mRNA expression for 3β-HSD (B) StAR, and (C) CYP11A1 in ILCs exposed to a combination of ATZ and Kol for 6 hours. The total RNA isolated from the cells was reverse transcribed and the cDNA obtained was subjected to SYBR green real-time PCR analyses. Quantitative real-time PCR was performed in triplicate by SYBR Green dye method using ABI PRISM 7900HT Sequence Detection System (Applied Biosystems). Actin-β was used as an internal control to normalize the data and ATZ-induced alterations in mRNA expression are expressed in relative quantity (RQ) compared with respective unexposed control groups. Reliability of specific products was checked by melting curve analysis as well as running the product onto 2% agarose gel. *Relative to control. **Relative to atrazine group (P < .05). Each data point represents mean ± SE from 3 separate experiments. ILCs indicates interstitial Leydig cells; mRNA, messenger RNA; 3β-HSD, 3β-hydroxysteroid dehydrogenase; StAR, steroidogenic acute regulatory protein; CYP11A1, cytochrome P450 side-chain cleavage enzyme; PCR, polymerase chain reaction; cDNA, complementary DNA; SE, standard error.
Discussion
Our present work aimed to investigate the potential protective value of Kol on cytotoxicity-induced by ATZ. Atrazine has been found to be cytotoxic in HepG2 cells, 15 CHO-K1 cells, 9 PC12 cells, 4 and primary cultures of normal human fibroblasts. 7 Consistent with these reports and our previous reports, 8 ATZ was found to be cytotoxic in ILCs in the present study. Because the concentration of ATZ used in the present study were higher than those reported for other cells 7,9,15 and similar to that used in the Caco-2 cells, 16 we think that Leydig cell effect may not be an important component of ATZ toxicity.
The results showed that Kol had no deleterious effects on Leydig cell viability as demonstrated in the MTT assay. The simultaneous supplementation of the cell culture with Kol recovered the normal level of cell viability, GSH-Px and GR activities, and MDA and ROS levels. Furthermore, the mRNA transcripts levels of GSH-Px, GR, GST, SOD-1, and SOD-2 were normalized to the control value by treatment with Kol, suggesting that Kol directly affect the transcription of these antioxidant genes. Flavonoids possess in vitro antioxidant activity by directly scavenging intracellular ROS; the protective effects of flavonoids have also been shown to be related to their ability to enhance the activities of protective enzymes and antioxidants such as GSH and GSH-related enzymes. 18 The direct relationships between dietary flavonoids and GSH-related enzymes have also been confirmed in several studies. 19,20 The GSH-Px act as a barrier against hydroperoxide attack by reducing peroxides to water while generating oxidized GSH, 4 whereas GR recycles oxidized glutathione (GSSG) back to reduced glutathione. 4 Therefore, the presence of GSH and glutathione-dependent enzymes seems to be essential to prevent the cytotoxicity of ROS and free radicals. In accordance with that we demonstrated that 1 hour of treatment of ILCs with Kol induced a significant increase in GST, GSH-Px, and GR mRNA expression. A similar increase in the gene expression of GST, by Kol was also observed in HepG2 cells. 5 This might relate to the ability of Kol to directly increase the gene transcription of the antioxidant genes and further supports its antioxidant nature in ATZ-induced ILCs toxicity. It is also known that antioxidant gene expression depends mainly on ROS levels. 21 These findings suggest that Kol-treated cells were in better conditions to face the increasing generation of ROS induced by ATZ and consequently to escape cell death. We therefore suggest that one of the mechanisms by which Kol inhibited oxidative stress-induced cell death was by preventing ROS accumulation through the improvement in endogenous antioxidant defense. Furthermore, Kol has several potential “hydroxyl” sites (Figure 1) which have radical quenching capacity. Kol is also known as good lipid peroxidation quenchers. Also, they act as potential transition metal-chelating sites for metals such as Fe (iron) which always participates in lipid peroxidation and oxidant generation. 22 All these factors might have contributed to the protection of ATZ-induced ROS and lipid peroxidation by Kol. Additionally our observation on the normalization in the mRNA levels of StAR protein, P450scc, and 3β-HSD enzymes by Kol to the control levels are in agreement with previous observations that antioxidants substances protected against oxidative stress which was accompanied by normal steroidogenesis gene expression and antioxidant enzyme activities. 23
This finding is significant since it includes the true rate-limiting and regulated step in steroid biosynthesis, the intramitochondrial transport of cholesterol by StAR from the outer membrane to the site of cleavage of cholesterol by P450scc in the inner membrane to form pregnenolone, the substrate for 3β-HSD. 8 Because, we cannot rule out the possibility that ATZ-mediated cytotoxicity has an impact on in vitro ILCs steroidogenesis, we hypothesized that the restoration to normal sterodogenenesis gene expression by Kol in ILCs exposed to ATZ may be due to its cytoprotective effect.
Our findings demonstrate that Kol scavenges ROS and enhances antioxidant gene expressions in ILCs exposed to ATZ. The study also highlights the potential for Kol to normalize steroidogenesis gene expression in ATZ-treated ILCs. We hypothesize that this flavonoid represents a potential modulator of Leydig cell functions. However, further studies are needed to better define the in vivo effects of dietary Kol on male reproductive physiology.
Footnotes
Declaration of Conflicting Interests
The author(s) declared no potential conflicts of interest with respect to the research, authorship, and/or publication of this article.
Funding
This work was supported by one-year postgraduate fellowship from the Council of Scientific and Industrial Research (CSIR), India, and the Academy of Sciences for the Developing World (TWAS), Trieste, Italy, awarded to SOA. Financial assistance from the Council of Scientific & Industrial research, New Delhi, India, through Supra Institutional Project (SIP-08) is also acknowledged.