
Abstract
This study examined the effects of malathion and lead on transient receptor potential canonical channel TRPC1/TRPC4 channels in rat brain endothelial cells as a mechanism to explain previously noted blood–brain barrier (BBB) permeability induced by these compounds. Lead, malathion, malaoxon and combinations of these were assessed for protein levels and gene expression of TRPC1/C4 at 2, 4, 8, 16, and 24 hours after exposure. Changes in intracellular free calcium dynamics were also assessed. Compounds increased TRPC1 and TRPC4 protein levels as well as gene expression within 4 hours after exposure. Basal levels of intracellular free calcium were also elevated. Increases in gene and protein expression may be associated with an increase in the numbers of TRP channels, and the increases in intracellular calcium may be associated with activation of such channels. Therefore, upregulation and activation of the TRPC1/TRPC4 may be a mechanism by which these neurotoxicants affect BBB permeability.
Introduction
Endothelial cells of the blood–brain barrier (BBB) regulate transport between the brain and the blood systemic circulation. This regulation is critical for homeostasis in the central nervous system (CNS) and is responsible for the restriction of paracellular ion transport in the BBB. 1 Increases in cytoplasmic free calcium by depletion of intracellular calcium stores are associated with increases in permeability that result in disruption of BBB integrity. 2 ,3 Disruption of BBB integrity has also been associated with increases in intracellular free calcium in endothelial cells initiated by transient receptor potential canonical channel (TPRC) activity. 3 ,4 The disruption of integrity and the increases in permeability of the BBB are associated with several pathological conditions such as ischemic stroke, 5 traumatic brain injury, 6 multiple sclerosis, 7 and Alzheimer disease. 8
Lead poisoning is still a worldwide concern. Environmental lead poisoning, which was epidemic in the nineteenth century, resurged in the 1920s when tetraethyl lead began to be added to gasoline. 9 Although less than that in the past, environmental exposures still occur. Lead toxicity is accompanied by damage to cell membranes, allowing it to bind to proteins in soft tissues of the organs affected. Lead toxicity has been associated with altered liver, kidney, lung, cardiovascular, immune, bone, and CNS functions. At high concentrations, lead also disrupts the cerebral capillary endothelial cells forming the BBB, causing extensive cerebral hemorrhage and the extravascular distribution of proteins. 10 ,11 Lead is also capable of entering cells through store-operated calcium channels and through transient receptor potential canonical channels (TRPCs). 12
Malathion is in many cases the organophosphorus (OP) compound of choice in pest control of crops and households. 13 Insecticidal efficacy of OP compounds resides in their capability to inhibit degradation of the neurotransmitter acetylcholine via inhibition of acetylcholinesterase (AChE). The same mechanism is associated with OP toxicities in humans. OP compounds can disrupt BBB permeability in vitro, 14 ,15 and malathion decreased the levels of tight junction proteins in endothelial cells of the BBB. 16 Nevertheless, mechanisms by which OPs disrupt tight junction proteins and therefore increase BBB permeability were not described in these reports. Also unknown is whether additive effects of lead and OP compounds on BBB permeability occur because both affect a similar mechanism.
Transient receptor potential canonical channels (TRPCs) are composed of a family of several isoforms (TRPC1 through TRPC7). These isoforms, when configuring the channel, arrange into 6 transmembrane subunits that can assemble into both homomeric and heteromeric complexes. 17 The TRPCs have been associated with the regulation of endothelial cell permeability. 18 Specifically, the TRPC1 and TRPC4 subunits form heteromeric channels in endothelial cells of the BBB and therefore may be involved in BBB permeability mechanisms. 19 In normal cell function, the TRPC1 and TRPC4 subunits may be coupled to capacitative calcium influx. Furthermore, the TRPC1 subunits show similarity to voltage-gated calcium channels, although they lack the set of positively charged residues that confer voltage sensitivity to most voltage-gated ion channels. 17 ,20
Previous work in our laboratory established that lead and malathion alone, and even more in combination, decreased transendothelial electrical resistance in an in vitro model of the BBB at noncytotoxic concentrations. 14 This disruption in permeability is caused in part by reducing tight junction protein levels, 16 but the mechanism (or mechanisms) by which this damage is induced still remains to be elucidated. The present study examined the effects of these 2 neurotoxic substances on TRPCs by utilizing rat brain endothelial cells (RBE4s) of the BBB. We hypothesized that TRPC1 and/or TRPC4 may be associated with the mechanism through which lead and malathion affect the BBB. We assessed gene expression and protein levels of TRPC1 /TRPC4 subunits in endothelial cells of the BBB following exposure to lead and malathion at concentrations that alone and together did not affect cell viability but were able to decrease BBB barrier function. We also assessed changes in levels of intracellular free calcium in response to treatments with lead and malathion up to 24 hours after exposure. Since lead and organophosphates are associated with variations in intracellular free calcium concentrations in different cell systems,21–23 the TRPCs are good candidates to explore as contributors to disruption of the BBB.
Materials and Methods
Chemicals
Malathion of 94% purity was donated by the American Cyanamid Company, agricultural division (Princeton, New Jersey). Malaoxon 98.2% pure was obtained from Chem Services Inc (West Chester, Pennsylvania); it was used to determine the need for having an active esterase inhibitor in order to observe changes in the levels of TRPCs . Lead acetate, Na2HPO4, KH2PO4, NaCl, trizma base, triton X-100, glycine, SDS, tween-20, deoxycholate, fura-2 AM (acetoxymethyl ester), and DMS were purchased from Sigma-Aldrich, Inc (St Louis, Missouri). Blocking buffer was purchased from LI-COR Biotechnology (Lincoln, Nebraska). Thapsigargin (an inhibitor of sarcoplasmic endoplasmic calcium ATPase pumps) was purchased from Calbiochem (San Diego, California).
Cell Culture
The rat brain microvascular endothelial cell line RBE4 was donated by the laboratory of Dr M Aschner, Vanderbilt University. Cells for Western blots and real-time polymerase chain reaction (PCR) were cultured in 100 mm × 20 mm polystyrene tissue-culture-treated dishes (Sigma-Aldrich) at a concentration of 1.5 ×10⁵ cells per culture dish; cells utilized for calcium measurements were cultured in 6-well tissue-culture-treated plates (Sigma-Aldrich). Cells in both the dishes and the plates were left to reach 100% confluency. RBE4 cultures were cultured in 44.5% minimum essential medium (MEM), 44.5% Ham F10 with glycine, 10% fetal bovine serum (FBS), and 1% of a penicillin/streptomycin/amphotericin B solution and kept at 37°C with 5% CO2. All the cell culture media and reagents utilized in cell culture procedures were obtained from Mediatech Inc (Manassas, Virginia), unless otherwise noted. After 3 to 4 days of incubation, the cells were treated with astrocyte conditioned medium (ACM) and incubated for an additional 2 days in order to induce the presence of tight junctions on the endothelial cells. ACM has been associated with induction of BBB-specific characteristics such as tight junctions in several cell lines. 24 ,25 After the incubation with the ACM, cells were treated with the neurotoxicants.
Treatments
Cells were treated with combinations and compounds alone at different times and concentrations. Treatment groups include lead acetate at 10−5 M (Pb10−5 M) and 10−6 M, malathion 10−5 M (Mal10−5 M), malaoxon 10−6 M (M×10−6 M), and combinations of both neurotoxicants (Pb10−5 M + Mal10−5 M, Pb10−5 M + M×10−6 M, Pb10−6 M + Mal10−5 M, and Pb10−6 M + M×10−5 M). Cells were treated for 2, 4, 8, 16, and 24 hours. Viability was unaffected after exposure of BBB cells to these concentrations for these periods of time. 14
Western Blot Assessment
RBE4 cells were washed in 5 mL ice-cold phosphate-buffered saline (PBS) of pH 7.4 and then lysed for 10 minutes with an ice-cold lysis buffer solution containing 150 mM NaCl, 10 mM trizma base, 0.5% v/v triton X-100, and 0.5% w/v deoxycholate. Lysates were centrifuged at 16 000g for 5 minutes and resuspended in 700 µL of ice-cold PBS. Lysates were processed immediately for protein determination; sample concentrations were adjusted to 1 mg/mL and stored at −20°C. Proteins were separated by electrophoresis in 4% to 15% Tris-HCl 1.0 mm pre-casted gels (Bio-Rad Laboratories, Hercules, California) and then transferred to a 0.45 µm pure nitrocellulose membrane by electroblotting. Membranes were blocked for 1 hour at room temperature with Odyssey blocking buffer (LI-COR Biotechnology) and then incubated for 1 hour with polyclonal antibodies (Santa Cruz Biotechnology, Santa Cruz, California) for TRPC1 , TRPC4 , and anti-β-actin (as a normalizing control) at 1:200 dilutions. Membranes were washed 5 times (5 minutes each) with a solution of PBS pH 7.4 and 0.1% tween-20 and then incubated for 1 hour with IRDye 700DX conjugated affinity purified anti-rabbit immunoglobulin G ([IgG] donkey) and IRDye 800CW conjugated affinity purified anti-goat IgG (donkey) secondary antibodies (Rockland, Gilbertsville, Pennsylvania) at 1:5000 dilutions. Membranes were washed and then analyzed by near-infrared (NIR) fluorescence detection methods with the Odyssey Infrared Imaging System. Results were expressed as relative band fluorescence in pixels.
Total RNA Extraction and Reverse Transcription/Complementary DNA Synthesis
Total RNA was extracted utilizing the Total RNA purification RNeasy kit from Qiagen (Valencia, California). Briefly, cells were lysed with lysis buffer applied directly on the cell culture dishes after washing them with ice-cold PBS; lysates were then homogenized with 70% ethanol utilizing a blunt 20-gauge needle (0.9 mm diameter), and pipetted into RNeasy spin columns and centrifuged. Samples were treated with DNase I in order to digest any genomic DNA that may have been present in the samples and then washed again in the columns. RNA was then eluted directly from the columns with 30 µL of RNase-free water. Concentrations of total RNA were determined for samples with an Eppendorf UV/Vis bioPhotometer analysis system (Hamburg, Germany), and then RNAs were stored at −80°C. Reverse transcription synthesis was carried out utilizing the reverse transcription system from Promega (Madison, Wisconsin) processing 1 µg of total RNA per reaction. Briefly, total RNA was incubated at 70°C for 10 minutes and placed on ice. Reactions were prepared at the following concentrations: 50 ng/µL of total RNA, 50 mM MgCl2, 10× reverse transcription buffer (100 mM Tris-HCl of pH 9.0 at 25°C; 500 mM KCl; 1% TritonX-100), 1 mM each dNTP mixture, 1 unit/µL recombinant RNasin ribonuclease inhibitor, 50 units/µg avian myeloblastosis virus (AMV) reverse transcriptase (high concentration), and 0.5 µg of random primers per microgram RNA with nuclease-free water to a total volume of 20 µL per reaction. Reactions were incubated at room temperature for 10 minutes and then at 42°C for 15 minutes before they were heated at 95°C for 5 minutes. After cooling, complementary DNA (cDNA) reactions were stored at −20°C until used.
Quantitative Real-Time PCR
Rattus norvegicus real-time oligonucleotide primers for TRPC1 and TRPC4 and β-actin (as an internal normalizing control) were designed with the Beacon Designer 7.6 software (Premier Biosoft International, Palo Alto, California) as shown in Table 1. Primers were designed to be compatible with the SYBR Green PCR assays avoiding significant cross homologies and preventing secondary structures that can interfere with SYBR Green primer extension. Primers were synthesized by Invitrogen and then concentrations of each primer were standardized to 30 µM concentrations. Quantitative real-time PCR (qPCR) amplifications were carried out utilizing an iCycler iQ optical system (Bio-Rad). The PCR reaction mix was generated by adding 12.5 µL of SYBR Green Supermix (Bio-Rad) with 0.25 µL of each primer (forward/reverse), 1 µL of cDNA template, and RNA-free water to a total of 25 µL per reaction. The relative quantification of gene expression was attained utilizing the comparative CT method. 26
Rattus norvegicus Oligonucleotide Primer Sequences Used in the Real-Time PCR Assessmentsa
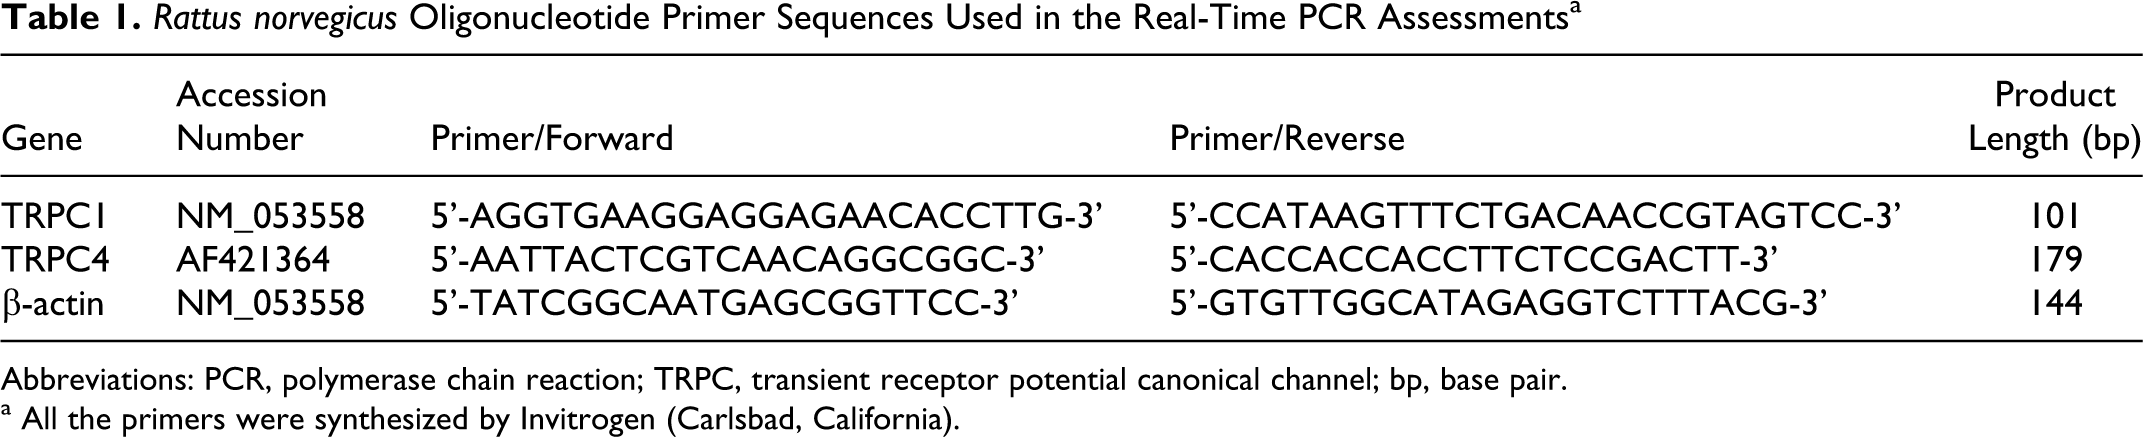
Abbreviations: PCR, polymerase chain reaction; TRPC, transient receptor potential canonical channel; bp, base pair.
a All the primers were synthesized by Invitrogen (Carlsbad, California).
Intracellular Free Calcium Analysis
Intracellular free calcium was determined microspectrophotometrically as we have previously described. 27 ,28 Briefly, RBE4 cells were seeded in six-well tissue-culture-treated plates and after confluency was reached, cells were treated with ACM and incubated for an additional 2 days in order to induce the presence of tight junctions on the endothelial cells. Cells were then treated with neurotoxicants lead acetate and malathion/oxon for 2 and 4 hours. These concentrations had been previously demonstrated not to affect cell viability. 14 After treatment with the neurotoxicants, cells were washed twice with Dulbecco PBS and then incubated for 1 hour with 5 µM Fura-2AM in Dulbecco PBS of pH 7.4 supplemented with 1 mM glucose and 1% fatty acid–free bovine serum albumin (FAF-BSA). After incubation, cells were washed twice with supplemented Dulbecco PBS and analyzed. Intracellular free calcium was determined with a Ratiomaster microspectrophotometery system (Photon Technologies International, South Brunswick, New Jersey). Excitation light was provided by a Xenon Arc lamp coupled to a scanning monochrometer that alternated excitation light between 340 and 380 nm. Band pass was set at ±2 nm. Excitation light was delivered to the cells via fiber optics through the epifluorescence port of a Zeiss Axioscop II coupled to a 40× water immersion lens. Emission was measured at 510 nm via microphotometer. The entire system for data collection was computer driven. Intracellular free calcium was calculated as previously described using a correction for intracellular viscosity. 29 The concentration of intracellular Fura-2 within the cells was routinely monitored at the isobestic wavelength to assure that dye leakage did not occur after toxicant treatment. Additionally, the excitation/emission spectra of loaded cells was scanned prior to the experiment. Fura-2 spectra from toxicant-exposed cells was similar to that of control cells, indicating that chemical chelation or alteration of Fura-2 by any toxicant remaining in the cells did not occur.
Statistical Analysis
All results are expressed as means ± standard error of the mean (SEM) of 3 or more individual assays. Multiple comparisons were performed by utilizing 1-way analysis of variance (ANOVA), followed by Dunnett's test for comparison of treatments with the control, and by Tukey's test for comparison among treatments. Data were analyzed by GraphPad Prism 4 (GraphPad software, San Diego, California); P values less than.05 were considered to be significant.
Results
As shown in Figure 1, the levels of TRPC1 protein increased considerably at the 4-hour period for all treatments. When endothelial cells of the BBB were exposed to the treatments for this time period, the combinations of neurotoxicants and malaoxon alone considerably increased protein levels (P < .01). Levels of TRPC1 protein were still high at 8 hours after exposure except for the two concentrations of lead alone. However at 16 hours, only the Pb10−6 M + Mal10−5 M combination maintained TRPC1 protein levels above those of control (Figure 1). In general, combinations of lead and malathion induced higher levels of TRPC1 protein at the 4- and 8-hour periods (P < .01); this is indicative of the presence of TRPC1 channels in the membrane of cells. Levels of TRPC1 protein at 24 hours resemble those at 2 hours. The 24-hour treatments with the organophosphates alone and their combinations with lead were significant when compared with the control (P < .05), however, these levels are not significant when compared to the increases measured early in the experiment (2 hours).
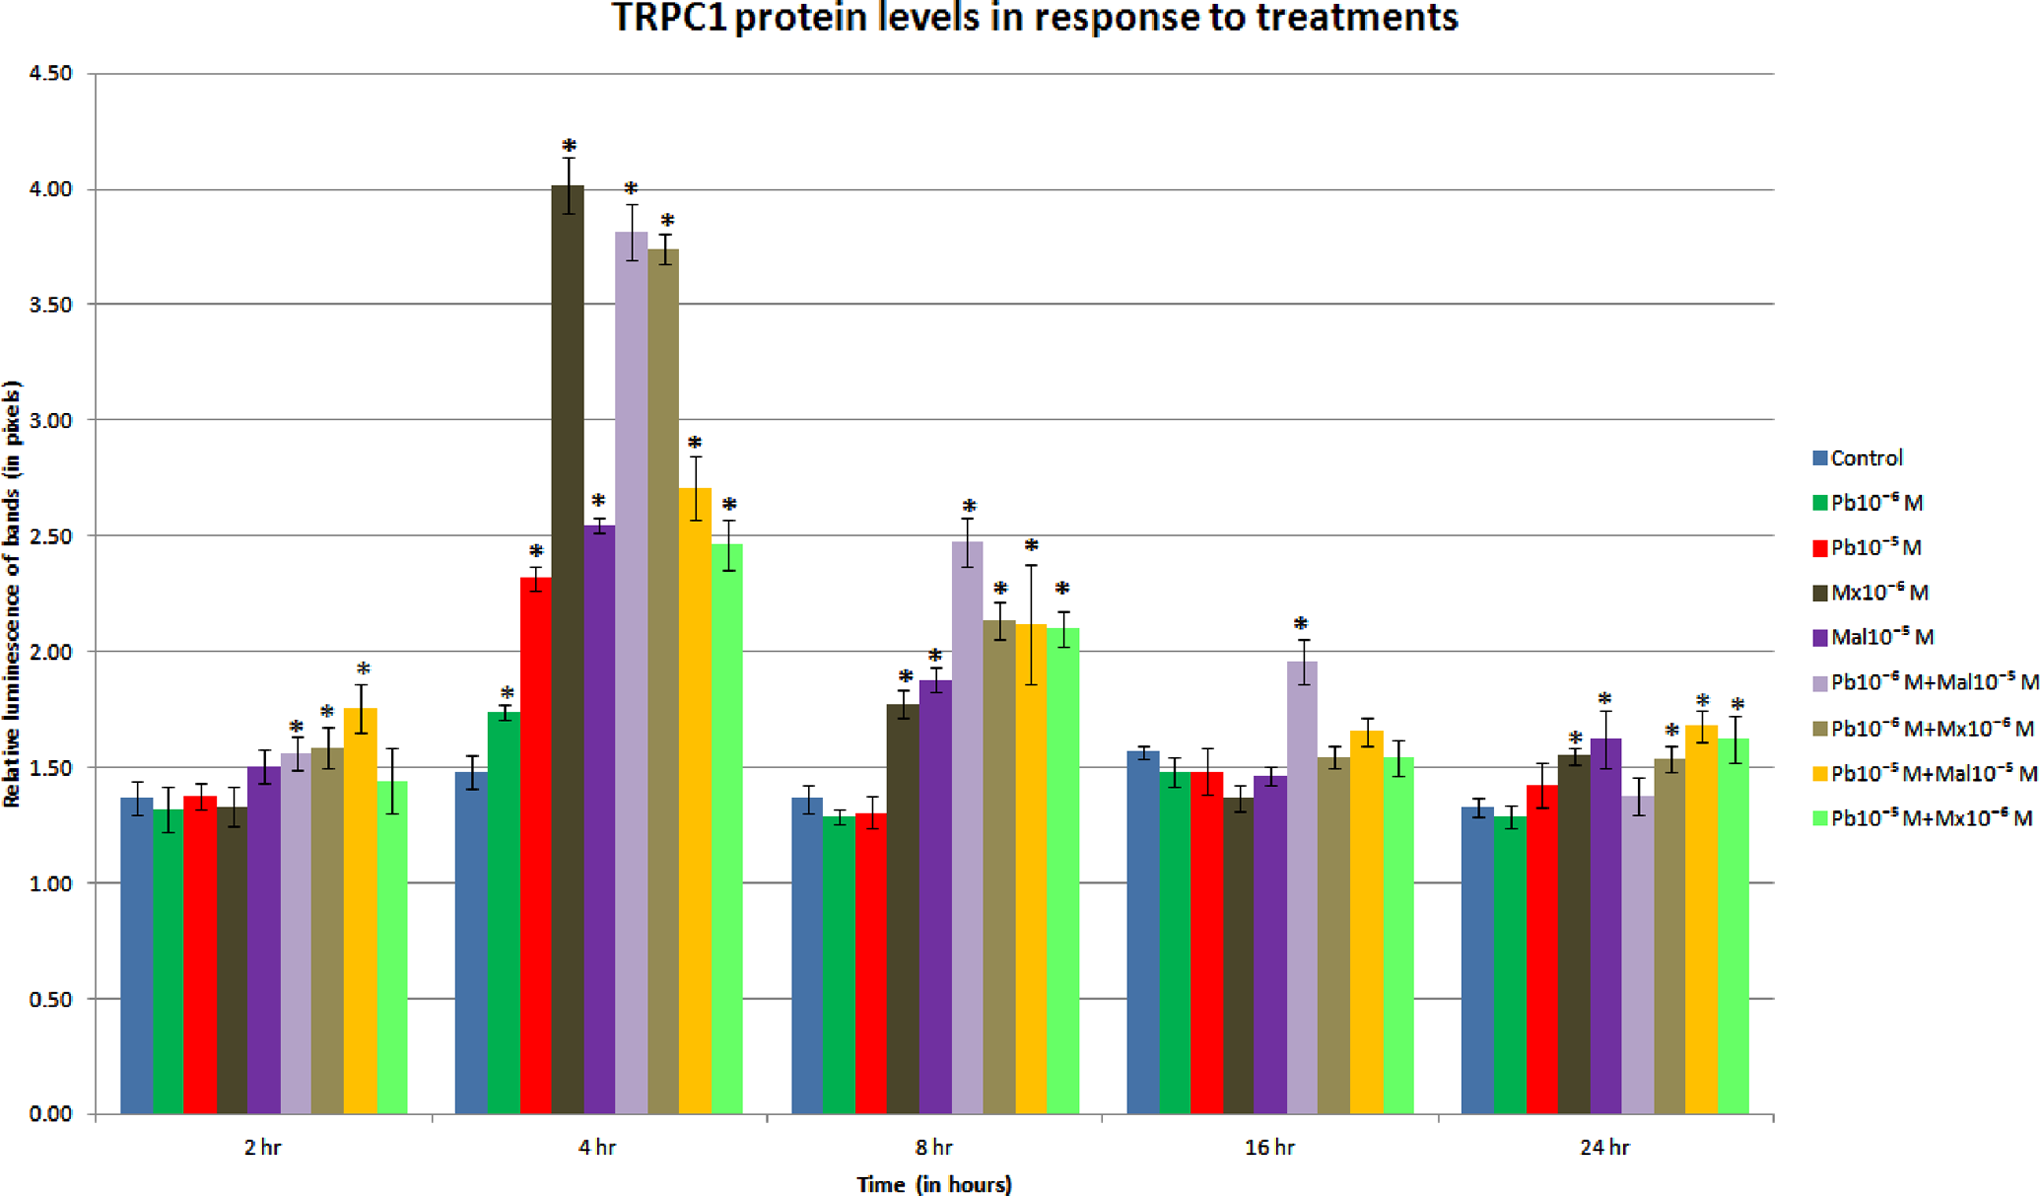
Transient receptor potential canonical channel (TRPC1) protein levels in response to treatment. Levels increased for the 4-hour period, with the combinations elevating the levels of TRPC1 protein more than the compounds alone (P < .01) except for Mx 10−6 M. At 8 hours, only the combinations and the organophosphates maintain the increased levels of protein (P < .05). Pb indicates lead; Mx, malaoxon; Mal = malathion.
The results for experiments determining TRPC4 protein levels showed time-related differences when compared with the levels of TRPC1 protein (Figure 2). There were marked increases in TRPC4 protein levels at 2 and 4 hours but not at 8 hours. In contrast, TRPC1 still showed increases at 8 hours. With the exception of Pb10−6 M and its combination with Mx 10−6 M, TRPC4 protein levels increased at 2 hours for all treatments (P < .01). However, after 4 hours of treatment, only the Pb10−5 M (P < .01), Mal10−5 (P < .01), Mx 10−6 (P < .01), and Pb10−6 M + Mx 10−6 M (P < .05) maintained increased levels of TRPC4 protein (Figure 2).
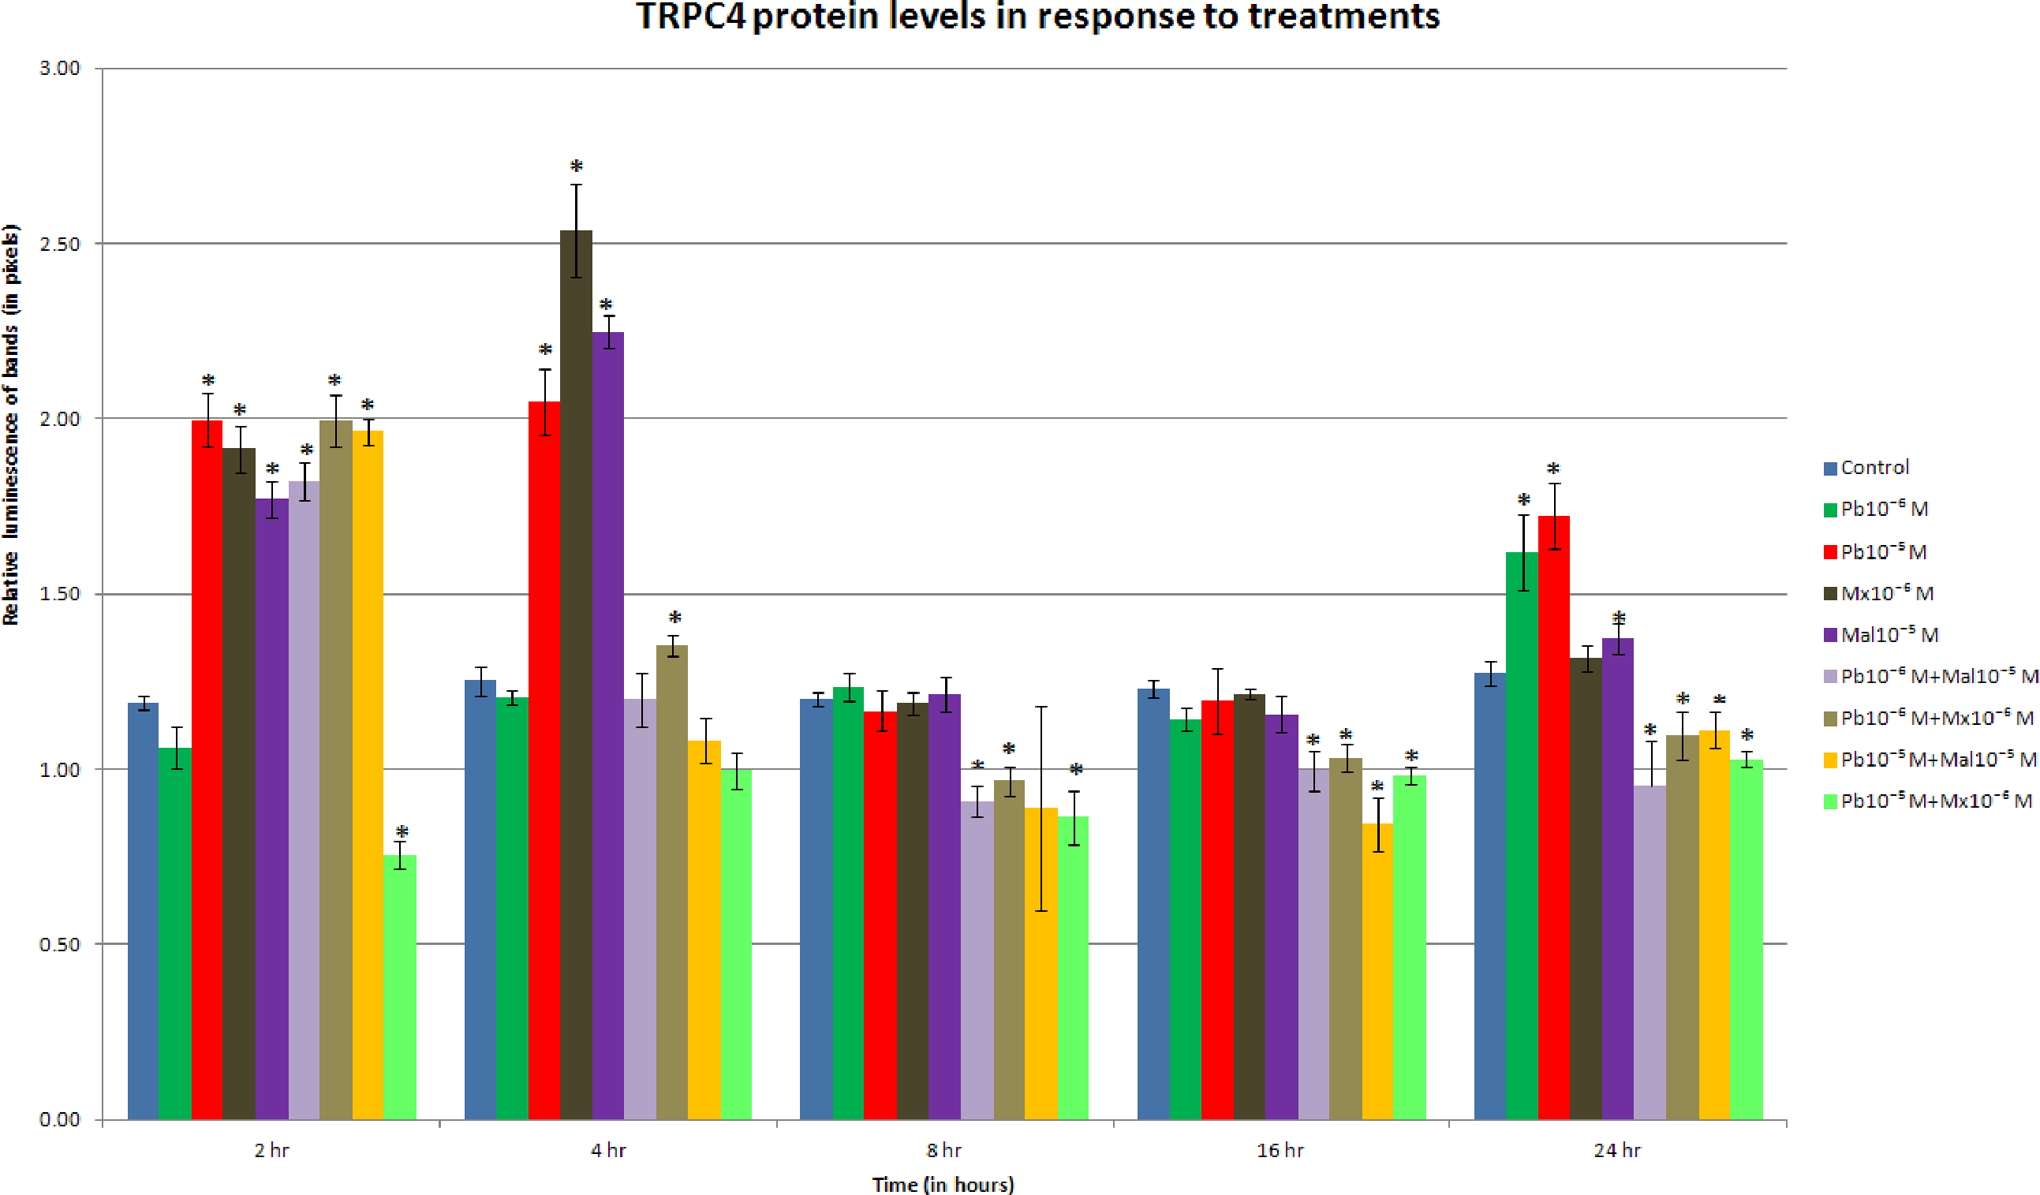
Transient receptor potential canonical channel (TRPC4) protein levels in response to treatment. Protein levels increased at the 2-hour period for both compounds alone and combinations (P < .01), with the exception of the lowest concentration of lead and the Pb10−5 M + Mx 10−6 M combination. At 8 and 16 hours combinations decreased protein levels (P < .05), a trend that continued to the 24-hour period.
Increases in gene expression for TRPC1, as shown in Figure 3A, were noted in cells exposed to both organophosphates and the highest concentration of lead alone at 4 hours (P < .05). At 8 hours, however, only the organophosphates were still showing a 2-fold increase in TPRC1 gene expression. Combinations of neurotoxicants significantly increased TRPC1 gene expression at 4 hours with P values less than .01 for all treatments (Figure 3B). Furthermore, at 24 hours, the gene expression was still upregulated for all combination treatments except for Pb10−6 M + Mal10−5 M.
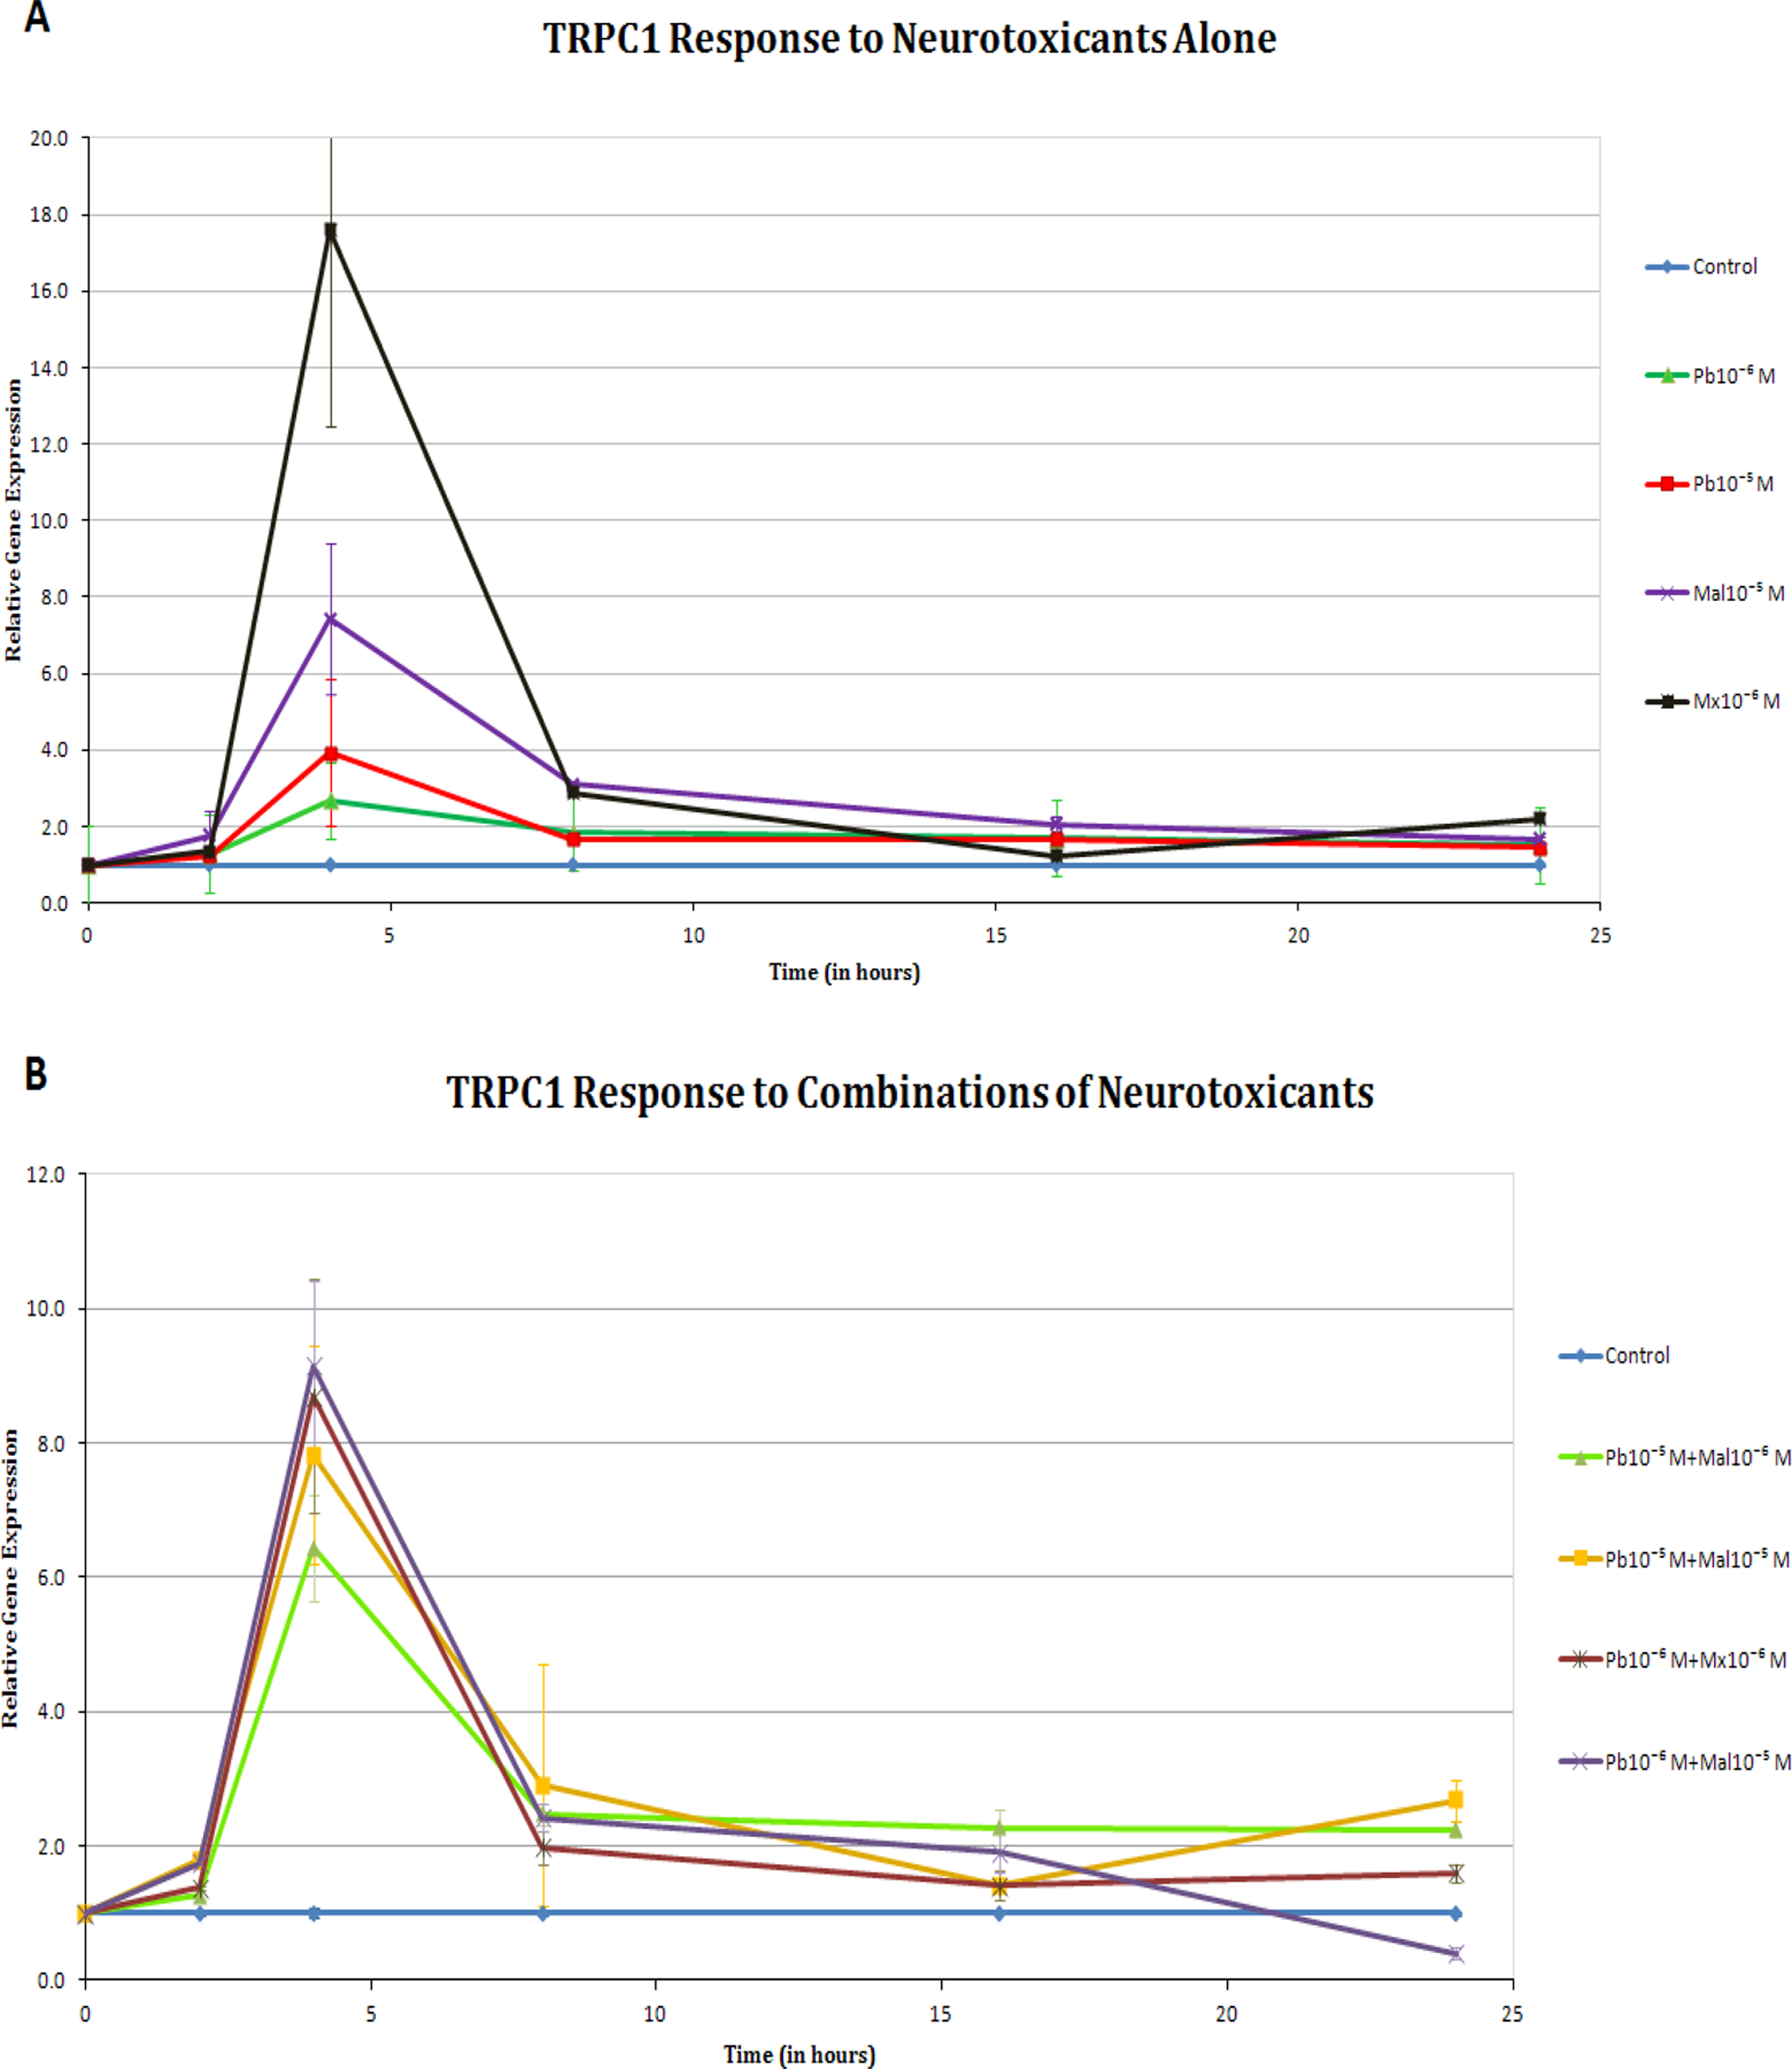
A, Transient receptor potential canonical channel (TRPC1) response to neurotoxicants alone. Gene expression was increased significantly for all the compounds at the 4-hour period (P < .05), especially for malaoxon (Mx 10−6 M; P < .01). B, TRPC1 response to combinations of neurotoxicants. Gene expression significantly increased at the at the 4-hour period for all the combinations (P < .01). The expression of the gene was still above the control levels at 24 hours (P < .05), with the exception of the Pb10−6 M + Mx 10−6 M combination.
The pattern of TRPC4 gene expression differed from that of TRPC1. For example, the response to treatments with neurotoxicants alone was increased significantly earlier, with effects seen at 2 and 4 hours (P < .01) except for the lowest lead (Pb10−6 M) concentration (Figure 4A). Increases in TRPC4 gene expression occurred after exposure to both the lead and the organophosphates alone at 24 hours. In contrast to this increased gene expression in cells that were exposed to single neurotoxicants, no combinations of neurotoxicants significantly increased TRPC4 gene expression at 16 and 24 hours (Figure 4B).
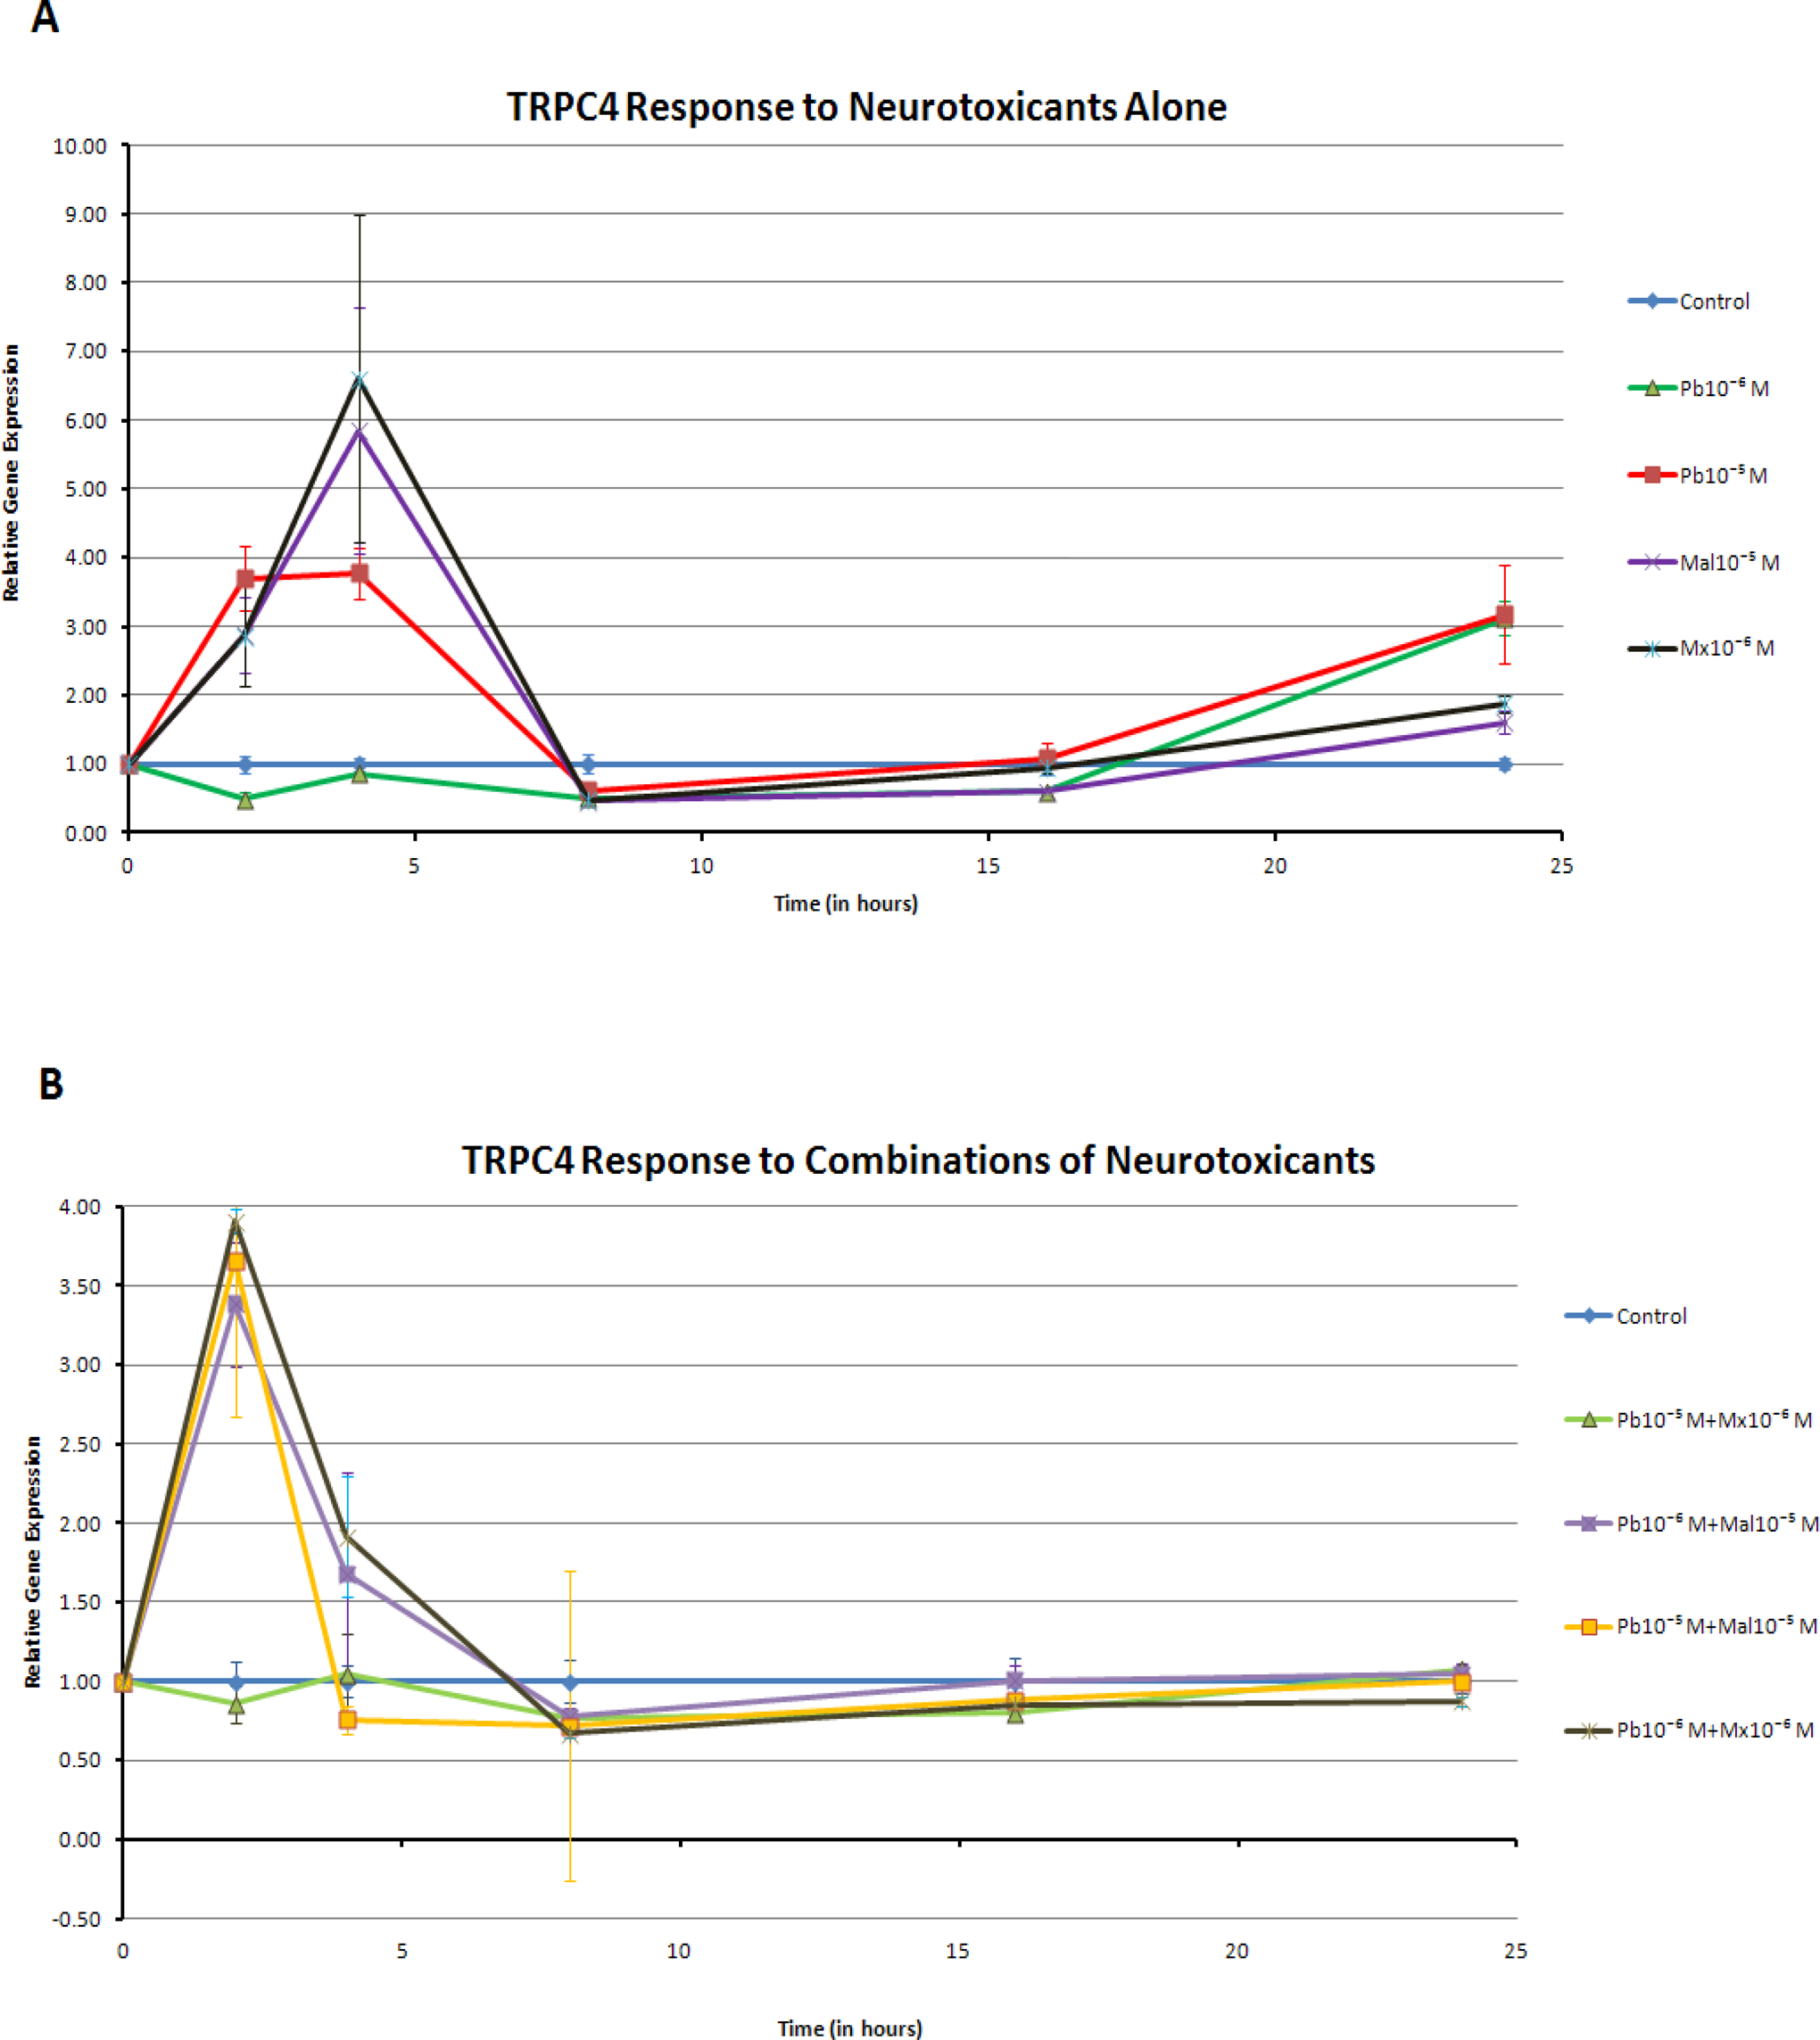
A, Transient receptor potential canonical channel (TRPC4) response to neurotoxicants alone. Gene expression was increased by all the compounds alone at 2 hours and especially at 4 hours (P < .01). The exception was Pb10−6 M which decreased gene expression at 2 hour (P < .05). At 24 hours, however, all compounds were noted to increase TRPC4 expression when compared to controls (P < .05). B, TRPC4 response to combinations of neurotoxicants. Combinations of neurotoxicants increased TRPC4 gene expression at 2 hours (P < .01), with the exception of Pb10−5 M + Mx 10−6 M. At 16 and 24 hours, however, combinations significantly decreased TRPC4 gene expression (P < .05). Pb10−5 M + Mx 10−6 M decreased gene expression at all times (P < .05).
Protein and gene expression of TRPC1/TRPC4 were elevated by treatment with lead and malathion. The TRPC1/TRPC4 may be associated with store-operated intracellular calcium-signaling pathways. Therefore, we examined the effects of lead and malathion on basal and thapsigargin-stimulated intracellular free calcium 2 and 4 hours after treatments. Thapsigargin depletes intracellular calcium stores via a slow leakage and activates subsequent calcium influx through store-operated channels, which are believed to be related to TRPC. Hence, its use gives an approximate picture of the total flux through the capacitative or store-operated calcium influx pathway. Since TRPC1/TRPC4 may be associated with store-controlled calcium entry, we hypothesized that the altered protein and gene expression of TRPC1/TRPC4 after toxicant treatment would alter the dynamics of store-operated calcium entry as evidenced with thapsigargin treatment.
As shown in Figure 5A, 2-hour treatment with lead increased the basal (unstimulated) intracellular free calcium by 30% to 38% at the 10−5 M and 10−6 M concentrations. Malathion 10−5 M increased basal intracellular free calcium in a similar manner (35%-50%). After a 2-hour treatment with 10−5 M and 10−6 M lead or malathion 10−5M, the thapsigargin-stimulated intracellular free calcium elevation (Figure 5B) was higher when compared with the increases in basal intracellular free calcium shown in Figure 5A (2-fold increase Figure 5A vs B). Nevertheless, when increases in the treatments are compared with control for just the thapsigargin-stimulated intracellular free calcium, there are no statistically significant differences among groups.
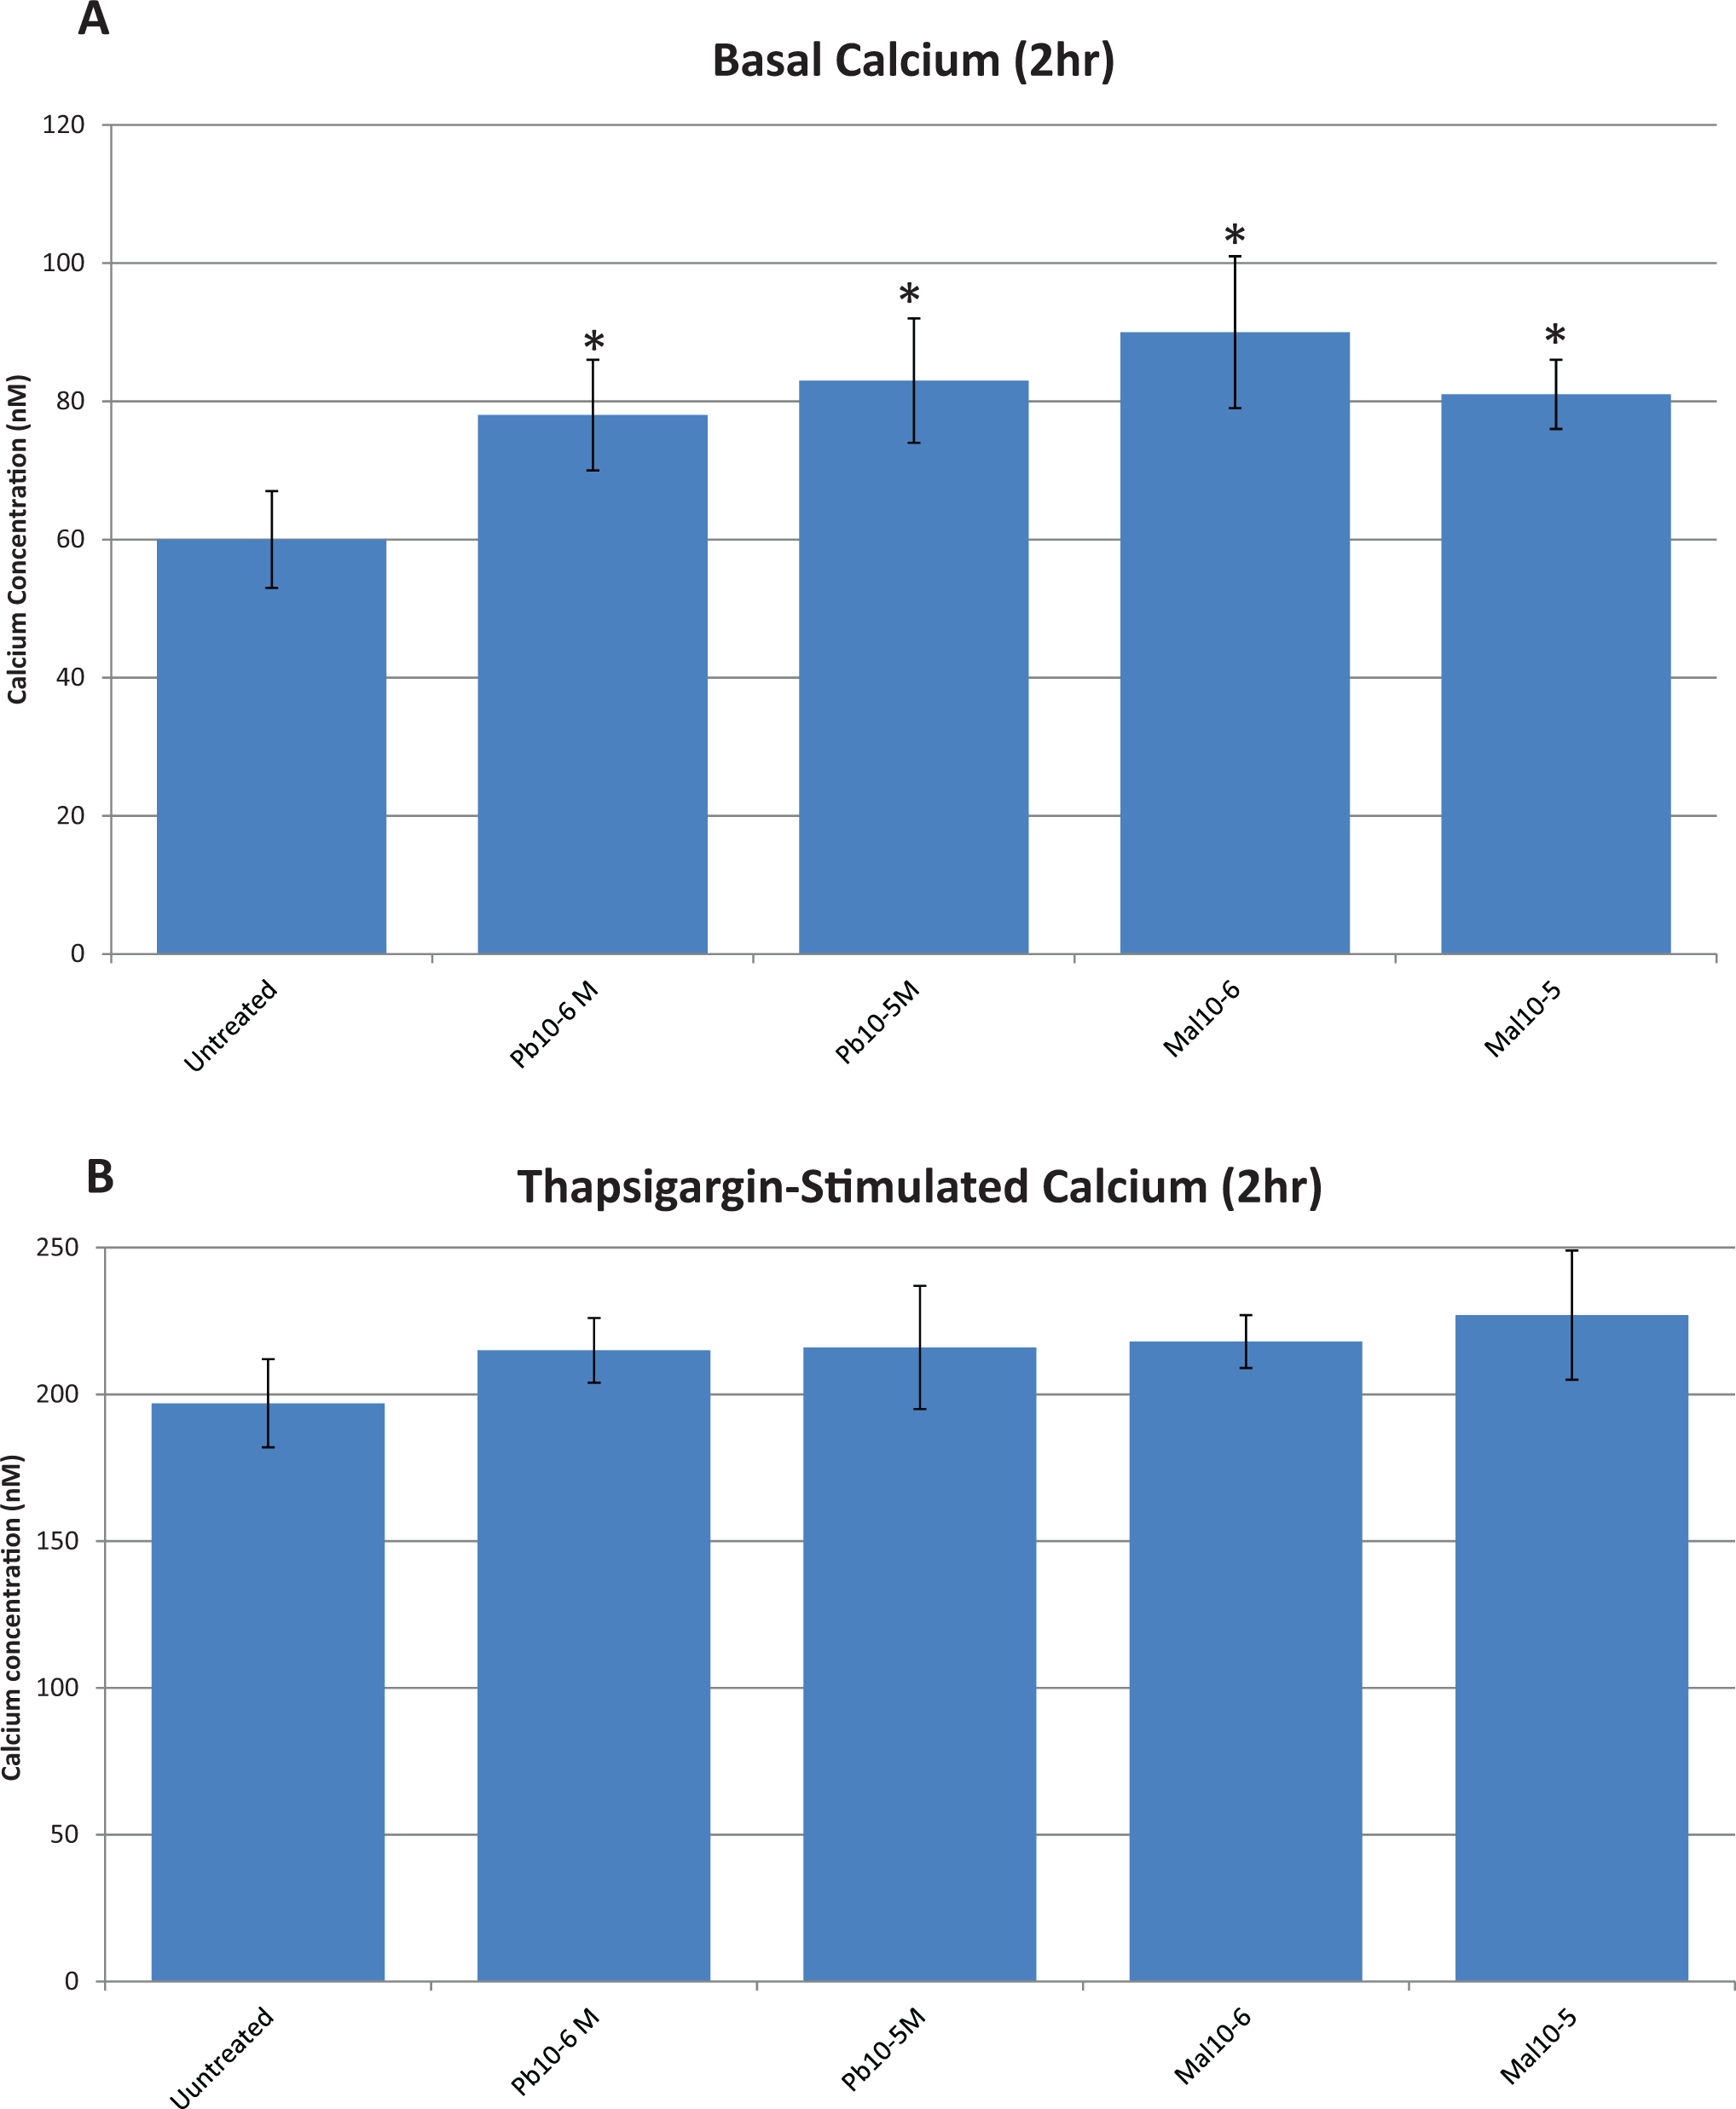
A, Effect of lead (Pb) and malathion (Mal) on basal intracellular free calcium in rat brain endothelial cells (RBE4s) after 2 hours of exposure. Asterisks (*) indicate values statistically different from untreated control cells, P < 0.01. B, Effect of lead and malathion on thapsigargin-stimulated intracellular free calcium in rat brain endothelial cells (RBE4s) after 2 hours of exposure.
Figure 6 shows basal (6A) and thapsigargin-stimulated (6B) increases in intracellular free calcium after a 4-hour exposure to lead or malathion. Basal levels of intracellular free calcium were significantly elevated by both lead and malathion compared to control levels (P < .05) at 4 hours, although comparisons of increases among treatments with each other were not statistically significant. At 4 hours, the levels of thapsigargin-stimulated intracellular free calcium increased significantly (P < .01) when compared with those of unstimulated (basal) intracellular free calcium for the same time period (Figure 6A vs B). Furthermore, treatments with both concentrations of lead and malathion increased the calcium levels for all groups when compared with the controls (Figure 6A and B). When calcium level increases among treatments were compared, only the thapsigargin-stimulated group showed a dose–response increase among treatments (Figure 6B).
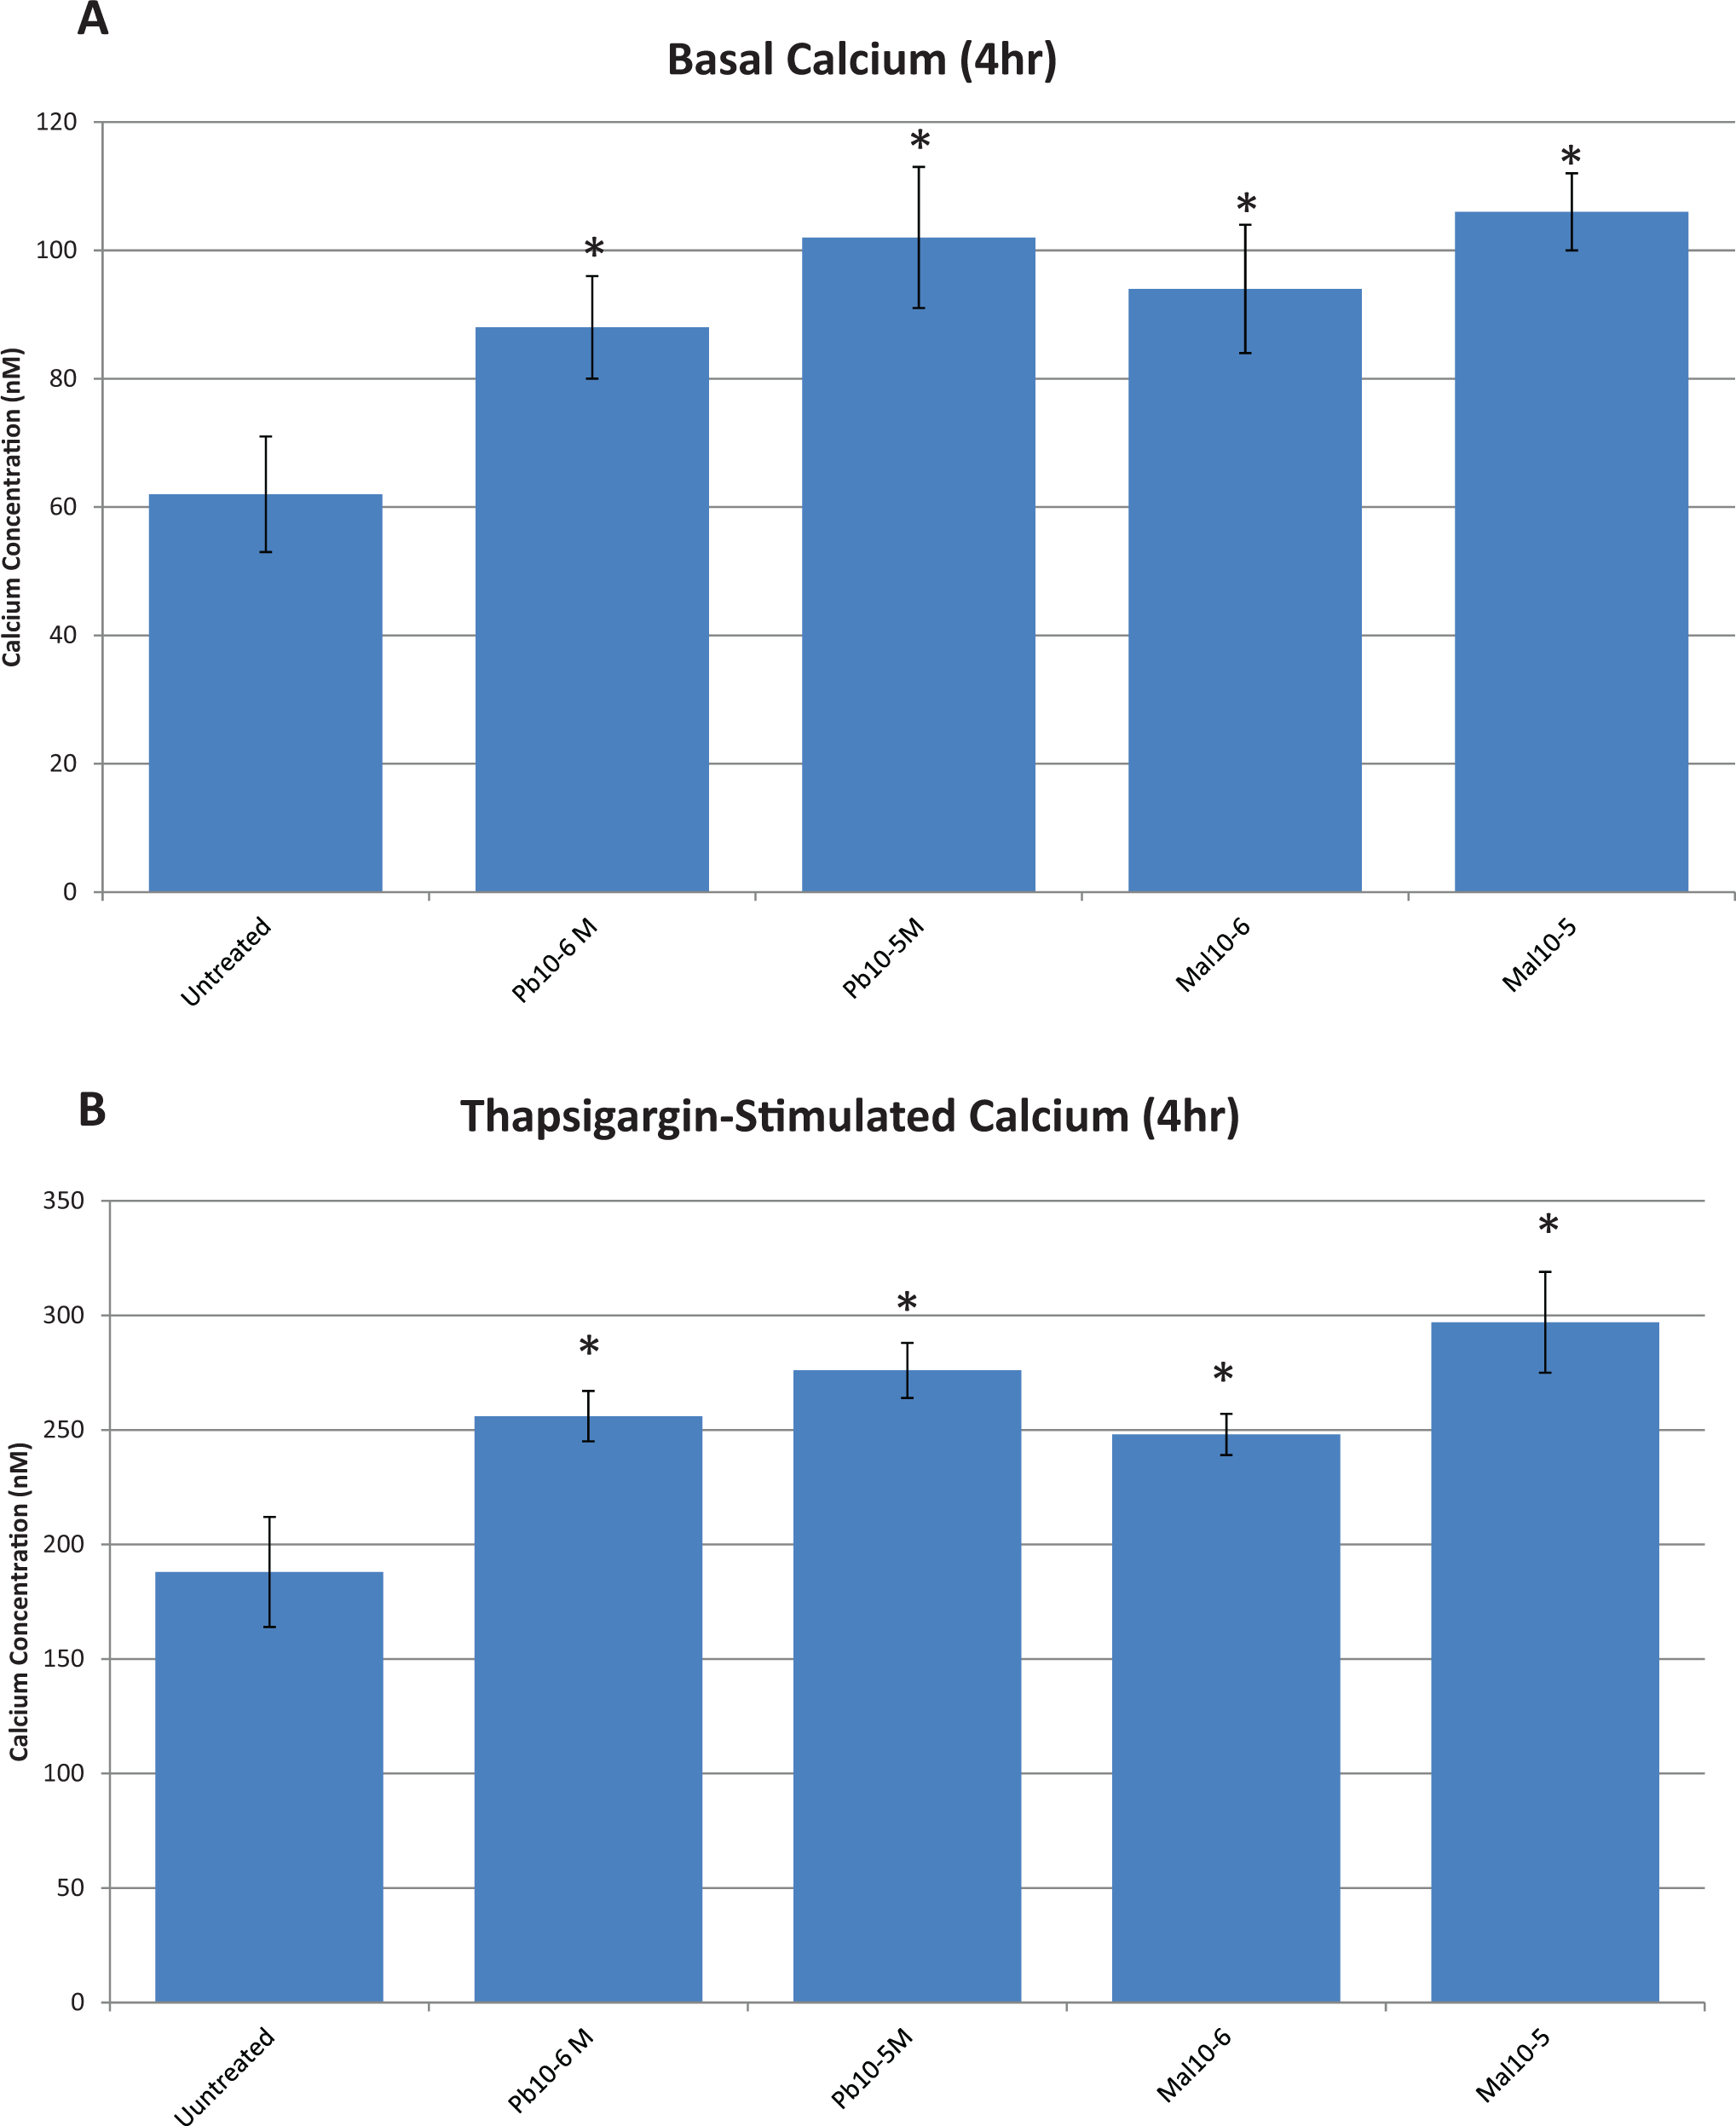
A, Basal intracellular free calcium in rat brain endothelial cells (RBE4s) following 4 hours of exposure to lead (Pb) and malathion. Asterisks (*) indicate values significantly different from untreated control cells, P < .01. B, Effect of lead (Pb) and malathion (Mal) on thapsigargin-stimulated intracellular free calcium in rat brain endothelial cells (RBE4s) after 4 hours of exposure. Asterisks (*) indicate significant differences when compared to untreated controls, P < .01.
Increases in basal and thapsigargin-stimulated intracellular free calcium declined to levels similar to untreated controls after 8 hours of treatment, suggesting the observed effects may be early events in the toxicological pathway that results in failure of BBB integrity. Although malaoxon and combinations of the neurotoxicants were assessed, no further changes in intracellular free calcium were noted.
Discussion
The TRPCs are associated with permeability in endothelial cells of the BBB. 3 ,20 Activation of these channels may be associated with increases in intracellular free calcium originating from depletion of calcium from stores of the endoplasmic reticulum followed by subsequent influx of extracellular calcium. 2 ,3,30 In turn, these increases in intracellular free calcium may be associated with endothelial cell permeability, 3 which can cause BBB disruption. Our results noted a marked increase in protein levels of TPRC1 measured by Western blot, which is in accordance with the increases in TRPC1 gene expression measured by real-time PCR. The increases in TRPC1 protein and gene expression denote increased presence of TRPCs in the cell membranes especially at 4 hours. However, this does not signify activation of such channels. Actual activation of these channels is followed by increases in intracellular free calcium, which may in turn activate several calcium-dependent pathways. For example, increases in calcium can activate proteases such as metalloproteinases that are associated with tight junction proteolysis, 31 ,32 inducing in the process increases in permeability of the BBB.
The results of the present study indicate that neurotoxicants lead and malathion considerably increase TRPC1 levels, which may induce increases in TRPCs in cell membranes. Because intracellular free calcium rises as well, we propose that the elevation in basal intracellular free calcium after lead and malathion exposure may be due to upregulated TRPC1/TRPC4 basal activity or dysregulation of TRPC1-/TRPC4-associated channels. Furthermore, it is possible that activation and/or increase in TRPCs may be at least one of the mechanisms by which these neurotoxicants increase the BBB permeability noted in our previous work. 14 The increases in basal and thapsigargin-stimulated intracellular free calcium declined to normal levels after 8 hours of treatment, suggesting the observed effects may be early events in the toxicological pathway that results in the failure of BBB integrity. Furthermore, combinations of lead and malathion produced no further changes in intracellular free calcium, compared to that produced by each toxicant individually (data not shown), suggesting the effects were not additive.
The TRPC4 protein levels were increased by the treatments with the neurotoxicants alone; however, no clear additive effects of combinations were seen. This was substantiated with the measurements of gene expression by real-time PCR. These results suggest the need for further studies to determine whether these compounds might compete for the same mechanism of action during the early stages of mixture treatments. Further studies are needed to clarify the nature of the effects seen here with lead and malathion. Decreases in TRPC4 levels would indicate smaller quantity of TRPCs in the membrane of RBE4 cells if the TRPC4 subunit could form homomeric channels; however, in most cases TRPC4 subunits associate with TRPC1 subunits to form functional heteromeric channels. 17 The percentage of each subunit present in heteromeric channels, however, has not yet been reported. The TRPC1 also has been demonstrated to form homomeric channels, but its functionality is decreased. 33 The differences and ratios of the heteromeric channels or even the presence of homomeric channels for both TRPC1 and TRPC4 may be a factor in the differences noted in increases of the TRPC1 levels at 4 hours but at 2 hours for TRPC4. Therefore, identification of the number of subunits in each channel in a mixed population of TRPC1/TRPC4 heteromeric channels would allow us to assess whether the variation in protein levels for both subunits could modify increases in permeability on the BBB induced by lead and malathion.
In previous studies in our laboratory with a BBB system that allowed polarity, the RBE4 cells on the luminal side of the model sequestered considerably less lead compared to another model constructed with bovine brain endothelial cells. 14 This may be relevant in assessing the TRPC1 and TRPC4 protein levels in RBE4 cells since lead affects kinases that modulate expression and activation of TRPCs. Moreover, Sukumar and Beech reported activation of TRPC5 channels at micromolar concentrations of lead. 34 Since the RBE4s utilized in this experiment are the same utilized in our BBB system mentioned above, we can expect similar results utilizing this BBB system with an apical and a basolateral side. Furthermore, the increases in TRPCs noted in this work and their association with increases in endothelial permeability are in agreement with previous work from our laboratory, which demonstrated that these neurotoxicants increased BBB permeability 14 and decreased tight junction proteins in the endothelial cells forming the luminal layer of the BBB. 16
The present study noted early increases in the levels of protein and in gene expression for TRPC1 and TRPC4, as well as increases in intracellular free calcium in response to treatments with lead and malathion. This agrees with most reported studies, although some authors reported no effect of lead on basal [Ca2+]i. 35 ,36 Nevertheless, the early increases in gene expression and protein levels of the TRPC subunits and the increases in intracellular free calcium in the endothelial cells of the rat BBB (RBE4 cells) reported in this work suggest that these increases are a component of the mechanism by which lead and malathion contribute to changes in BBB permeability and, therefore, damage tight junction structures.
Footnotes
The author(s) declared no potential conflicts of interest with respect to the research, authorship, and/or publication of this article.
This research was funded by Virginia-Maryland Regional College of Veterinary Medicine.