
Abstract
Aqueous polymer dispersions are important raw materials used in a variety of industrial processes. They may contain particles with diameters ranging from 10 to 1500 nm. Polymer exposure alone may cause pulmonary lesions after inhalation exposure. Polymer dispersions with increased proportions of nano-sized particles are being developed for improved material characteristics, and this may pose even increased pulmonary hazards upon potential inhalation exposure. In a 5-day screening study, male rats were nose-only exposed to aerosols generated from 2 dispersions of acrylic ester polymers with identical chemical composition but different nano-sized particle proportions at particle concentrations of 3 and 10 mg/m3. Immediately and 19 days after the end of inhalation, necropsies were conducted with major emphasis on respiratory tract histopathology. Three and 23 days after the end of inhalation, bronchoalveolar lavage was performed to screen for early pulmonary injury and inflammation. In contrast to the adverse effects known for other materials in short-term inhalation studies, none of the tested preparations of acrylic ester polymers elicited any adverse effect at the end of the inhalation or postinhalation periods. No shift in toxicity could be observed by the increased proportion of nano-sized polymer particles. Under the conditions of this study, the no observable adverse effect levels for both preparations were >10 mg/m3, that is 2- to 3-fold beyond current nuisance dust threshold limit values.
Keywords
Introduction
Aqueous polymer dispersions are made by polymerizing different monomers using emulsion polymerization techniques in water. The resulting dispersions contain copolymer particles with a specific particle size distribution. They may contain particles with diameters ranging from 10 to about 1500 nm. Today millions of tons of polymer dispersions are used as binders in a wide variety of waterborne applications such as adhesives, paints, coatings, paper and paper board coating, nonwoven fabrics, carpets, construction materials, and textile finishing agents. In some of these applications, airborne aerosols may arise that may lead to occupational exposure.
A variety of acrylic and styrene–acrylic polymer dispersions were tested in standard toxicological assays. Such dispersions were not mutagenic in bacterial mutagenicity assays, they did not show acute toxicity at doses up to 2 g/kg body weight by oral administration, and they did not show sensitizing activity (ref 1 and BASF SE, unpublished results). Thus, according to the overall toxicological profile of this class of materials, no hazard warning labels are required according to European Union 2 and Globally Harmonized System of Classification (GHS) and Labeling of Chemicals 3 standards. The low general toxicity can be explained by the high molecular weight and the low bioavailability. For airborne exposure, this type of material is currently regulated as nuisance dust with a threshold limit value for the respirable fraction of 3 to 5 mg/m3. However, depending on their chemical and physical characteristics, such aerosols may be irritating to the respiratory tract after inhalation exposure, which requires further investigation.
Besides the intrinsic chemical toxicity of such copolymers, the size distribution of the polymer particles needs to be considered in the evaluation of their inhalation toxicity. In order to meet the demand for diverse materials with different characteristics for different applications, manufacturing conditions can be adapted to generate increasing proportions of nano-sized particles in acrylic ester polymer dispersions. Over the past several years, the awareness of the potential hazards associated with nano-sized structures has increased, 4,5 in particular after airborne exposure and inhalation, because of the concerns that arose regarding chronic diseases associated with the exposure to ultrafine ambient particles. 6
A short-term inhalation assay has recently been developed suitable for toxicological screening or comparative ranking of particle aerosols, in particular in the nano-sized range. 7 This type of assay has demonstrated to be quite predictive of the results of subchronic inhalation studies with various types of particles, such as amorphous and crystalline silica, 8,9 metal oxides, 7,10 or multiwalled carbon nanotubes. 11 The most sensitive and robust end points in these inhalation studies were changes in the humoral and cellular composition of the bronchoalveolar lavage fluid (BALF), indicative of inflammatory reactions. Clinical and histopathological examinations, in particular for epithelial changes in the respiratory tract, have also been included in these short-term inhalation studies. In order to screen for delayed occurrence or the potential reversal of findings, these tests usually have combined examination schedules at or around the end of the inhalation period and after selected postinhalation periods. 7
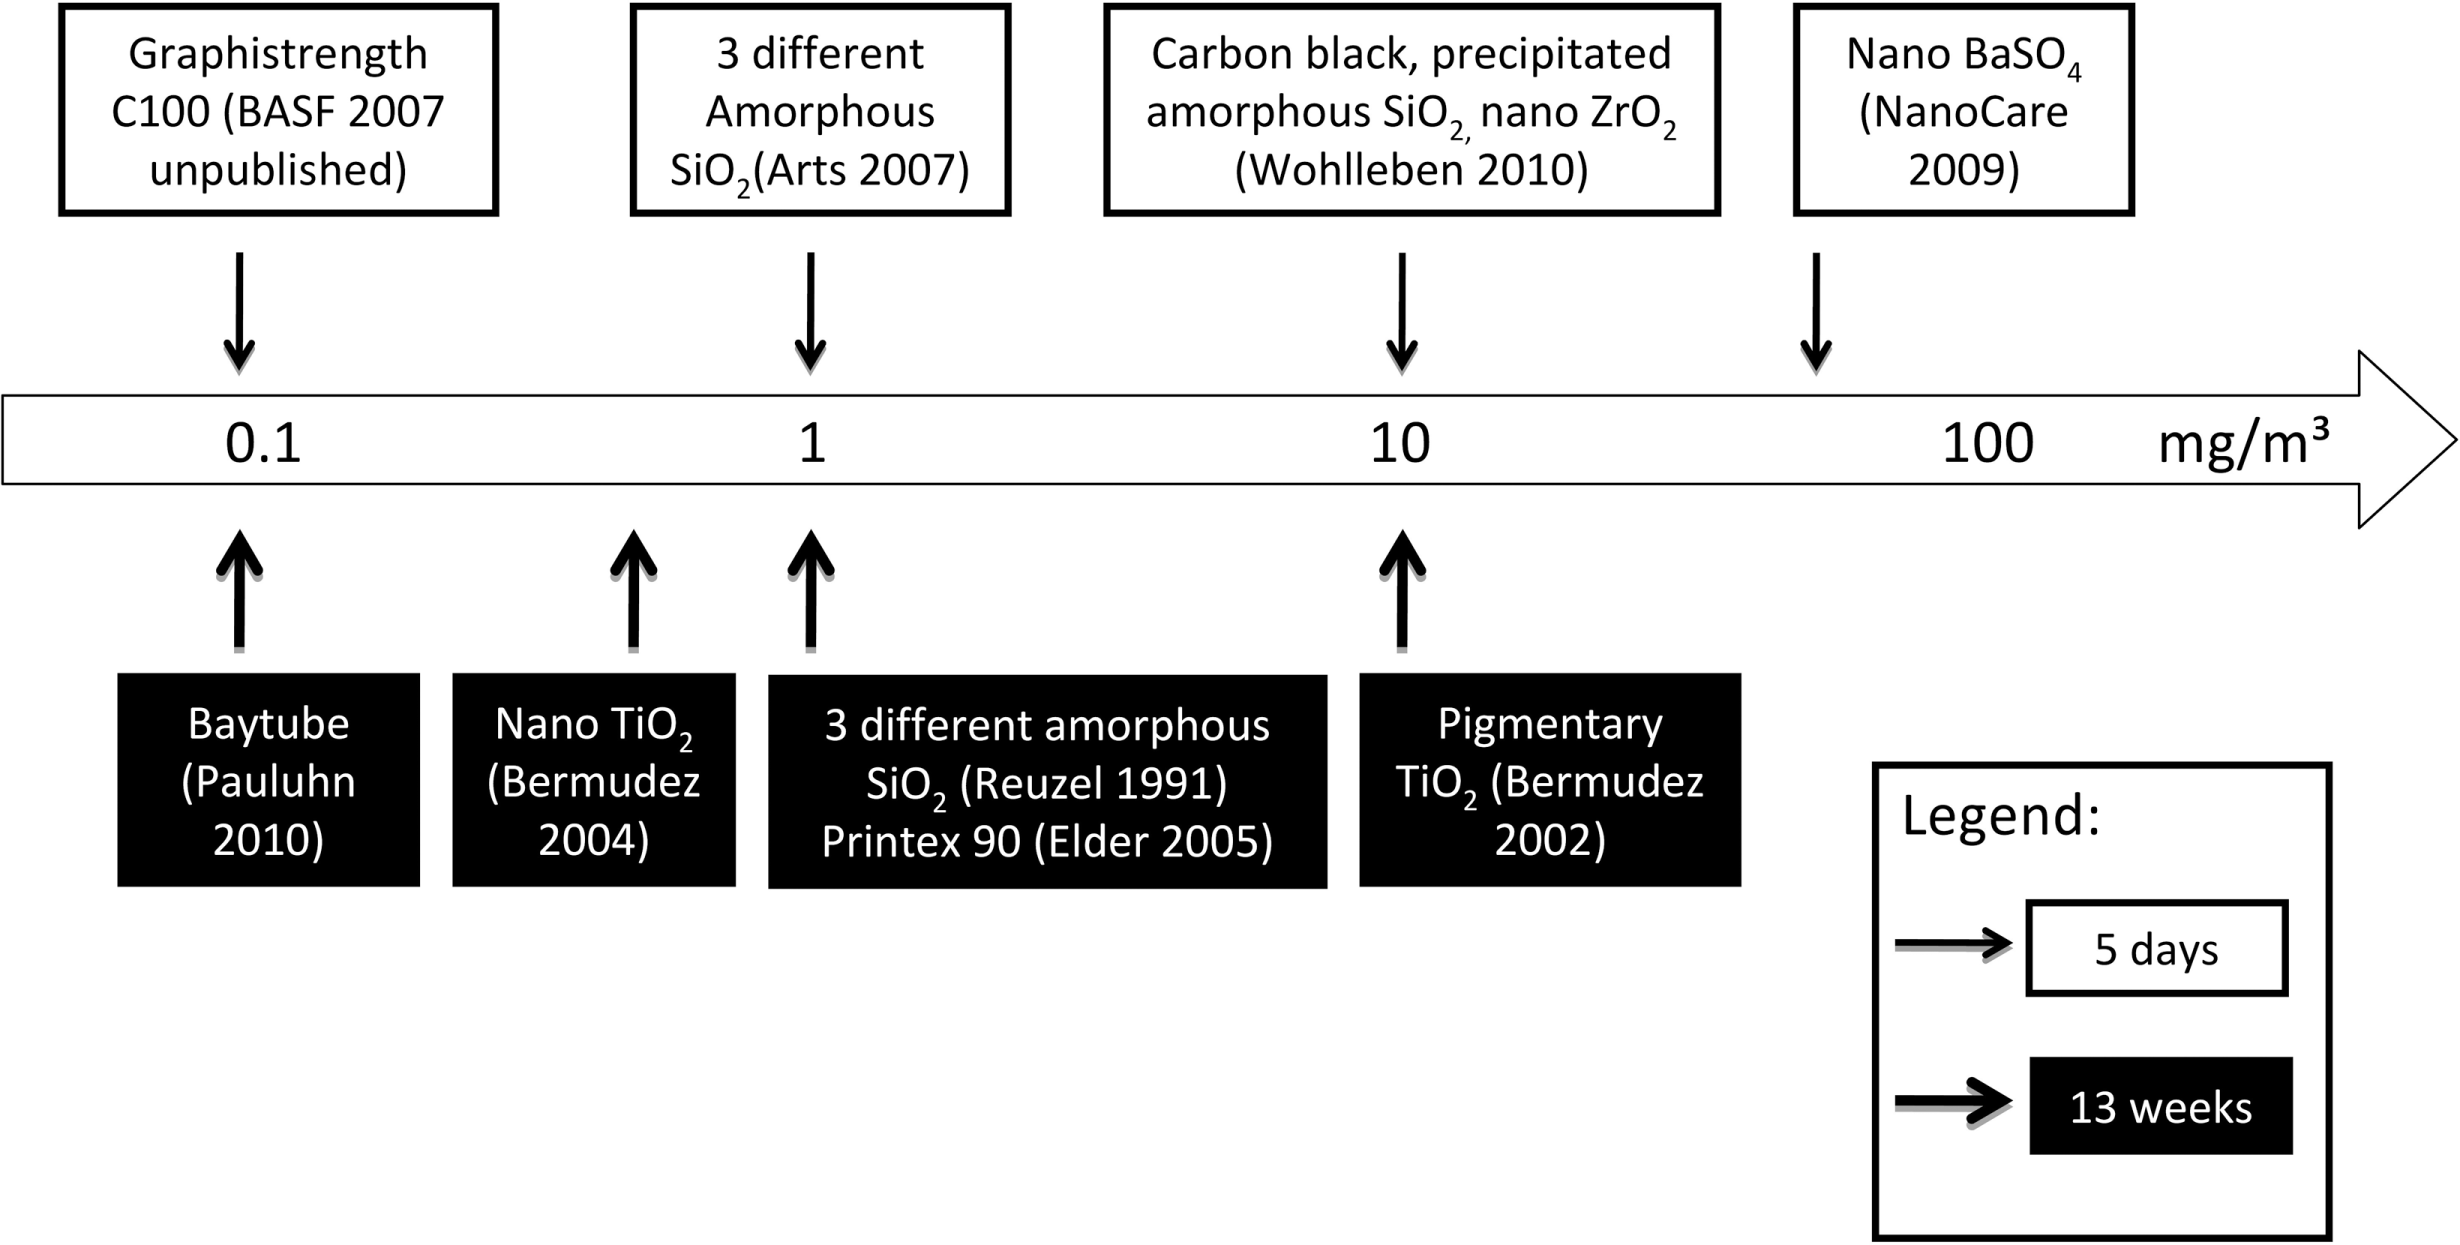
Such short-term assays may particularly be useful to screen new particle formulations for a potential inhalation hazard. In the current study, 2 chemically identical water-based dispersions of acrylate copolymers were investigated, which only differ by the proportion of nano-sized particles in the raw material dispersions. The test materials were aerosolized by nebulization of the diluted dispersions. Comprehensive physicochemical characterization of the test materials was performed. Male rats were used because of prior experience with this test system and the recommendations in applicable regulatory guidances. 12,13 Exposure concentrations were selected at and beyond occupational exposure levels for respirable nuisance dust and in the responsive range of previous rat inhalation studies with acrylic ester polymers. In acute to subchronic rat inhalation studies with aerosols from acrylate copolymer dispersions, systemic toxicity was not observed, but concentration-dependent morphological and inflammatory changes were recorded in the lower respiratory tract (refs 1 and 14 and BASF SE, unpublished studies). The lowest observed adverse effect levels (LOAELs) in 1- to 13-week inhalation studies differed by 2 orders of magnitude, with the lowest LOAEL at 1 mg/m3 (Figure 1). For other organic polymers, such as ethylene oxide/propylene oxide polymers, which also showed relatively low toxicity by dermal, oral, or ocular routes of administration, pronounced inhalation toxicity was again observed for some but not all types of polymers at concentrations of 0.3 to 5 mg/m3. 15 –17 At similar exposure concentrations, inhalation of other materials was found to induce effects in this short-term test system, with sensitivities depending on the actual material characteristics. 7,10,11
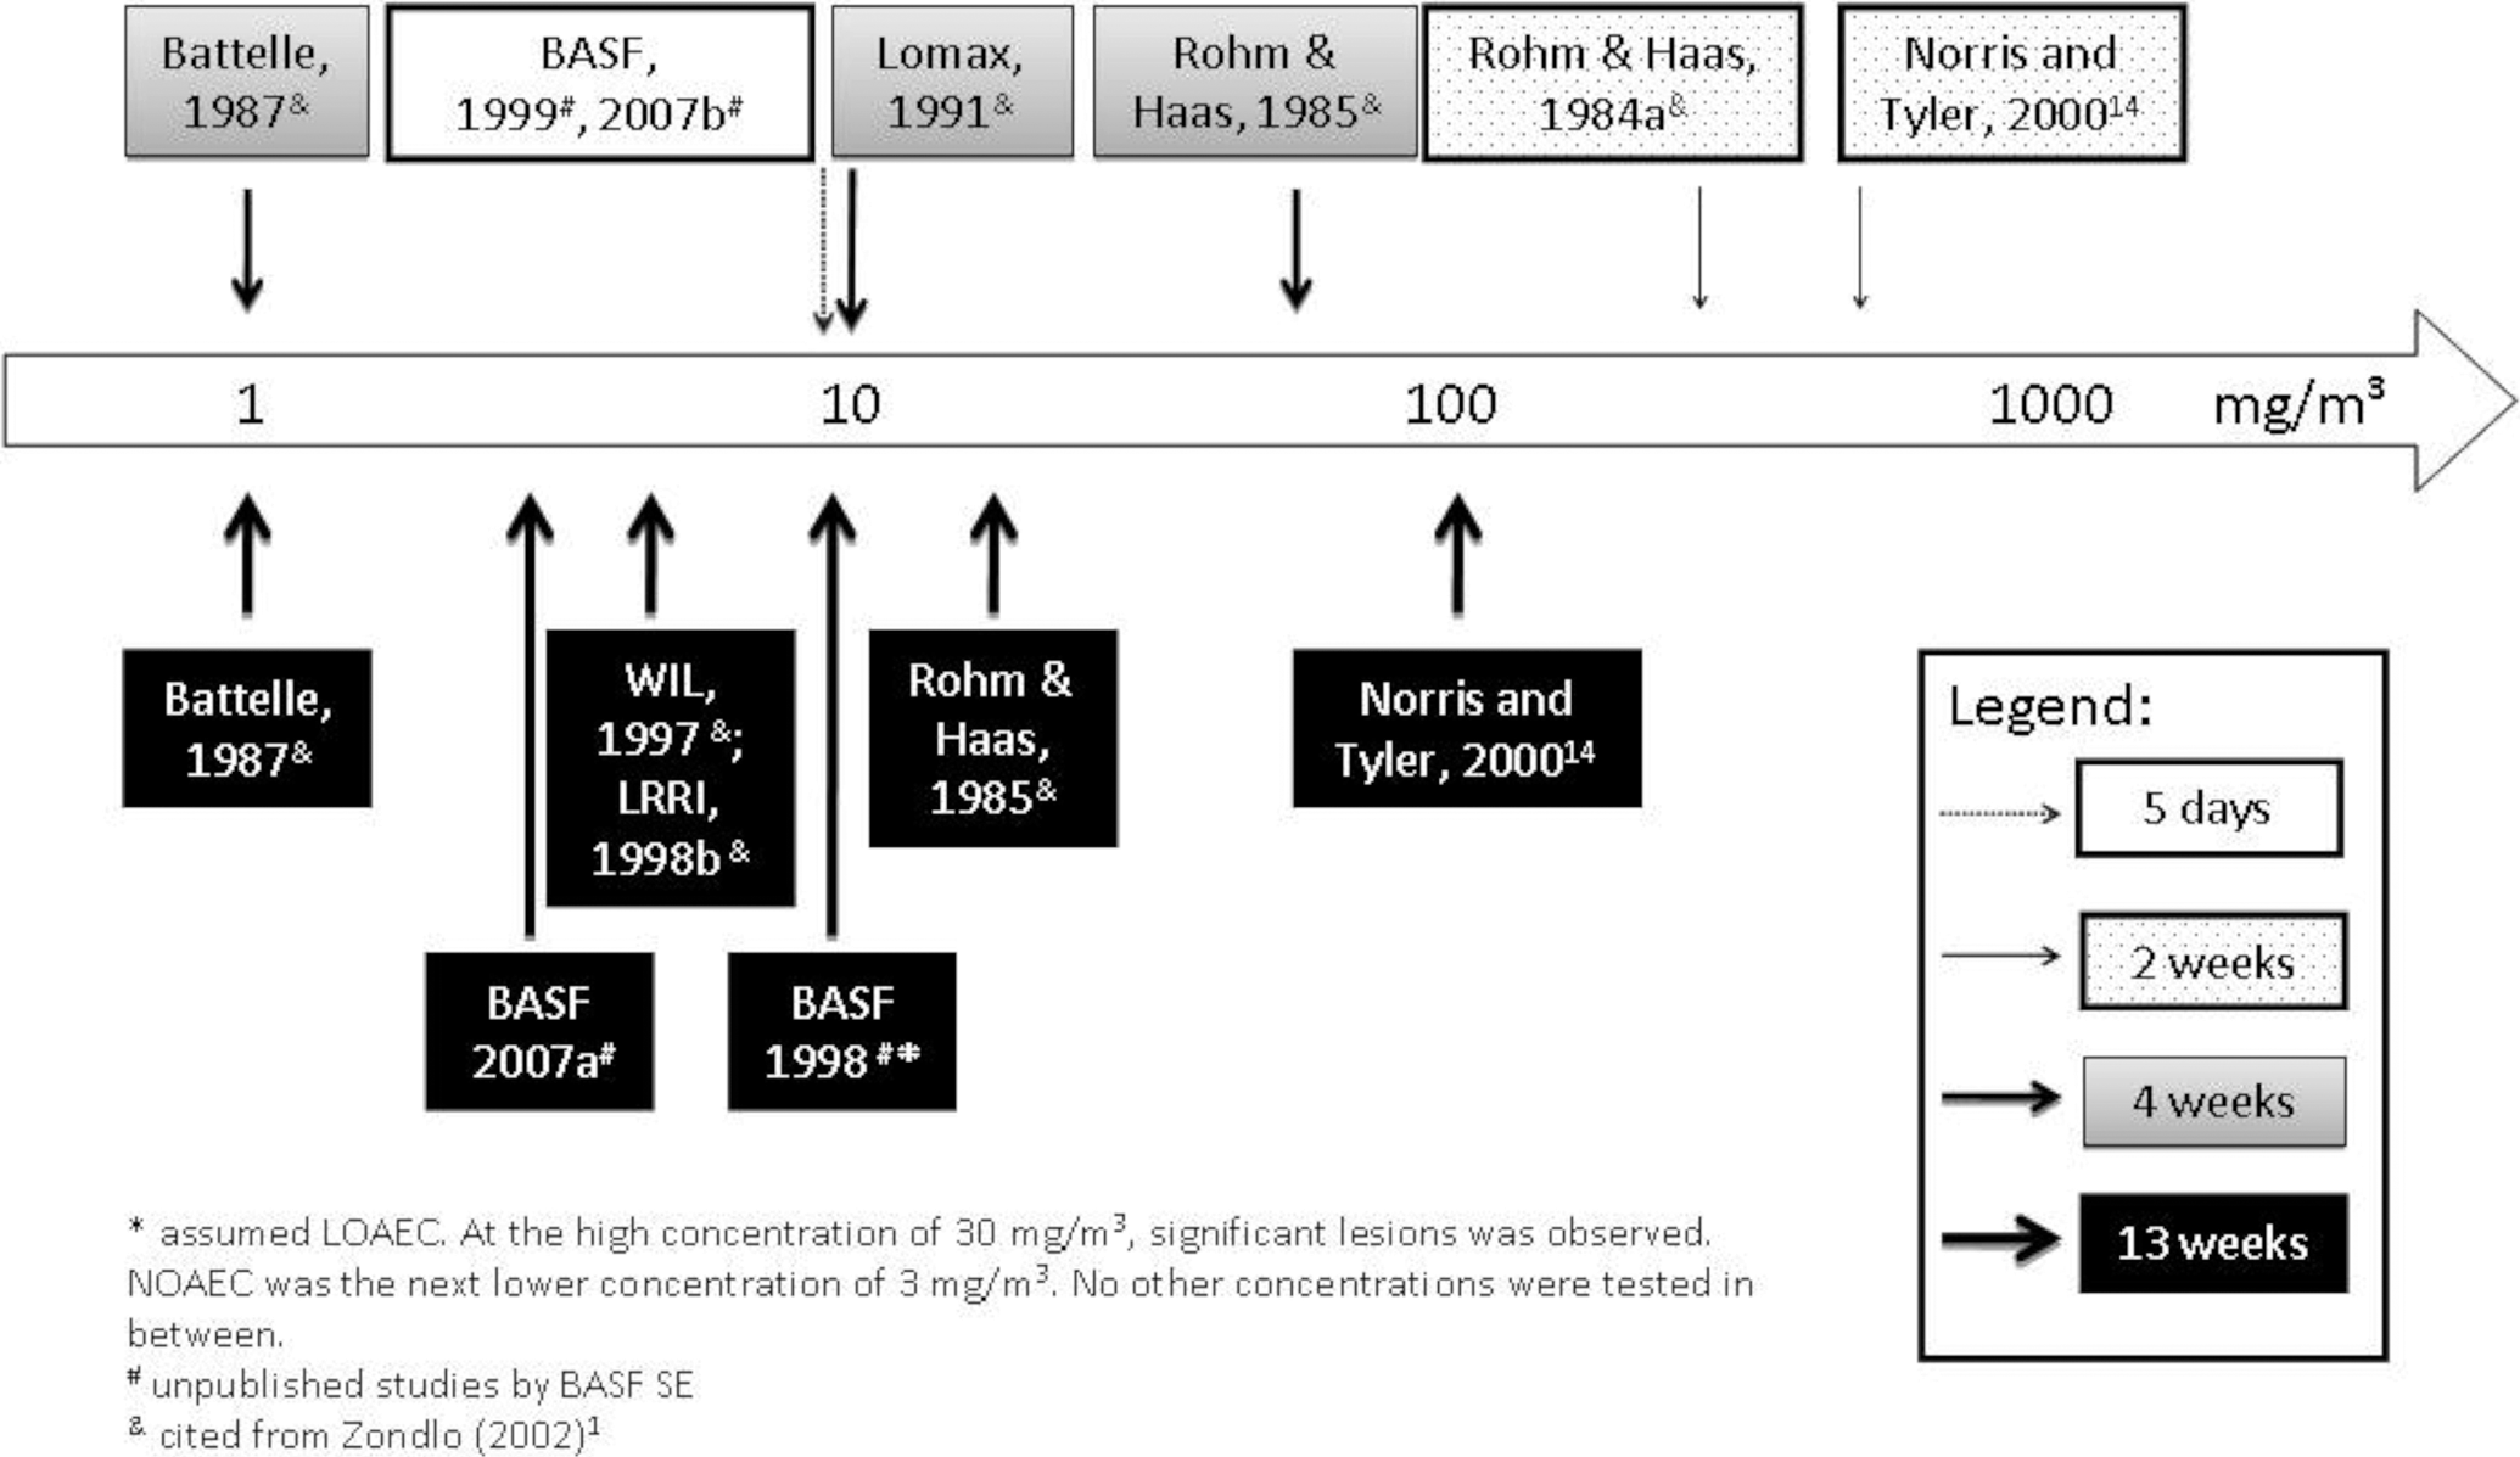
Survey of rat inhalation studies with aerosols of acrylate copolymer dispersions: lowest observed adverse effect levels.
Materials and Methods
Study Design
Exposure conditions and duration, group sizes, as well as the selection and scheduling of end points were based on the results and conclusions achieved in a previous study conducted to establish this short-term study design. 7 Accordingly, groups of male rats were nose-only exposed of male rats were exposed to the test materials for 6 hours/d for 5 consecutive days at target concentrations of 3 and 10 mg/m3. A concurrent control group was sham exposed to conditioned, fresh air. Histopathological examination of the respiratory tract was performed in 3 rats per group and time point (directly after the last day’s exposure and after a post-inhalation period of 19 days). Bronchoalveolar lavage was performed in 5 rats per group and at time point after 3 and 24 days of postinhalation. The study was conducted under Good Laboratory Practice conditions. 18
Test Materials
Both the test materials (produced by BASF SE, Ludwigshafen, Germany) were anionic acrylic ester copolymer dispersions containing free carboxylic groups and thus chemically identical. Both materials appeared as stable white, milky aqueous dispersions with a polymer content of 59%. These dispersions contain an anionic surfactant as an emulsifier. The content of volatile compounds was tested by gas chromatography. Total volatiles found in the dispersions were up to 0.2% (weight/weight [w/w]) of the test material and mainly consisted of alkyl alcohols, for example ethylhexanol and methanol, and esters, as ethylhexylacetate. By analytical ultracentrifugation at 40 000 rpm (Beckman model XLI with Sedfit evaluation; Beckman Coulter, Krefeld, Germany), approximately 1% (w/w) nonparticulate solutes were found in the aqueous phase of both dispersions that may consist of water-soluble polymer and surfactant, which are both the known by-products from emulsion polymerization.
The 2 test materials (TMs) were produced to differ in their particle size distributions: TMn is the test material containing nanoparticle fraction, whereas TM2 das test material without nanoparticle ist. To confirm this, particle size distributions in 5% dilutions of the original dispersions were determined using analytical ultracentrifugation at 20 000 rpm with optical interference detection of the particles at sizes below 100 nm (Beckman model XLI with Sedfit evaluation; Beckman Coulter). 10 For the evaluation of the optical data, a density of 1.035 g/cm3 and a refractive index increment of 0.142 cm3/g were confirmed by Kratky gauge (Anton Paar DMA5000, Graz, Austria) and refractometer (Bellingham and Stanley, Tunbridge Wells, UK), respectively. For the TMn dispersion, a proportion of 11% (w/w) was determined at an average diameter of 80 nm, with relatively narrow distribution (Figure 2), thus resulting in a bimodal particle size distribution for this dispersion. For the TM2 dispersion, nano-sized particles could qualitatively be detected but ranged below the quantification limit (<0.1% w/w), thus effectively yielding a monomodal particle size distribution. These particle size distributions were qualitatively confirmed by transmission electron microscopy (TEM) of immersion samples of the 2 dispersions. While TMn displayed particle sizes both smaller and larger than 100 nm (Figure 3A), TM2 appeared to be monomodal with particle sizes significantly exceeding 100 nm and no particles detectable at diameters less than 100 nm (Figure 3B). Transmission electron microscopy observation was performed by a Tecnai G2 F20 equipped with a field emission gun (FEI company, Endoven, The Netherland). During the TEM observation, the acceleration voltage was 200 kV.
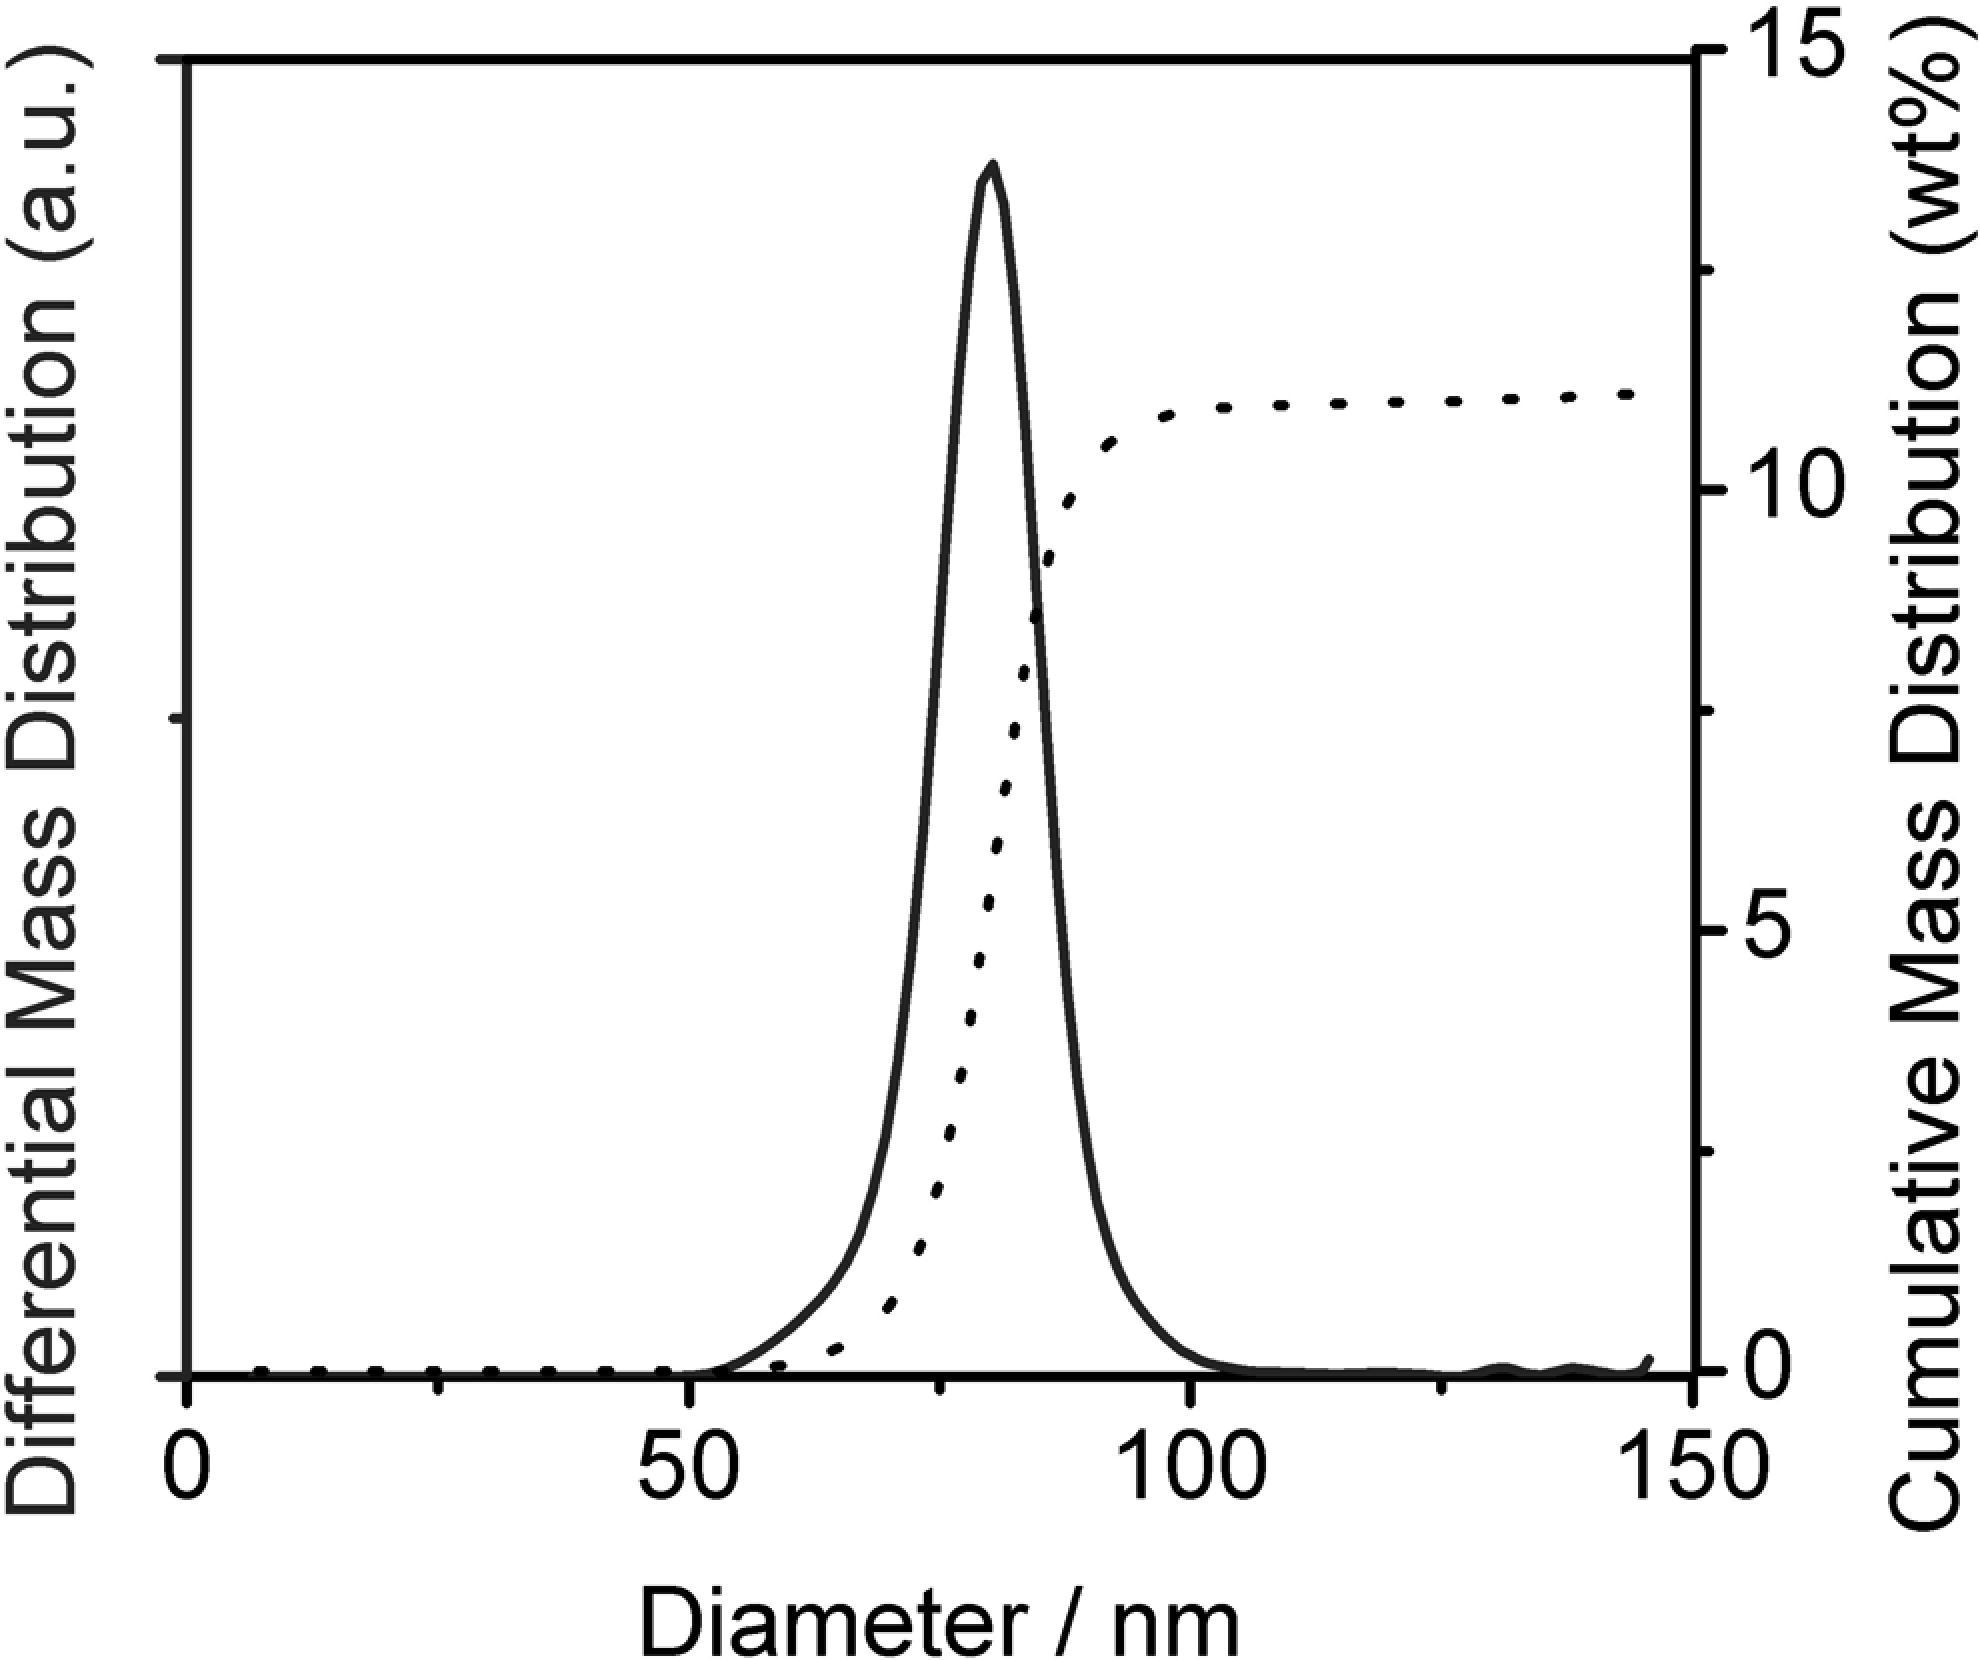
Particle size distribution of the original polymer dispersion, test material with nanoparticle fraction (TMn), in the nano-sized region. Due to the fractionating measurement principle of analytical ultracentrifugation, larger particles sediment first, then the particles in the nano-sized region. Their share in the cumulative mass-based size distribution (dotted line, right axis) is directly quantified by the synchronized interference detector (Beckman model “XLI”), which involves neither evaluation nor optical corrections. The differential distribution (solid line, left axis) demonstrates the narrow distribution of the nano-sized proportion of particles in this dispersion. The respective diagram of the TM2 polymer dispersion (test material without nanoparticle) showed cumulative shares below 0.1 % (weight/weight [w/w]), indicating a near-total elimination of nano-sized particles (not shown).
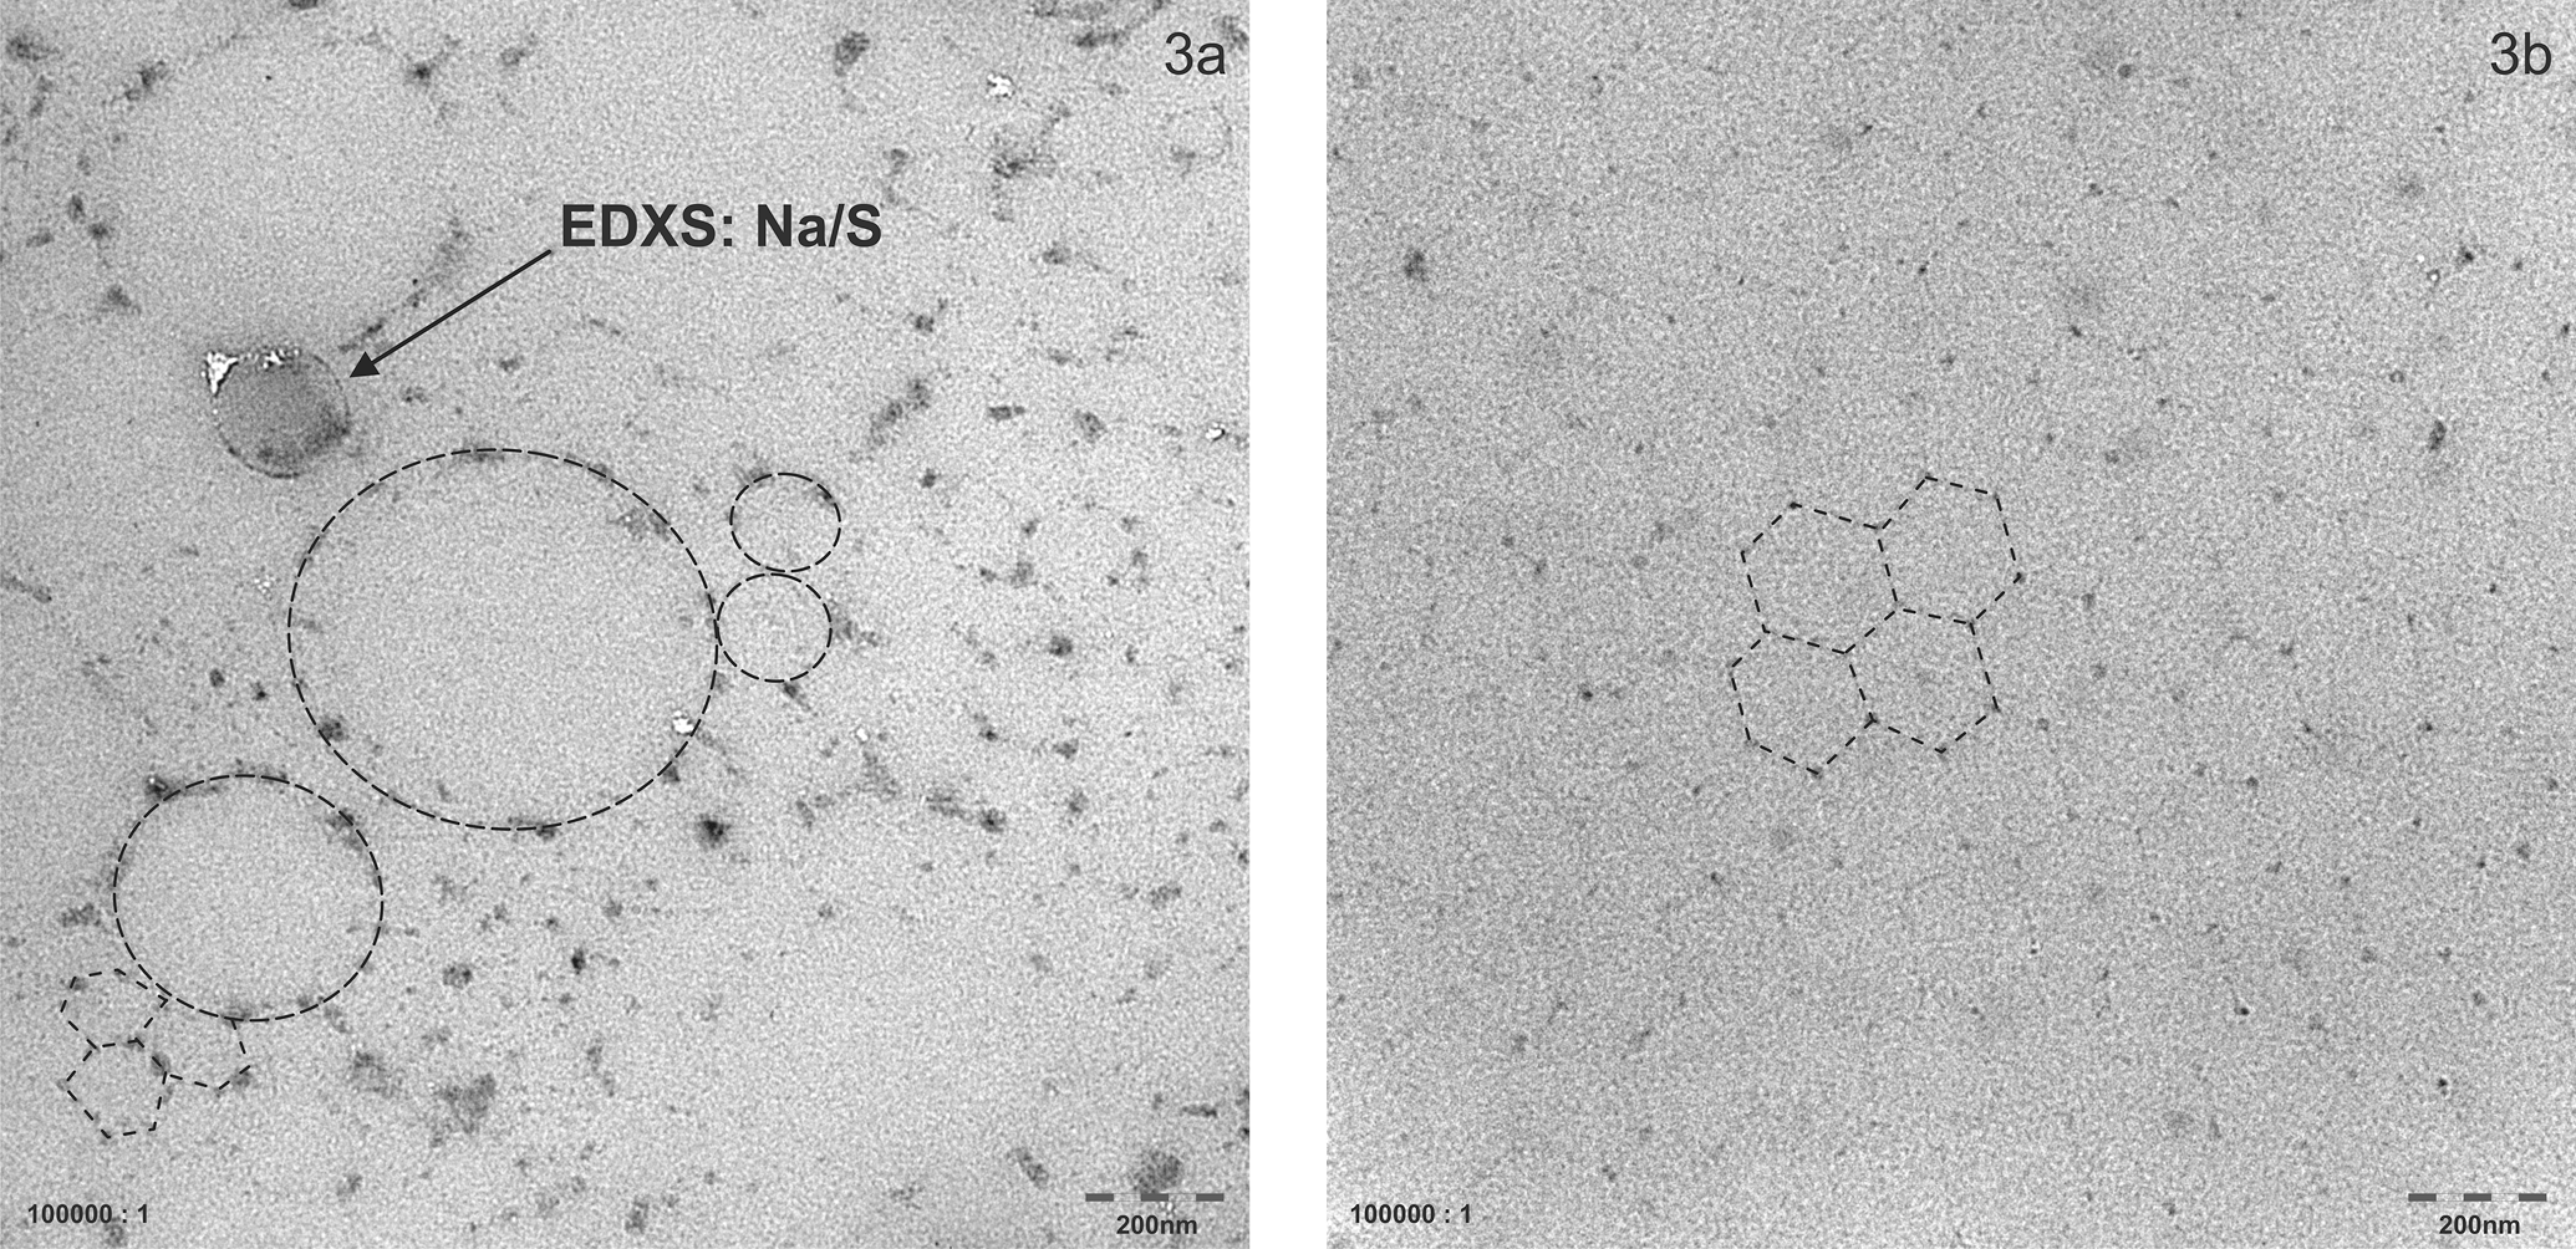
Transmission electron microscopy of immersion samples of the test material with nanoparticle fraction (TMn) (A) and test material without nanoparticle (TM2) (B). For this purpose, transmission electron microscope (TEM) grids were dip coated with the liquid polymer suspension. After dying, the polymer particles attained confluence and formed a monolayer firm. Due to the carbon hydride nature of polymer, the particles were of low contrast and were not well visible in TEM. The left image (A) showed particles (bordered by dark spots sodium salt) of mainly 4 different sizes (100, 180, 380, and 800 nm). The right image (B) showed particles of about 180 nm. The monomodal particles size promotes the maximum of confluence. The actual round particles appeared hexagonal within the collective. The broken line marks the border of the particles.
Test System
Male Wistar rats (strain Crl:WI (Han)) were obtained at approximately 8 weeks of age from Charles River Laboratories (Sulzfeld, Germany) and arrived 6 days prior to the start of the inhalation period. The rats were inspected for clinical signs of disease upon arrival and individually marked. Five days prior to the start of the inhalation period, the rats were randomized to their groups according to their body weights (<20% variation within groups). Up to 5 rats per cage were housed together in polycarbonate cages (type Polysulfon from Tecniplast, Hohenpeissenberg, Germany). Bedding material consisted of dust-free Lignocel fibers obtained from SSNIFF (Soest, Germany). For enrichment, wooden gnawing blocks (type NGM E-022), supplied by Abedd Lab. and Vet. Service GmbH (Vienna, Austria), were added. The rats were maintained on mouse/rat laboratory diet “GLP” (Provimi Kliba SA, Kaiseraugst, Switzerland), which was controlled for microbiological and chemical contamination, and municipal tap water with drinking water quality. The rats had free access to food and water, except during inhalation exposure. They were kept under a light/dark cycle of 12/12 hours at temperatures of 20°C to 24°C and 30% to 70% relative humidity.
Animals were housed and exposed in an Association for Assessment and Accreditation of Laboratory Animal Care International (AAALAC)-accredited facility (http://www.aaalac.org/accreditedorgs/). All procedures for animal care and exposure were conducted under regulation by the German Animal Welfare Act. 19
Aerosol Generation and Inhalation
Both TMn and TM2 dispersions were diluted with highly deionized water (1 + 74, w/w). The diluted materials were kept homogeneous by continuously stirring while being pumped (continuous infusion pumps, type Perfusor; B. Braun, Melsungen, Germany) to 2-component atomizers (stainless steel, Schlick model 970, Untersiemau, Germany) operated by compressed air. The 2 target concentrations were generated by adapting the metered pump rate at a constant dilution of the generated aerosol with conditioned, fresh air. The inhalation chamber was operated with approximately 60 air changes/h. It consisted of a custom-made 90-L cylindrical stainless steel inhalation chamber with cone-shaped inlet and exhaust at opposite ends, which was operated under positive pressure to avoid any dilution of the test material by the laboratory air. During exposure, the rats were restrained in glass tubes fitted to their body, with their snouts projecting into the inhalation chamber. This head-only exposure system was selected to avoid uptake of the test material by any other route than inhalation. The rats were acclimatized to the exposure setup for 2 days prior to the start of the inhalation period. Daily mean relative humidity and temperature in the inhalation chambers were 54% and 21.5°C, respectively.
Aerosol Analysis
For aerosol analysis, samples were taken from the breathing zone of the rats by an air sampling station (Millipore, Schwalbach, Germany) at 3 L/min, as previously described in more detail. 20 Aerosol particle concentrations were determined twice per day by sampling on 4.7 cm MN 85/90 BF filters (Macherey-Nagel, Dueren, Germany) and gravimetric analysis. The sampling time was 120 and 40 minutes for the low and high aerosol concentrations, respectively. In addition, real-time monitoring was performed using scattered light photometers (VisGuard, Sigrist, Switzerland) throughout the daily exposure period.
Particle size distributions in the aerosols were determined by several methods. Cascade impactor measurements were performed with an 8-stage Marple Personal Cascade Impactor (Sierra-Andersen, Atlanta, Georgia) using sample volumes of 1080 and 360 L for the low and high aerosol concentrations, respectively. The effective aerodynamic cutoff diameters were 21, 15, 10, 6.5, 3.5, 1, 0.7, and 0.4. Particle size distributions were also determined with an optical particle counter ([OPC] WELAS 2000, Palas, Karlsruhe, Germany). The measurement range of the sensor was 0.3 to 10 µm, and the sampling flow rate was set to 5 L/min. In the submicrometer range, particle size distribution was analyzed using a scanning mobility particle sizer ([SMPS] Grimm Aerosol Technik, Ainring, Germany). Particle count concentrations in the size range from 0.011 to 1.083 µm were determined (approximately 10 replicates per determination).
In order to further characterize the morphological appearance of the aerosols, particles were collected by an SMPS equipped with a sample holder for TEM grids. The voltage of the SMPS particle classifier was fixed at the levels suitable for the sampling of particular particle fractions. The different particle fractions were sampled on the TEM grids by electrostatic precipitation. Based on the results of SMPS measurements, 3 fractions (40, 120, and 400 nm) were sampled for TMn and 2 fractions (40 and 170 nm) for TM2. The grids were examined by TEM (CM 120 equipped with LaB6 cathode, 100 kV, FEI/Philips) and Energy Dispersive X-rays (EDX) spectroscopy.
Clinical Examinations
The rats were examined for evident signs of toxicity or mortality 1 to 3 times daily. Clinical observations were recorded once daily before and after the inhalation period as well as 2 times in the day during the inhalation period. Body weight determinations were performed when the rats first day got acclimatized to the exposure conditions, at the first and last day of the inhalation period, and once per week and prior to necropsy during the postinhalation period.
Clinical Pathology
Blood
Blood was collected from the retro-orbital venous plexus from fasted rats under isoflurane (Isoba, Essex GmbH, Munich, Germany) anesthesia on study days 8 and 29. Hematological parameters according to the OECD 412 test guideline 12 were analyzed in blood from 5 rats/group with an Advia 120 particle counter (Siemens Diagnostics, Fernwald, Germany) using ethylenediamine N,N,N,N-tetraacedic acid tripotassium dehydrate (EDTA-K3) as the anticoagulant. In addition, the acute phase proteins α2-macroglobulin (enzyme-linked immunosorbent assay [ELISA] from Kamiya Biomedical Company Seattle, Washington) and haptoglobin (photometric assay based on the preservation of the hemoglobin peroxidase activity; Tridelta Ltd., Maynooth, Ireland) were measured in serum samples.
Bronchoalveolar Lavage
Rats were killed by exsanguination of the abdominal aorta and vena cava under pentobarbital sodium (Narcoren) anesthesia. The lungs were lavaged 2 times with 22 mL/kg body weight of 0.9% saline. The 2 washes were combined. Total cell counts were determined using a hematology analyzer (Advia 120; Siemens Diagnostics). Cytocentrifuge preparations were stained according to Wright and evaluated microscopically for BAL cells. 21 Total protein and enzymes (alkaline phosphatase [ALP], γ-glutamyltransferase [GGT], lactate dehydrogenase [LDH], and N-acetyl-β-glucosaminiase [NAG]) were determined using an automatic analyzer (Hitachi 917, Roche, Mannheim, Germany).
Pathology
Rats selected for pathological examinations were killed by exsanguination of the abdominal aorta and vena cava under pentobarbital sodium anesthesia. Necropsies were performed and gross pathology was assessed. Lungs were inflated under a constant pressure of 30 cm water column. Organ weights were obtained for brain, heart, kidneys, liver, lungs, spleen, and thymus. These organs plus organs of the respiratory tract (nasal cavity, larynx/pharynx, trachea, and tracheobronchial and mediastinal lymph nodes) were fixed in 10% neutral-buffered formalin. All 5 lobes of the lungs, the nasal cavity (4 levels), larynx/pharynx (3 levels, including the base of epiglottis), trachea (1 transverse and 1 longitudinal sections through the carina of the bifurcation), and tracheobronchial as well as mediastinal lymph nodes of the sham and the high-concentration groups were processed histotechnically, stained with hematoxylin–eosin and assessed by light microscopy. Histopathological examination was performed using a 5-grade scoring system.
Statistical Analyses
For the analysis of the body weight development, a comparison of each group with the sham-exposed control group was performed using the Dunnett test (2-sided). 22 For clinical parameters, nonparametric 1-way analyses of variance with the Kruskal-Wallis test (2-sided) were used, followed, if statistically significant, by a pairwise comparison of each group with the sham-exposed control group using the Wilcoxon test (2-sided). 23
Results
Aerosol Characterization
The targeted mass concentrations of the polymer aerosols were reproducibly maintained throughout the inhalation period, which was evidenced by gravimetry (Table 1) and scattered light photometry (data not shown).
Aerosol Concentrations
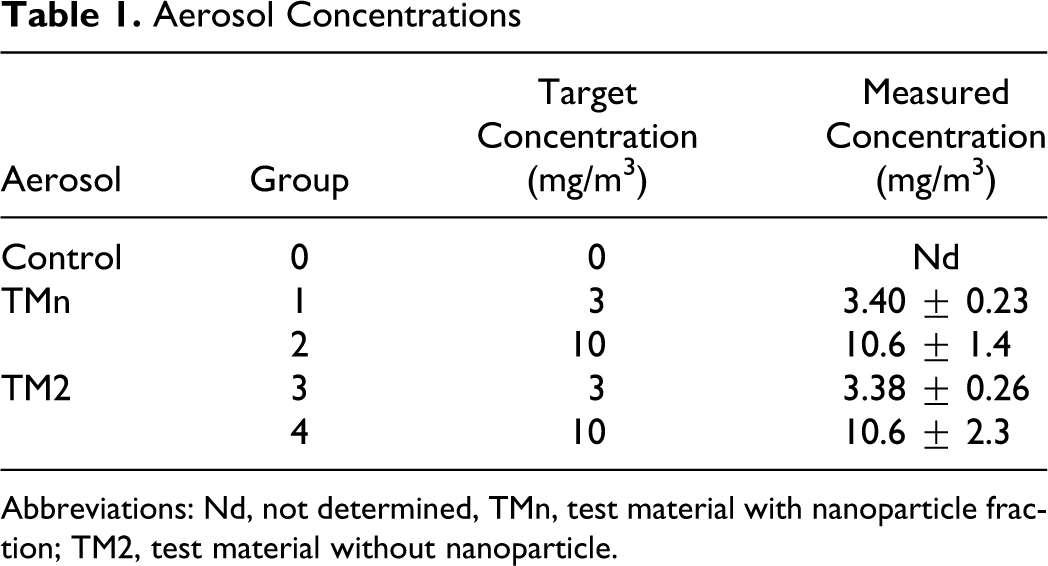
Abbreviations: Nd, not determined, TMn, test material with nanoparticle fraction; TM2, test material without nanoparticle.
The mass median aerodynamic diameter (MMAD) of the particles in the 2 aerosols determined by the cascade impactor were very similar (average of 1.15 µm; Table 2 ). With a cutoff at 0.4 µm and the relatively broad geometric standard deviations (GSDs) obtained, the particle size distribution between TMn and TM2 aerosols could not be differentiated on the basis of this determination. Nevertheless, there is no indication of a significant agglomeration to larger particles for any of the aerosols. The mass fractions, which were calculated to be <3 µm of aerodynamic size, ranged between 86% and 91%. This indicated that the large majority of the aerosol particles was in the inhalable range for rats.
Particle Size Distribution in the Aerosol a
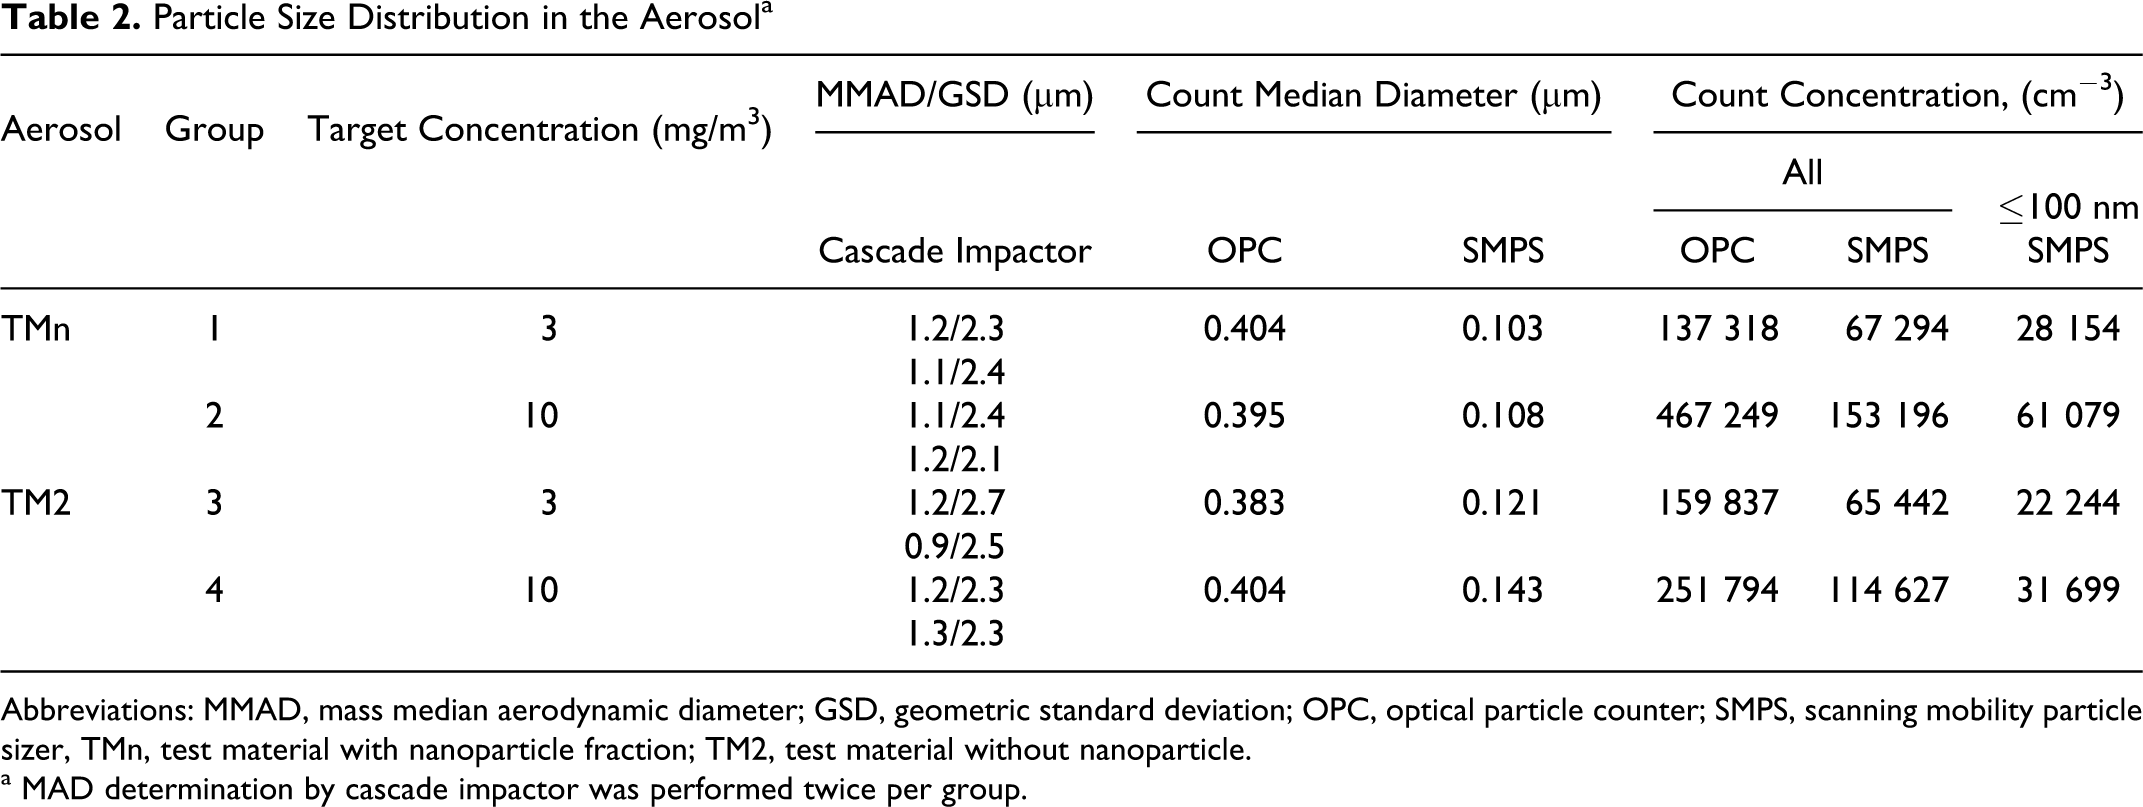
Abbreviations: MMAD, mass median aerodynamic diameter; GSD, geometric standard deviation; OPC, optical particle counter; SMPS, scanning mobility particle sizer, TMn, test material with nanoparticle fraction; TM2, test material without nanoparticle.
a MAD determination by cascade impactor was performed twice per group.
The count median diameters for the 2 aerosols determined by OPC were at approximately 0.4 µm (Table 2) and also could not be differentiated on the basis of this determination. The device with the lowest size detection range for this kind of particles is the SMPS. The SMPS analysis of the TMn aerosol revealed a polymodal size distribution consisting mainly of 3 fractions (Figure 4 ). One size fraction ranged from 11 to 90 nm, with a fraction count mean (FCM) at around 40 nm. The second fraction ranged from 90 to 300 nm (FCM at approximately 150 nm), while the third fraction ranged from 300 to 1000 nm (FCM 450 nm). The particle size distribution of the TM2 aerosol was surprisingly also polymodal, with one fraction ranging from 11 to 150 nm (FCM 40 nm) and the second fraction ranging from 150 to 1000 nm (FCM at about 250 nm). In the fraction with FCM around 40 nm particle was not seen in TEM examinations. Besides this small fraction, the distinction between the 2 substances was also observed clearly in TEM examination in the original aqueous dispersion (Figure 2) and after drying on the TEM grids (Figure 3).
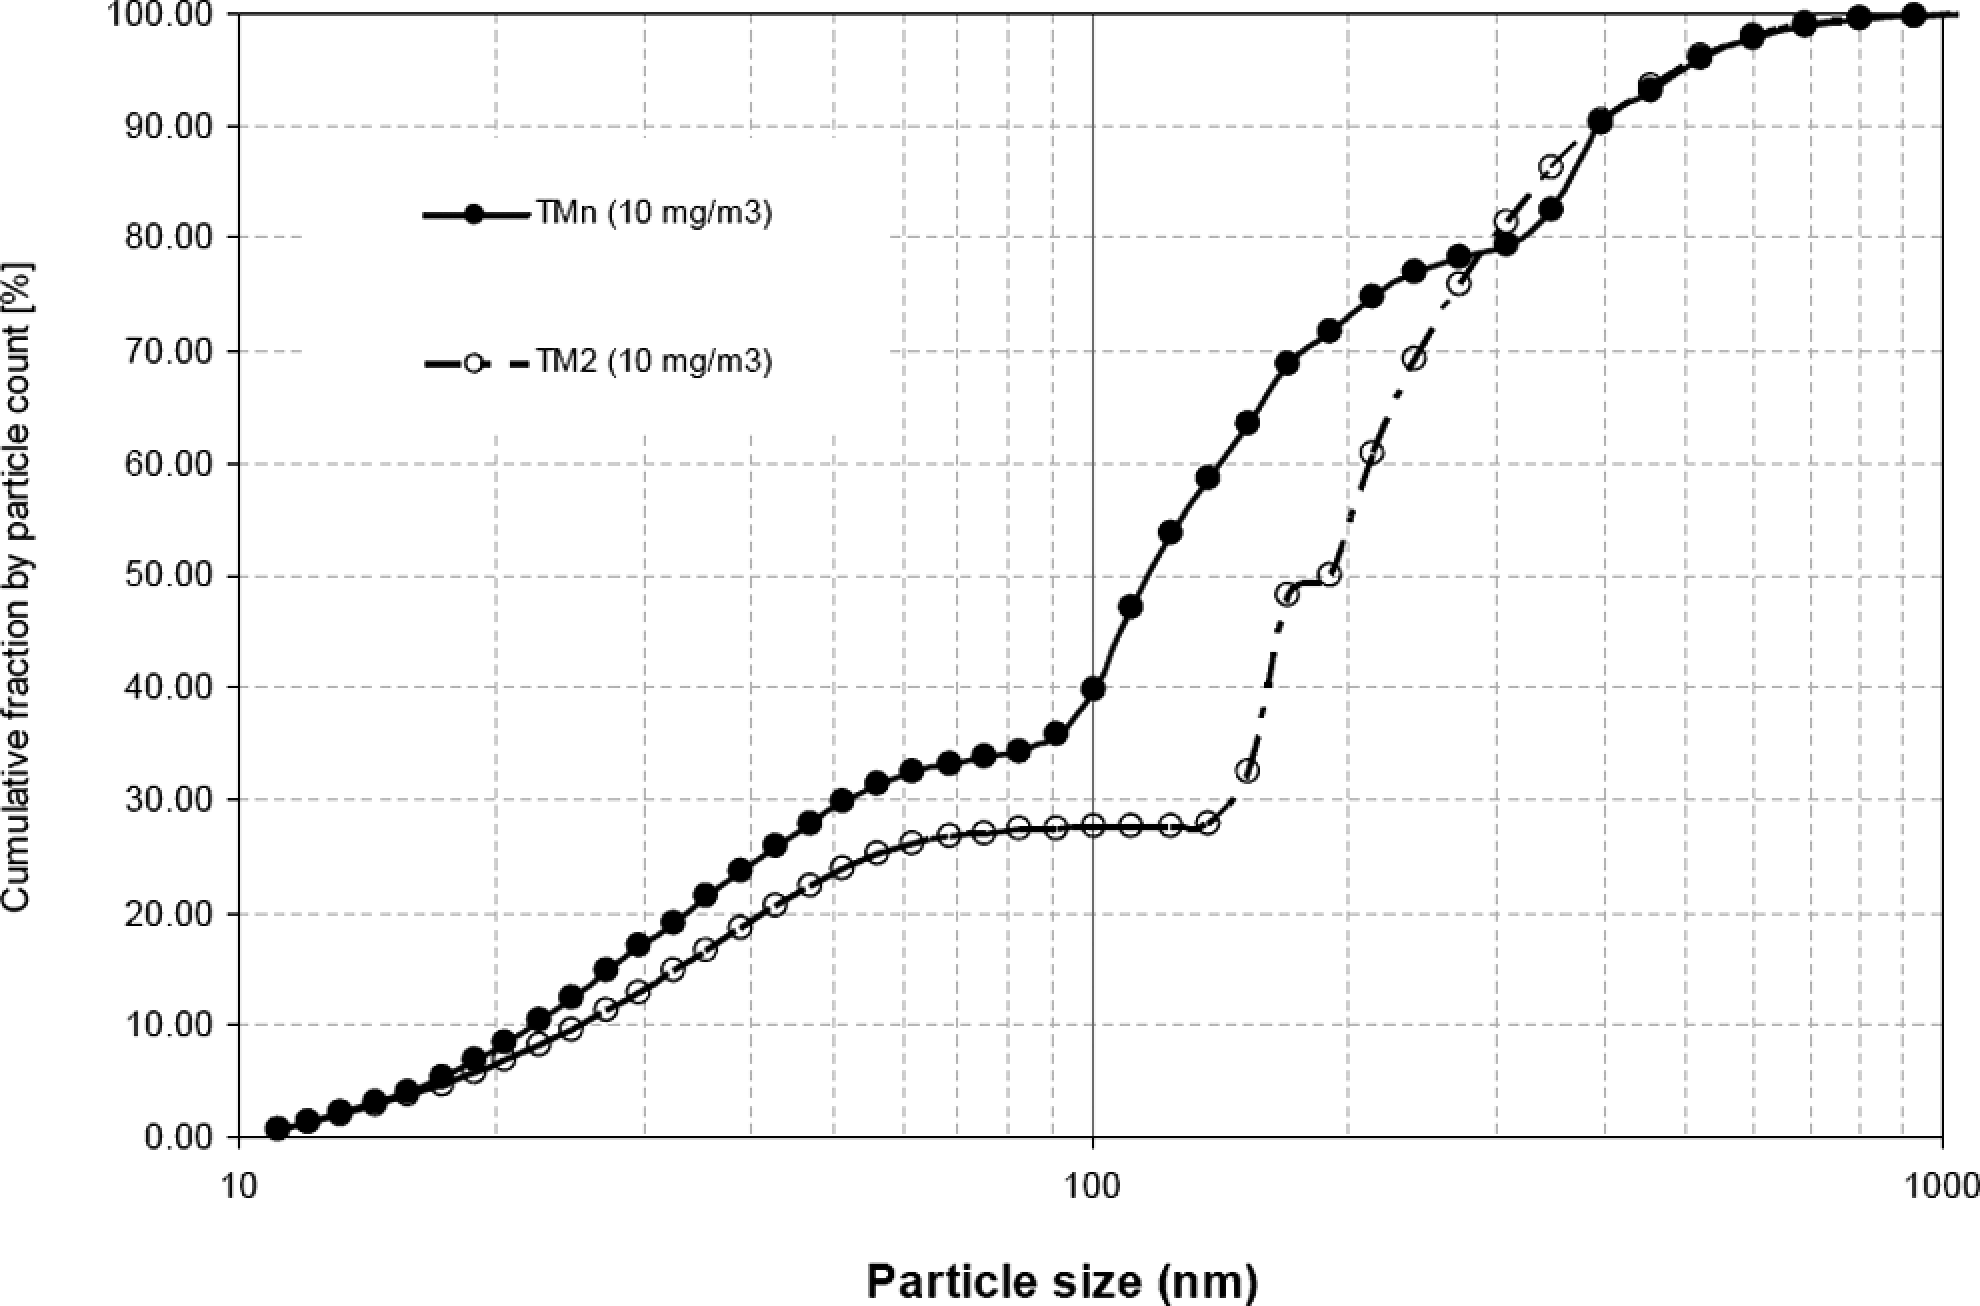
Particle size count distribution of the aerosolized test material with nanoparticle fraction (TMn) and test material without nanoparticle (TM2).
To further elucidate the nature of the polymodal aerosols, test atmospheres were classified by a differential mobility analyzer according to electrical mobility. Three particle fractions (40, 120, and 400 nm) of TMn and 2 fractions (40 and 170 nm) of TM2 were examined by TEM. On TEM grids of the first fraction of both aerosols (40 nm) hardly any particles could be observed (data not shown). This result demonstrated that the first fraction of both aerosols consisted of semi-volatile/volatile substances without particulate shape (e.g. water as solvent). Approximately 35% count for this first fraction (Figure 4) corresponds to a mass fraction of approximately 0.15%, which is only a fraction of the approximately 1% (w/w) solutes determined by analytical ultracentrifugation for the original aqueous dispersions. It can be assumed that the remainder of these solutes adsorbed to the solid particles upon aerosolization. For the second particle size fraction (120 nm) of TMn, particles around 100 nm could be observed on grids (Figure 5 A and B). This fraction count of 45% of the particle count (Figure 4) can be converted into approximately 10% (w/w), which corresponds to the 11% (w/w) determined by analytical ultracentrifugation as nano-sized fraction (Figure 2). This similarity in percentages of the nano-sized fractions in the aqueous dispersion and the aerosol suggests that there is little agglomeration of this type of particles upon aerosolization and during passage through the exposure system. The second TM2 fraction (170 nm) demonstrated significantly larger particles (Figure 5C and D). The third TMn fraction showed larger particles as expected (data not shown). Overall, particle size distribution of polymer aerosols determined by SMPS and TEM was consistent with each other and in good agreement with measurements performed in the original sample. The unexpected small fraction of the aerosols was considered semi-volatile/volatile substances and not the polymer with particular shape.
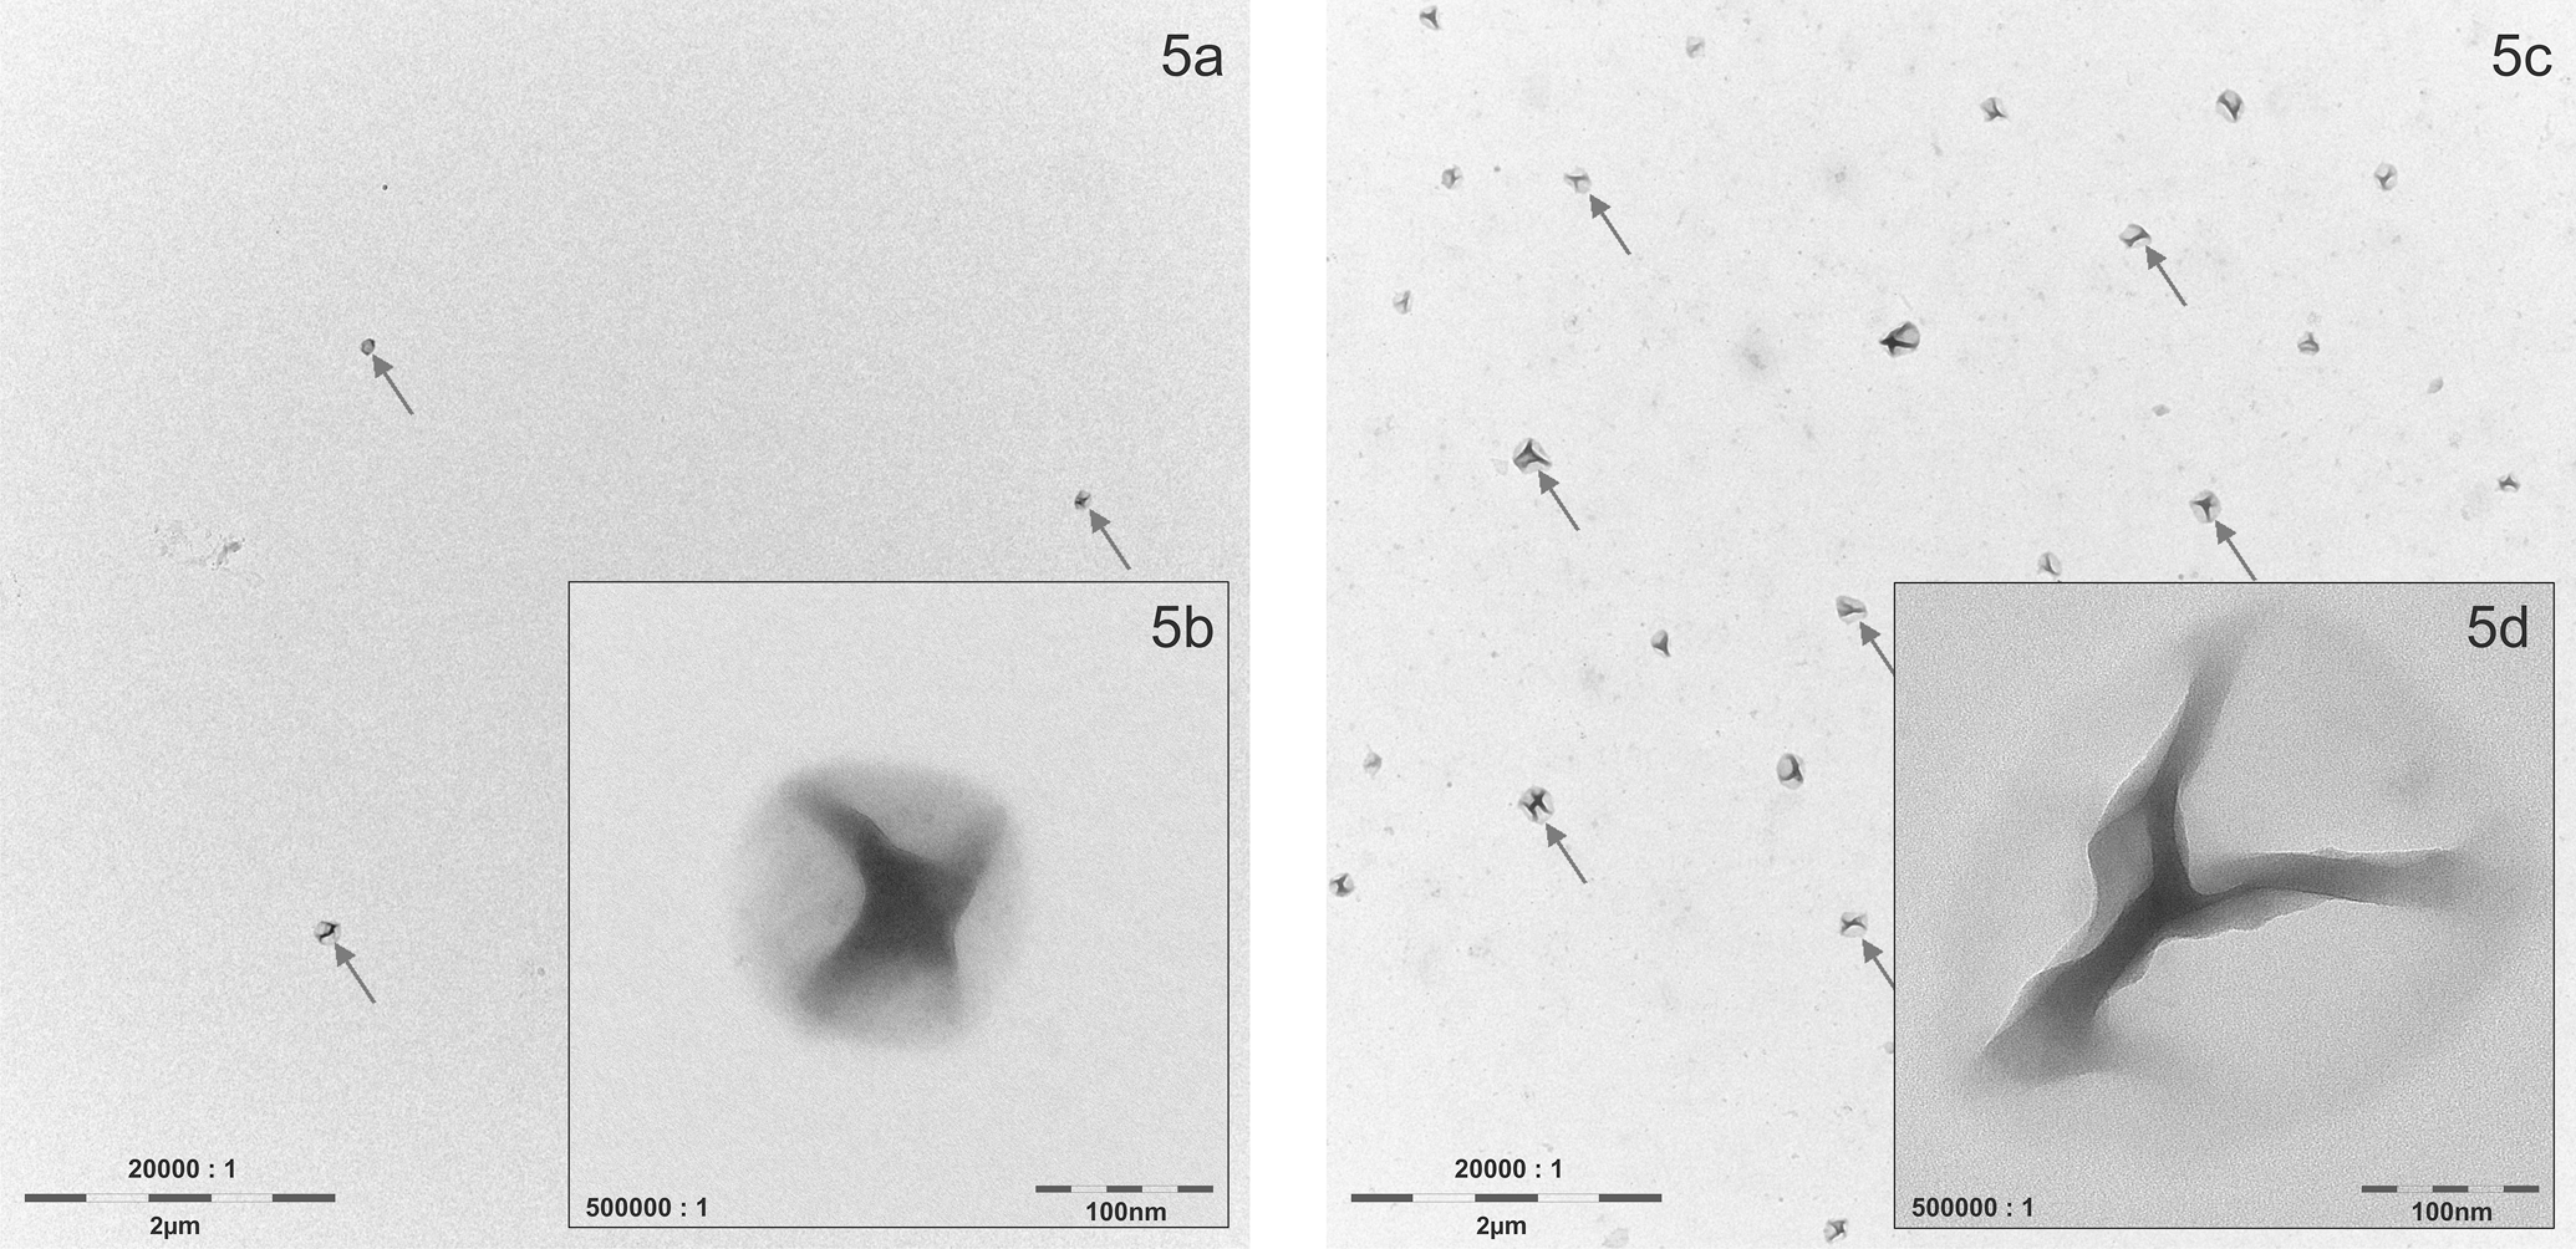
Transmission electron microscopy (TEM)/energy dispersion X-ray analysis of aerosolized particle samples collected by electrostatic precipitation after particle size-dependent separation with a scanning mobility particle sizer for test material with nanoparticle fraction (TMn, A and B) and test material without nanoparticle (TM2, C and D).
Body Weight Development and Clinical Observations
The group mean body weights were essentially the same at the start of the experiment and increased during the period used for acclimatization to the exposure system (data not shown). During the 5 exposure days as well as until the first time point for BAL sampling on study day 8, the rats did not gain body weight, which is explainable by the restraint stress associated with the nose-only exposure. They resumed growing throughout the postinhalation period except for the very last segment, when only a fraction of the rats were left until the final dissection. Overall, inhalation of the polymer aerosols did not affect body weight development. The trend to a slightly attenuated body weight development in the low-concentration test group is not considered relevant because no such trend was observed in the high-concentration test group.
During the exposure period, salivation was observed in some of the rats exposed either to the TMn aerosols or to the low-concentration TM2. However, this was not observed in the rats exposed to the high-concentration TM2 aerosol. Due to the lack of a concentration-response effect relationship for TM2, this finding is not considered related to the exposure to the polymer aerosols but rather an unspecific consequence of the stress associated with the nose-only exposure.
Hematology and Acute Phase Proteins
There were no relevant changes in hematological parameters by either exposure (data not shown). The 2 blood acute phase proteins investigated, α2-macroglobulin and haptoglobin were not different from study controls and within the historical control ranges (data not shown).
Bronchoalveolar Lavage Fluid
Total counts of lavaged cells as well as the differential cell counts were not changed by inhalation exposure to the test aerosols. Effects were neither found shortly after the end of the inhalation period nor found after the end of the postinhalation period (Table 3 ), with the exception of a statistically significant increase in total cell number in the group exposed to the low-concentration TM2 aerosol. Since a similar effect was not seen in the respective high-concentration group, this finding was considered incidental. In comparison to historical controls, 7 lavaged neutrophil polymorphonuclear leukocyte counts were higher. The high neutrophil counts in all groups including controls may have masked a potential neutrophilia in the exposure groups. Other differential cell counts were in the range of historical controls.
Cellular and Biochemical Parameters Determined in Bronchoalveolar Lavage a
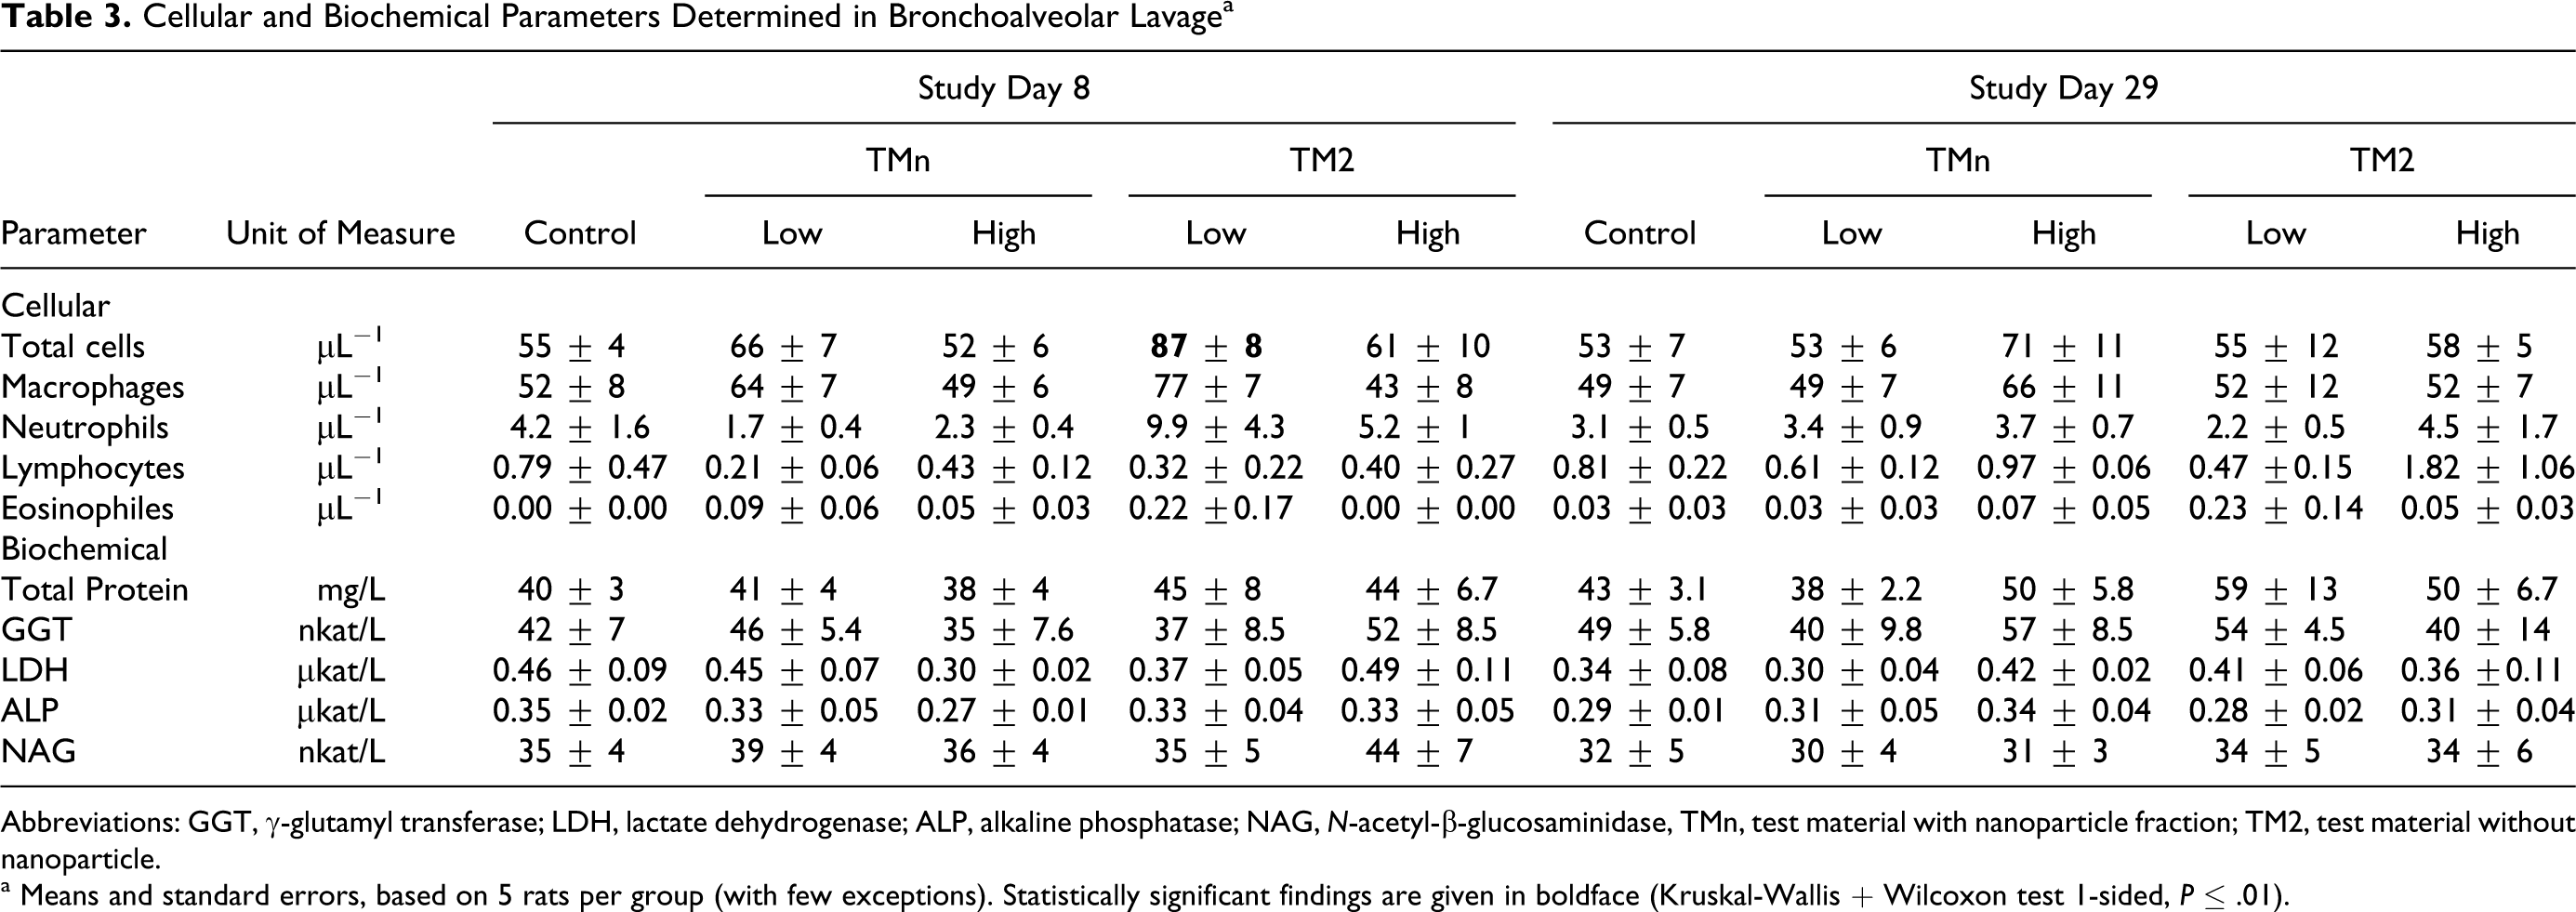
Abbreviations: GGT, γ-glutamyl transferase; LDH, lactate dehydrogenase; ALP, alkaline phosphatase; NAG, N-acetyl-β-glucosaminidase, TMn, test material with nanoparticle fraction; TM2, test material without nanoparticle.
a Means and standard errors, based on 5 rats per group (with few exceptions). Statistically significant findings are given in boldface (Kruskal-Wallis + Wilcoxon test 1-sided, P ≤ .01).
The biochemical markers of pulmonary injury investigated in the current study did not reveal any effect due to the inhalation of either aerosol (Table 3). They were also within the historical control range. There was no correlation between high neutrophil counts and any other of the cellular or biochemical parameters determined in the BALF on the basis of individual rats. There was also no correlation with the final individual body weight before dissection and lavage. The lack of any of these correlations may indicate that all other parameters except the BALF neutrophil count could be used for the evaluation of this study and that the study as such is valid.
Organ Weights and Respiratory Tract Histopathology
Organ weights (including lung weights), both absolute and relative to body weight, revealed no relevant changes by inhalation exposure to either of the aerosols (data not shown). There were no histopathological findings in the respiratory tract, including the mediastinal lymph nodes. A minimal focal epithelial alteration was detected in the larynx (level 1) in 1 of 3 rats in each of the control and high concentration groups. It was characterized by a focal loss of cilia and flattening of the surface cells, primarily at the base of epiglottis. This finding is known to be a frequent spontaneous change without dysfunction of the larynx 24 and is therefore not considered related to the test substance.
Discussion
Organic polymers exert low activity in most standard toxicological assays, which may be related to their high molecular weight and an associated low bioavailability. However, such polymers may become airborne under occupational conditions, and inhalation exposure may occur. In previous rat inhalation studies, organic polymers revealed a wide variability in potency for respiratory tract irritation (Figure 1 and refs 15 –17). In most cases, the relationship of this variability with the chemical and physical characteristics of the polymer is not known. On this background, a short-term inhalation study with 2 aerosolized acrylate polymer dispersions was initiated. These 2 polymers, TMn and TM2, have identical chemical composition but different particle size distributions. TMn contains approximately 11% (w/w) nano-sized particles, which upon aerosolization accounted for approximately 35% of the overall particle count. TM2 did not contain an appreciable amount of this nano-sized fraction.
In the current inhalation study, all end points examined, except BAL neutrophils, display levels or activities comparable with historic controls. Several of the rats used in the current study had marginally higher BAL neutrophil levels than normal, including some in the sham-exposed control group. This finding is not accompanied by any other BAL parameters. There were also no changes in blood acute phase proteins, which would be indicative of systemic inflammatory processes 25,26 nor were there any histological changes within the respiratory tract. Thus, the isolated and concentration-independent increase in neutrophil counts was considered incidental and not test material related. Based on these data, it can be concluded that none of the test materials caused any adverse effect under the conditions of this study. Among the materials tested within the same substance class (cf., Figure 1), these 2 dispersions possess a relatively low potency in inhalation toxicity.
Besides the intrinsic chemical toxicity, particular matter is able to induce inflammatory reactions in rat lungs after particle exposure high enough to trigger the so-called particle overload reaction. 27,28 With particles of low toxicity, such particle overload is achieved at a particle lung burden of 1 mg per rat lung or above. Under the conditions of the current study, a respiratory minute volume of approximately 200 mL can be estimated. 29,30 Assuming 10% retention of the inhaled particles in the lungs, this would lead to a maximum pulmonary particle load of approximately 0.36 mg over the 5-day inhalation period, which is below the overload threshold. However, already at this lung burden, many inorganic nano-scale materials induced significant effects in rat lungs in the current type of short-term inhalation studies. For instance, nano-sized TiO2 P25 tested in the same type of short-term assay as used in the current study at a concentration of 10 mg/m3 (lung burden approximately 0.55 mg) induced a 54-fold increase in neutrophil counts, which was accompanied by an increase in BAL GGT and ALP activities. 7 The LOAEC for TiO2 P25 was 2 mg/m3. Cerium dioxide, another poorly soluble metal oxide, induced a 450-fold increase in neutrophil counts at the same concentration (lung burden 0.34 mg), which was accompanied by increases in BAL protein concentration and LDH, GGT, ALP, and NAG activities. 10 The LOAEC for cerium oxide was 0.5 mg/m3. Other nano-scale inorganic materials that have been tested in this assay type also demonstrated diverse toxicological potencies (for overview see Table 4 and Figure 6 31–36), depending on the respective biophysical properties of the materials used. Multi-walled carbon nanotubes turned out to be very potent in this assay, displaying morphological and BAL effects at >0.1 mg/m3 after 5 days of inhalation. 11 Other materials, such as carbon black, zirconium oxide, and barium sulfate, did not show any adverse effects 10 at concentrations as high as 10 and 50 mg/m3.
Short-Term Rat Inhalation Sensitivity to Inhaled Particles (Selection of Studies): Lowest Observed Adverse Effect Levels
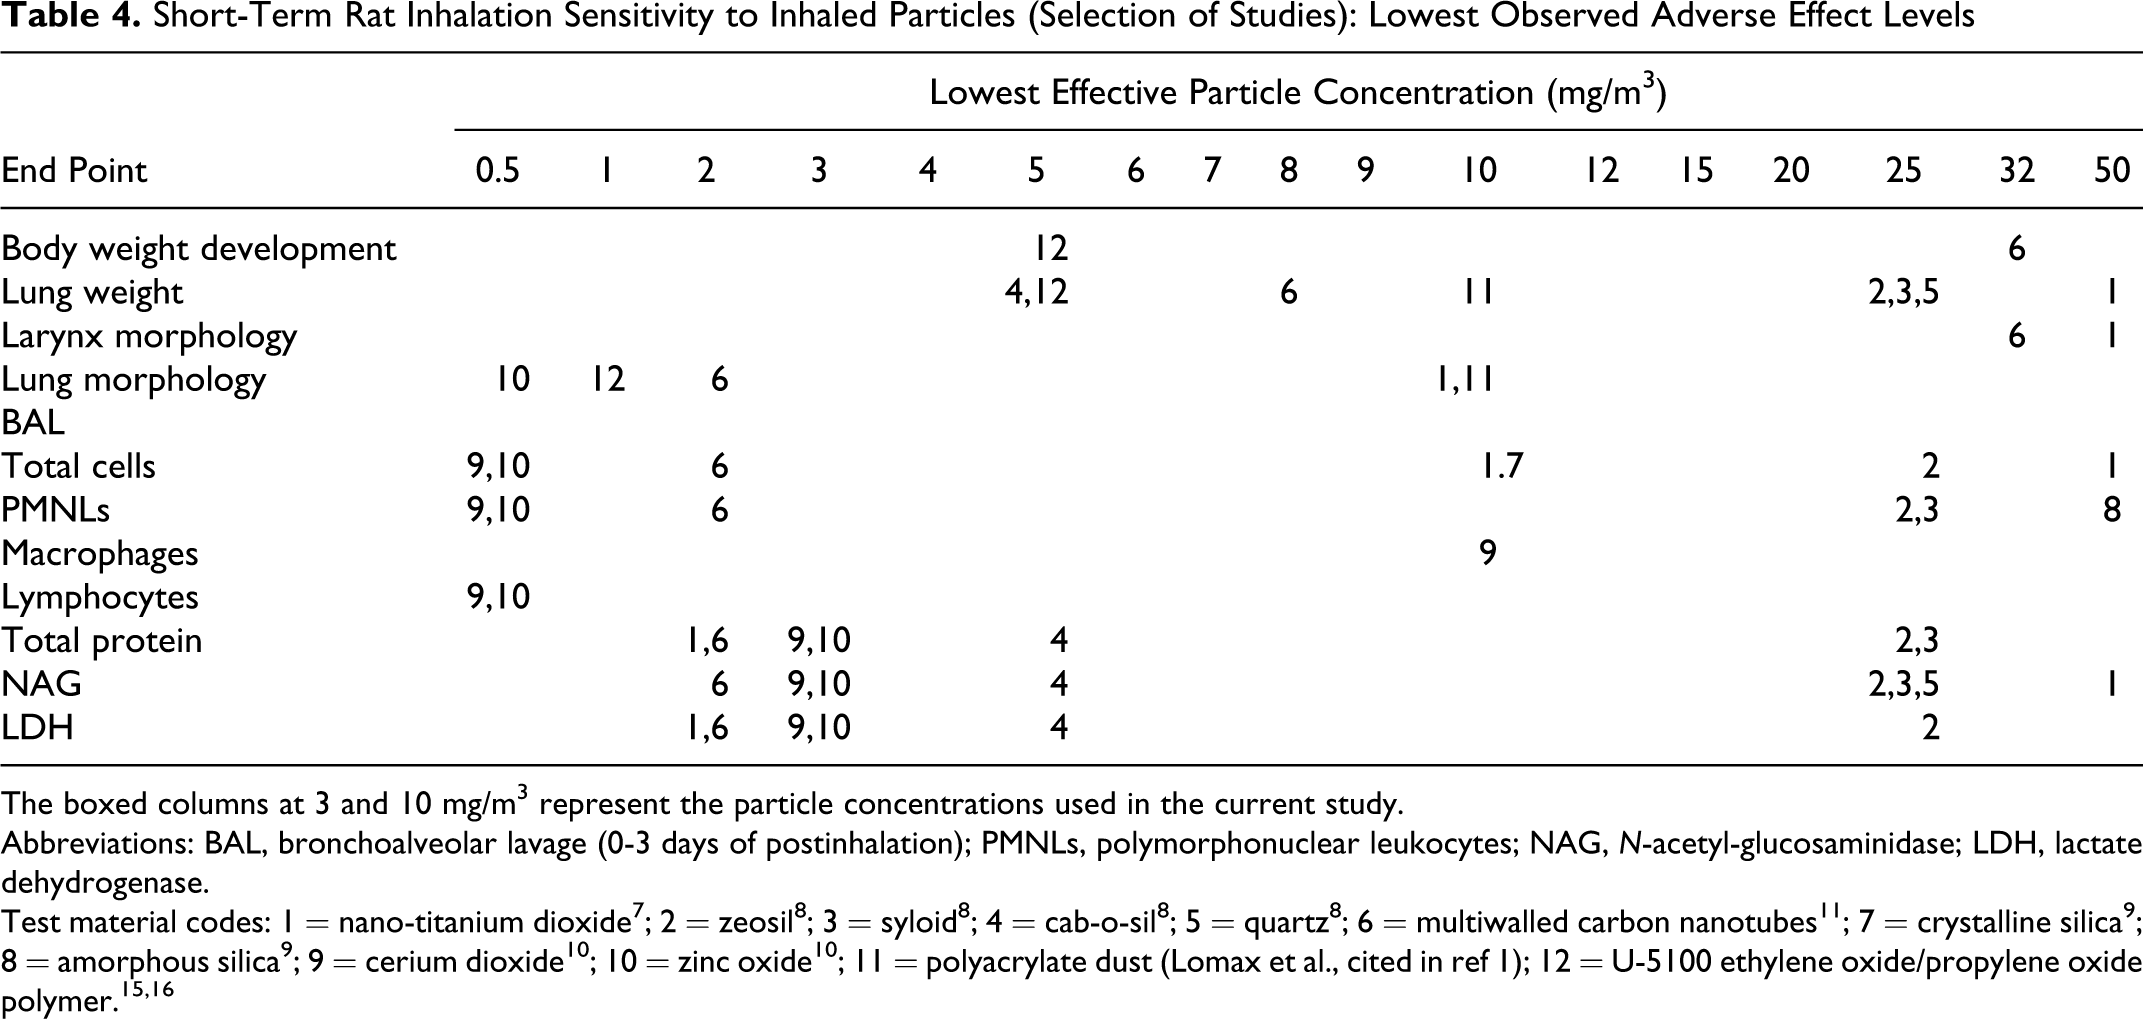
The boxed columns at 3 and 10 mg/m3 represent the particle concentrations used in the current study.
Abbreviations: BAL, bronchoalveolar lavage (0-3 days of postinhalation); PMNLs, polymorphonuclear leukocytes; NAG, N-acetyl-glucosaminidase; LDH, lactate dehydrogenase.
Test material codes: 1 = nano-titanium dioxide 7 ; 2 = zeosil 8 ; 3 = syloid 8 ; 4 = cab-o-sil 8 ; 5 = quartz 8 ; 6 = multiwalled carbon nanotubes 11 ; 7 = crystalline silica 9 ; 8 = amorphous silica 9 ; 9 = cerium dioxide 10 ; 10 = zinc oxide 10 ; 11 = polyacrylate dust (Lomax et al., cited in ref 1); 12 = U-5100 ethylene oxide/propylene oxide polymer. 15,16
Although the results of this study were negative, that is not producing adverse effects, the study still contributes to the toxicological assessment of the test materials and contributes to the overall approach of assessing such polymer dispersions. The lack of effects in the current study demonstrates that the toxic potency of the acrylic ester polymers investigated was relatively low under the conditions of the current study, both in comparison to previously tested acrylate polymers (Figure 1) and to other materials tested in a similar setup (Table 4 and Figure 6). The low toxicity may be related to the anionic character of the currently tested polymers, as suggested from the toxicological investigations of other organic polymers. 37 The low toxicity of acrylic polymers may also be the basis for suggestions of using this type of material for local pulmonary drug delivery, 38 although this was not the purpose of the current investigation and would require additional biodistribution and safety studies. One of the current acrylic ester polymers contained an approximately 35% proportion of nano-sized particles, which did not trigger toward higher toxicity. Thus, the nano-scale size of particles per se does not determine a high toxic potency regardless of other chemical or physicochemical characteristics of a material. The no observable adverse effect level for the current acrylic ester polymers was >10 mg/m3 under the conditions of this study. This is 2 to 3 times beyond the threshold limit values set for respirable particles not otherwise regulated 39 or nuisance particles, 40 respectively.
Comparison of short-term and subchronic rat inhalation toxicity of various nano materials: no observed adverse effect levels. As a reference, no observed adverse effect concentration (NOAEC) of pigmentary TiO2 in a subchronic inhalation study is also indicated in the figure.
The authors are employees of BASF SE. Their research work presented is within their employment. They did not receive any other financial support from a third party.
The author(s) received no financial support for the research, authorship, and/or publication of this article.