
Abstract
The purpose of this study was to evaluate the cytotoxicity of low doses and long-term exposure to 2-hydroxyethylmethacrylate (HEMA) on the protein expression of human gingival fibroblasts (HGFs). Human gingival fibroblasts were exposed to different concentrations of HEMA ranging from 0.5 mmol/L to 3 mmol/L for periods of time from 72 hours to 2 weeks. A significant decrease in the expression of procollagen α1 type I protein was observed 72 hours after treatment of cells with 3 mmol/L HEMA. Although low concentrations of the monomer after 2 weeks of exposure to HEMA did not appear to induce any marked changes in the morphology or viability of cells, the expression of procollagen α1 type I protein and its messenger RNA (mRNA) markedly decreased. In conclusion, our data demonstrated that cell viability and morphology assays could be deficient parameters in evaluating the biocompatibility of dental resin materials.
Introduction
The water-soluble methacrylate monomer, 2-hydroxyethyl-methacrylate (HEMA), is frequently found in dental adhesives, 1,2 and, because of its small size and hydrophilic properties, it is widely used in enhancing the binding of resin composites to dentin. 3 Although HEMA has several advantages, one of the main drawbacks is the release of the monomer from the polymerized matrix into the oral cavity, and its diffusion through the dentin into the pulp space. 4,5 The release of resin monomers is due to an incomplete polymerization of the resin matrix or to the pathological conditions of the oral cavities, which can affect the degradation of the resin composite. 6 Unreacted monomers can be released directly into the oral cavity or via dentin microchannels into the pulp where they can reach millimolar per liter (mmol/L) concentrations. 7
Released substances can induce adverse effects, such as tissue inflammation, 8,9 apoptosis, 10 and genotoxic and mutagenic effects 11,12 and can reduce cell proliferation. 13 HEMA causes a depletion of the intracellular glutathione, 14 which leads to oxidative stress, responsible for the inhibition or alteration of important cellular components such as lipid peroxidation in cell membranes 15,16 and modifications of transduction pathways. 17
The toxic effects induced by the monomers released are often tested at concentrations ranging from 0.1 to 30 mmol/L 14,18,19 and for short periods of time such as 24 and 72 hours. 2,10,20 These conditions reflect the amounts of monomers released from the dental filling after 24 or 48 hours of polymerization, 6,21 –23 but low concentrations of monomers are still detectable even after 15 and 28 days. 7,24,25 It has recently been demonstrated that doses of HEMA which do not induce cell death can be responsible for a downregulation of protein synthesis in exposed cells. 26 –28
Currently, there is little information about the metabolic or functional conditions of cells which have been exposed to dental material components at low concentrations for periods of exposure longer than 1 week. 29 We have previously demonstrated that HEMA (3 mmol/L) exposure in human gingival fibroblasts (HGFs) for 96 hours caused a decrease in the expression and synthesis of the procollagen α1 type 1 protein. 30
Collagen type I is the most abundant protein of the extracellular matrix with a structural function. 31 In vitro cultured fibroblasts produce procollagen α1 type I in a great amount, and toxic effects to fibroblasts are related to modifications in the synthesis of this protein. 32
In the current work, studies were conducted to demonstrate the effects of low concentrations of HEMA for prolonged periods of time, ranging from 72 hours to 2 weeks, on the synthesis and the expression of procollagen α1 type I in a primary culture of HGFs.
The null hypotheses tested were (1) HEMA at low concentrations has no effect on the expression and synthesis of procollagen α1 type I in treated HGFs and (2) the effect of HEMA is not related to prolonged exposure time.
Materials and Methods
Cell Culture
Human gingival fibroblasts were obtained from biopsies of healthy gingivae of permanent molars. 19,33 Informed consent was obtained from the donors according to the guidelines of the University of Bologna. The biopsies were stored in Dulbecco modified Eagle medium (DMEM)/F12 medium (Euroclone, Celbio, Milano, Italy) before being cut into small pieces, placed in 6 cm2 tissue culture petri dishes and grown in DMEM medium supplemented with 10% fetal bovine serum (FBS), 1% penicillin, 1% streptomycin, 1% fungizone (Euroclone) at 37°C, in an atmosphere containing 5% CO2 and 95% relative humidity. After reaching a confluence of 70%, the cells were washed with phosphate buffered saline (PBS), detached from the petri dishes by means of a brief treatment with trypsin/EDTA and seeded into 25 cm2 tissue culture flasks in growth media. Cells from passage numbers 4 to 12 were used for the following experiments.
2-Hydroxyethylmethacrylate Exposure
2-Hydroxyethylmethacrylate (Fluka Sigma-Aldrich, St Louis, Missouri) was previously dissolved in ethanol as solvent at a concentration of 1 mol/L (stock solution). Subsequently, HGFs were treated for 72 hours with different concentrations of HEMA 0.5 mmol/L, 1 mmol/L, 1.5 mmol/L, and 3 mmol/L freshly diluted from the stock solution in DMEM prior to each experiment and the medium was changed every 3 days, completed with HEMA at the right dilution. Only the concentrations of 0.5 and 1 mmol/L were tested for 1 and 2 additional weeks.
For each concentration of DMEM treatment, the final concentration of ethanol used for cell treatment was no more than 0.5%, which corresponds to a nontoxic concentration as described in our previous data. 28,30 Controls consisted of HGFs exposed to the same concentration of solvent for the previously described periods of time.
3-(4,5-Dimethylthiazol-2-yl)-2,5-diphenyltetrazolium Bromide Assay
Cell viability was measured using 3-(4,5-dimethylthiazol-2-yl)-2,5-diphenyltetrazolium bromide (MTT). At the end of each treatment, HGFs plated in 96-well plates (2 × 10⁵ cells/well) were washed and incubated with 0.5 mg/mL MTT in PBS for 5 hours at 37°C followed by a 5-minute wash in MTT solvent (0.1 N HCl in isopropanol) to solubilize the MTT—formazan. The optical density was read at 570 nm by Microplate Reader (Model 680, Biorad Lab Inc, California). MTT data were presented as the mean (±S.D.) of triplicate experiments. Statistical differences were assessed by 1-way analysis of variance (ANOVA; P < .05) and Dunnett multiple comparison test (P < .05). The statistical analysis was performed with GraphPad Prism 5.0 software (San Diego, California).
Protein Extraction and Western Blot Analysis
Cell pellets obtained from HGFs exposed to HEMA as previously described were lysed with a modified lysis buffer (radioimmunoprecipitation assay [RIPA]; 50 mmol/L; Tris-Hcl pH 7.4; 1% NP-40; 150 mmol/L NaCl; 2 mmol/L EDTA; 0.1% sodium dodecyl sulfate [SDS]; 1 mmol/L EGTA; 1 mmol/L phenylmethanesulfonyl fluoride [PMSF]; 0.15% β mercaptoethanol [βME]) containing a protease inhibitor cocktail (Sigma Aldrich) and then centrifuged at 14 000 rpm for 10 minutes at 4°C. Bradford protein assay 34 was used to determine the quantity of protein obtained in each sample. Then, 60 µg of total protein from each sample was separated on 8% SDS polyacrylamide gel electrophoresis (SDS-PAGE) and then into a nitrocellulose membrane using a wet blotting apparatus (Bio-Rad Laboratories S.r.l., Milano, Italy). The membranes were blocked with 5% dry milk (Bebilac, Cesena, Italy) in Tris buffer solution/0.1% Tween 20 (blocking reagent) for 1 hour at room temperature (RT) and then incubated with anti-procollagen α1 type I antibody (Santa Cruz Biotecnology, Inc, Santa Cruz, California) diluted to 1:5000 in blocking reagent or anti-β-tubulin antibody (Sigma Aldrich) diluted to 1:10000 for 3 hours at RT followed by horseradish peroxidase-conjugated anti-goat immunoglobulin G (IgG) antibody (Santa Cruz Biotechnology, Inc) specific for anti-procollagen antibody and horseradish peroxidase-conjugated anti-mouse IgG antibody specific for anti-β-tubulin antibody. Both antibodies were diluted to 1:80000 in blocking reagent for 1 hour at 37°C. Bands were visualized with the chemiluminescence detection system (Euroclone). Images were obtained by Image Station 2000R (Kodak, New York, New York).
Band densitometry was measured using Image J software (National Institutes of Health). Intensities of the specific protein bands were calculated as percentage intensity of the control sample and corrected for equal β-tubulin loading. The experiment was performed in triplicate. Statistical differences were assessed by 1-way ANOVA (P < .05) and Dunnett multiple comparison test (P < .05). The statistical analysis was performed with GraphPad Prism 5.0 software.
Immunofluorescence Microscopy of Procollagen α1 Type I
Human gingival fibroblasts were grown as a monolayer on cover glasses and treated with HEMA as described previously. Two cover glasses were prepared for each treatment. Samples were washed briefly with PBS and fixed with 4% formalin/0.1% Triton X100 in PBS for 20 minutes at 4°C. After a brief rinsing, the samples were blocked with 1% dry milk in PBS (blocking reagent) (Bebilac) for 30 minutes at RT and then incubated with anti-procollagen α1 type I antibody (Santa Cruz Biotechnology, Inc) diluted to 1:400 in blocking reagent at 37°C for 1 hour. After 3 washes with PBS for 10 minutes each, the samples were incubated with CY3-conjugated anti-goat IgG antibody (Sigma) diluted to 1:2000 in blocking reagent at 37°C for 1 hour. Finally, the slides were washed 3 times in PBS and then mounted in VECTASHIELD mounting medium with 4,′6-diamidino-2-phenylindole ([DAPI]; Vector Laboratories, Burlingame, California). The slides were observed under a fluorescence microscope (Nikon Eclipse E800, Tokyo, Japan).
Control specimens consisted of HGFs exposed to HEMA under the same conditions, fixed with 4% formalin/0.1% Triton X-100 for 20 minutes at 4°C and incubated with only the secondary antibody.
Reverse Transcriptase Polymerase Chain Reaction
Total RNA was extracted from HGFs exposed to HEMA as previously described using the RNeasy Mini Kit (Qiagen Germantown, Maryland), according to the manufacturer’s instructions. To remove the presence of genomic DNA, a DNase I digestion step was performed (RNase-Free DNase Set, Qiagen, Germantown) during the isolation procedure. An ND-1000 NanoDrop Spectrophotometer (NanoDrop Technologies, Rockland, Delaware) was used to determine the concentration and quality of isolated total RNA by calculating the ratio of absorbance of the samples at 260 nm versus 280 nm. Total RNA, 1 µg, was reverse transcribed into complementary DNA (cDNA) with the aid of the GeneAmp Gold RNA PCR Core Kit (Applied Biosystems, Foster City, California), according to the manufacturer’s instructions. Reverse-transcribed cDNA, 1 µL was then amplified by polymerase chain reaction (PCR) with specific primers for the human collagen α1 type I gene (COL1A1) (MWG Biotech, Ebersberg, Germany) and for the human glyceraldehyde-3-phosphate dehydrogenase gene (hGAPDH; MWG Biotech), which was used as a housekeeping gene for amplification control during the PCR assay. The primer sequences were designed by Primer Express Software (Applied Biosystems) as follows: COL1A1 (target size, 468 bp) sense, 5′-ATTCCAGTTCGAGTATGGCGG-3′; antisense, 5′-GTTGCTTGTCTGTTTCCGGGT-3′; hGAPDH (target size, 1041 bp) sense, 5′-GTCAGTGGTGGACCTGACCT-3′, antisense, 5′-AGGGGTCTACATGGCAACTG-3′.
The reverse transcriptase PCR (RT-PCR) products were analyzed by electrophoresis on 2% agarose gel stained with ethidium bromide, and the gel images were acquired under ultraviolet light by Image Station 2000R (Kodak). The data presented are representative of 3 independent experiments.
Results
3-(4,5-Dimethylthiazol-2-yl)-2,5-diphenyltetrazolium Bromide Assay
To evaluate the potential toxic effects of the different doses of HEMA, an MTT assay was carried out at the concentrations tested and for different periods of time ranging from 72 hours to 2 weeks. After 72 hours of treatment with 0.5, 1, 1.5, and 3 mmol/L HEMA, the cell viability decreased to 58% compared with control samples (Figure 1). Long-term exposure of 1 and 2 weeks, at the lower concentrations of HEMA (0.5 and 1 mmol/L), did not show any significant decrease of the cell viability (Figure 1).
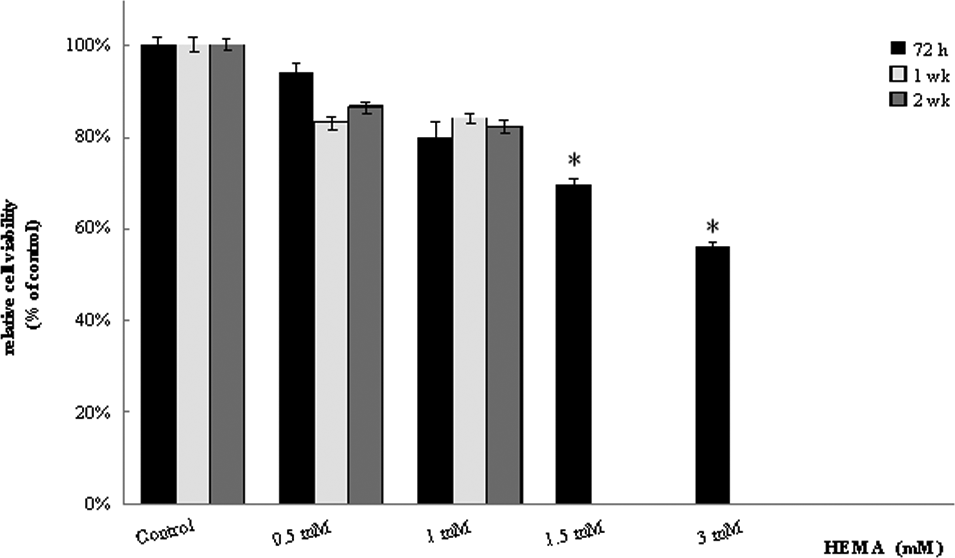
3-(4,5-Dimethylthiazol-2-yl)-2,5-diphenyltetrazolium bromide (MTT) assay on HGFs exposed to 0.5, 1, 1.5, and 3 mmol/L of HEMA for 72 hours, 1, and 2 weeks. The data represent the mean (±SD) of triplicate experiments and are expressed as a percentage of the control value. *Statistically significant differences between groups (P < .05). HGF, human gingival fibroblast; HEMA, 2-hydroxyethylmethacrylate; SD, standard deviation.
Western Blot Analysis
To test whether low concentrations of HEMA can affect the synthesis of the procollagen α1 type I protein, Western blot analysis was carried out on HGFs exposed for 72 h (Figure 2A). The results showed a progressive decrease of the protein signal, starting from 0.5 to 3 mmol/L in which a low signal was still detectable as compared with the control group. Compared with the expression in control samples, which was defined as 100%, the decrease in the expression of procollagen α1 type I protein ranged between 96% and 34% in HGFs treated for 72 hours (Figure 3A).
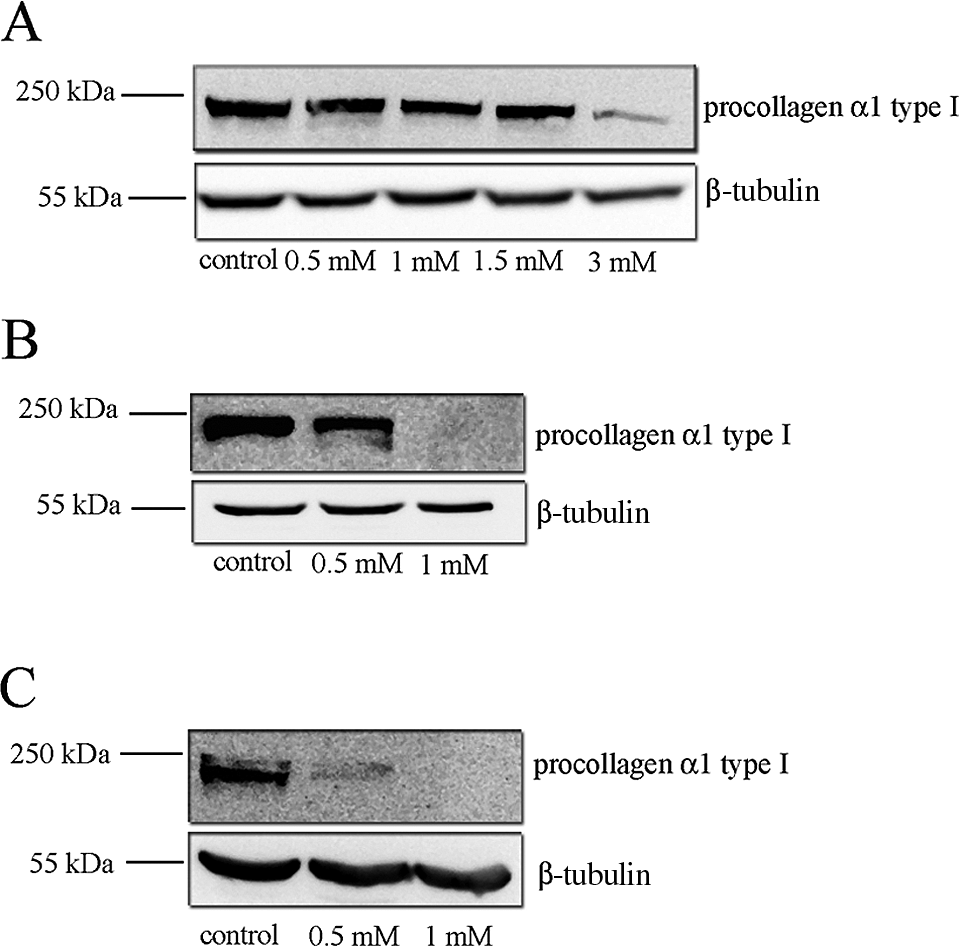
Western blot analysis for procollagen α1 type I protein in HGFs exposed to 0.5, 1, 1.5, 3 mmol/L HEMA for 72 hours, 1, and 2 weeks. A, HGFs treated with HEMA for 72 hours. B, HGFs treated for 1 week. C, HGFs treated for 2 weeks. β-Tubulin represents the loading control. HGFs, human gingival fibroblasts; HEMA, 2-hydroxyethylmethacrylate.
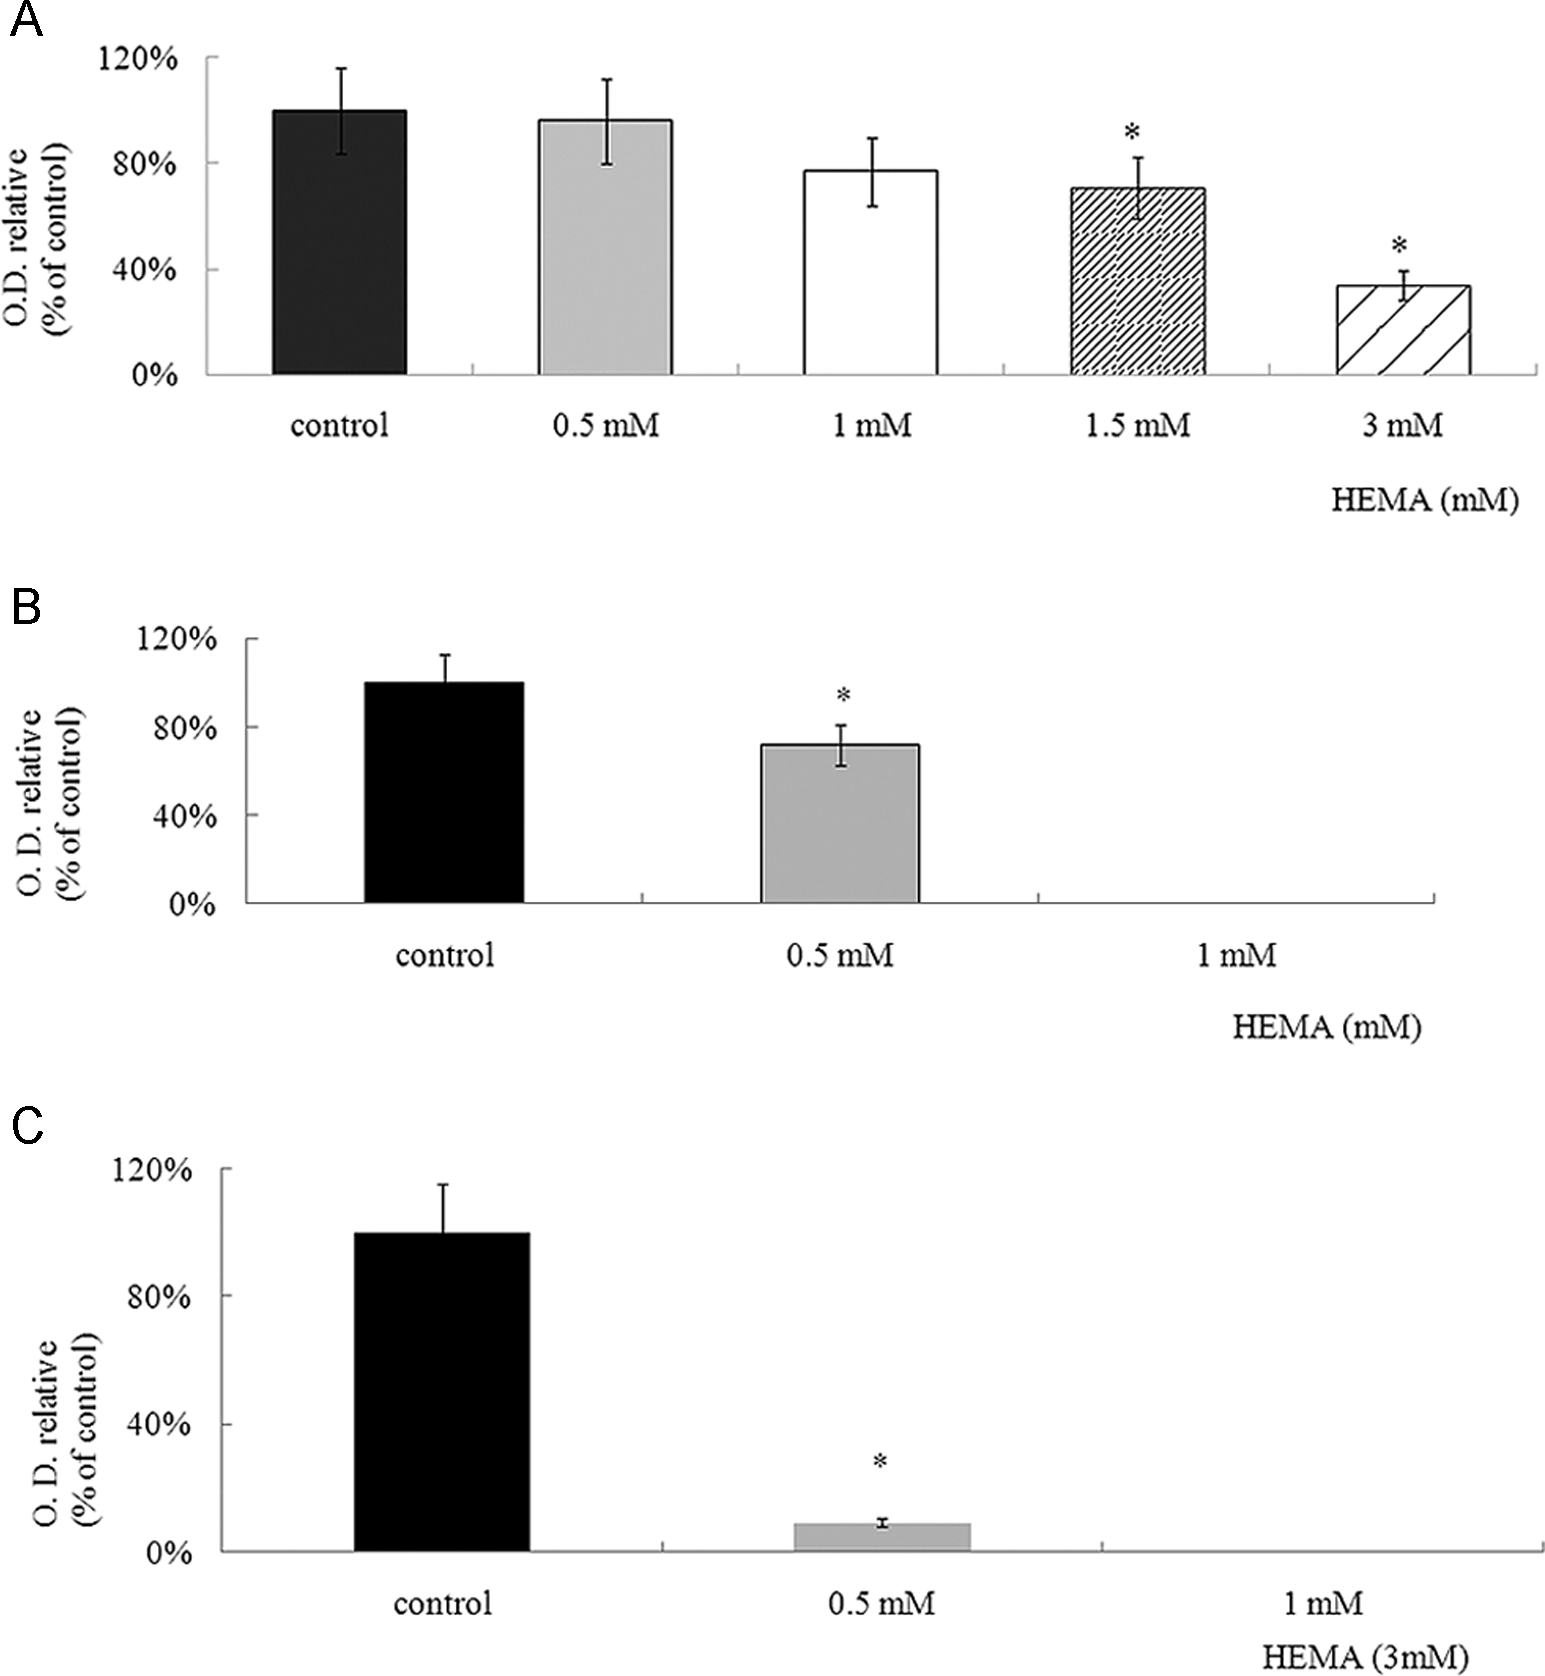
Densitometry of procollagen α1 type I Western blot bands. Intensities of the specific protein bands were calculated as percentage intensity of the control sample and corrected for equal β-tubulin loading. * represents a significant difference from control samples, P < .05.
Subsequently, HEMA at 0.5 and 1 mmol/L was tested for prolonged time periods of 1 and 2 weeks. Figure 2B shows the presence of a band corresponding to the protein in samples treated with 0.5 mmol/L whereas the signal was absent in samples treated with 1 mmol/L.
After 2 weeks of HEMA exposure, in samples exposed to 0.5 mmol/L, the signal corresponding to the protein was 9% compared with control samples (Figures 2C, 3C), whereas no signal was detectable at the concentration of 1 mmol/L (Figure 2C).
Immunofluorescence Microscopic Localization of Proteins in Cells
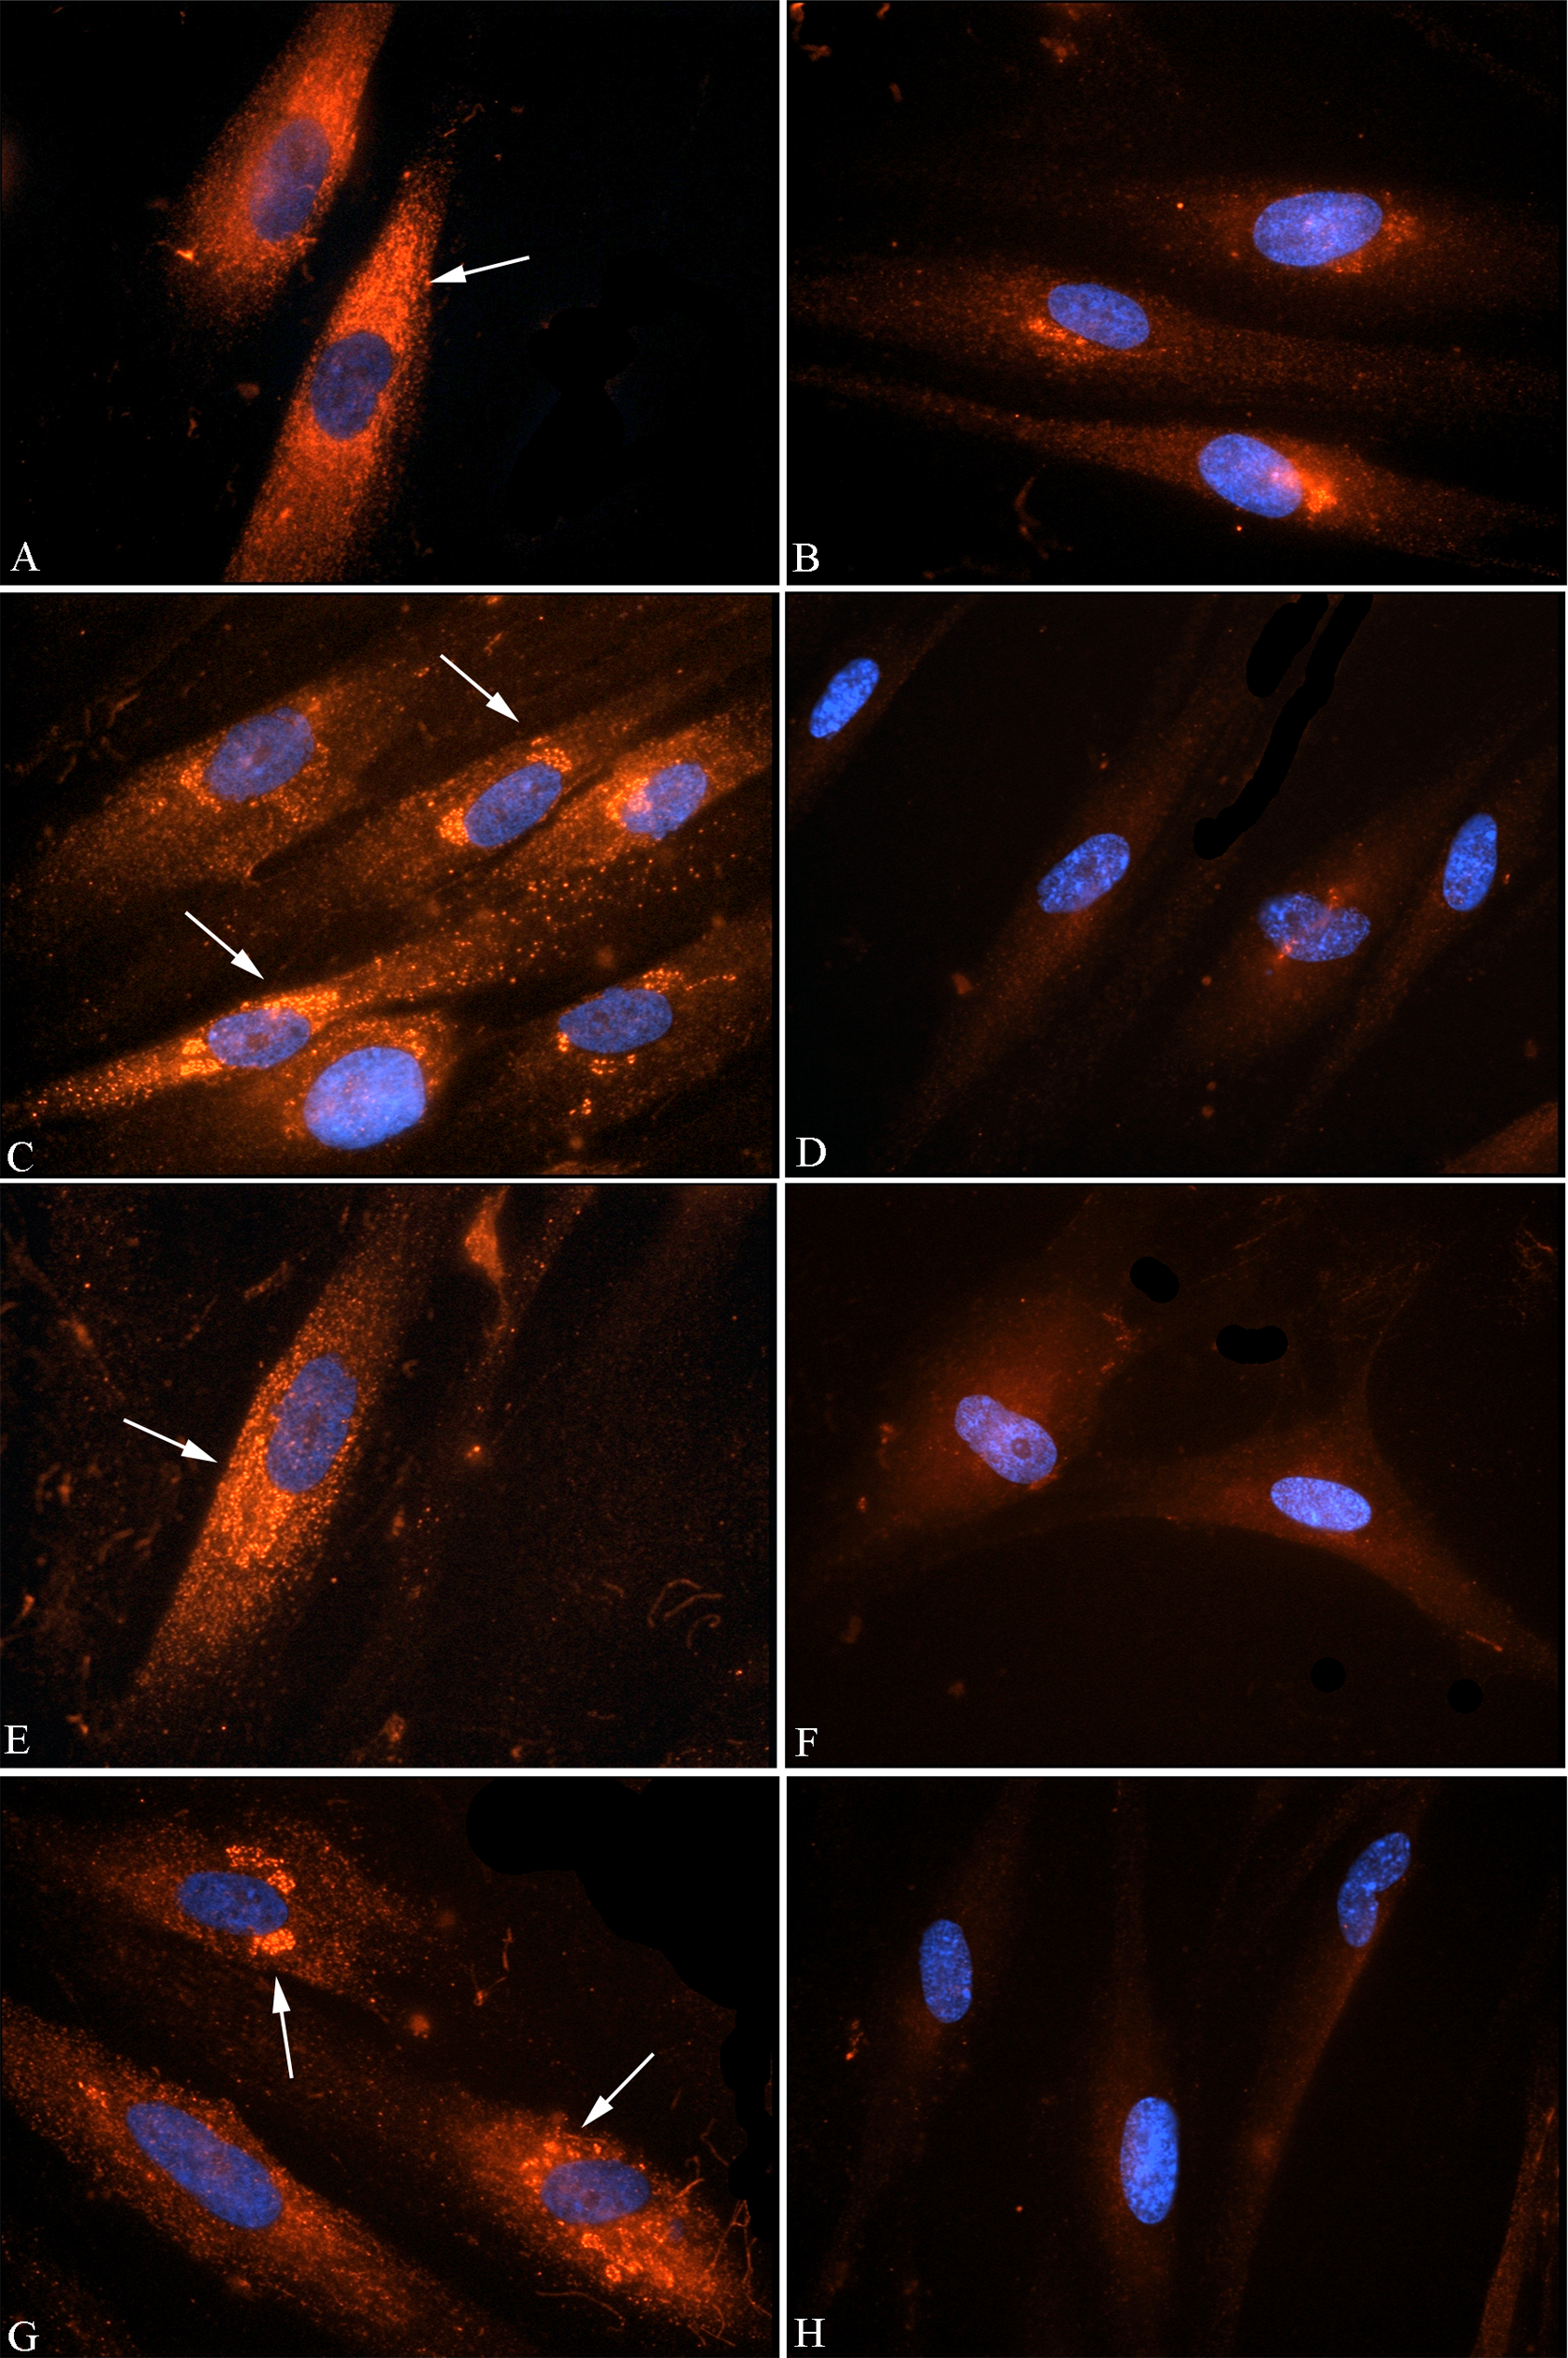
To localize the protein in gingival fibroblasts and to determine whether the resin monomer could affect the presence and localization of the protein, immunofluorescence microscopy of the procollagen α1 type I protein was carried out. After 72 hours of HEMA exposure, control samples showed a characteristic labeling pattern of the protein around the cell nucleus (Figure 4A, C, E, G). The labeling pattern slightly decreased in samples treated with 0.5 mmol/L (Figure 4B), 1 mmol/L (Figure 4D), and 1.5 mmol/L (Figure 4F) whereas it was almost absent in samples treated with HEMA 3 mmol/L (Figure 4H).
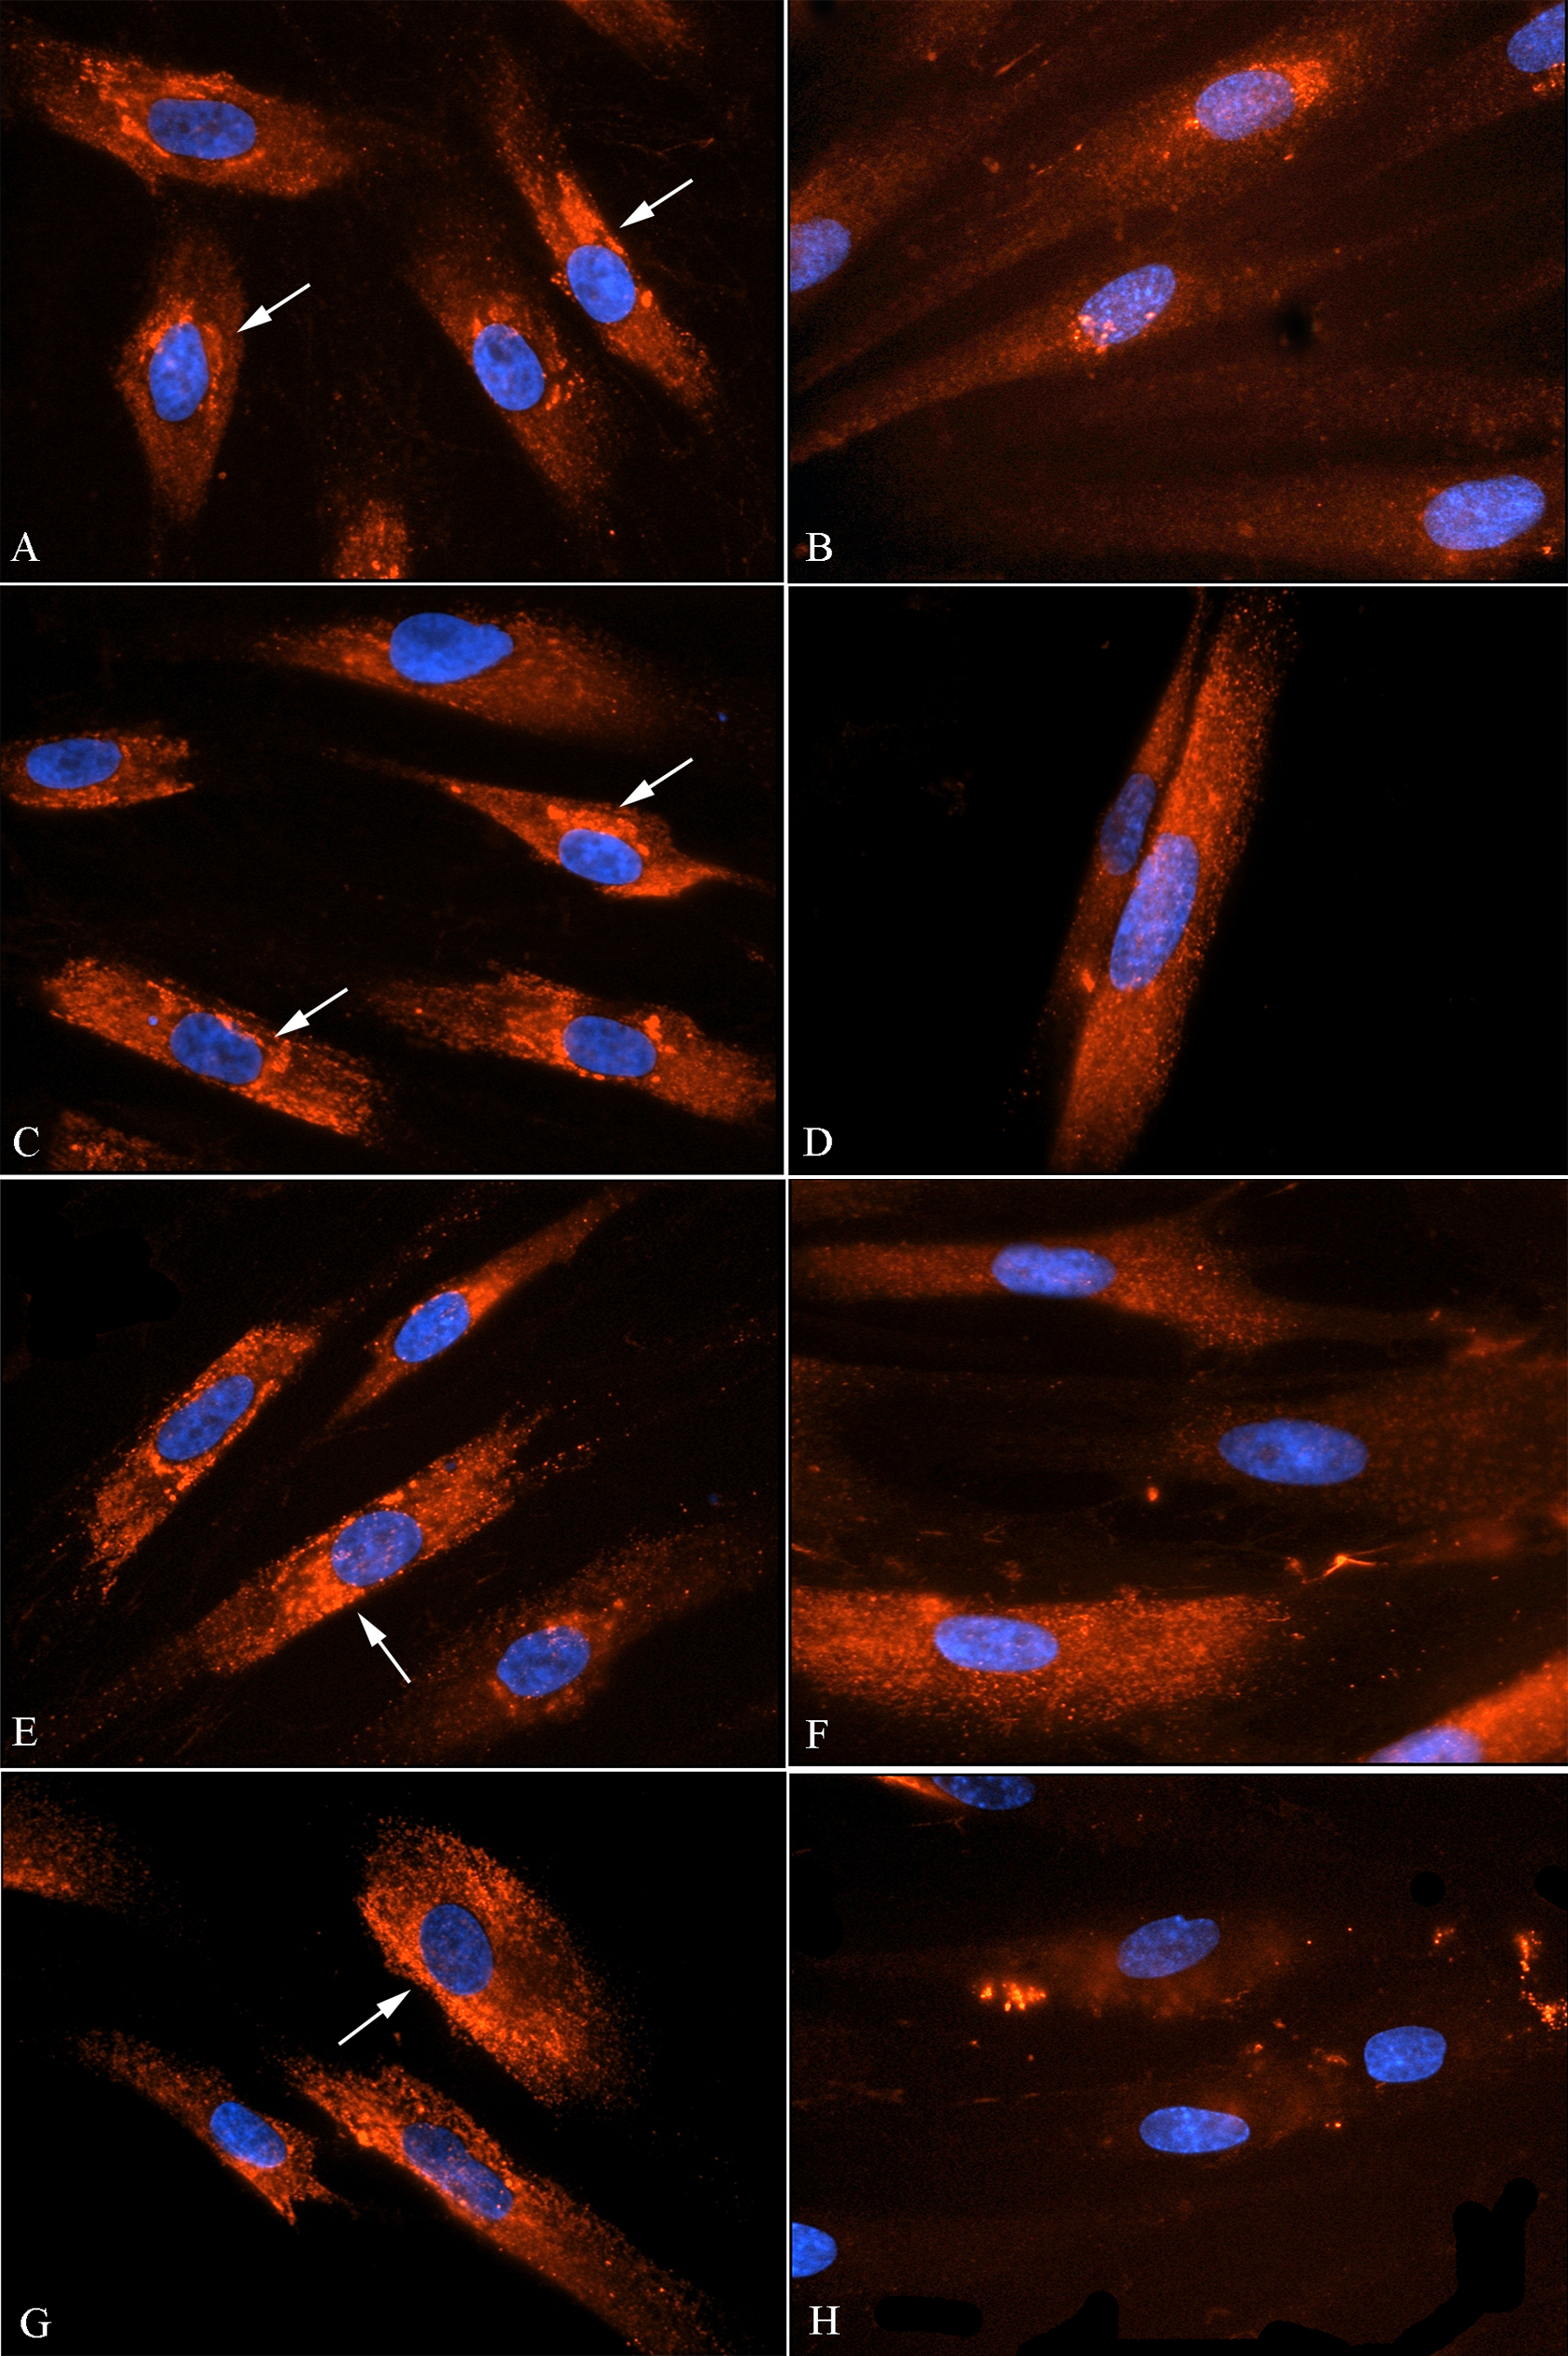
Immunocytochemical localization of procollagen α1 type I protein in HGFs treated with HEMA for 72 hours. CY3-conjugated secondary antibody was used to detect the localization of the procollagen α1 type I protein. All samples were counterstained with DAPI. A, Control samples treated with the same volume of HEMA solvent corresponding to the concentration of 0.5 mmol/L (600×); C, Control samples treated with the same volume of HEMA solvent corresponding to the concentration of 1 mmol/L (600×); E, control samples treated with the same volume of HEMA solvent corresponding to the concentration of 1.5 mmol/L (600×); G, Control samples treated with the same volume of HEMA solvent corresponding to the concentration of 3 mmol/L (600×). In all control samples, the CY3 signal corresponding to the protein localizes specifically around the cell nucleus (arrow). B, HGFs exposed to 0.5 mmol/L HEMA (600×); D, HGFs exposed to 1 mmol/L HEMA (600×); F, HGFs exposed to 1.5 mmol/L HEMA (600×); H, HGFs exposed to 3 mmol/L HEMA (600×). The fluorescence signal progressively decreased from samples treated with 0.5 mmol/L to samples treated with 3 mmol/L. The specific localization of the procollagen α1 type I protein gradually disappears in all treated samples. HGFs, human gingival fibroblasts; HEMA, 2-hydroxyethylmethacrylate; DAPI, 4,′6-diamidino-2-phenylindole.
After 1 and 2 weeks of HEMA treatment, the control cells still demonstrated the typical labeling pattern of procollagen α1 type I protein localized surrounding the nucleus (Figure 5A, C, E, G), whereas the treated samples showed a decrease in protein signal after 1 week of exposure (Figure 5B, D) and a lack of protein signal after 2 weeks of HEMA exposure (Figure 5F, H).
Immunocytochemical localization of procollagen α1 type I protein in HGFs exposed to HEMA 0.5 mmol/L and 1 mmol/L for 1 and 2 weeks. CY3-conjugated anti-mouse IgG antibody was used to detect the localization of the protein. All samples were counterstained with DAPI. A, Control samples treated with the same volume of HEMA solvent corresponding to the concentration of 0.5 mmol/L for 1 week (600×); C, control samples treated with the same volume of HEMA solvent corresponding to the concentration of 1 mmol/L for 1 week (600×); E, Control samples treated with the same volume of HEMA solvent corresponding to the concentration of 0.5 mmol/L for 2 week (600×); G, Control samples treated with the same volume of HEMA solvent corresponding to the concentration of 1 mmol/L for 2 week (600×). In all control samples, the CY3 signal corresponding to the protein localizes specifically around the cell nucleus (arrow). B, After 1 week of 0.5 mmol/L HEMA exposure the protein is still detectable whereas in the sample exposed to 1 mmol/L of HEMA, a strong reduction of the protein signal is detectable (D), (600×). After 2 weeks of 0.5 (F) and 1 mmol/L HEMA exposure (H), no signal of the protein is detectable (600×). HGFs, human gingival fibroblasts; HEMA, 2-hydroxyethylmethacrylate; DAPI, 4,06-diamidino-2-phenylindole.
Reverse Transcriptase Polymerase Chain Reaction
To test whether low-dose concentrations of HEMA could influence the expression of procollagen α1 type I messenger RNA (mRNA), a RT-PCR analysis was carried out. Figure 6A showed a gradual decrease in the signal corresponding to the transcripts in all the concentrations tested after 72 hours of exposition.
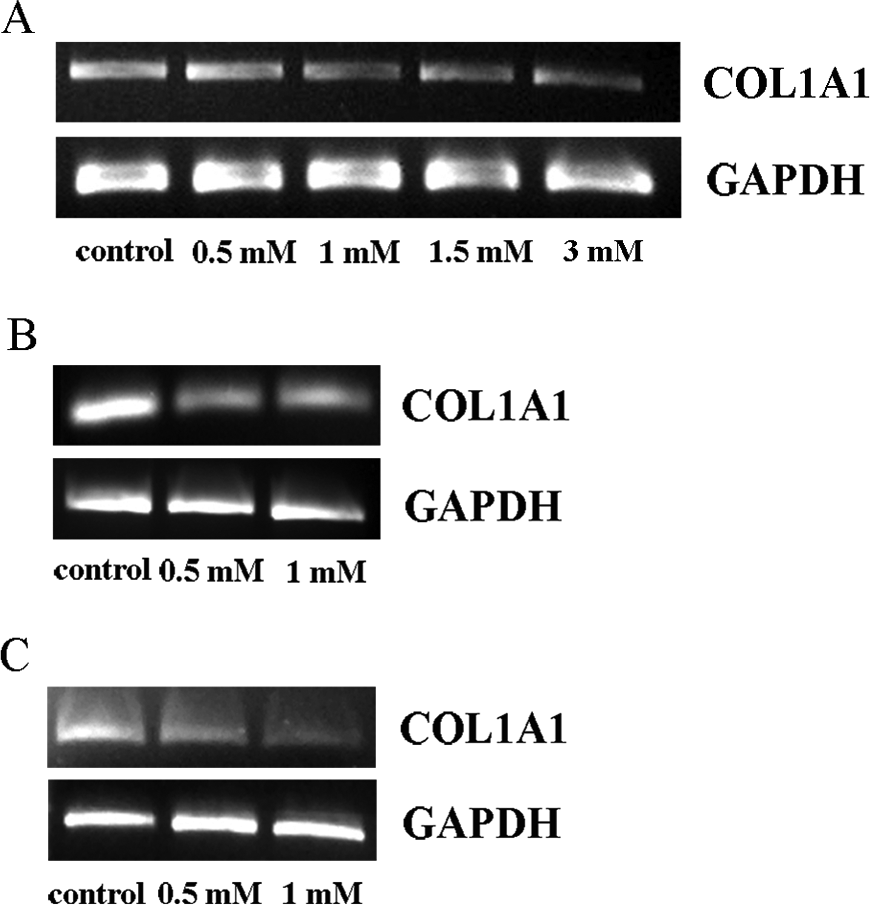
A, Expression of COL1A1 mRNA in HGFs exposed to 0.5, 1, 1.5, and 3 mmol/L HEMA for 72 hours. B, Expression of COL1A1 mRNA in HGFs exposed to 0.5 and 1 mmol/L HEMA for 1 week. C, Expression of COL1A1 mRNA in HGFs exposed to 0.5 and 1 mmol/L HEMA for 2 weeks. hGAPDH was used as a RT-PCR control assay. HGFs, human gingival fibroblasts; HEMA, 2-hydroxyethylmethacrylate; mRNA, messenger RNA; hGAPDH, human glyceraldehyde-3-phosphate dehydrogenase; RT-PCR, reverse transcriptase polymerase chain reaction.
After 1 week of HEMA treatment (Figure 6B), the bands corresponding to the transcripts were still present but the intensity decreased as compared with the controls, whereas after 2 weeks of HEMA exposure, a stronger reduction in the transcript signal compared with the control and to samples treated for 72 hours and 1 week was detectable (Figure 6C).
Discussion
The toxicity of resin components is related both to a short-term release of free monomers occurring during the matrix polymerization and to a long-term release of leachable substances of the resin matrix generated by erosion and degradation over time. 21,35 Unbound monomers favor bacterial proliferation and can initiate cellular and molecular mechanisms of cytotoxicity in pulp and gingival cells. 36
Release of molecules of dental resins during polymerization occurs within the first hours after initial polymerization. 6,21 –23 Generally, more than 15% to 50% of the monomers remain unreacted 37 and the high concentrations released induce serious effects, such as cellular stress with the formation of reactive oxygen species (ROS), which leads to cell death via apoptosis and/or necrosis. 16,38,39
However, leachable substances are also generated by the erosion and degradation of the polymerized resin matrix over time. The degradation is often caused by hydrolysis or enzymatic catalysis, such as saliva esterases, which catalyze the biodegradation of resinous materials 1,40 and increase the long-term diffusion of released monomers. The concentrations of the leachable substances released by degradation over time could be low, 41,42 and the cytotoxic effects induced by these monomers over long-term exposure have only partially been studied.
In our previous studies, we demonstrated the influence of HEMA on the synthesis of the procollagen α1 type I protein in gingival fibroblasts and pulp fibroblasts. 27,30 We tested the concentration of 3 mmol/L, which is in the range of concentration of resin monomers released from the polymerized matrix in the first 24 hours. 6,7
In this study, we tested lower concentrations of HEMA ranging from 0.5 mmol/L to 3 mmol/L, for prolonged periods of time to determine whether lower concentrations of resin monomers can downregulate the synthesis of procollagen α1 type I protein. The concentrations tested mimic an in vivo situation in which the release of substances from a polymerized matrix are due to degradation and erosion over time, potentially inducing long-term cytotoxic effects.
MTT assay revealed that a long-term exposure of low concentrations of HEMA does not affect cell viability, and immunofluorescence microscopy showed that the morphology of the HGFs was not compromised by HEMA treatment. From these data, it seems that low doses of HEMA for long-term exposure did not significantly affect cell metabolism.
The effects of HEMA on the synthesis of the procollagen α1 type I protein was investigated by Western blot and immunofluorescence microscopy. Both results demonstrated that the protein decreased with the increase of HEMA concentration after 72 hours of treatment. Subsequently, we demonstrated that low concentrations of HEMA downregulate the procollagen α1 type I protein with long-term exposure. In fact, after 72 hours a protein signal of 34% was still detectable whereas after 2 weeks, it was almost absent (9%).
Reports on the effects of low concentrations of resin monomers on fibroblast activity are limited. The effects on the reduction in cell proliferation and accumulation of cells in the S-phase have been observed after HEMA treatment. 13,43 A similar effect of low concentrations (less than 10 mmol/L) has previously been reported for another widely used resin monomer triethyleneglycoldimethacrylate (TEGDMA). 43 These data underscore a possible condition of stress in the cell that leads to a decrease in protein synthesis. Although the effects of HEMA on cell viability and toxicity are well described, only limited data take into consideration the exact mechanisms that are at the base of HEMA toxicity. Spagnuolo and collegues 10 suggested that HEMA induces cell death predominantly due to apoptosis rather than necrosis. Furthermore, it has been well demonstrated that elevated levels of ROS are observed immediately after HEMA treatment. 10,38,43 –45 Reactive oxygen species are normally produced by the cell during normal metabolism, but their level increases after exposure to chemical agents, such as dental monomers. 6 Cellular lipids, proteins, and DNA are damaged when the production of ROS is higher than the cellular antioxidant defense systems.
We propose that the reduced production of procollagen α1 type I protein could be a consequence of the high levels of ROS induced by HEMA exposure, which enhance protein degradation. 11 Furthermore, recent data demonstrated a direct interaction of HEMA with the double-strand DNA inducing double-strand braeks 12 in combination with ROS levels that can damage DNA, we decided to test the expression of the mRNA (COL1A1) corresponding to the procollagen α1 type I protein as a measure of potential damage that affects DNA.
Our results show that a reduction in the COL1A1 mRNA does not correlate well with the observed protein expression, suggesting that the reduction of the protein signal could be due to a combination of effects induced by HEMA, the direct interaction of HEMA with DNA, 12 and the induced high levels of ROS, which are responsible for cell protein degradation. 11
The findings herein presented correlate well with the previous reports on the dental resin monomer TEGDMA, which is responsible for modified gene expression in treated human fibroblasts. Among the genes analyzed, COL1A1 was demonstrated to be downregulated by TEGDMA treatment. 46
Our data demonstrated that resin-based dental materials can affect the synthesis of proteins in human fibroblasts even when they are tested over long periods of time and at low concentrations. These results suggest that low concentrations of dental monomers could modify normal cell activity and repair processes induced by treatment with chemical agents. Putative cell signalling pathways involved in the mechanism of dental resin toxicity is one of the next steps that needs to be elucidated.
Footnotes
The author(s) declared no conflicts of interest with respect to the authorship and/or publication of this article.
This study was supported by grants from the University of Bologna RFO (ex-60%), “Ministero dell’Istruzione dell’Università e della Ricerca, PRIN 2007” (grant number 2007LTN5PN), Italy and Ricerca finalizzata 2006, Ministero della Salute, Italy.