
Abstract
This article reports the results of neurobehavioral tests on representative aromatic constituents, specifically C9 to C11 species. The testing evaluated effects in several domains including clinical effects, motor activity, functional observations, and visual discrimination performance. Exposures ranging from 600 to 5000 mg/m3, depending on the molecular weights of the specific aromatic constituents, produced minor, reversible effects on the central nervous system (CNS), particularly in the domains of gait and visual discrimination. There was little evidence of effects at lower exposure levels. There was some evidence of respiratory effects at 5000 mg/m3 in 1 study, and there were also minor changes in body weight and temperature. The CNS effects became less pronounced with repeated exposures, corresponding to lower concentrations in the brain of 1 representative substance, 1,2,4-trimethyl benzene (TMB). At high exposure levels, the alkyl benzenes apparently induced their own metabolism, increasing elimination rates.
Keywords
Introduction
As part of an overall program to develop a method to calculate occupational exposure levels (OELs) for hydrocarbon solvents, the acute central nervous system (CNS) effects of several hydrocarbon solvents and a reference substance were assessed.
1
-5
The underlying principles for this program were that acute CNS effects are (1) a common property of hydrocarbon solvents
6
; (2) sensitive indicators of toxicological effects; and (3) can be used as a basis for OEL recommendations.
7
-9
As CNS effects are the most sensitive indicators of effects for most hydrocarbon solvents, protection against acute CNS effects affords protection against other neurological deficits as well as other chronic effects.
10,11
However, it should be noted that there are exceptional cases such as n-hexane in which certain hydrocarbon solvent constituents produce unique effects. For these substances, there is specific advice that must be observed to assure that exposures to these substances do not exceed their own OELs.
8
The overall objectives of the studies included in this program were 3-fold: to define and validate a battery of neurobehavioral tests that could be used to obtain data relating to similar neurobehavioral domains in rats and humans; to develop physiologically based pharmacokinetic (PBPK) models to predict human effect levels from rodent data; and to obtain acute neurobehavioral data on a set of representative hydrocarbon constituents in laboratory animals.
Ethanol was used as a reference substance to define a testing battery,
1
and 2 hydrocarbon solvents, cyclohexane and white spirit, were then used to validate the battery through the use of analogous tests in volunteers and rodents.
2,4
Physiologically based pharmacokinetic models for cyclohexane and white spirit that could be used to predict effect levels in humans from the results of animal studies were developed.
3,5
Finally, the models were validated through a comparison of the model predictions to the results of tests in volunteers. Based on these data, it was concluded that the initial objectives had been achieved and that further tests of representative hydrocarbon solvent constituents in volunteers were unnecessary as any additional data needs could be met by conducting animal tests at levels to which humans could not be exposed. Potential outcomes in humans could be predicted from the animal data using PBPK modeling.
3,5
Hydrocarbon solvents are often complex and comprised of 4 types of constituents—normal paraffins, isoparaffins, cycloparaffins, and aromatics—and with carbon numbers ranging from approximately 5 to 15. A matrix of representative substances was developed that included substances of each type and carbon number (Table 1 ). The representative substances included specific molecules as well as complex solvents comprised of single types of molecules but covering a range of carbon numbers. In addition to the test materials listed in Table 1, white spirit, a complex hydrocarbon solvent containing molecules of all 4 types with carbon numbers principally in the range of C9 to C11, was also tested. This report describes the studies of the representative aromatic molecules, predominantly alkyl benzenes.
Representative Hydrocarbon Solvent Constituents Evaluated for Acute Central Nervous System Effects
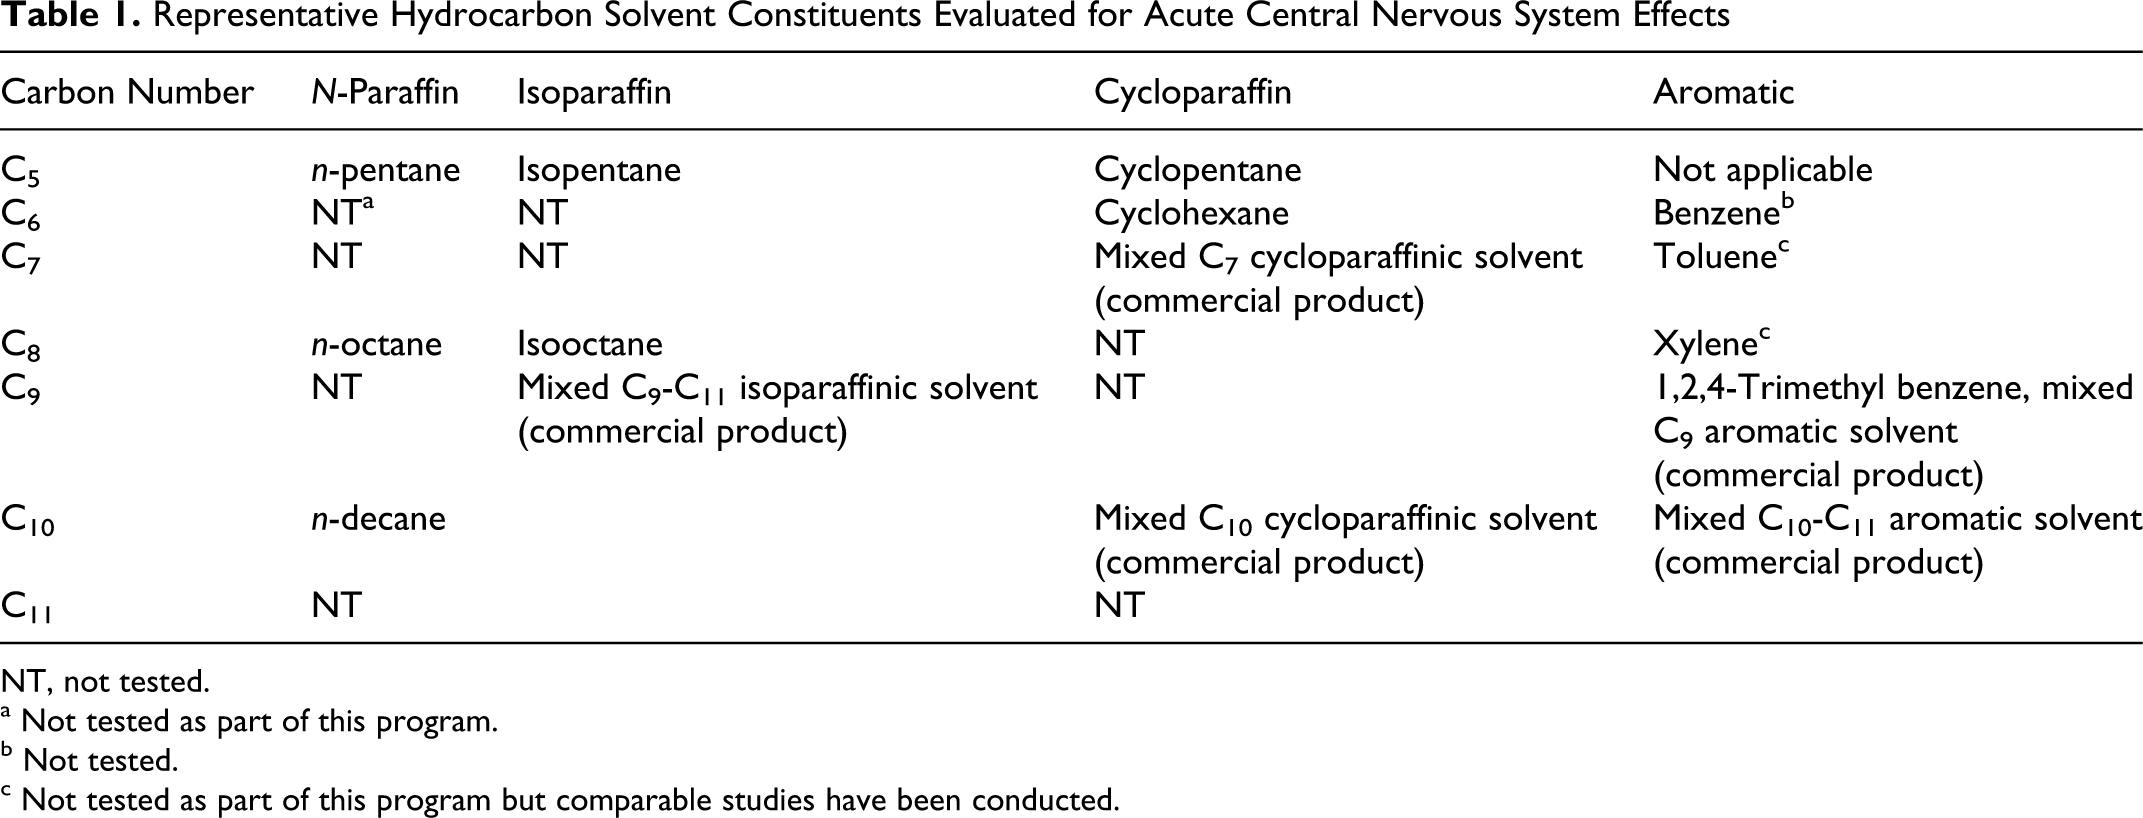
NT, not tested.
a Not tested as part of this program.
b Not tested.
c Not tested as part of this program but comparable studies have been conducted.
To identify representative aromatic molecules, the range of molecules in the carbon number range was examined. The lowest molecular weight aromatic molecule, benzene, when present in hydrocarbon solvents, is in such low levels that tests of benzene for acute CNS effects could not be justified. 8 The acute CNS effects of other low-molecular-weight aromatic molecules, for example, toluene and xylene, have already been extensively tested. 12 -18 Thus, for purposes of this program, efforts were focused on C9 to C11 aromatic molecules that represent the largest fraction of aromatic species in most hydrocarbon solvents. Aromatic molecules with carbon numbers greater than C11 may be present in some solvents but do not normally contribute greatly to exposure due to their low vapor pressures. The aromatic molecules in the C9 to C11 range include alkyl benzenes, naphthalene, and methyl naphthalenes, although the alkyl benzenes are found more commonly than are the 2-ring species. Accordingly, 3 aromatic substances were selected for test: 1,2,4-trimethyl benzene (TMB), a representative C9 alkyl benzene, and 2 complex aromatic solvents, 1 containing principally C9 constituents and the other C10/C11 constituents. These 3 substances were tested for acute CNS effects in rodents using procedures previously described. 1,2,4 The specific objective of the studies reported here was to provide representative data on the acute CNS effects of this group of compounds.
Methods
Test Materials
1,2,4-Trimethyl benzene
1,2,4-TMB (Chemical Abstract Service [CAS] number 95-63-6), purchased from J. T. Baker through Boom, Meppel, the Netherlands, had a listed purity of >98% and was used as supplied. Trimethyl benzene has a molecular weight of 120 Da, a density of 0.88 kg/L, and a boiling range of 168°C to 170°C.
Mixed isomer C9 aromatic solvent
The various C9 aromatic molecules, that is, ethyl toluenes and TMBs, as well as more highly alkylated species were assessed jointly in a test of a commercial, complex hydrocarbon solvent comprised principally of C9 aromatic molecules. This particular solvent, CAS number 64742-95-6, supplied by Shell Chemicals Europe, the Hague, the Netherlands, had a listed purity of >99%, that is, >99% of the content was consistent with the CAS definition and was used as supplied. It had an average molecular weight of 122 Da, a density of 0.88 kg/L, and a boiling range of 166°C to 180°C.
Mixed isomer C10/C11 aromatic solvent
The various C10/C11 aromatics, that is, alkyl benzenes, naphthalene, and methyl naphthalenes, were assessed jointly in a test of a commercial, complex hydrocarbon solvent comprised primarily of C10/C11 aromatic molecules. This solvent, CAS number 64742-94-5, supplied by Total Solvants, Oudalle, France, had a listed purity of 99.8%, that is, >99.8% of the content was consistent with the CAS definition and was used as supplied. It had an average molecular weight of 134 Da, a density of 0.89 kg/L, and a boiling range of 186°C to 214°C.
Animal Studies
All animal studies used male Wistar-derived WAG/RijCrlBR rats, obtained from Charles River Wiga, Sulzfeld, Germany. The animals were approximately 14 weeks of age at time of testing. Each of the functional observation and motor activity tests as well as each of the visual discrimination performance tests required 32 rats, randomly divided into 4 groups of 8 on a body weight basis. The blood and brain measurement study with TMB required an additional 87 rats. Matters of animal husbandry were as described previously. 1,2,4 The protocol was reviewed and approved by TNO’s Animal Ethics Committee. The welfare of the animals was maintained in accordance with the general principles governing the use of animals in experiments of the European Communities (Directive 86/609/EEC) and Dutch legislation (The Experiments on Animals Act, 1997).
Inhalation Exposure System
Rats were exposed by inhalation for periods of up to 8 hours/d for 3 consecutive days in modified H1000 inhalation chambers (Hazleton Systems, Inc, Aberdeen, Maryland). The 8-hour exposure period was chosen to mirror a working day. The exposures were repeated over several days to assess whether there was accumulation of hydrocarbon solvent constituents in the CNS with an exacerbation of effects over time. Target exposure concentrations were 125, 1250, or 5000 mg/m3 for TMB; 200, 1000, or 5000 mg/m3 for the mixed isomer C9 aromatic solvent; and 200, 600, or 2000 mg/m3 for the mixed isomer C10/C11 aromatic solvent. The lowest exposure levels were chosen to approximate recommended OELs for TMBs as these were assumed to be the highest levels to which humans would be exposed under normal circumstances. Higher exposure levels were multiples of the lowest levels and spanned ranges of at least an order of magnitude. For TMB, the highest concentration tested was near a maximally attainable vapor concentration, and for the other 2 solvents, the highest concentration tested was approximately the maximally attainable vapor concentration at 20°C. Test atmospheres were created by pumping liquid material through heated water baths to create vapors. The vapors were transported with an air stream and added to the main airflow systems for the inhalation chambers. The test atmospheres were continuously monitored as total hydrocarbons using a total carbon analysis method (TCA, Ratfish, Germany) and converted to exposure levels by comparison to concentrations in Tedlar bags (Chrompack, Bergen op Zoom, the Netherlands) of known size and content.
Evaluation of CNS Effects
The animals were evaluated for viability and other indicators of well-being, functional observations, motor activity, and 2-choice visual discrimination performance. The testing procedures will be briefly described here. The reader is referred to previous publications for greater detail. 1,2,4
Viability and other indicators of well-being
The assessment of viability and other indicators of well-being included daily health and viability checks. Additionally, body weights were recorded at randomization and on days of testing. Body temperatures were measured before exposure and after the first and third 8-hour exposure periods.
Functional observations and motor activity
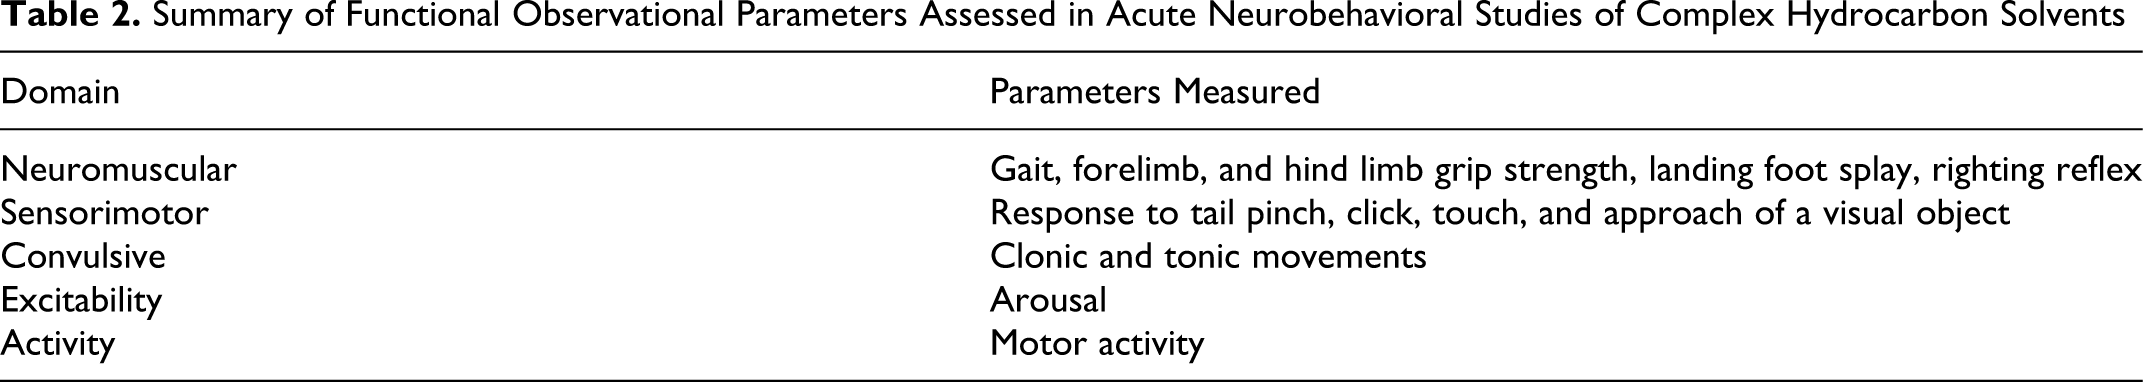
Neurobehavioral functioning was evaluated using selected measures from a standardized functional observational battery (FOB) and motor activity assessment protocol similar to that used in the World Health Organization/International Programme on Chemical Safety (WHO/IPCS) Collaborative Study on Neurotoxicity Assessment. 19 -21 The FOB consisted of standardized observations and simple tests designed to evaluate gross changes in neurological and behavioral functioning in the rat using measures taken from different functional domains as summarized in Table 2 . Spontaneous motor activity was measured in sessions of 30 minutes using an automated video image analysis system, with each rat placed individually in a 50 cm × 50 cm × 50 cm (l × w × h) open roofed cage. Rats were tested before exposure and after the first and third 8-hour exposure periods. The functional observation battery was conducted immediately after termination of exposure and required approximately 5 minutes per animal to complete. The motor activity testing was started immediately after completion of the FOB testing, so the animals were placed in the testing device 25 to 40 minutes after removal from the exposure chambers.
Summary of Functional Observational Parameters Assessed in Acute Neurobehavioral Studies of Complex Hydrocarbon Solvents
Visual discrimination performance
Separate groups of rats were evaluated for 2-choice visual discrimination performance. The apparatus consisted of 16 operant chambers (32 cm × 30 cm × 28 cm [l × w × h]) and programming and recording equipment programmed with the MedState notation system (Med Associates, Inc, St Albans, Vermont). Each operant chamber was equipped with 2 levers, 2 stimulus lights, and a water dipper for delivering water reinforcement. In addition, a photocell assembly was mounted in the water trough to detect the entry of each rat’s head when obtaining reinforcement. Each operant chamber was located in a ventilated, sound-attenuated cubicle. Prior to treatment, water-deprived rats were first trained to obtain water reinforcements and to lever press using auto-shaping techniques. The rats subsequently received 4 weeks of training on a discrete-trial light–dark visual discrimination task to stabilize baseline responding. Animals were trained 5 d/wk, from Monday to Friday.
Test sessions consisted of 100 trials or 60 minutes, whichever came first, and were conducted at approximately the same time each day. Dose groups were counterbalanced across time of testing and testing device. Trials were initiated by the illumination of either the left or right stimulus light, and the rat’s task was to depress the lever under the illuminated light to obtain a water reward. Illumination of right and left stimulus lights was counterbalanced and occurred in a predetermined semirandom order. If the rat pressed the correct lever, the stimulus light was extinguished and a water reward was delivered. If the initial response during a trial was on the incorrect lever, the rat was allowed to correct its mistake by pressing the lever under the illuminated stimulus light. A given trial remained in effect until the correct lever had been pressed. Trials were separated by an inter-trial interval (ITI) of 10 seconds. A response during the ITI reset the ITI timer, and the rat was required to wait a further 10 seconds before initiation of the following trial. Rats were tested on the day prior to the first exposure day and on each day of exposure immediately after the exposure period. A postexposure test was performed the day after the last exposure period to evaluate the persistence of effects.
Variables measured are summarized in Table 3 . For each rat, the accuracy of the initial response in each trial was recorded. If the initial trial response was correct, the latency of the lever press was also recorded. If the initial response was incorrect, the number of incorrect lever responses made by the rat before switching to the correct lever was recorded. Following a correct lever response, the water dipper was raised. The system recorded whether the rat positioned itself above the dipper to obtain the water reward, providing a measure of the number of reinforcements obtained. The latency to obtain the reinforcement on each trial was also recorded. During the inter-trial period, lekkkl;lver responses were recorded to determine the number of ITI periods in which 1 or more lever presses occurred and the number of repetitive ITI lever responses.
Summary of Dependent Variables in the 2-Choice Visual Discrimination Task
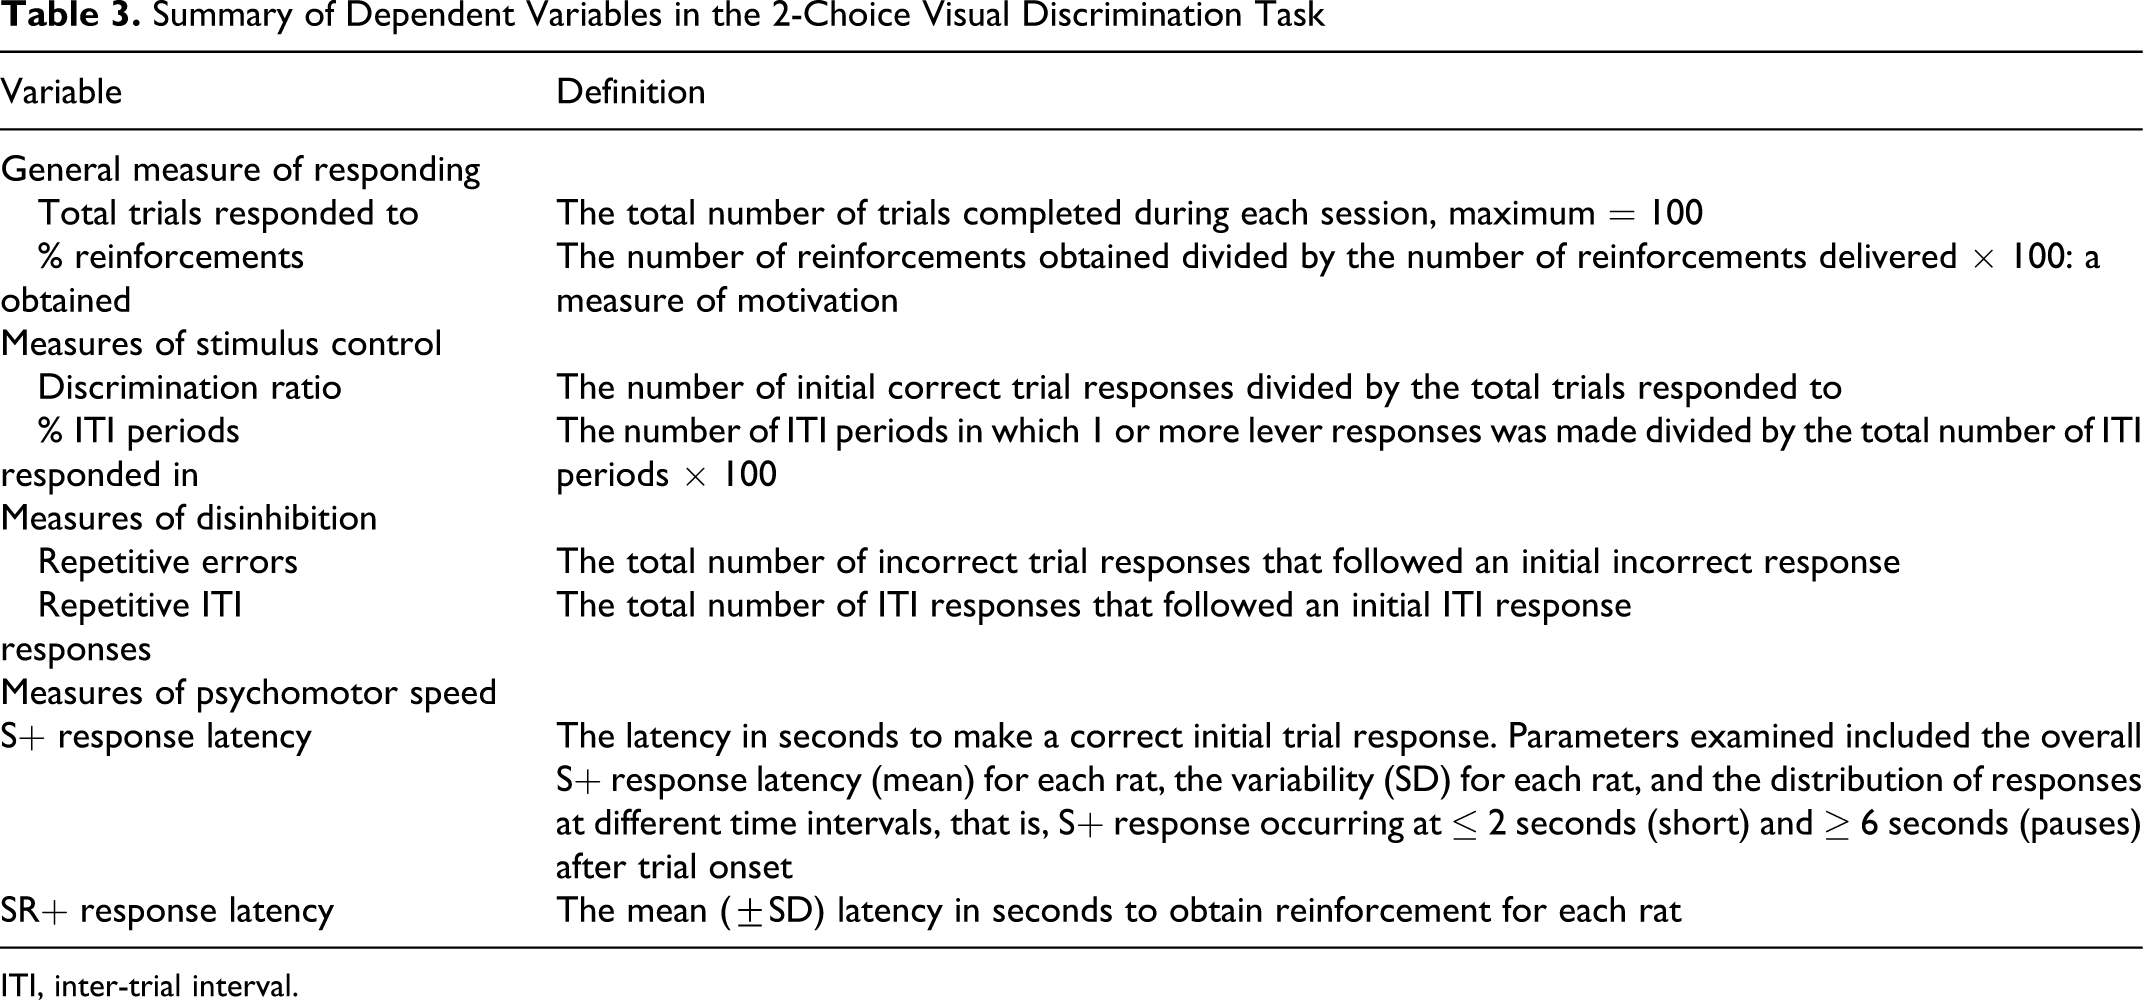
ITI, inter-trial interval.
Pharmacokinetic Study (TMB Only)
Samples of blood and brain tissue were taken from animals exposed to TMB. For this study, rats were exposed for 2, 4, or 8 hours to levels similar to those used in the acute behavioral studies and groups of 3 to 4 rats per concentration were sacrificed immediately after each exposure period. Tissues were taken and analyzed by methods described elsewhere. 3 Postexposure TMB excretion was assessed as part of a different study and is reported separately. 3
Statistical Analysis
All data were analyzed using the Statistical Analysis System (SAS) statistical software package (release 6.12). For each test measure, probability values of P < .05 were considered significant.
Body weights and body temperatures were analyzed using 1-way analysis of variance (ANOVA) conducted at each time point followed by Dunnett multiple comparison tests.
Continuous variables from the FOB were analyzed using ANOVA for preexposure performance to examine possible preexisting differences among the groups prior to treatment. Treatment effects were analyzed using repeated measures ANOVA. If a significant effect of treatment or a significant treatment-by-time interaction was indicated, ANOVA was performed at each test time point. Group comparisons were made using Dunnett multiple comparison tests. Motor activity data were analyzed using ANOVA for preexposure performance. Effects of exposure on total activity or habituation were analyzed using 3-way repeated measures ANOVA with 1 treatment factor and 2 repeated factors (test time point and time blocks within each session). Each session consisted of 5 time blocks of 6 minutes each. Rank data were analyzed by Kruskal-Wallis 1-way ANOVA on each test day followed by planned multiple comparisons in case of a significant result.
Baseline visual discrimination performance prior to exposure was examined in 2 ways: (1) by examining the mean performance averaged across the 5 days in the week prior to exposure (preweek responding) and (2) by examining the performance on the day preceding exposure (preday responding). One-way ANOVA was conducted on the preweek performance and on the preday performance to examine possible preexisting differences among the groups prior to exposure. Treatment effects were analyzed using repeated measures ANOVA of the data recorded during the 3-day exposure period. Huynh-Feldt adjustment of P values of the repeated measures factor was applied in case the assumption of sphericity of observations was violated. When a significant treatment effect was demonstrated, pairwise group comparisons were performed to determine which solvent-treated group differed significantly from the control group. When a significant treatment-by-time interaction was demonstrated, 1-way ANOVA was performed at each test time point followed by Dunnett multiple comparison tests. Persistence of effects was evaluated by ANOVA of postexposure data.
Results
Exposure Levels
1,2,4-Trimethyl benzene
The target concentrations were 125, 1250, and 5000 mg/m3. The mean, analytically determined concentrations were 128, 1255, and 4980 mg/m3.
Mixed isomer C9 aromatic solvent
The target concentrations were 200, 1000, and 5000 mg/m3 with analytically determined concentrations of 200, 1010, and 5008 mg/m3.
Mixed isomer C10/C11 aromatic solvent
The target concentrations were 200, 600, and 2000 mg/m3. The mean, analytically determined concentrations were 200, 600, and 1970 mg/m3.
Viability and Other Indicators of Well-Beings
1,2,4-Trimethyl benzene
There were no noteworthy observations. There were small (approximately 5%) but statistically significant (P < .05) body weight differences in the 5000 mg/m3 groups from both the FOB and visual discrimination studies at the end of the 3-day exposure period. At this time point, there was also an approximately 0.5°C reduction in body temperature in the 5000 mg/m3 group that was significantly different from control (P < .05; data not shown).
Mixed isomer C9 aromatic solvent
After the first 8-hour exposure period, 5 of 8 rats from the high exposure group (5000 mg/m3) had red-colored exudate around the mouth and nose. Some of these also had wet lower jaws due to salivation; piloerection; and wet anogenital areas due to urination. Similar observations involving 4 of 8 rats from the high exposure group were made after the third 8-hour exposure period. There was a significant difference in body weight (approximately 10%; P < .05) between the high exposure group and the corresponding controls after the third 8-hour exposure, and the body temperatures in the high exposure group were reduced by approximately 1.5°C after the first and third 8-hour exposures (P < .05; data not shown).
Mixed isomer C10/C11 aromatic solvent
There were no remarkable observations. Body weights were reduced 3% to 7% (P < .05) in all exposure groups, and the reductions were dose-responsive. Body temperature was reduced by approximately 1°C (P < .05) in the high exposure group (2000 mg/m3) during the 3-day exposure period.
Functional Observations
1,2,4-Trimethyl benzene
There was 1 observation of abnormal gait; 1 rat walked on tiptoes after the first 8-hour exposure period but did not show any evidence of impaired gait after the third 8-hour exposure. The incidence as well as the severity of abnormal gait was low and the difference was not statistically significant, but the effect did appear in the high exposure group. There were also some changes in forelimb grip strength. A significantly (P < .05) reduced mean grip strength was observed in the low exposure group after the first 8-hour exposure, but due to the absence of dose response, this observation is not considered related to exposure. The only effect in the high exposure group was a statistically significant (P < .05) increase in forelimb grip strength after the third exposure when compared to the control group. This is considered a spurious finding as a relationship between TMB exposure and an improvement in grip strength seems implausible. There were no statistically significant differences in any of the other functional observations (see Table 4).
Summarized Results of Functional Observations and Motor Activity Assessment With TMB (Mean ± SEM)
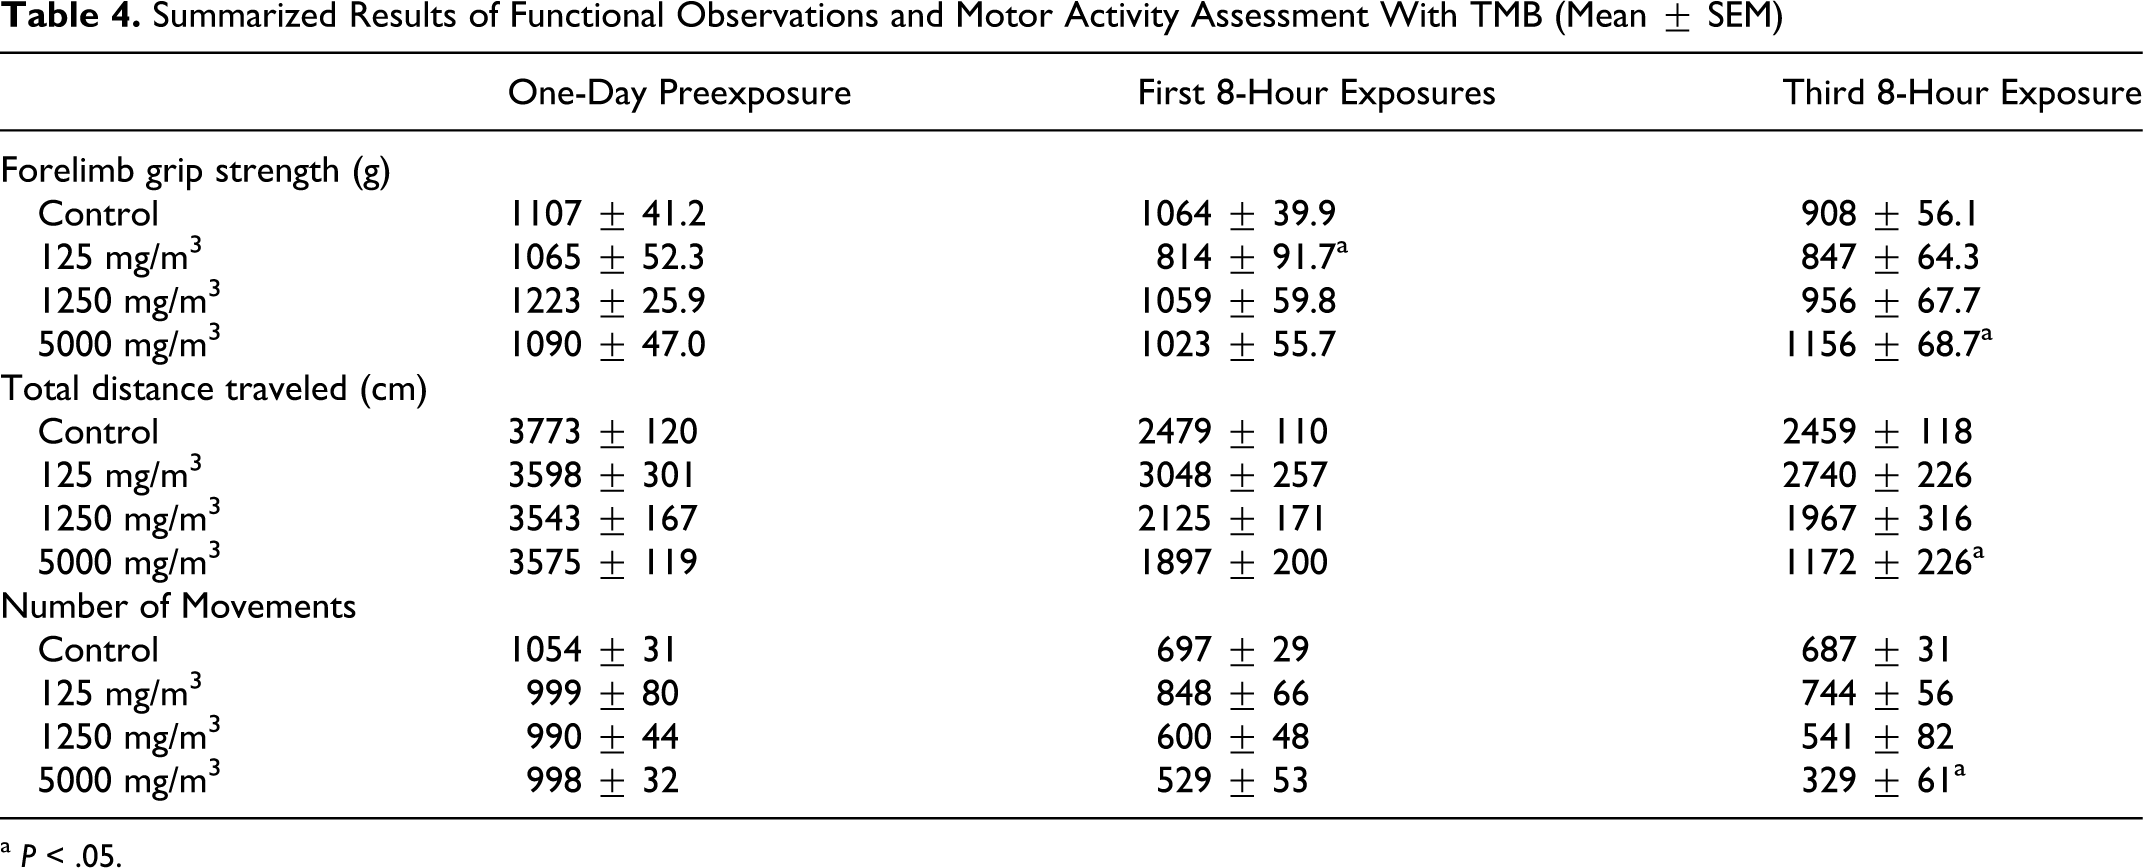
a P < .05.
There were some statistically significant findings in the motor activity assessment, specifically significant reductions in total distance traveled and number of movements (Table 4). These findings may have been related to treatment; however, differences became significant (P < .05) only after the third day of treatment, and not on the first, although brain concentrations in the high exposure group were higher on the first day of treatment than the third (Table 5 ). Thus, the relationship of this observation to treatment is not straightforward.
Blood and Brain Levels of TMB in Rats Following Exposure by Inhalation a
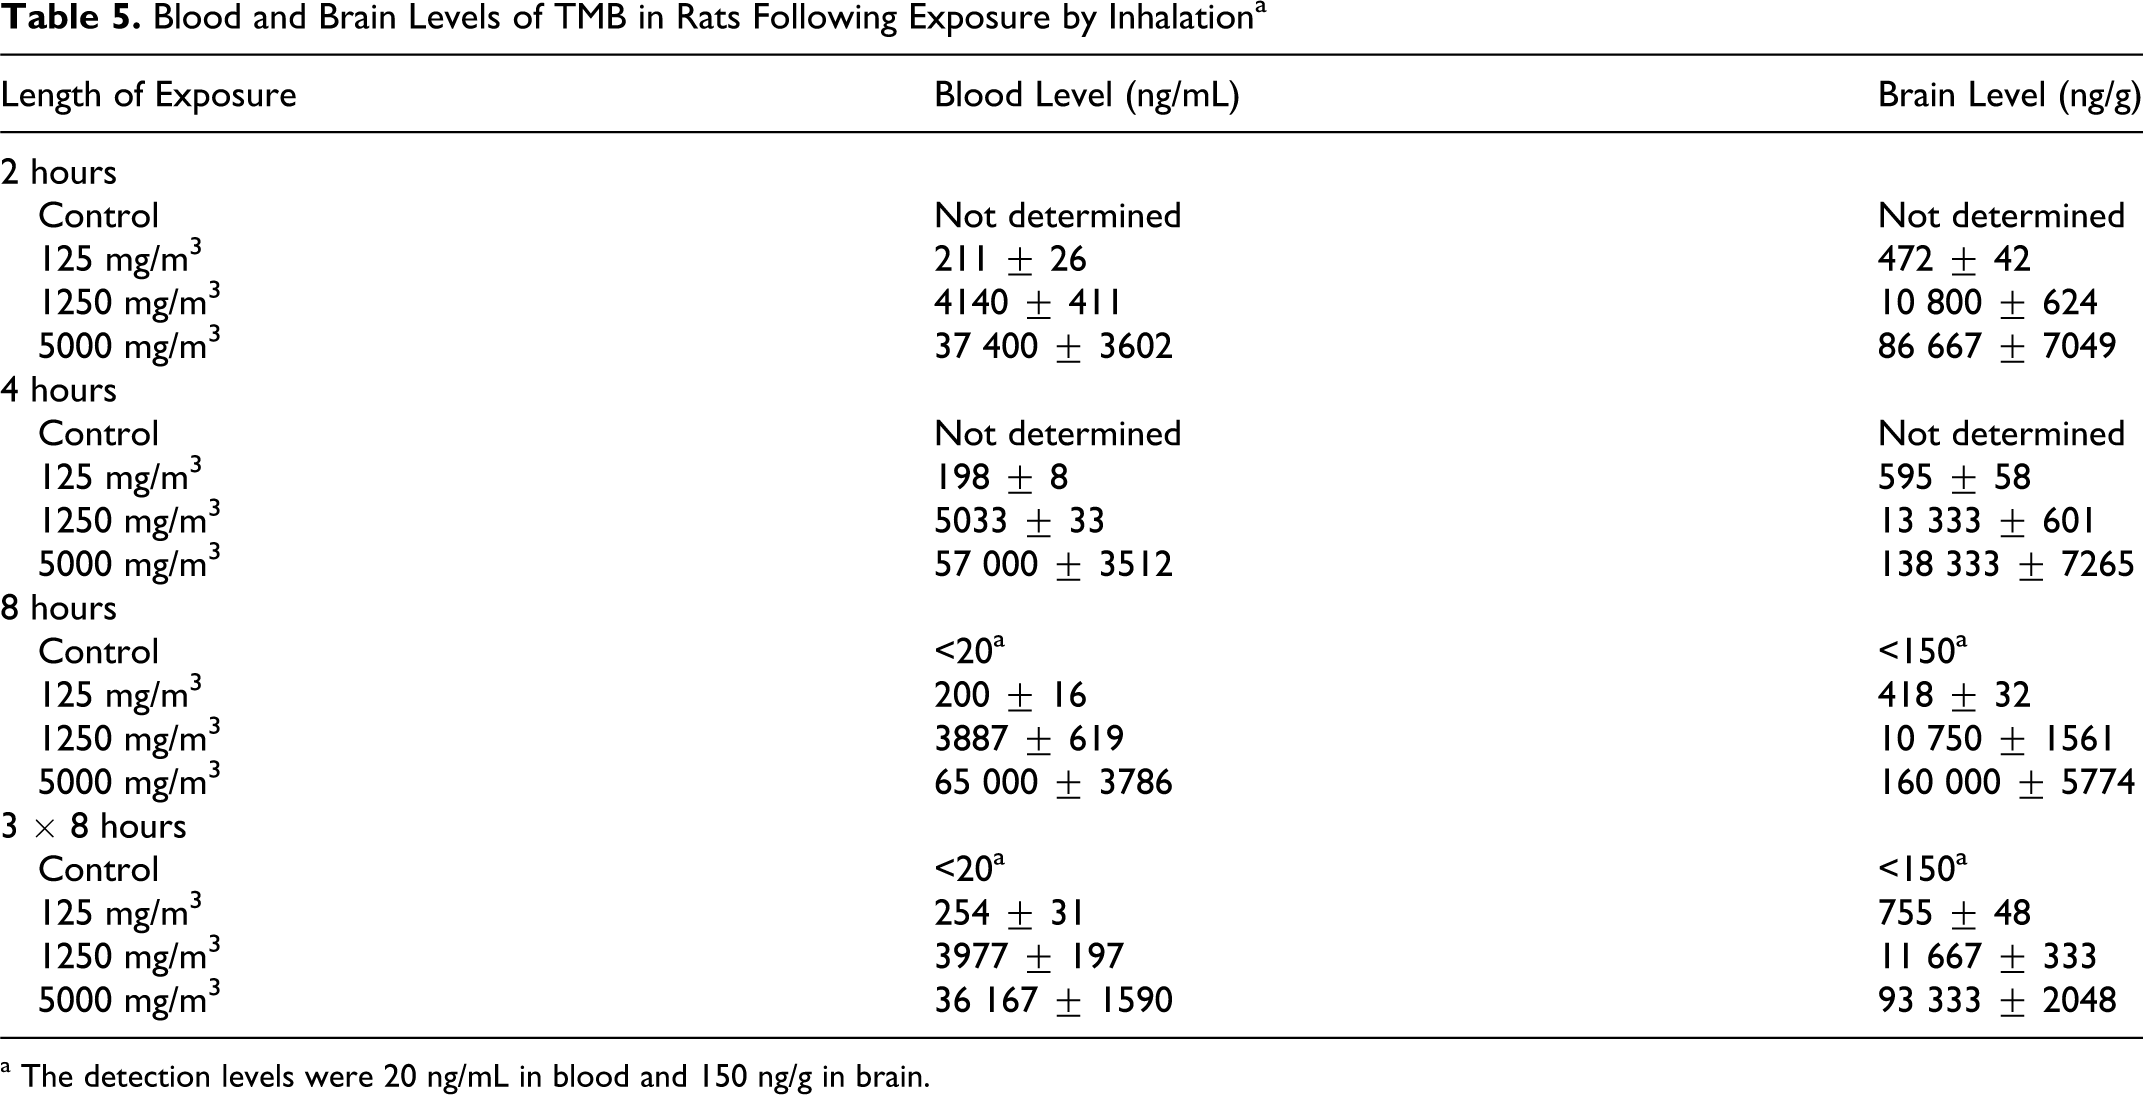
a The detection levels were 20 ng/mL in blood and 150 ng/g in brain.
Mixed isomer C9 aromatic solvent
There were effects on gait in the high exposure group—all animals walked on tiptoes, 6 of 8 animals had hunched body positions, and 1 was slightly ataxic after the first 8-hour exposure. Similar observations were made after the third 8-hour exposure although at this time point, only 1 animal had a hunched body position. The severity of these gait abnormalities was low to moderate, and a statistically significant (P < .05) difference between the high exposure group and the control group was indicated. There were no significant differences in arousal or approach, click response or tail pinch, foot splay or grip strength. Response to touch was significantly (P < .05) reduced in the high exposure group after the third 8-hour exposure. Motor activity was also affected in the high exposure group with both total distance and number of movements significantly (P < .05) reduced in comparison to controls after the third 8-hour exposure. Although these differences in motor activity were small, they did appear to have been treatment-related (Table 6 ).
Summarized Results of Functional Observations and Motor Activity Assessment With Mixed Isomer C9 Aromatic Solvent (Mean ± SEM)
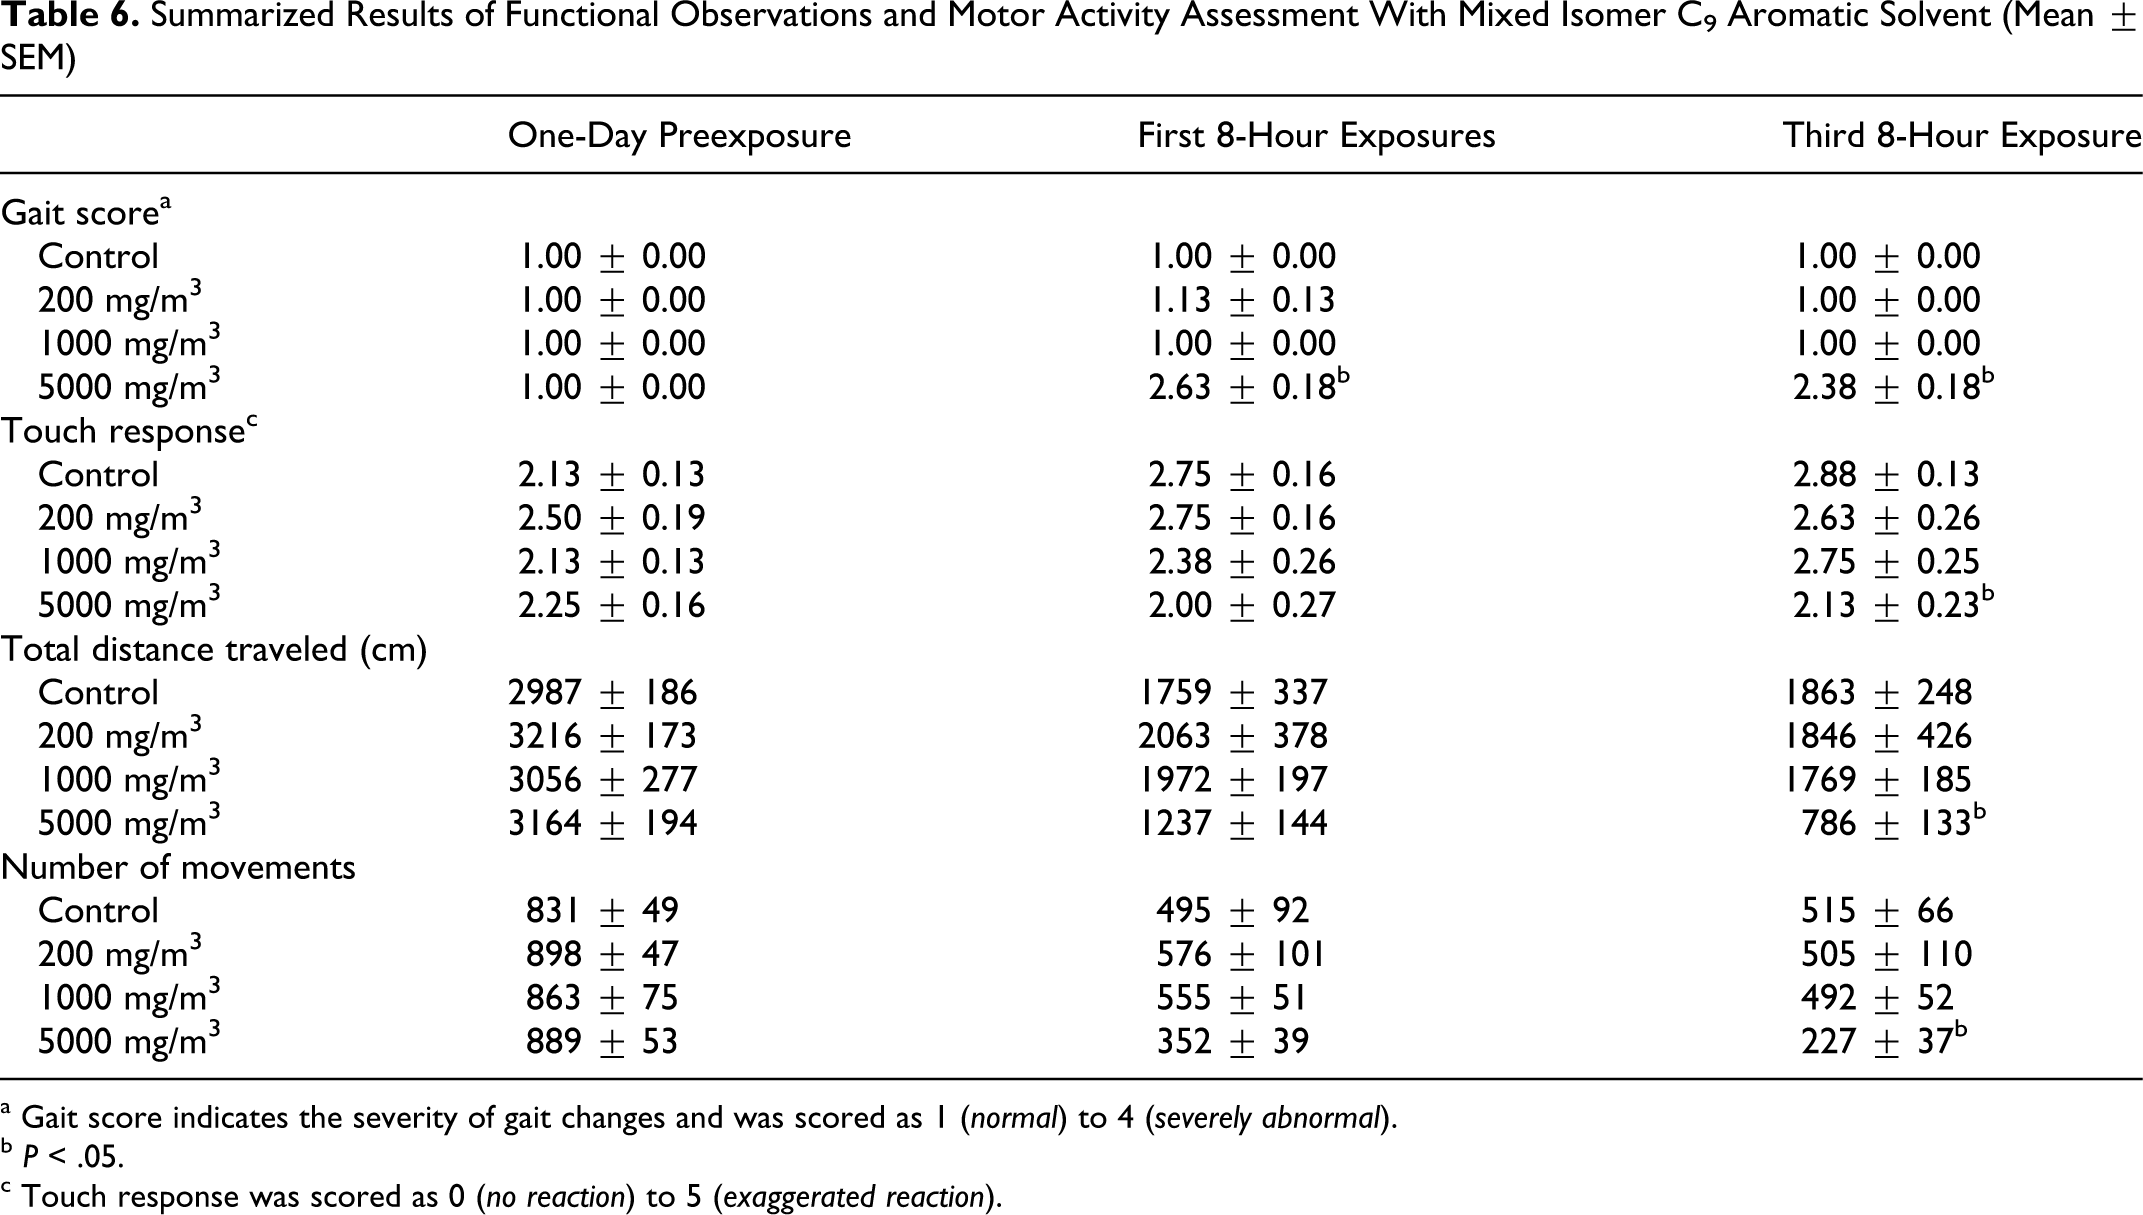
a Gait score indicates the severity of gait changes and was scored as 1 (normal) to 4 (severely abnormal).
b P < .05.
c Touch response was scored as 0 (no reaction) to 5 (exaggerated reaction).
Mixed isomer C10/C11 aromatic solvent
There were effects on gait, primarily in the high exposure group (2000 mg/m3). After the first exposure period, 6 of 8 animals walked on tiptoes, and 1 also exhibited ataxia; the gait score was low to moderate, yet significantly (P < .01) elevated. After the third exposure period, 2 animals still walked on tiptoes. Additionally, there was 1 animal from the 600 mg/m3 group, which walked on tiptoes and exhibited ataxia after the third 8-hour exposure. There were no significant differences in arousal, approach, touch, click response, or tail pinch. There were no effects on grip strength or foot splay. There were also no significant effects in measures of motor activity (Table 7 ).
Summarized Results of Functional Observations With Mixed Isomer C10/C11 Aromatic Solvent (Mean ± SEM)
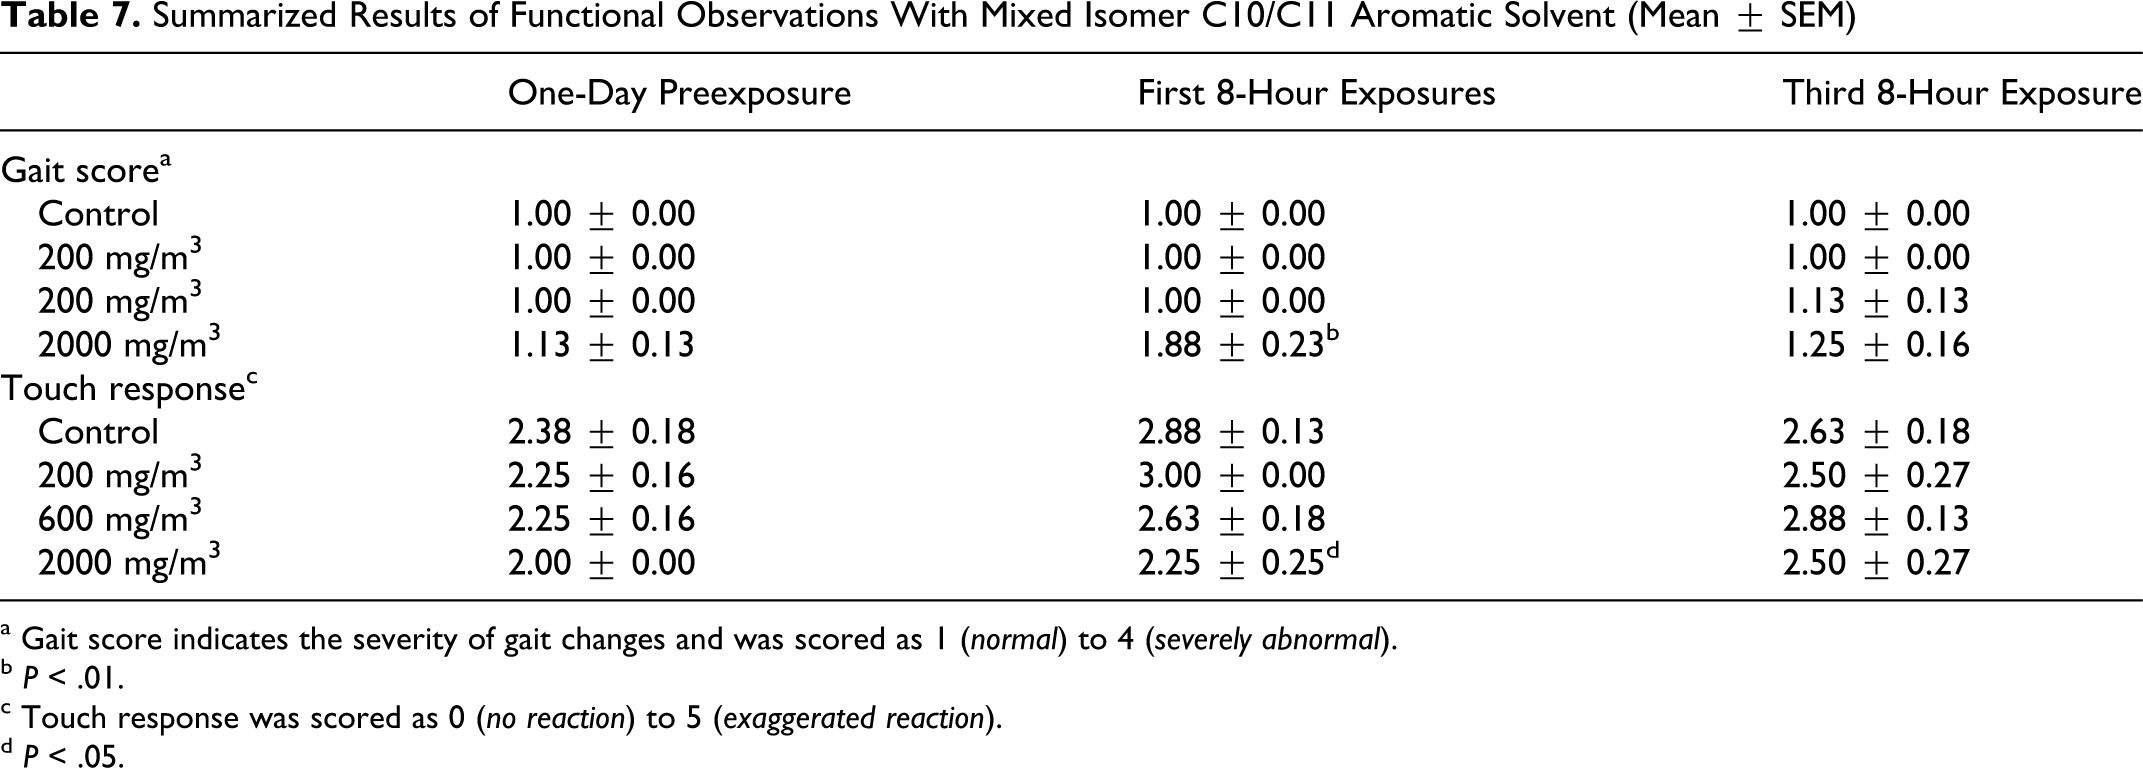
a Gait score indicates the severity of gait changes and was scored as 1 (normal) to 4 (severely abnormal).
b P < .01.
c Touch response was scored as 0 (no reaction) to 5 (exaggerated reaction).
d P < .05.
Visual Discrimination Performance
1,2,4-Trimethyl benzene
Visual discrimination performance testing revealed some treatment-related effects, particularly on response latency in the high exposure group. There were no differences in number of trials completed. The discrimination ratio was significantly (P < .05) better in the high exposure group (5000 mg/m3) than in controls after a single 8-hour exposure, but a relationship to treatment did not seem plausible. There were no differences in frequency of response during the ITIs. The frequency of repetitive ITI responses was significantly (P < .05) reduced in comparison to control after either 2 or 3 exposures, but again, it seems unlikely that treatment would have improved performance. There was a small but statistically significant (P < .05) increase in trial response latency in the high exposure group after a single 8-hour exposure, accompanied by a reduction in short (ie, <2 seconds) latency responses and an increase in long (ie, >6 seconds) latency responses. In addition, a significant (P < .05) increase in drink response latency was observed after a single 8-hour exposure in the 1250 and 5000 mg/m3 groups. It should be noted, however, that the mean drink response latency in the 1250 mg/m3 group was increased also on the preexposure day, and, therefore, the significance of the effect of exposure in this group is questionable. The effects on response latency did seem to have been treatment related in that there was a relationship to exposure level. It was apparent that the CNS effects were transient because there were no differences between groups in the postexposure measurements (Table 8 ).
Summarized Results of Visual Discrimination Performance Testing With TMB
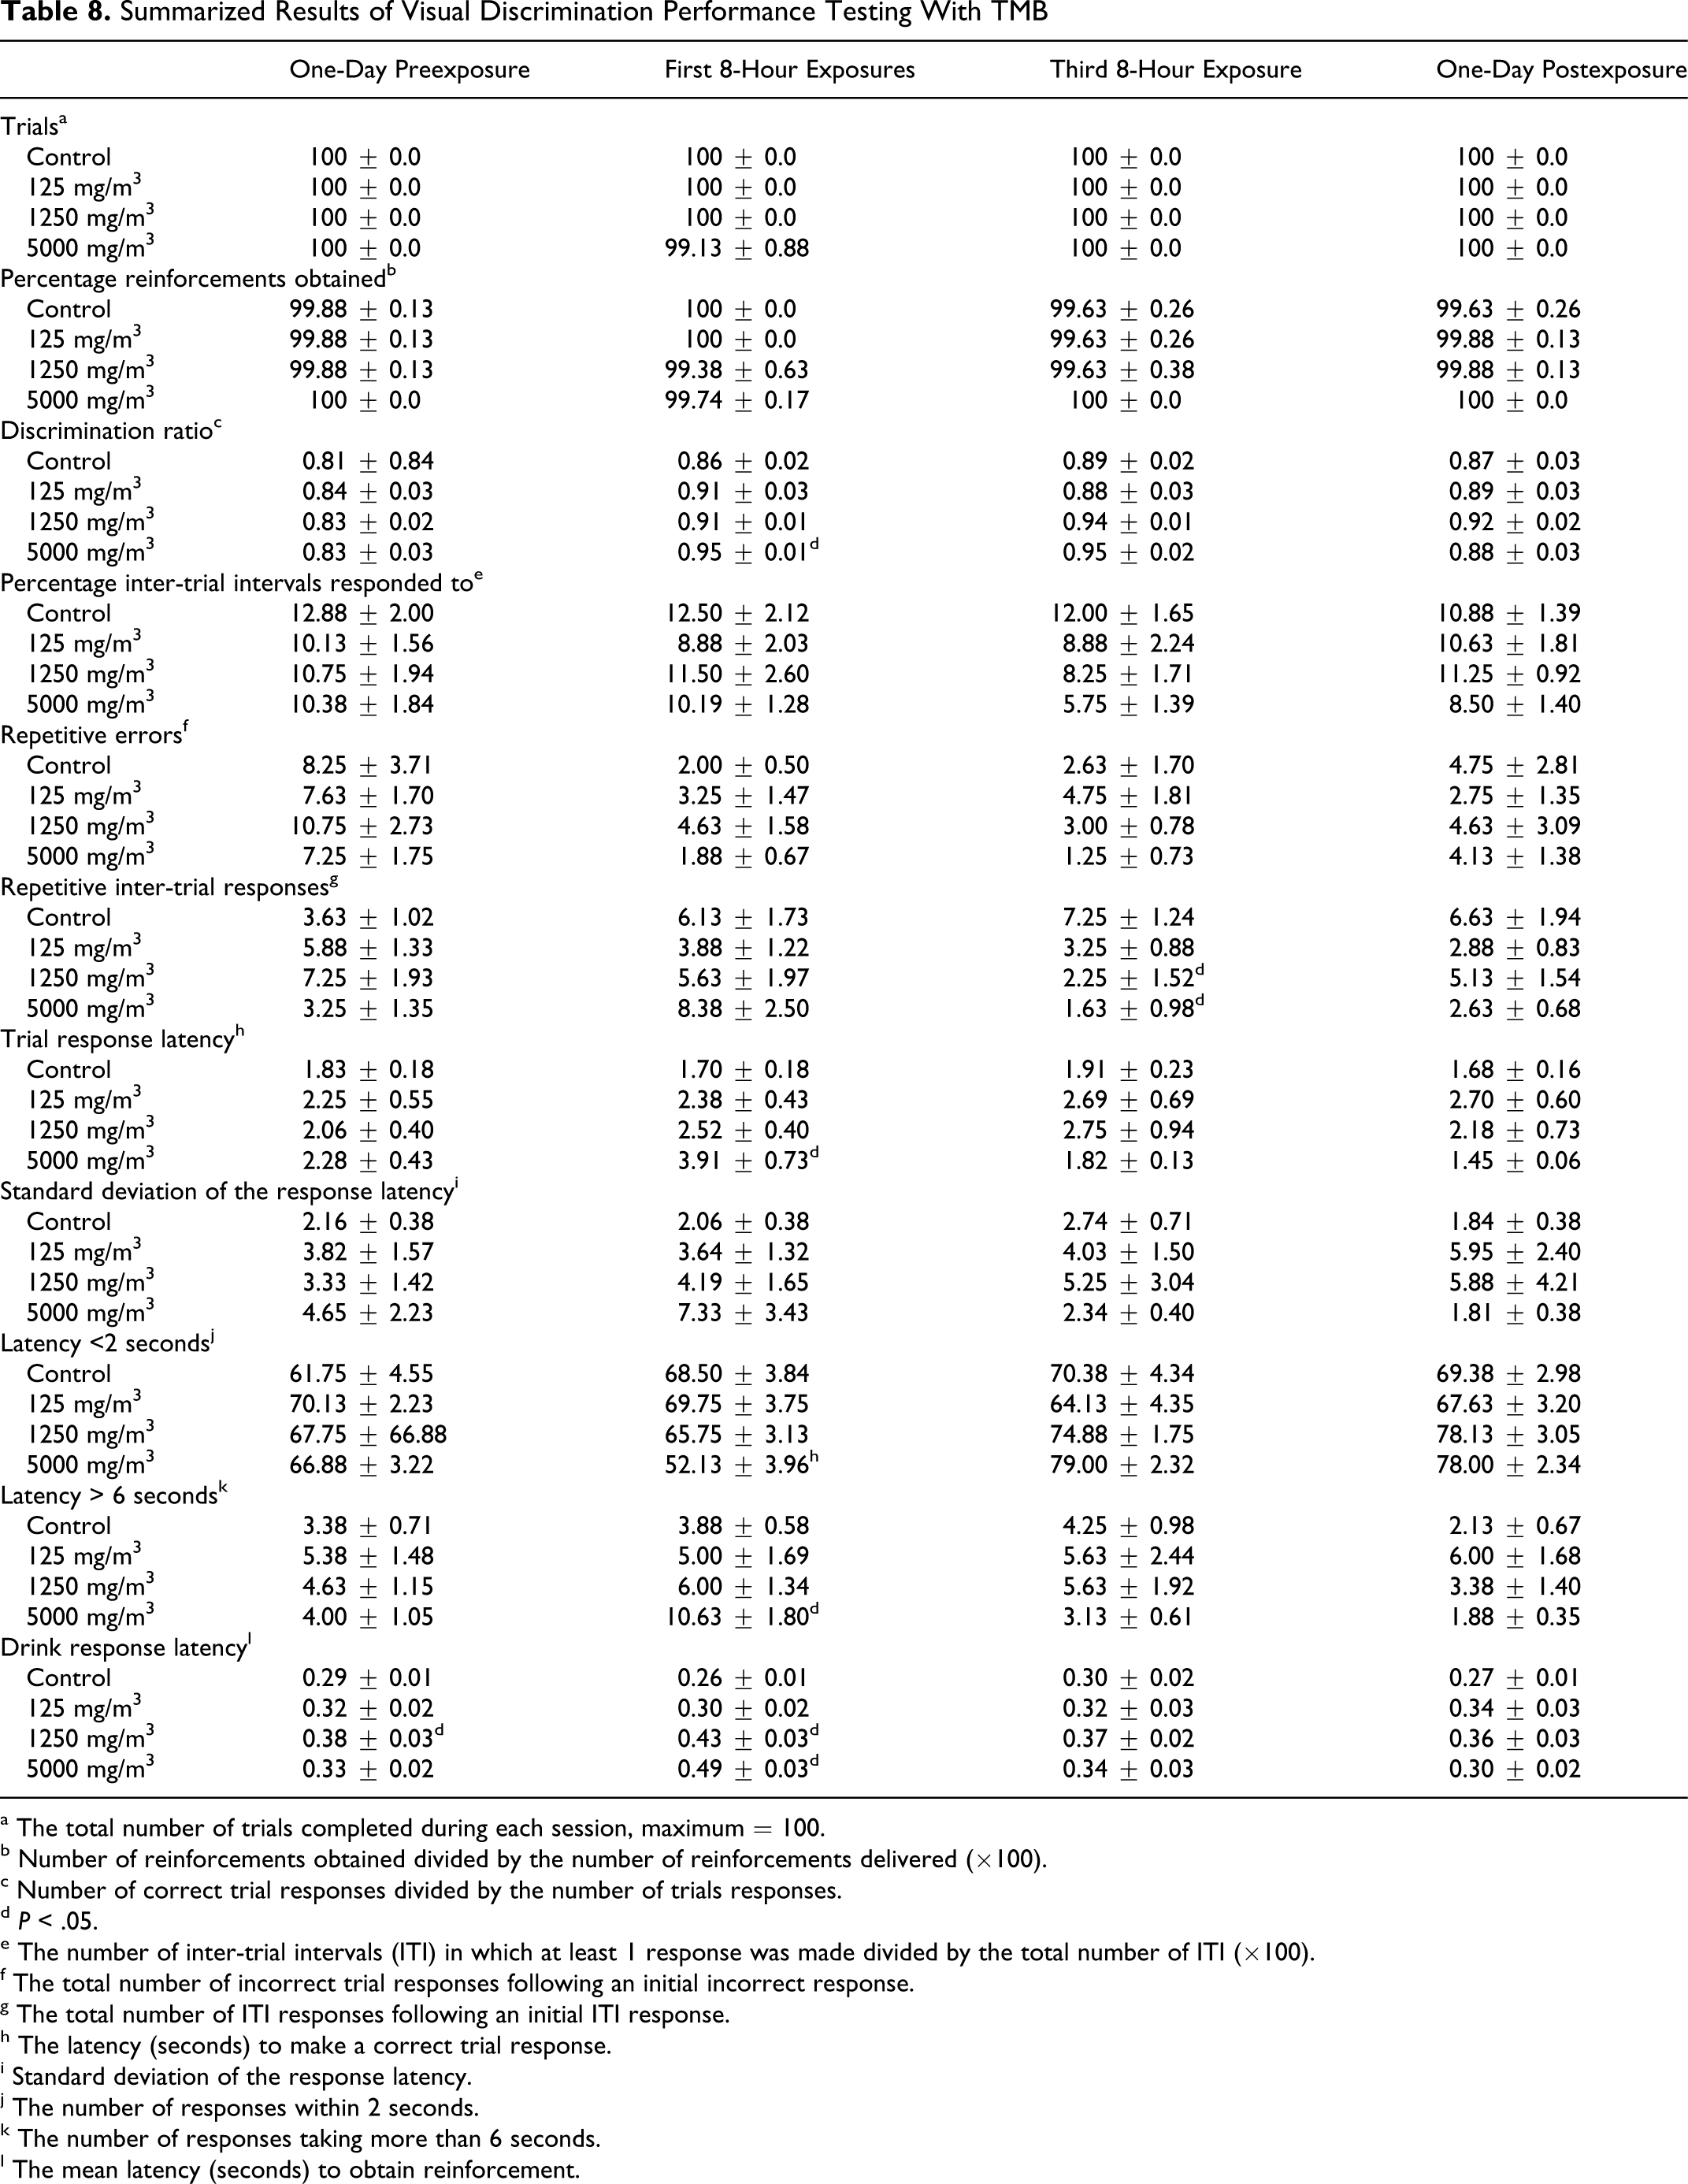
a The total number of trials completed during each session, maximum = 100.
b Number of reinforcements obtained divided by the number of reinforcements delivered (×100).
c Number of correct trial responses divided by the number of trials responses.
d P < .05.
e The number of inter-trial intervals (ITI) in which at least 1 response was made divided by the total number of ITI (×100).
f The total number of incorrect trial responses following an initial incorrect response.
g The total number of ITI responses following an initial ITI response.
h The latency (seconds) to make a correct trial response.
i Standard deviation of the response latency.
j The number of responses within 2 seconds.
k The number of responses taking more than 6 seconds.
l The mean latency (seconds) to obtain reinforcement.
Mixed isomer C9 aromatic solvent
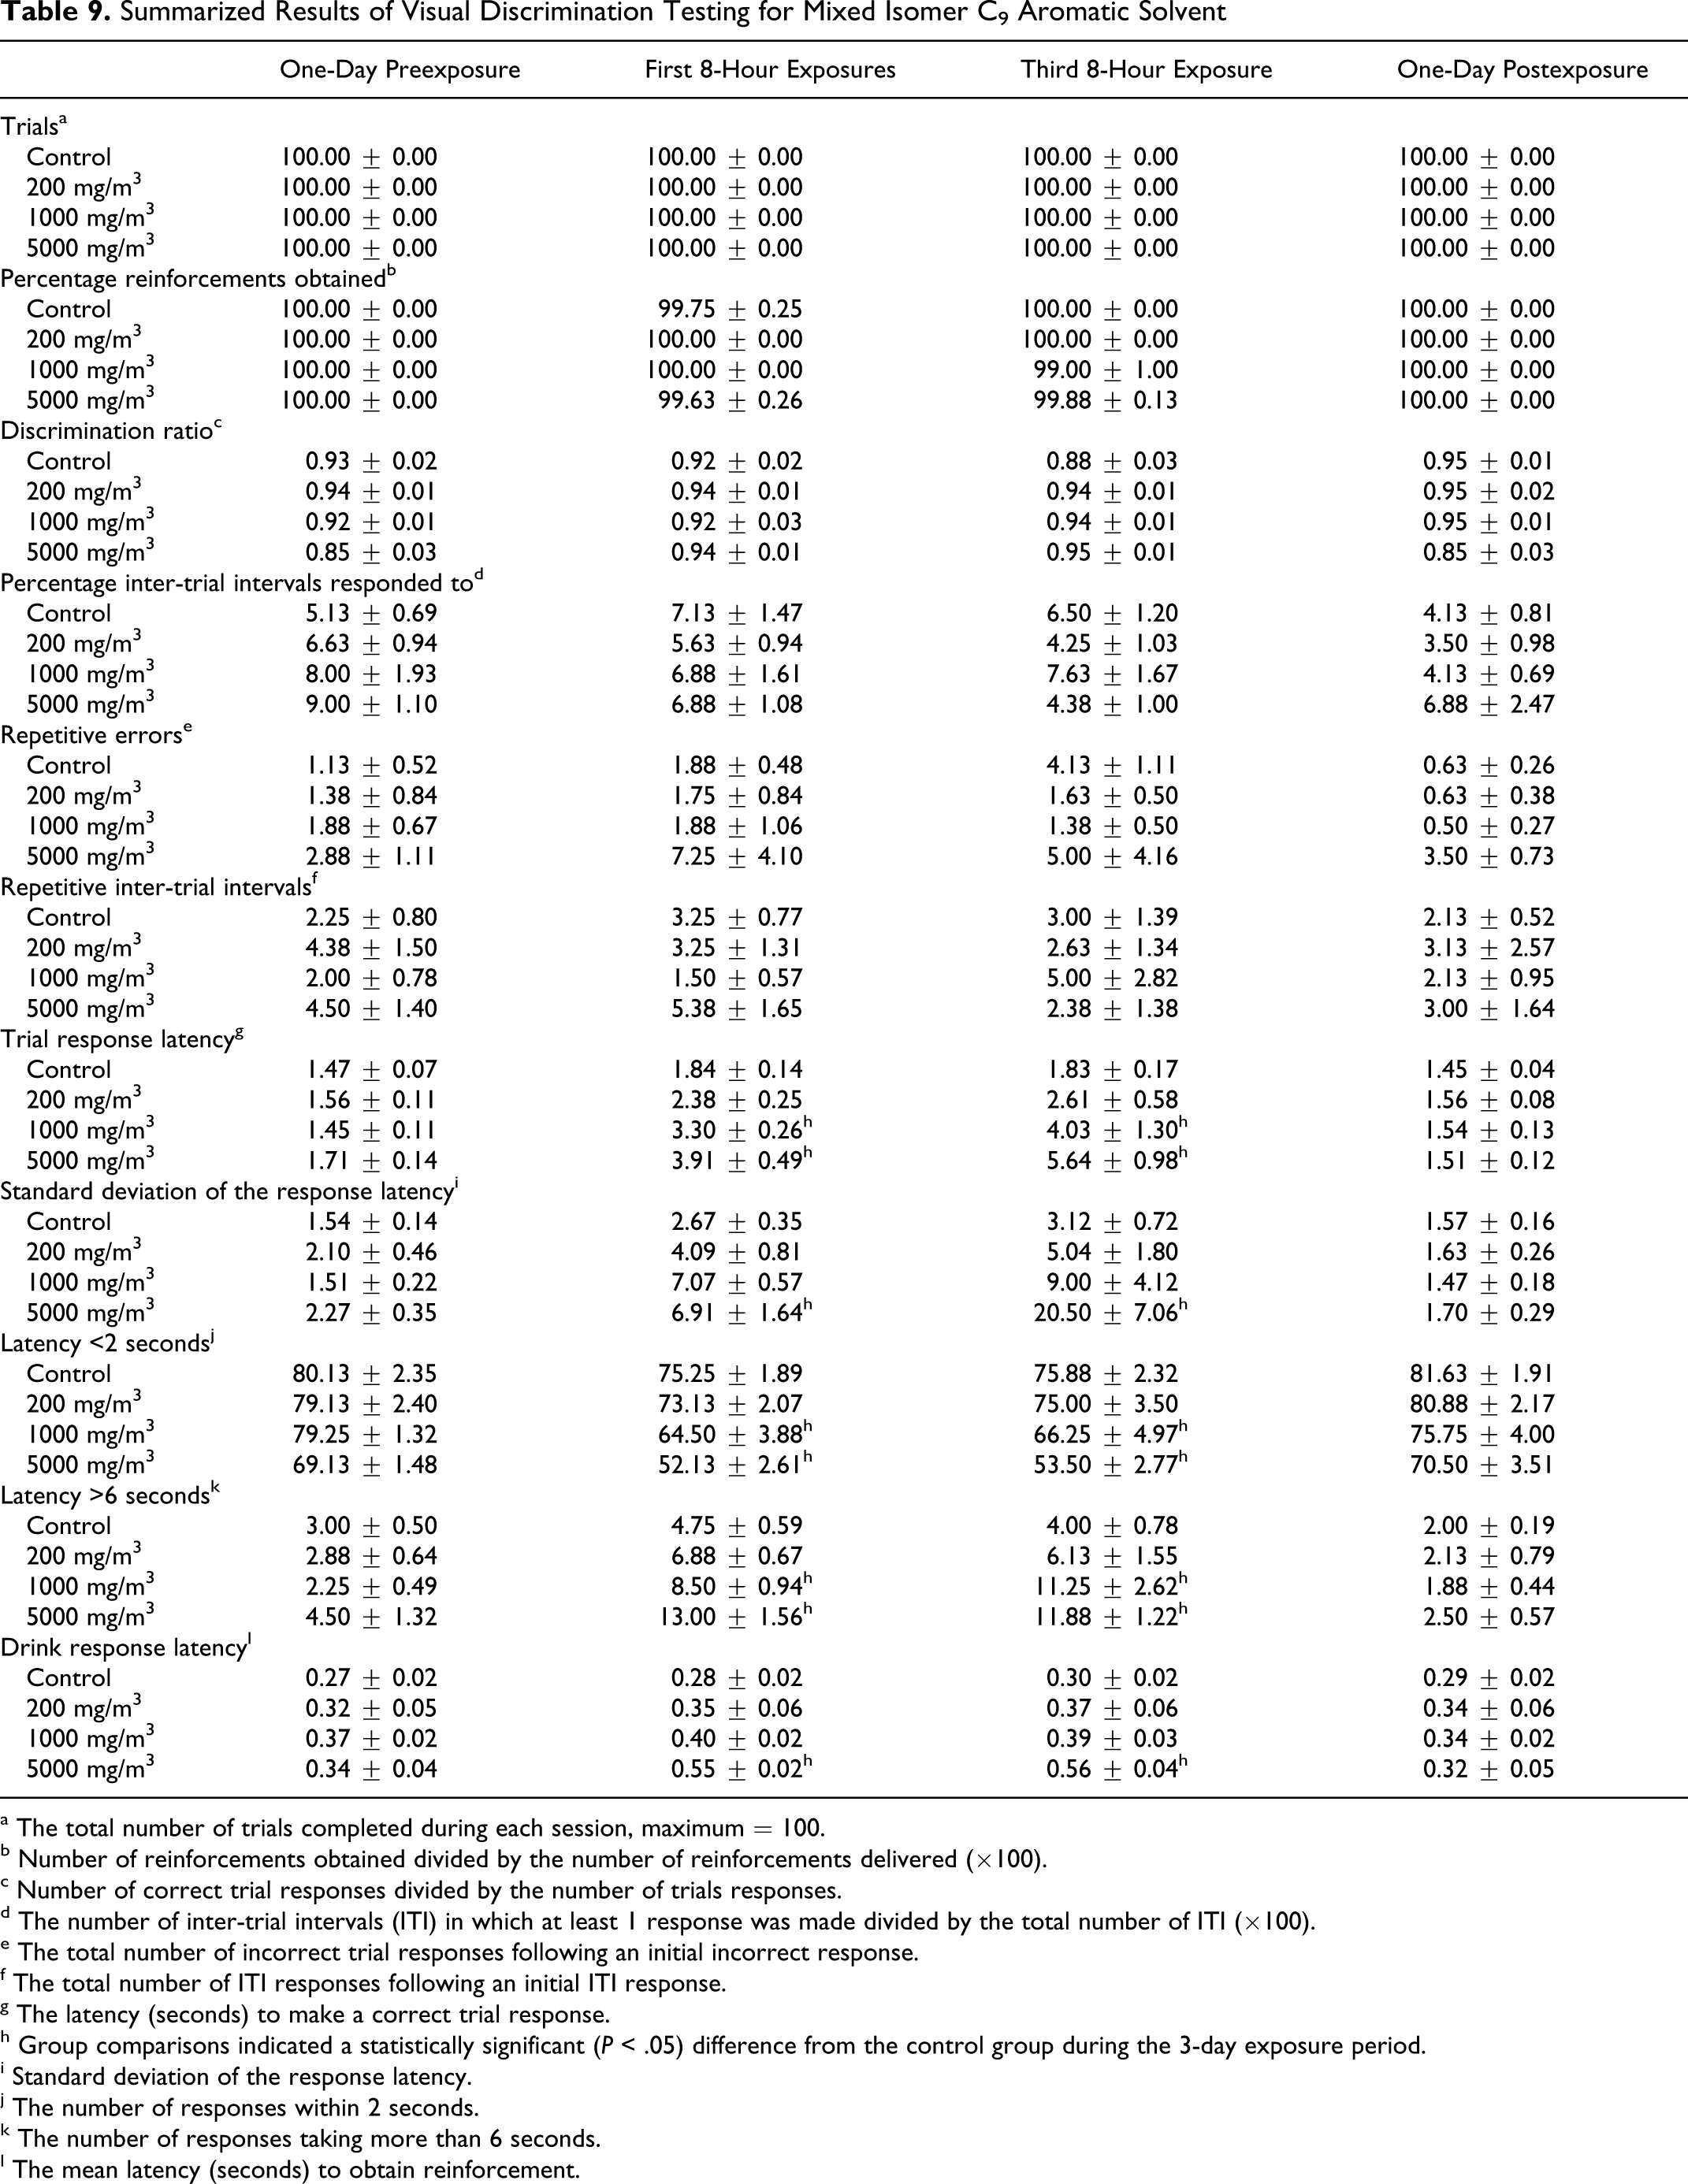
The results of the visual discrimination tests of the mixed isomer C9 aromatic solvent were very similar to those of TMB, described above. During the 3-day exposure period, there were no differences in number of trials completed, discrimination ratios, or responses during the ITI. There was a significant (P < .05) increase in trial response latency in the mid and high exposure groups, together with increased variability of response latencies in the high exposure group. Significant (P < .05) reductions in the number of short latencies and increases in the number of long latencies were recorded during the 3-day exposure period in the mid and high exposure groups. There was also a significant (P < .05) increase in drink response latency in the high exposure group. The magnitudes of these differences were very similar to those found in the TMB study; however, unlike TMB, performance did not substantially improve with repeated treatment. No differences were found in the postexposure assessments (Table 9 ).
Summarized Results of Visual Discrimination Testing for Mixed Isomer C9 Aromatic Solvent
a The total number of trials completed during each session, maximum = 100.
b Number of reinforcements obtained divided by the number of reinforcements delivered (×100).
c Number of correct trial responses divided by the number of trials responses.
d The number of inter-trial intervals (ITI) in which at least 1 response was made divided by the total number of ITI (×100).
e The total number of incorrect trial responses following an initial incorrect response.
f The total number of ITI responses following an initial ITI response.
g The latency (seconds) to make a correct trial response.
h Group comparisons indicated a statistically significant (P < .05) difference from the control group during the 3-day exposure period.
i Standard deviation of the response latency.
j The number of responses within 2 seconds.
k The number of responses taking more than 6 seconds.
l The mean latency (seconds) to obtain reinforcement.
Mixed isomer C10/C11 aromatic solvent
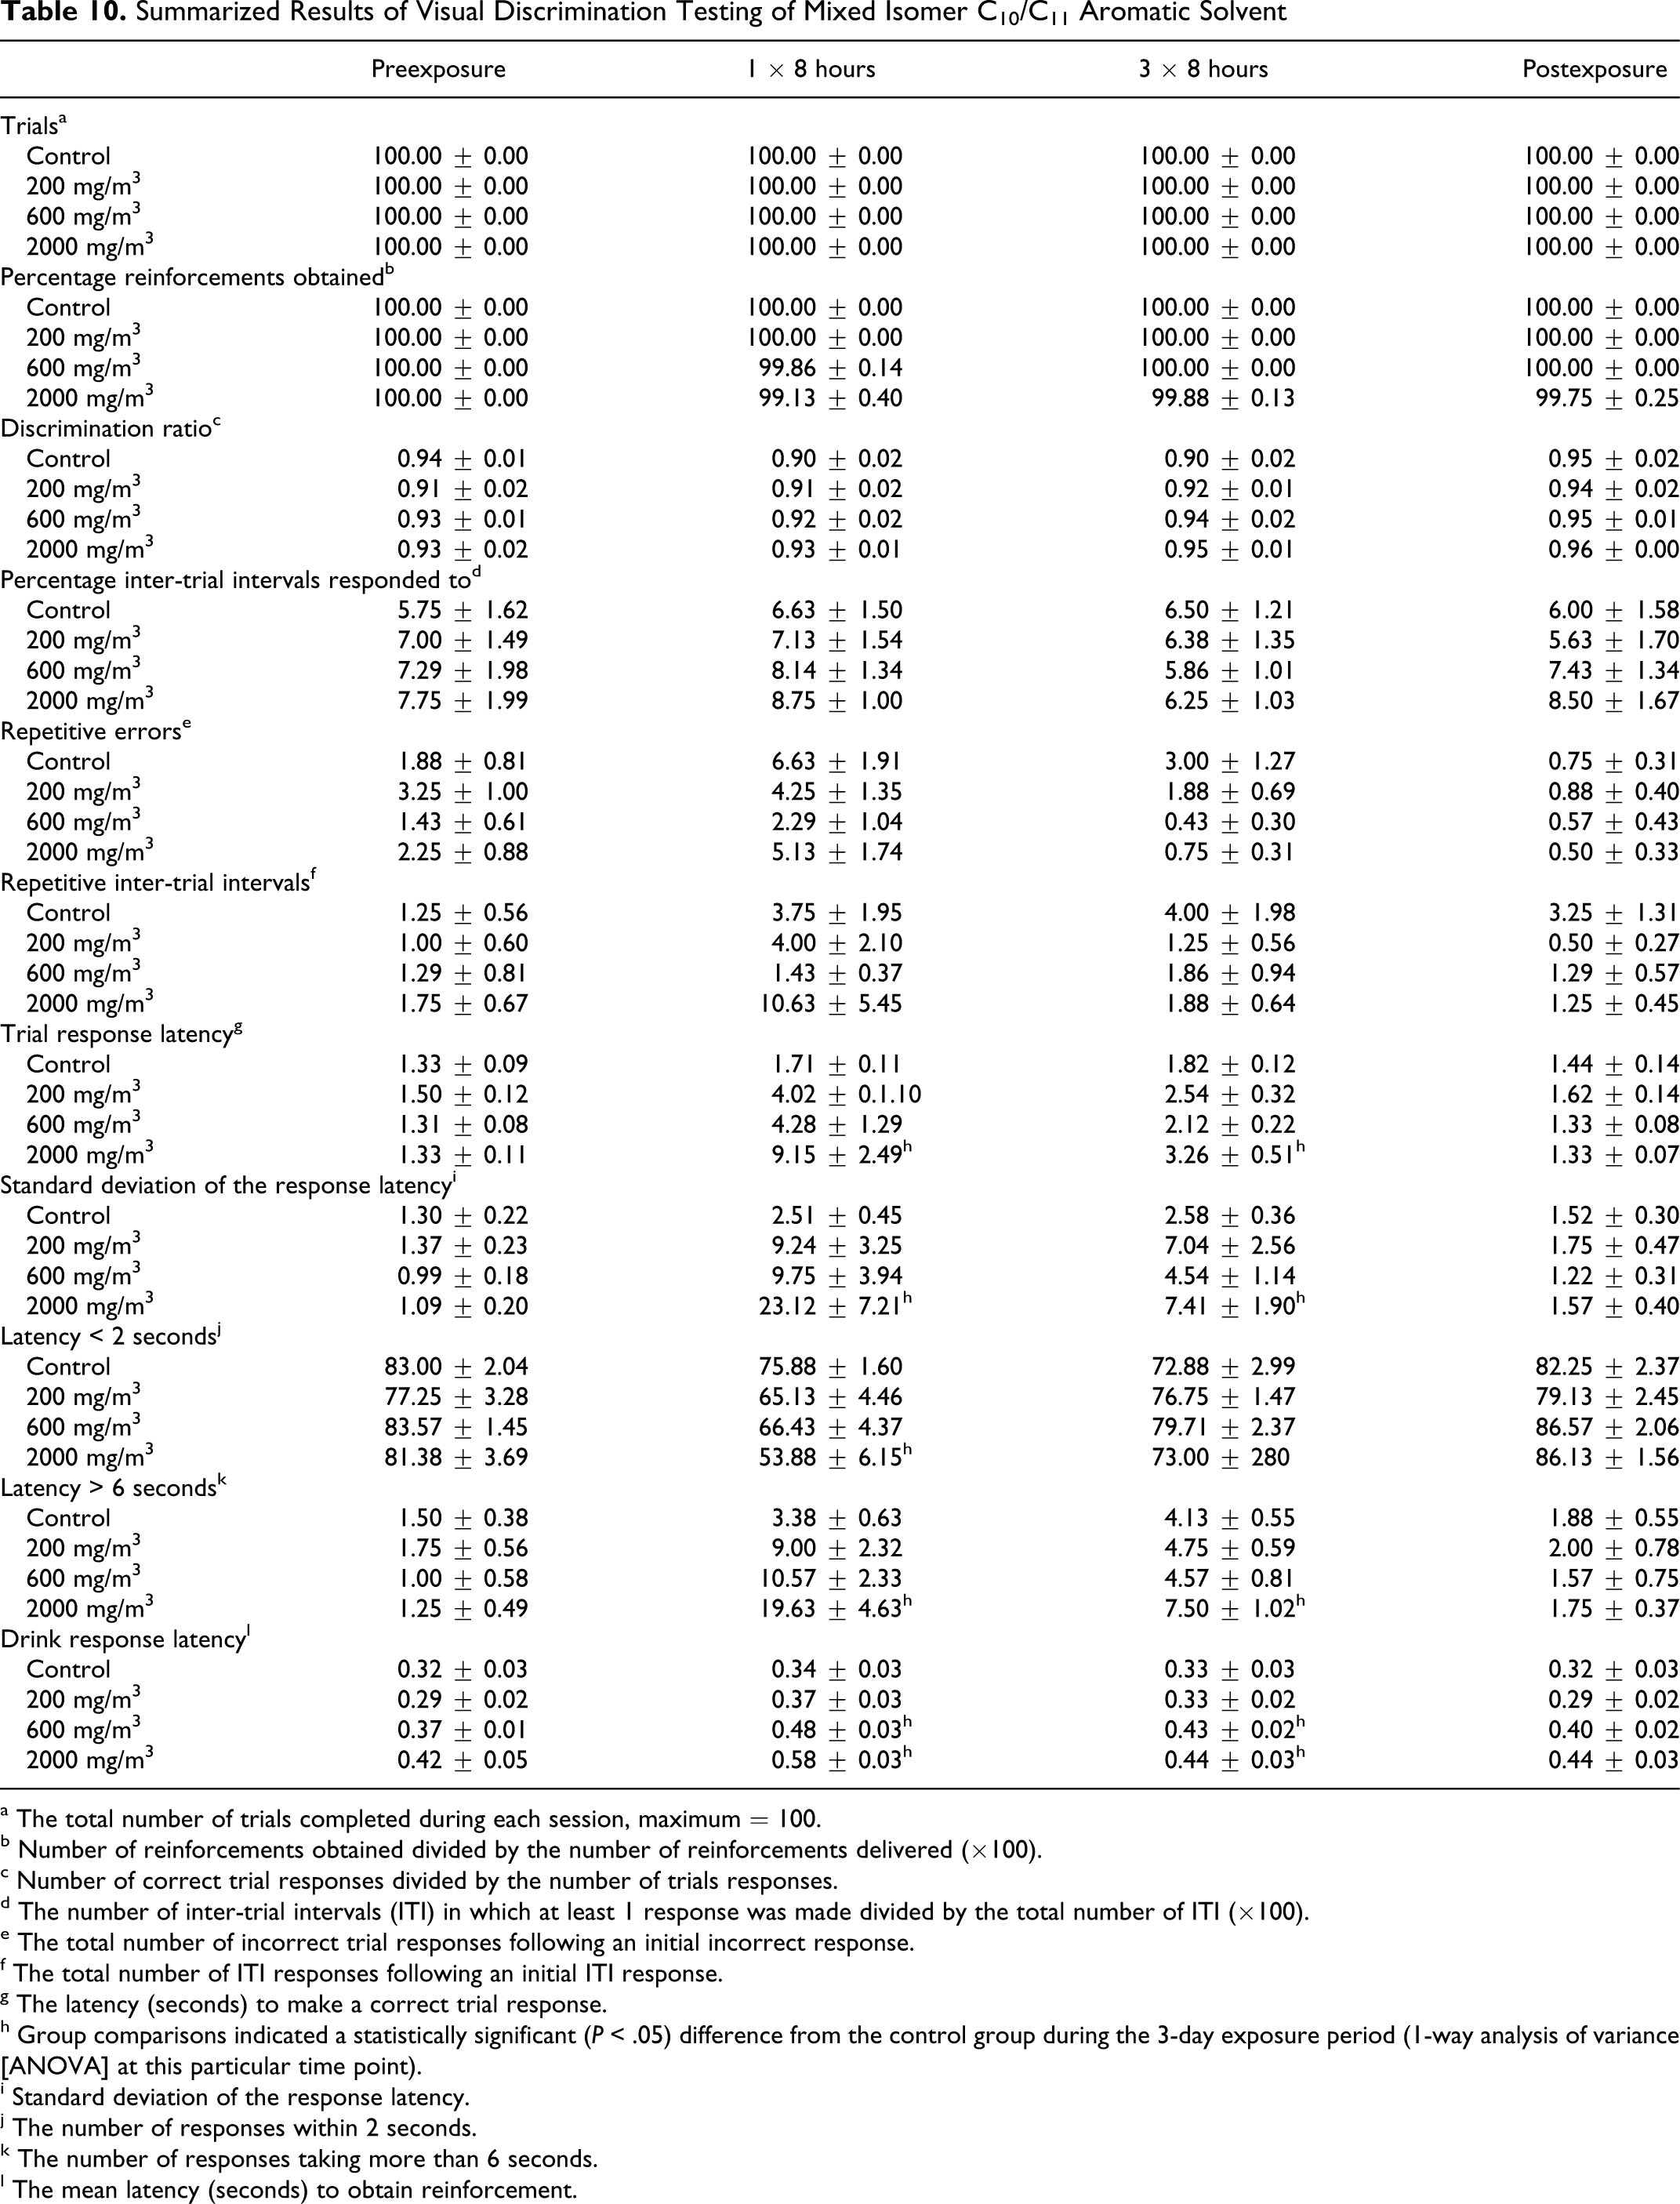
The results of the visual discrimination tests of the mixed C10/C11 hydrocarbon solvent were similar to those obtained in studies of the other aromatic solvents. There were no effects of exposure on number of trials, discrimination ratio, number of responses during the ITI, or repetitive errors. Mean time to response and its variability were significantly (P < .05) increased in the high exposure group (2000 mg/m3) during the 3-day exposure period, especially after the first 8-hour exposure. Similarly, there was a reduction in the number of short and an increase in the number of long latency responses. Drink response latencies were significantly (P < .05) increased after a single 8-hour exposure in the high exposure group. The effects were most pronounced after a single treatment, diminished with repeated treatments, and were not apparent a day after the final treatment (Table 10 ).
Summarized Results of Visual Discrimination Testing of Mixed Isomer C10/C11 Aromatic Solvent
a The total number of trials completed during each session, maximum = 100.
b Number of reinforcements obtained divided by the number of reinforcements delivered (×100).
c Number of correct trial responses divided by the number of trials responses.
d The number of inter-trial intervals (ITI) in which at least 1 response was made divided by the total number of ITI (×100).
e The total number of incorrect trial responses following an initial incorrect response.
f The total number of ITI responses following an initial ITI response.
g The latency (seconds) to make a correct trial response.
h Group comparisons indicated a statistically significant (P < .05) difference from the control group during the 3-day exposure period (1-way analysis of variance [ANOVA] at this particular time point).
i Standard deviation of the response latency.
j The number of responses within 2 seconds.
k The number of responses taking more than 6 seconds.
l The mean latency (seconds) to obtain reinforcement.
Blood and Brain Concentrations of TMB
1,2,4-Trimethyl benzene was rapidly taken up into the blood and brain with brain concentrations being approximately 2 to 3 times the corresponding blood concentrations (Table 5). At least at the lower concentrations, equilibrium appeared to have been reached within 2 hours as brain concentrations did not substantially increase after that point. However, in the high exposure group, blood and brain concentrations continued to increase over the entire 8-hour period. After 3 consecutive days of exposure, the blood and brain concentrations in animals from the high exposure group were approximately half the concentrations recorded in animals after a single 8-hour exposure period. These data imply that TMB induced its own metabolism in the high exposure group. However, as there were no apparent differences in the other groups, metabolism was apparently unaffected at lower concentrations.
Discussion
The principal objective of this study was to assess the acute CNS effects of C9 to C11 aromatic hydrocarbons in rats. The specific substances tested were 1,2,4-TMB, representing the C9 aromatic species (TMBs and ethyl toluenes), and 2 commercial aromatic solvents, 1 containing principally C9 constituents and the other C10/C11 constituents. The exposure concentrations ranged from levels approximating occupational exposure recommendations to levels near saturated vapor concentrations.
In this study, rats were exposed 8 hours/d for 3 consecutive days to increasing concentrations of 3 aromatic hydrocarbon solvents. After exposure, the rats were immediately removed from the chambers and functional observations were conducted and motor activity was assessed; separate groups of rats were tested for visual discrimination using a task/reward paradigm. It was technically not possible to conduct behavioral experiments during exposure, particularly the interactive functional observations and the motor activity assessment, which involve relatively large open field boxes. The best solution was to conduct these tests as quickly as possible after termination of exposure. Functional observations were completed 10 to 25 minutes after termination of exposure, and motor activity assessment was completed within 1 hour for all animals. In addition, all animals completed visual discrimination performance testing within 1 hour after termination of exposure.
It should be noted that, although the experimental design required that the animal investigations be conducted after the exposure periods, this has implications for the interpretation. Based on previous pharmacokinetic work with TMB, 3 these hydrocarbons have half times in the CNS of approximately an hour. This is one reason why PBPK modeling is valuable as it can compare between predicted concentrations in rodents at any time after exposure to those predicted in humans during exposure.
Exposure to TMB produced evidence of minor physiological changes including small differences in body weight and body temperature in the high exposure (5000 mg/m3) group. There was 1 observation of altered gait in the 5000 mg/m3 group, but no effects in the FOB that were plausibly related to treatment. A decrease in motor activity was observed in the 5000 mg/m3 group after the third 8-hour exposure; a relationship to treatment is considered unlikely as similar effects were not observed after the first 8-hour exposure. In the visual discrimination performance tests, there were small but statistically significant effects on latency to response with a reduced frequency of short (ie, <2 seconds) and an increased frequency of long (ie, >6 seconds) latencies to response in the high exposure group. No differences were observed on the day after treatment, demonstrating reversibility. Additionally, it was noted that the effects were greater after the first 8-hour exposure period than after the third. This correlated with evidence from an uptake and distribution study that demonstrated that brain concentrations of TMB in the high exposure group were higher after the first than the third exposure period. These data suggest that TMB induced its own metabolism at high exposure levels and enhanced elimination although metabolic rates were not directly assessed in this study. The overall conclusions from this part of the study were that TMB induced slight, reversible physiological changes as well as CNS effects at 5000 mg/m3. There were no effects at the intermediate level (1250 mg/m3). The results of the pharmacokinetic investigation are consistent with previous studies in which, at levels of 100 to 1000 ppm (approximately 500-5000 mg/m3), the brain to blood ratios for TMB were approximately 2 to 3 and suggestive evidence for enhanced metabolism was also reported. 22,23
The mixed isomer C9 aromatic solvent produced similar but perhaps somewhat more profound effects than did TMB. There were small but statistically significant effects on body weight and body temperature and respiratory effects in the high exposure (5000 mg/m3) group. There were also effects on gait, particularly after the first 8-hour exposure period, reduced touch response, and evidence of reduced motor activity, all in the high exposure group. In the visual discrimination tests, there was evidence of increased latency, a reduced frequency of short latency responses, and an increased frequency of long latency responses, all in the intermediate and high exposure groups. These effects seemed to be somewhat more pronounced than those obtained in the TMB study. In contrast to the TMB study, the effects on visual discrimination did not appear to diminish with repeated exposure. However, no effects were evident on the day after exposure, demonstrating reversibility. The overall conclusions from this part of the study were that the mixed isomer C9 aromatic solvent induced slight, reversible physiological changes as well as acute CNS effects similar to but somewhat more profound than those associated with TMB. The greatest effects were observed at the 5000 mg/m3 level, but there was a statistically significant slowing in responding at the 1000 mg/m3 level. There were no statistically significant effects in the 200 mg/m3 group.
The difference between TMB and the mixed C9 aromatic solvent could have been due to the fact that the mixed solvent contains other constituents. As shown by Korsak and Rydzynski, 24 1,2,4-TMB may be somewhat less effective in inducing acute CNS effects than are other TMB isomers. Additionally, the C9 aromatic hydrocarbon solvent also contains a small percentage of C10 constituents. 25
The mixed isomer C10/C11 aromatic solvent did not produce any remarkable clinical signs. Body weights were significantly reduced in all exposure groups, and body temperatures were reduced in the high exposure group. There were effects on gait, particularly in the high exposure (2000 mg/m3) group, but there were no other effects on functional observational parameters and no effects on motor activity. In visual discrimination performance testing, there was an increased overall latency to response, reduction in the frequencies of short latency responses, and an increase in the frequency of long latency responses. These differences were significant in the high exposure (2000 mg/m3) group. Drink response latency was significantly increased in the high exposure group. There were no significant CNS effects in the intermediate (600 mg/m3) exposure group, and no CNS effects were detected at the low (200 mg/m3) level, although there were significant body weight effects. The magnitude of the effects tended to diminish with repeated exposures, and no significant differences were apparent the day after exposure, indicating that the effects were transient. Overall, 600 mg/m3 was a no effect level for CNS effects.
Several previous studies have assessed the toxicological effects of alkyl benzenes, although few were similar to the current studies. Cushman et al 26 reported that acute exposure to isopropyl benzene (cumene) affected gait and reduced rectal temperature at exposure levels of 500 and 1200 ppm (approximately 2500 and 6000 mg/m3). The effects were most pronounced 1 hour after exposure and reversed by 6 hours. Repeated exposure did not result in any functional or pathological changes in the nervous system. Tegeris and Balster 18 assessed the acute CNS effects of cumene and n-propyl benzene in mice. Significant findings were obtained in many of the tests, in some cases at the lowest concentration (2000 ppm or approximately 10 000 mg/m3) tested. The effects quickly disappeared after cessation of exposure. Korsak and Rydzynski 24 reported that acute exposures to TMBs resulted in exposure-related changes in rotarod performance and pain sensitivity. EC50 values were in the range of 4000 to 5000 mg/m3. Other investigators assessed the effects of repeated exposures to 2 TMB isomers (1,2,4-TMB and 1,3,5-TMB). 27 -29 In most of the measures, there were no significant differences between treated and control groups; however, in all studies there was a significantly reduced latency in the passive avoidance test. The toxicological relevance of these findings is difficult to assess, due in particular to the absence of dose-response relationships in studies involving multiple exposure levels. Douglas et al 30 exposed rats 6 hours/d, 5 d/wk for 13 weeks at levels of 100, 500, or 1500 ppm (approximately 500, 2500, and 7500 mg/m3) to a commercial C9 aromatic solvent comprised primarily of mixed C9 isomers. Animals were examined for functional deficits and changes in motor activity after 5, 9, and 13 weeks of exposure, and a neuropathological investigation was conducted after 13 weeks of treatment. There were effects on body weight gain in the high dose group, but there were no functional deficits or pathological evidence of nervous system effects. Korsak and Rydzynski 24 also investigated the effects of repeated exposures (6 hours/d, 5 d/wk for 3 months) using the same tests as were used in their acute studies. Significant differences were found in some of the parameters at levels of 250 ppm (approximately 1227 mg/m3), indicating acute CNS effects, but these were largely reversed when treatment was terminated.
In summary, observations consistent with acute CNS depression were reported in some previous studies but were seldom studied systematically. There were no effects on FOB measures or motor activity when these were examined specifically. Thus, the previous data seem reasonably consistent with the current studies in which exposure to 5000 mg/m3 produced very subtle acute effects on the CNS whereas exposure at lower levels had little or no effect.
In studies of TMBs in human volunteers, the most commonly reported finding was eye, nose, and throat irritation at 950 mg/m3 (180 ppm) whereas 320 mg/m3 (59 ppm) was considered a reasonable level to recommend as a hygienic standard. 31 Jarnberg et al 32 –34 reported that there were no signs of irritation or CNS effects among volunteers exposed to different TMB isomers at 25 ppm. Jones et al 35 reported that exposure to 25 ppm mixed TMB isomers for 4 hours was well tolerated by volunteers.
Studies of C10/C11 alkyl benzenes are similar to the above. Korsak et al 36 exposed mice for 4 hours to either 1- or 2-methylnaphthalene at vapor concentrations ranging from approximately 150 to 500 mg/m3. There were no effects on rotorod performance at exposure levels of either 407 (1-methylnaphthalene) or 522 (2-methylnaphthalene) mg/m3, the maximally attainable vapor concentrations. However, there did seem to be increased latency to pain sensitivity and reduced respiratory rates at lower exposure levels. Human volunteers reported that 410 mg/m3 (71 ppm) produced irritation and discomfort, leading to a recommendation of 150 mg/m3 (26 ppm) as a hygienic standard for a high aromatic solvent. 37 These data suggested that the higher molecular weight aromatics, principally alkylbenzenes, were somewhat more irritating to the respiratory tract than the lower molecular weight species. However, there were no clear indications of nervous system effects.
Conclusions
The overall objectives of this study were to assess the effects of C9 to C11 aromatic hydrocarbons on the CNS of rodents. There was evidence that these molecules produced mild, reversible effects on gait, motor activity, and visual discrimination at exposure levels well above current occupational exposure recommendations. Statistically significant effects in these domains were apparent in the high exposure groups (2000-5000 mg/m3). There were no statistically significant effects on visual discrimination in the intermediate exposure groups (600-1250 mg/m3). Postexposure studies demonstrated the reversibility of all effects. There was also evidence of mild respiratory effects as evidenced by red-colored exudate around the mouths and noses of rats in the C9 aromatic solvent study, again at the high exposure level (5000 mg/m3). These data, as well as evidence from previous studies, suggested that exposures to levels below approximately 1000 mg/m3 are unlikely to produce profound acute CNS effects or to produce irreversible systemic toxicity.
Footnotes
The author(s) declared a potential conflict of interest as follows: Two of the coauthors (RHM and DEO) are employed by companies that manufacture hydrocarbon solvents.
The author(s) disclosed receipt of the following financial support for the research and/or authorship of this article: CEFIC Hydrocarbon Solvent Producers Association.