
Abstract
This study examines the redistributive effects of tax system compositions across 107 countries from 1990 to 2020, using multiple econometric techniques and robustness checks to assess both short- and long-term dynamics. By stratifying countries by income levels and incorporating measures of tax effort, progressivity, and inequality quartiles, the analysis provides a detailed view of fiscal redistribution. Results show strong temporal persistence and relative support for the median voter hypothesis in high- and middle-income economies. Economic growth and informality negatively affect redistribution, while unemployment has income-specific impacts. Tax structure is central: PIT and SSC are most effective in high- and middle-income countries, while CIT and indirect taxes dominate in low-income economies. Structural progressivity enhances redistribution across all groups, and tax effort is particularly impactful in low-income countries. These findings highlight the importance of appropriate tax policy and fiscal capacity in achieving sustained redistribution.
Introduction
Historically, income distributions within countries were often viewed as a natural outcome of economic processes, largely unaffected by public policy. However, the evolution of democratic institutions and the decline in the political dominance of elite groups have shifted this perception. Enhanced civic participation and institutional development have brought increased attention to the role of governments in shaping income distributions (Meltzer and Richard 1981; Lupu and Pontusson 2011). In democratic settings, social and political demands are often channeled through political participation, exerting pressure on policymakers to adopt redistributive measures (Perotti 1996; Acemoglu et al. 2015).
Beyond theoretical frameworks, empirical research has identified consistent patterns in income redistribution. Piketty and Saez (2006) documented significant declines in top income shares during the early twentieth century, largely attributed to disruptions in wealth accumulation during World Wars, while rising top incomes seem to have contributed to increasing inequality in several countries more recently. Similar findings were presented by Alvaredo et al. (2017), which highlighted the high volatility and cross-country heterogeneity of long-run wealth inequality.
Empirical research further indicates that public policies can play a central role in influencing income distribution, particularly through social spending, public investment and enhancement of human capital (Afonso, Schuknecht, and Tanzi 2010; Muinelo-Gallo and Roca-Sagalés 2012). Moreover, although direct taxation is generally more progressive than indirect taxation, redistribution in OECD countries seems to be primarily achieved through social transfers (Wang, Caminada, and Goudswaard 2012; Causa and Hermansen 2017). The progressivity of tax systems also seems to be a key determinant of redistributive outcomes, as it directly influences the incidence of the tax burden (Martínez-Vazquez, Violeta, and Moreno-Dodson 2012; Sarralde, Garcimartín, and Ruiz-Huerta 2013).
However, despite extensive country-specific analyses, empirical evidence on the cross-country redistributive effects of the tax structure composition remains limited. Results show that disaggregated tax effects can vary significantly across contexts, whereas few studies have systematically examined these variations (Fuest, Niehues, and Peichl 2010; Joumard, Pisu, and Bloch 2012). 1
Therefore, this paper addresses this gap by analyzing the redistributive effects of tax structure compositions across multiple countries using a panel regression framework. Specifically, we examine the impact of different tax categories on the Reynolds-Smolensky Index (RSI), which captures the difference between pre-tax and post-tax-and-transfers Gini coefficients. Unlike prior studies that focus on either pre- or post-tax inequality or single-country decompositions, our approach enables a comparative assessment of tax items, particularly in middle- and low-income economies (Wang, Caminada, and Goudswaard 2013).
This study advances empirical literature by systematically isolating the redistributive effects of tax systems across a wide cross-section of countries and overtime. It employs multiple estimation strategies and extensive robustness checks to evaluate these relationships both in the short and long run. The analysis is further refined by disaggregating results according to pre-tax inequality quartiles and by incorporating measures of tax effort and progressivity.
To this end, the analysis draws on a sample of 107 economies from 1990 to 2020. Considering substantial cross-country heterogeneity, the sample is stratified into high, middle, and low-income groups to enable a more granular assessment of the dynamics within each category. A range of econometric techniques is employed to address common methodological challenges, while the role of social protection expenditures is incorporated into the empirical framework.
Contrary to previous evidence, this study finds that income redistribution exhibits strong temporal persistence across countries and that the median voter hypothesis is supported in high- and middle-income economies, when redistribution is measured in absolute terms. Macroeconomic factors such as economic growth and informality negatively affect redistribution, while unemployment plays more nuanced roles depending on income level. The tax structure composition appears to be central to redistribution. In high-income countries, PIT and SSC are most effective, while CIT and property taxes lose significance over time. In middle-income countries, PIT and SSC are robust redistributive tools, with CIT and property taxes gaining long-term relevance. In low-income countries, redistribution is primarily driven by CIT and indirect taxes, with SSC remaining underdeveloped. Structural progressivity also significantly enhances redistribution across all groups, whereas tax efforts positively influence redistribution particularly in low-income economies.
The remainder of the paper is structured as follows: Section 2 reviews the related literature. Section 3 explains the methodology and presents stylized facts on the data. Section 4 presents the results. Section 5 brings robustness and sensitivity tests. Section 6 addresses the role of tax progressivity. Section 7 brings the conclusions and policy recommendations.
Literature Review
Empirical evidence indicates that social policies can effectively reduce income inequality when supported by appropriate macroeconomic frameworks (Cornia and Martorano 2012). These frameworks can influence the nature of economic growth — whether capital- or labor-intensive, agriculture or industry-driven — thereby shaping distributional outcomes. Afonso, Schuknecht, and Tanzi (2010) showed that public policies in OECD countries can affect income distribution both directly, via social spending, and indirectly, through improvements in human capital and institutional quality. The authors advocate for targeted public expenditure, enhanced educational outcomes, and stronger administrative institutions. 2
Similarly, Muinelo-Gallo and Roca-Sagalés (2011, 2012) find that increased current expenditures and direct taxation can reduce inequality, though often at the cost of lower growth rates. In contrast, public investment appears to mitigate inequality without harming economic growth. Martínez-Vazquez, Violeta, and Moreno-Dodson (2012) also demonstrate that progressive personal and corporate income taxes could reduce inequality, while general consumption taxes tend to exacerbate it. Moreover, Johansson (2016) and Isiaka, Mihailov, and Razzu (2024) conclude in their literature reviews that reallocating public spending toward infrastructure, education, and welfare enhances equity. However, shifting revenue sources from income to consumption taxes may undermine redistributive goals due to their regressive nature (see Gupta and Jalles 2022).
A key methodological consideration in inequality analysis lies in the choice between pre-tax and post-tax-and-transfer Gini coefficients (Coelho and Alves 2024). The difference between the two indicators, captured by the Reynolds-Smolensky Index, is a widely used measure to assess the redistributive impact of fiscal policies (Reynolds and Smolensky 1977).
In this respect, micro-level household survey data is frequently employed to estimate income distributions and simulate policy effects (Hammer, Christl, and De Poli 2021; Maier and Ricci 2024). Microsimulation models, often linked to macroeconomic variables via computable general equilibrium (CGE) methods, are also prevalent in the literature (Peichl 2009; Alexandri et al. 2024). Nonetheless, discretionary specifications and methodological differences may limit cross-country evidence and temporal robustness (Guillaud, Olckers, and Zemmour 2020).
For instance, O’Donoghue, Baldini, and Mantovani (2004) used both the RSI and the Kakwani index to assess tax-benefit systems across 12 European countries, finding an average 40% reduction in post-tax Gini coefficients, primarily driven by pensions and benefits. Wang, Caminada, and Goudswaard (2012) report similar findings for OECD countries, with transfers accounting for 85% of redistribution and taxes for 15%. In contrast, Fuest, Niehues, and Peichl (2010) compared the sequential accounting approach with Shorrocks’ (1982) factor-source decomposition, revealing that social benefits dominate in the former, while taxes and contributions are more influential in the latter. 3 Causa and Hermansen (2017) and Hammer, Christl, and De Poli (2021) also highlight the central role of transfers, though their findings on taxation vary significantly across countries.
Building upon this body of research, Cornia, Gómez-Sabaini, and Martorano (2011) applied a panel model to Latin American countries, using RSI as the dependent variable to assess the redistributive effects of taxation. Their results confirm that direct taxes and social contributions positively affect redistribution, while taxes on goods and services have regressive impacts. Ostry, Berg, and Tsangarides (2014) and Jäntti et al. (2020) further explored the nexus between inequality, redistribution, and growth, finding no significant adverse effects of redistribution to economic growth. Finally, Gründler and Köllner (2017) extended this analysis by testing the Meltzer-Richard hypothesis and confirming that higher perceived inequality correlates with increased demand for redistribution.
This type of analysis follows a distinct approach to isolate and fully assess the redistribution process performed by the tax policy and underscores the importance of disaggregating tax system components to better understand their redistributive effects. It also highlights the need for comparative analyses across broader country samples and longer time horizons, integrating both aggregated fiscal data and household-level evidence, as it represents a relevant gap in empirical literature.
Methodology and Data
Decomposition of Income Redistribution
This section defines the standard indicators of income redistribution and tax progressivity commonly employed in the literature (Vellutini and Benítez 2021). For instance, let i denote a country-year observation and let

Assuming Ni(Xi) as the post-tax income distribution, the Reynolds Smolensky Index (RSI), a widely measure of income redistribution, can be formally defined as:

In addition, the Kakwani Index

The RSI can be further decomposed into two components: the progressivity of the tax system (as captured by
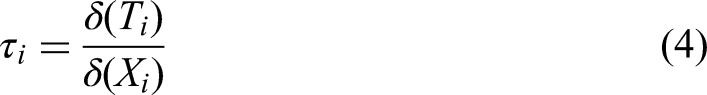
Using this, the RSI can be expressed as:
This decomposition highlights that overall redistribution is jointly determined by the progressivity of the tax system and the extent of tax collection relative to the income base. The term
In this regard, the structural composition of public revenues — namely, the sources and mechanisms through which governments collect funds — is a critical factor in evaluating the redistributive capacity of fiscal systems. Each tax instrument possesses distinct characteristics in terms of its taxable base, rate structure, and incidence, all of which influence its impact on income and wealth distribution. Public revenues are generally categorized into direct taxes, indirect taxes, and social security contributions, each with unique implications for equity.
Direct taxation includes personal and corporate income taxes as well as property taxes. Personal income tax (PIT) is typically progressive, applying increasing rates to higher income brackets, and is thus considered a central tool for redistribution. Corporate income tax (CIT), by contrast, often employs a flat-rate structure to avoid disincentivizing investment and business activity. While CIT may not directly promote redistribution through rate progressivity, it can exert indirect redistributive effects via its influence on labour markets, capital allocation, and economic growth. Property taxes, which predominantly affect higher-income households due to their greater asset ownership, can also serve redistributive purposes if designed to target wealth accumulation effectively. However, their progressivity is not inherent and depends largely on tax design and incidence.
Indirect taxes encompass consumption taxes—such as value-added tax (VAT)—and international trade taxes. VAT applies uniform rates across consumers regardless of income, rendering it regressive, as lower-income individuals spend a larger proportion of their income on taxed goods and services. Trade taxes, while generally minor in revenue terms, are primarily used for regulatory purposes and have limited redistributive impacts.
Social security contributions (SSC) represent a distinct category of earmarked revenues, allocated specifically to fund welfare programs including pensions, unemployment insurance, and healthcare. These contributions are typically proportional to income, with higher earners contributing more in absolute terms. However, the redistributive effect of SSC depends on their structural design. Systems with capped contributions or flat rates may be regressive, placing a relatively heavier burden on lower-income individuals. Conversely, progressive SSC schemes—where higher earners contribute a larger share of their income—enhance equity. Ultimately, the redistributive potential of SSC is determined by both the contribution structure and the allocation of benefits across income groups.
Redistribution and Taxation
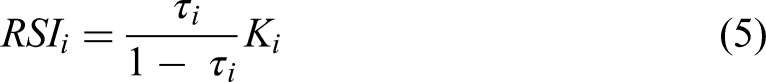
Income redistribution has long presented different dynamics across countries, particularly when considering average income levels (Caminada et al. 2019). Figure 1 illustrates the histogram and Kernel density of the RSI in absolute terms and of both pre- and post-tax Gini coefficients. The mean difference between pre- and post-tax coefficients for high income countries (HIC) is approximately 12 points, with a low standard deviation (4.6 points) suggesting relatively homogeneous samples, although there is certain evidence of a bimodal distribution, where part of the data shows more moderate redistribution levels. Similar evidence is observed when analyzing redistribution in relative terms (around 27%).
Histogram and Kernel Density. Notes: Kernel density is Epanechnikov. Solid lines refer to pre-tax Gini and dashed lines refer to post-tax Gini. Results are computed using the WID database.
It is also observed that countries with higher average income levels tend to exhibit greater redistributive capacity through fiscal policy. On average, the absolute reduction in inequality is approximately 4.65 points in middle-income countries (MICs) and 2.33 points in low-income countries (LICs), both with relatively high standard deviations (2.98 and 2.01 points, respectively). Relative redistribution follows a similar pattern, with MICs achieving an average reduction of 8.07% compared to 3.95% in LICs, indicating substantially lower redistributive effectiveness in the latter group.
This trend is further illustrated by the kernel density distributions of pre- and post-tax Gini coefficients. In high-income countries (HICs), the post-tax distribution is notably shifted leftward, reflecting a more pronounced reduction in inequality. In contrast, MICs and LICs show only modest shifts, although a slight increase in the left mode of the post-tax distribution suggests certain reduction in average inequality due to taxes and transfers.
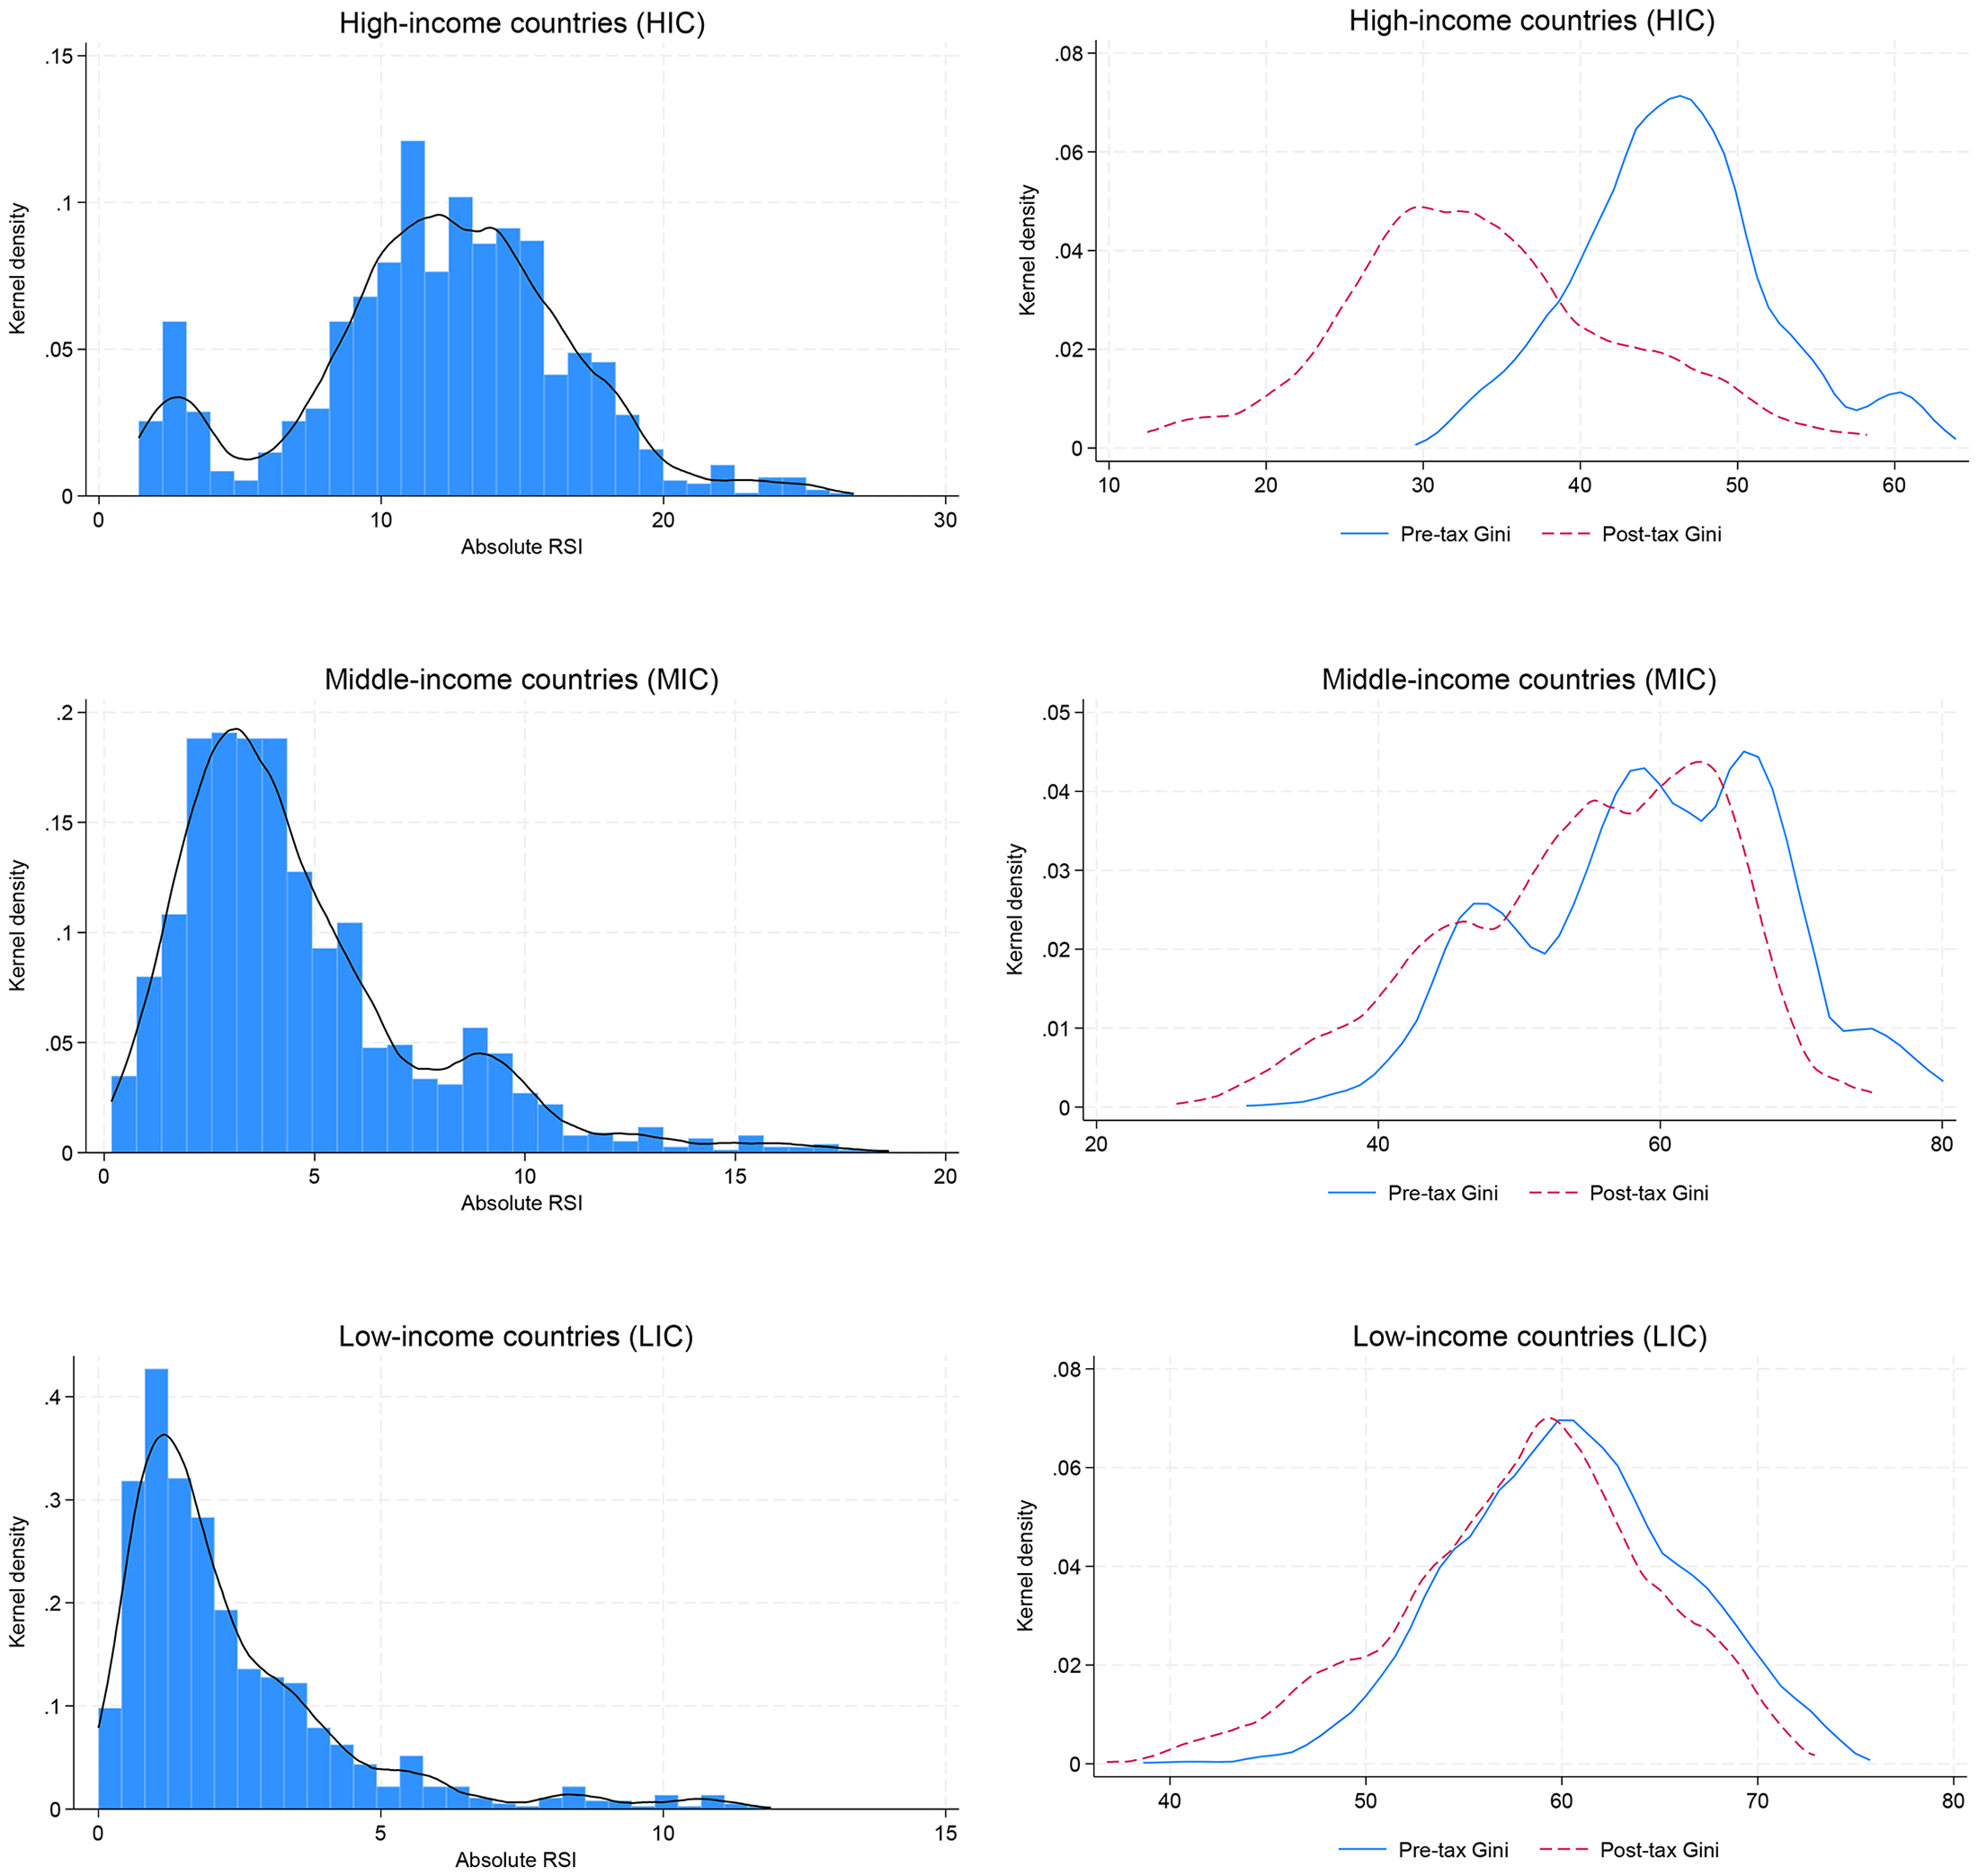
Figure 2 presents the evolution of redistributive outcomes over the past three decades across income groups, alongside the structural composition of tax revenues. It reveals that redistribution has generally increased in HICs and MICs, while remaining relatively stagnant in LICs. These differences appear closely linked to the underlying tax structures. HICs not only collect higher tax revenues as a share of GDP but also rely more heavily on direct taxation — particularly income and property taxes — while maintaining robust social security systems and substantial indirect tax revenues. In contrast, MICs and LICs depend primarily on indirect taxes, with limited contributions from direct taxes and social security.
Absolute RSI and Tax Revenues. Notes: RSI is calculated using the WID database and tax revenues come from the UNU-WIDER database. Author’s elaboration.
As previously discussed, income taxes — especially personal income taxes — are typically progressive and central to redistribution. Property taxes may also be progressive, contingent on their design and incidence. Social security contributions, while structurally earmarked for welfare programs, can be either progressive or regressive depending on their rate structure and income caps, yet they generally contribute to redistribution through benefit allocation. Conversely, indirect taxes, despite being the primary source of revenue in MICs and LICs, tend to be regressive and may undermine redistributive efforts, particularly when they crowd out more progressive tax instruments.
Econometric Model
In the initial stage of the analysis, the Reynolds-Smolensky Index (RSI) is constructed for a panel of 107 economies over the period 1990–2020. The RSI is calculated as both the absolute and relative difference between the market (pre-tax and transfer) and disposable (post-tax and transfer) Gini coefficients, as previously defined. 5
Subsequently, the study investigates the main determinants of the RSI, with particular emphasis on the composition of tax systems. Following the approaches of Gründler and Köllner (2017) and Kammas and Sarantides (2019), the RSI is employed as the dependent variable within a panel data framework, as outlined below:
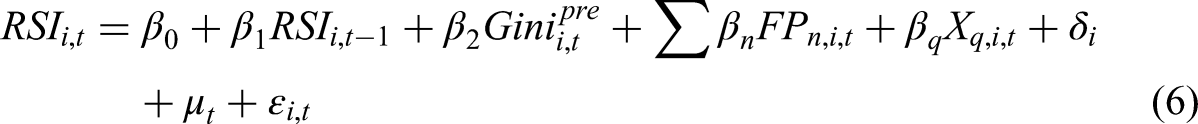
Equation (8) incorporates a lagged dependent variable to account for path dependency, reflecting the persistence of fiscal policy frameworks and the institutional inertia that often constrains short- and medium-term reforms.
Employing standard estimators such as Fixed Effects (FE) or Random Effects (RE) may yield biased results in dynamic panel settings due to the presence of the lagged dependent variable, as highlighted by Nickell (1981). To address these concerns while accounting for unobserved heterogeneity and potential endogeneity, more robust estimators have been developed. The first approach involves the use of instrumental variables via Two-Stage Least Squares (2SLS) to predict endogenous variables through a two-step estimation process. In this case, the consistency of the model requires instruments to be strong and valid enough to predict the endogenous variable. Therefore, the Sargan-Hansen test is performed to assess the validity of overidentifying restrictions. The null hypothesis is that the instruments are valid and thus uncorrelated with the error term. In this case, the non-rejection of the null hypothesis reflects the validity of the instruments.
Alternatively, Arellano and Bond (1991) proposed the Generalized Method of Moments (GMM), which utilizes lagged levels of the explanatory variables as instruments in the first-differenced equation, under the assumption of no serial correlation in the error term. However, Blundell and Bond (1998) and Bond, Hoeffler, and Temple (2001) demonstrate that the standard first-differenced GMM estimator may perform poorly in the presence of highly persistent series or when the variance of fixed effects is substantial due to weak instrumentation.
To mitigate this issue, the system-GMM estimator is employed, which combines equations in levels and first differences, thereby preserving cross-sectional information and improving efficiency. Provided that instruments satisfy the conditions outlined by Arellano and Bover (1995), system-GMM exhibits superior finite sample properties. In this respect, instrument validity is assessed using the Difference-in-Hansen tests, and the instrument set is restricted to two lags to avoid overfitting and instrument proliferation, as recommended by Roodman (2009).
The reliability of the GMM estimator also hinges on two key conditions: the absence of second-order serial correlation in the error term and the validity of the instrumental variables. To assess these, Arellano-Bond tests for autocorrelation are reported at the end of each table. The nonrejection of the null hypothesis in the second-order test confirms that the differenced residuals are not autocorrelated. Additionally, Hansen tests for overidentifying restrictions support the validity of the instruments when the null hypothesis is not rejected. The Difference-in-Hansen test further validates the additional orthogonality conditions specific to the system GMM approach.
Data
The sample is stratified into high-income (HIC), middle-income (MIC), and low-income (LIC) countries, based on the World Bank classification. This categorization relies on per capita Gross National Income (GNI), expressed in current U.S. dollars, and is determined using the World Bank Atlas methodology.
Data on pre-tax (market) and post-tax (disposable) income Gini coefficients are sourced from the World Inequality Database (WID), an initiative of the World Inequality Lab that provides comprehensive, open-access data on income and wealth inequality across countries and population segments, enabling more granular and reliable distributional analysis.
Fiscal policy variables, represented in the vector
Due to limitations in data availability on social protection expenditures, two distinct sources are utilized. For high-income countries, data are drawn from the IMF's Government Finance Statistics (GFS), classified by functional expenditure categories (COFOG). For middle- and low-income countries, data are retrieved from the Statistics on Public Expenditures for Economic Development (SPEED) database.
The control variables included in the vector
The inclusion of these variables is motivated by theoretical and empirical considerations. Structural and demographic characteristics are widely recognized as determinants of income inequality, while labor market conditions influence the government's revenue-generating capacity. Moreover, growth and debt dynamics are expected to influence economic activity and fiscal space, thereby affecting redistributive outcomes (Shao 2021).
The description of all variables is displayed at Table A1 and the summary statistics are displayed at Table A2 in the Appendix.
Results
Baseline Estimates
Baseline results are displayed by sequentially disaggregating tax revenues in Tables 1 to 3, corresponding to high-income countries (HIC), middle-income countries (MIC), and low-income countries (LIC), respectively. For each income group, two distinct estimation strategies are employed.
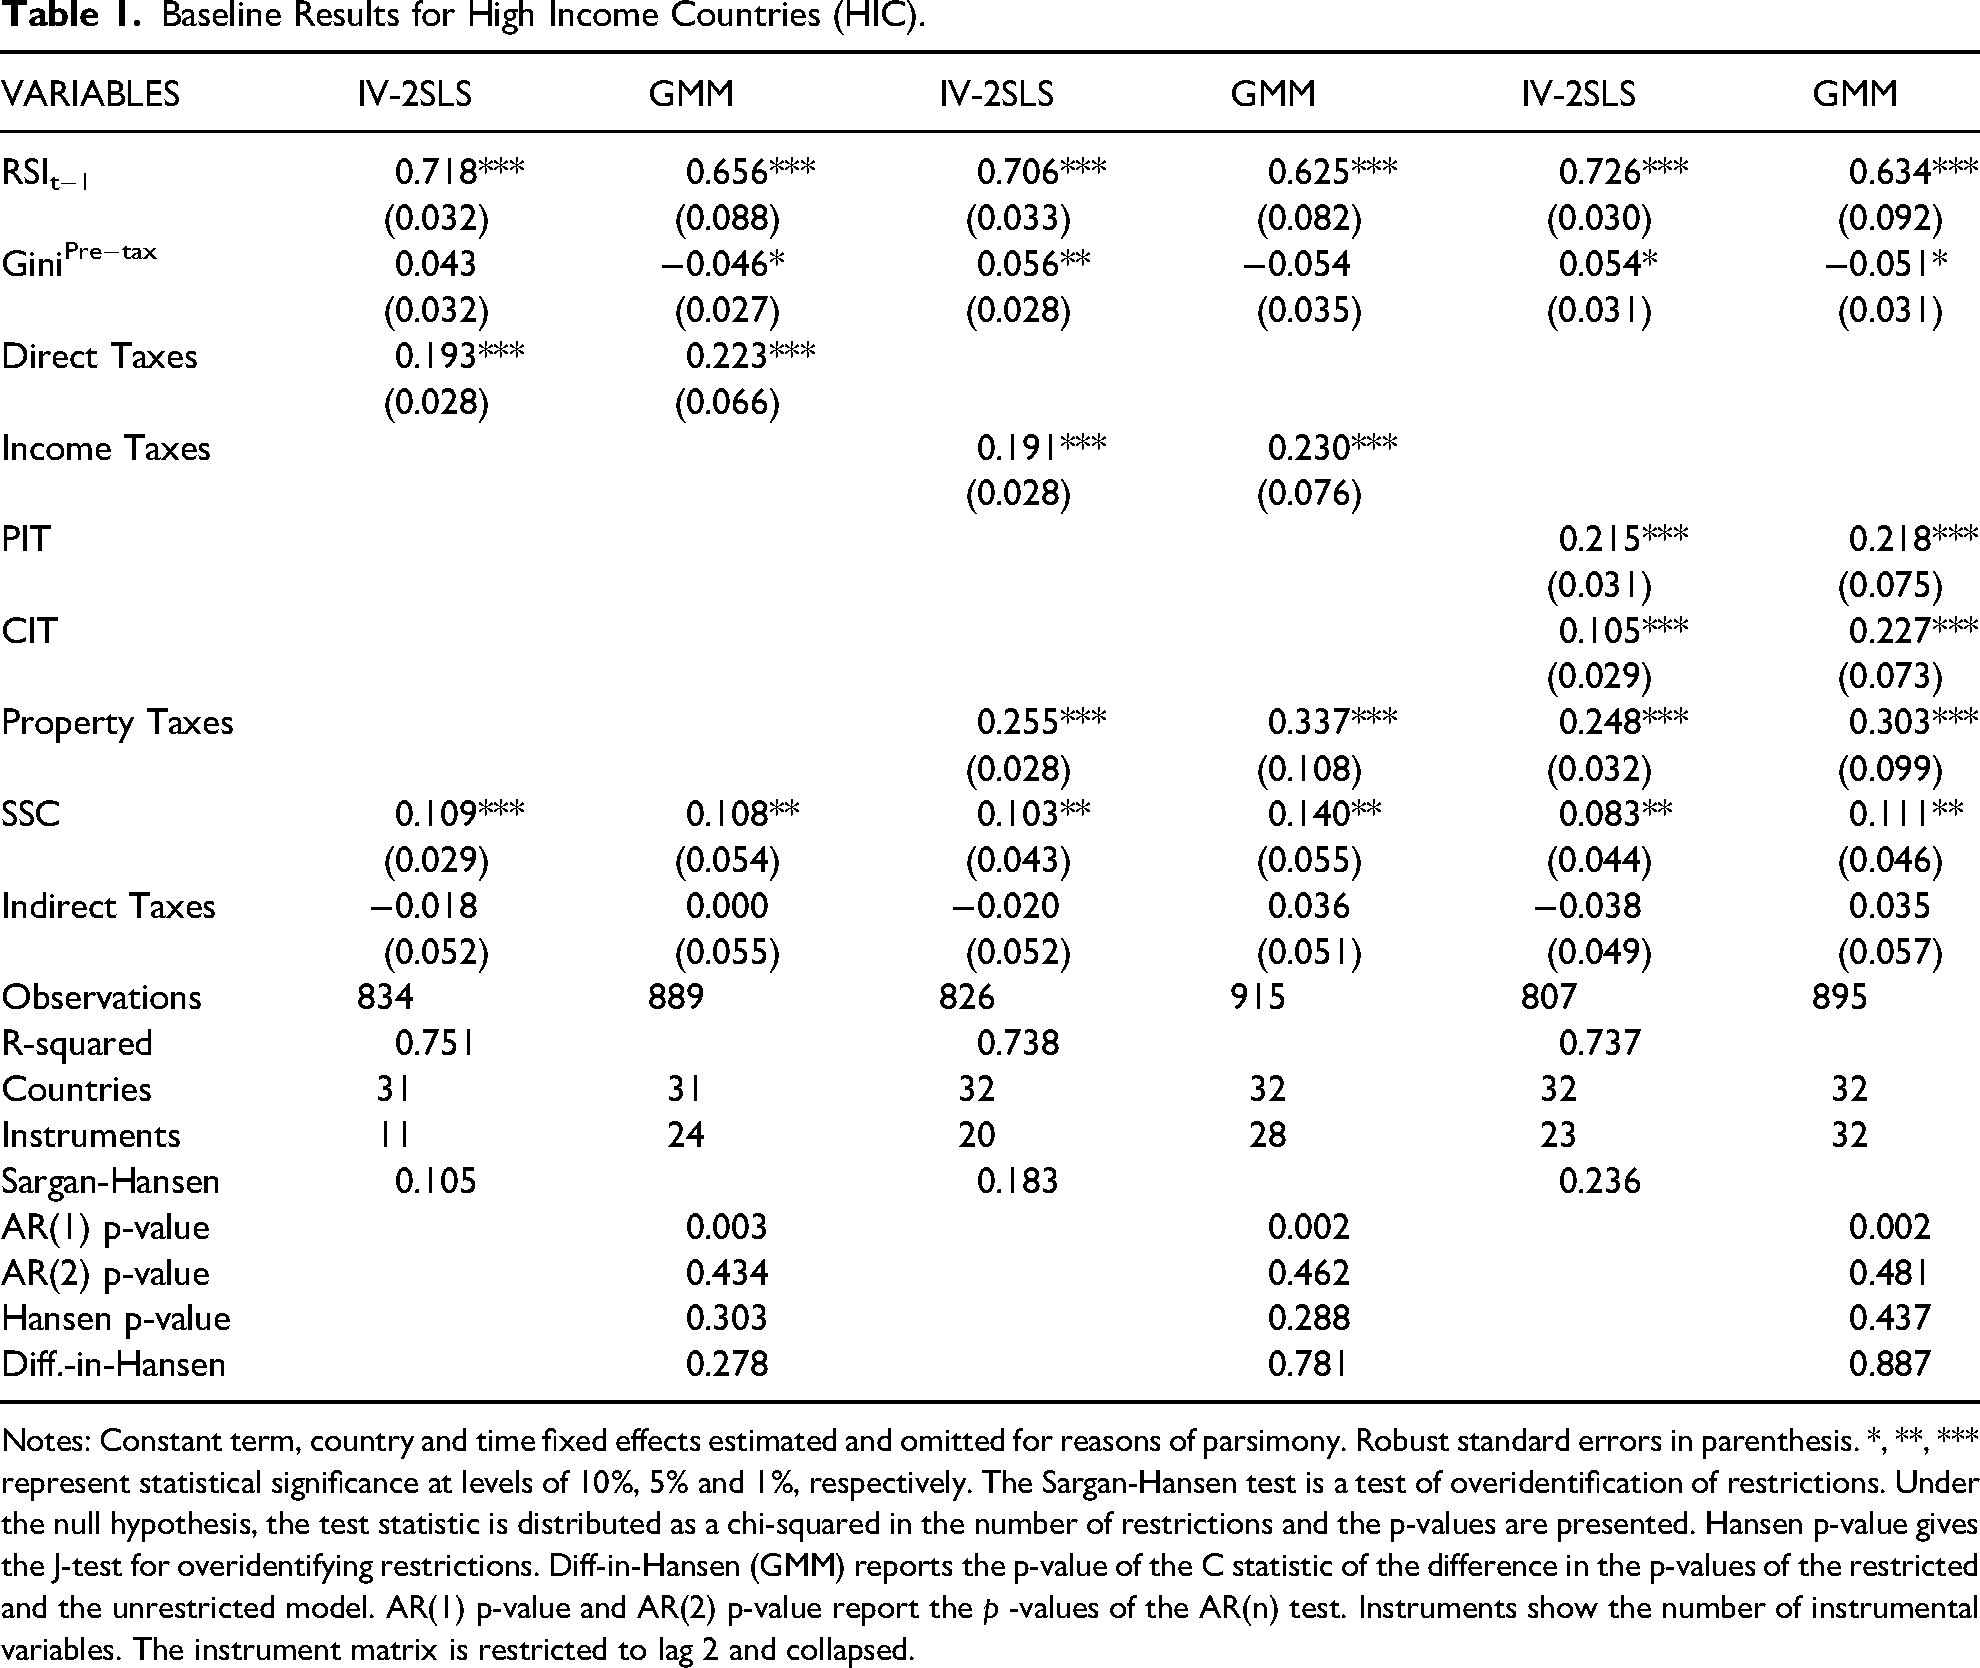
Baseline Results for High Income Countries (HIC).
Notes: Constant term, country and time fixed effects estimated and omitted for reasons of parsimony. Robust standard errors in parenthesis. *, **, *** represent statistical significance at levels of 10%, 5% and 1%, respectively. The Sargan-Hansen test is a test of overidentification of restrictions. Under the null hypothesis, the test statistic is distributed as a chi-squared in the number of restrictions and the p-values are presented. Hansen p-value gives the J-test for overidentifying restrictions. Diff-in-Hansen (GMM) reports the p-value of the C statistic of the difference in the p-values of the restricted and the unrestricted model. AR(1) p-value and AR(2) p-value report the p -values of the AR(n) test. Instruments show the number of instrumental variables. The instrument matrix is restricted to lag 2 and collapsed.
Baseline Results for Middle Income Countries (MIC).

Notes: Constant term, country and time fixed effects estimated and omitted for reasons of parsimony. Robust standard errors in parenthesis. *, **, *** represent statistical significance at levels of 10%, 5% and 1%, respectively. The Sargan-Hansen test is a test of overidentification of restrictions. Under the null hypothesis, the test statistic is distributed as a chi-squared in the number of restrictions and the p-values are presented. Hansen p-value gives the J-test for overidentifying restrictions. Diff-in-Hansen (GMM) reports the p-value of the C statistic of the difference in the p-values of the restricted and the unrestricted model. AR(1) p-value and AR(2) p-value report the p -values of the AR(n) test. Instruments show the number of instrumental variables. The instrument matrix is restricted to lag 2 and collapsed.
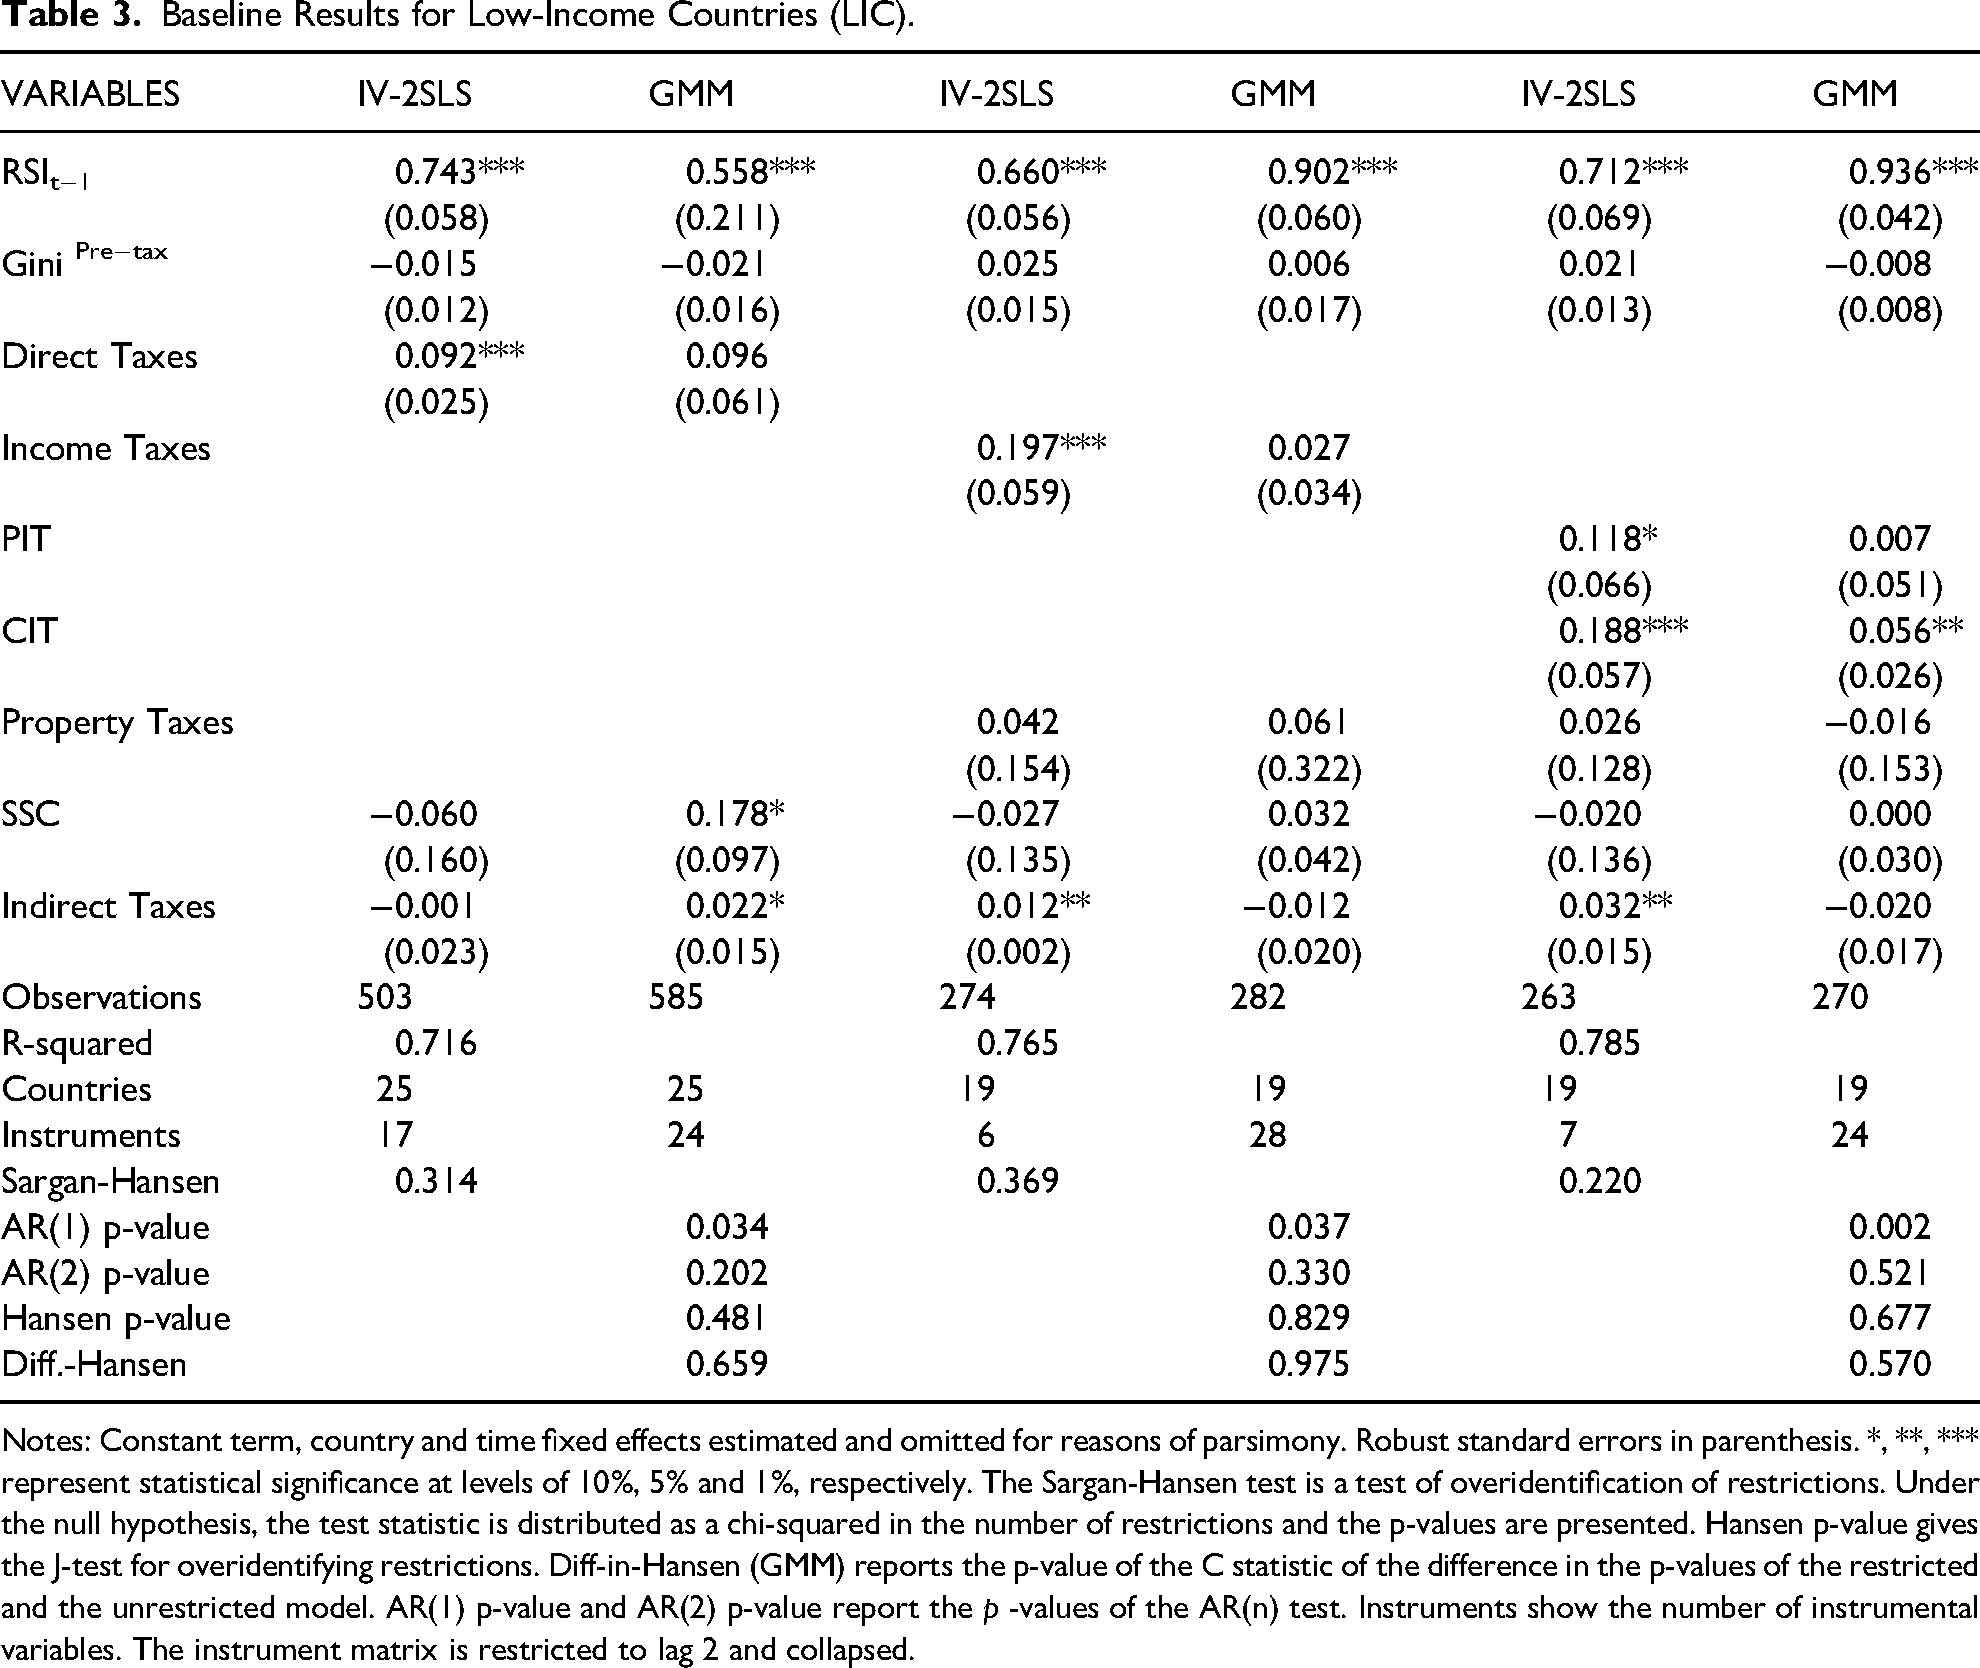
Baseline Results for Low-Income Countries (LIC).
Notes: Constant term, country and time fixed effects estimated and omitted for reasons of parsimony. Robust standard errors in parenthesis. *, **, *** represent statistical significance at levels of 10%, 5% and 1%, respectively. The Sargan-Hansen test is a test of overidentification of restrictions. Under the null hypothesis, the test statistic is distributed as a chi-squared in the number of restrictions and the p-values are presented. Hansen p-value gives the J-test for overidentifying restrictions. Diff-in-Hansen (GMM) reports the p-value of the C statistic of the difference in the p-values of the restricted and the unrestricted model. AR(1) p-value and AR(2) p-value report the p -values of the AR(n) test. Instruments show the number of instrumental variables. The instrument matrix is restricted to lag 2 and collapsed.
First, to address potential endogeneity in the pre-tax Gini coefficients, the Two-Stage Least Squares (2SLS) approach is implemented. 6 The instrumental variables utilized include the income share of the top 10% of households and the Palma ratio (defined as the ratio of income held by the top 1% to that of the bottom 40%), alongside lagged values of the remaining independent variables.
Second, the two-step system Generalized Method of Moments (system-GMM) estimator is applied. In this specification, the instrument set is restricted to two lags and collapsed to mitigate the risk of over-instrumentation.
Table 1 reports results for HICs. The statistically significant coefficients on lagged values of the Reynolds-Smolenski Index (RSI) suggest a strong temporal persistence in redistribution. However, the coefficients on pre-tax Gini coefficients do not provide conclusive support for the median voter hypothesis. The findings also indicate robust and statistically significant positive effects for direct taxation and its components—personal income tax (PIT), corporate income tax (CIT), and property taxes—as well as for social security contributions (SSC).
These results are consistent with the findings of Fuest, Niehues, and Peichl (2010), which suggest that taxes possess greater redistributive capacity than social benefits. Notably, property taxes emerge as the most redistributive instrument: a 1 p.p. increase in property tax revenues is associated with an improvement of over 0.2 Gini points in redistribution. Comparable effects are observed for PIT and CIT, each contributing with approximately 0.2 Gini points, while SSCs yield an average impact of around 0.1 points.
Table 2 presents the results for MICs. Redistribution continues to exhibit significant time persistence. In contrast to HICs, pre-tax inequality is positively associated with redistribution, lending empirical support to the Meltzer and Richard (1981) hypothesis, which posits that poorer median voters demand greater redistribution. Direct taxation and SSCs remain positively associated with redistribution, although the magnitude of the coefficients is generally lower, particularly for income taxes.
Among the tax instruments, PIT demonstrates the most pronounced redistributive effect. Nonetheless, CIT and SSCs also emerge as relevant contributors. These findings reinforce the conclusions of Cornia and Martorano (2012) for Latin American economies, while highlighting PIT as the most consistently effective tool for redistribution.
Table 3 presents the results for low-income countries (LICs). Redistribution continues to exhibit significant temporal persistence, as indicated by the coefficients on lagged RSI values. However, no empirical support is found for the median voter hypothesis in this income group. Moreover, the evidence regarding the redistributive effects of taxation is limited. While direct taxation shows some positive associations with redistribution, these effects are not robust and appear to be primarily driven by corporate income taxes (CIT). Social security systems do not exhibit statistically significant impacts on redistribution. In contrast, indirect taxation demonstrates relatively positive effects, which may be attributable to its role as the predominant source of government revenues in LICs.
Social Protection Expenditures and Public Investment
As discussed in Section 3.1, the redistributive impact of social security systems is contingent upon their structural design, contribution mechanisms, and the allocation of benefits. Consequently, social security contributions (SSC) alone may not adequately capture the broader characteristics and redistributive capacity of welfare programs, including pensions, unemployment insurance, and healthcare policies. To better account for these dimensions, regressions are extended to include social protection expenditures and public investment. The corresponding results are presented in Table 4.
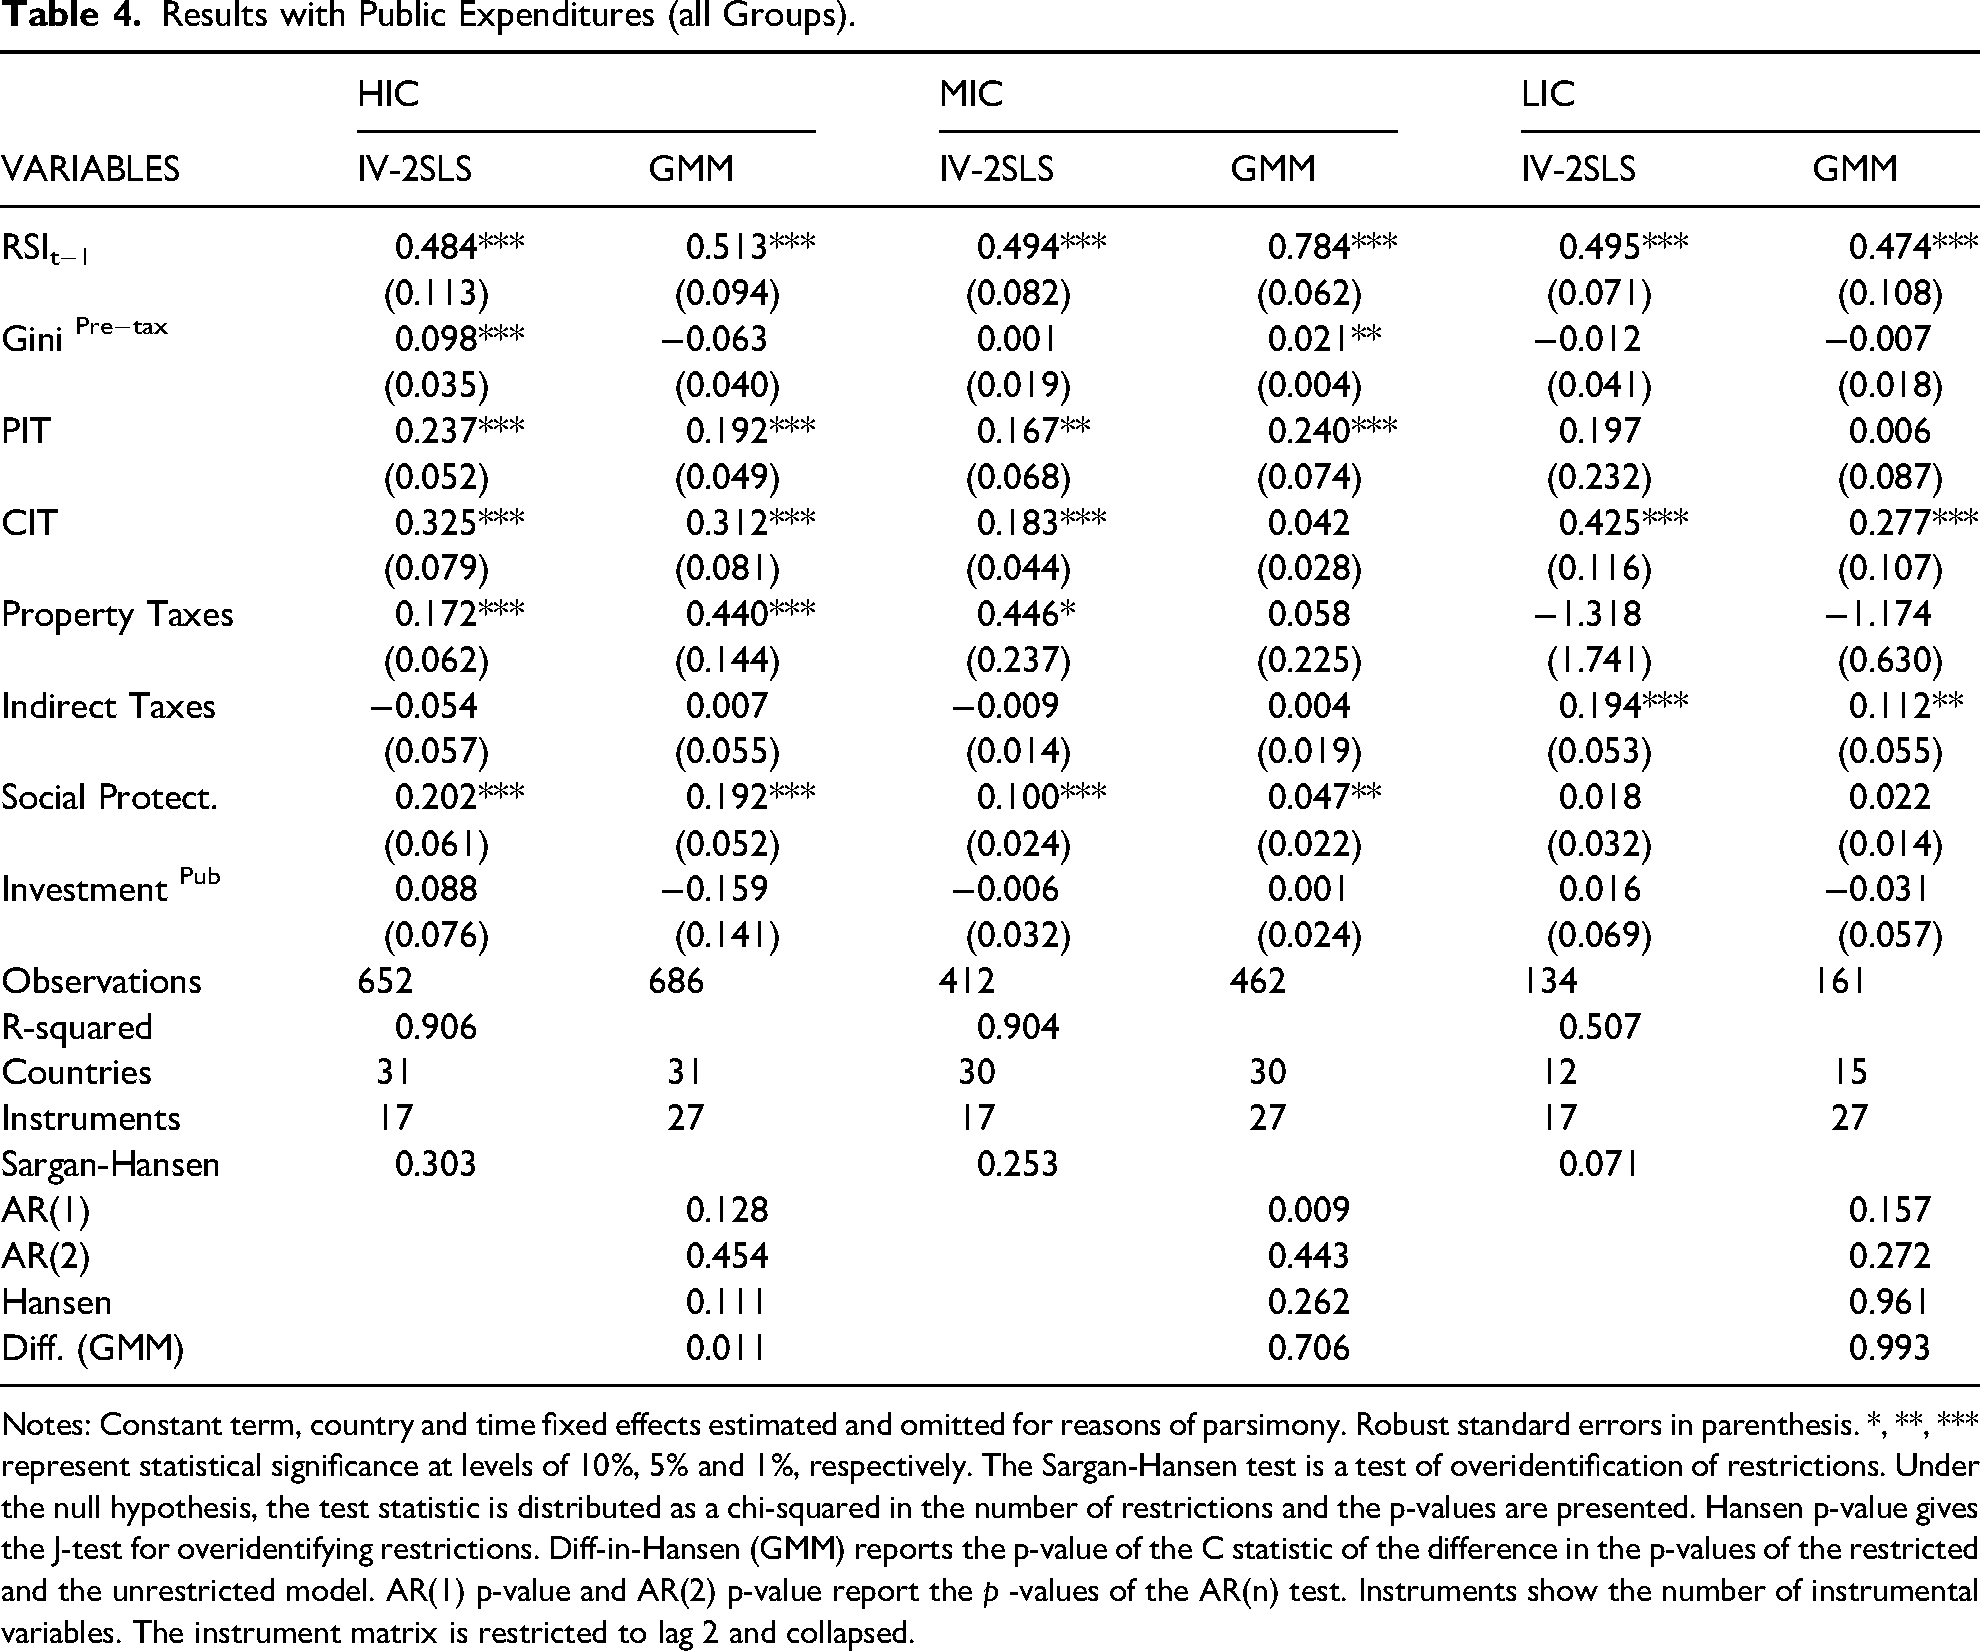
Results with Public Expenditures (all Groups).
Notes: Constant term, country and time fixed effects estimated and omitted for reasons of parsimony. Robust standard errors in parenthesis. *, **, *** represent statistical significance at levels of 10%, 5% and 1%, respectively. The Sargan-Hansen test is a test of overidentification of restrictions. Under the null hypothesis, the test statistic is distributed as a chi-squared in the number of restrictions and the p-values are presented. Hansen p-value gives the J-test for overidentifying restrictions. Diff-in-Hansen (GMM) reports the p-value of the C statistic of the difference in the p-values of the restricted and the unrestricted model. AR(1) p-value and AR(2) p-value report the p -values of the AR(n) test. Instruments show the number of instrumental variables. The instrument matrix is restricted to lag 2 and collapsed.
In this specification, SSCs are excluded to mitigate potential multicollinearity with social protection expenditures, while public investment is incorporated as a complementary redistributive channel, potentially linked to improvements in employment and wage levels.
Under this extended framework, evidence supporting the Meltzer and Richard (1981) hypothesis emerges for both HICs and MICs, indicating that higher pre-tax inequality is associated with increased redistribution. The results for PIT, CIT, property taxes, and social protection expenditures remain robust, reinforcing the previously observed redistributive effects and underscoring the importance of direct taxation and comprehensive welfare systems in these country groups. In contrast, for LICs, CIT and indirect taxation continue to be the most influential redistributive instruments. Public investment, however, does not exhibit statistically significant redistributive effects across any of the income groups.
It is important to note that these findings do not imply the absence of redistribution through PIT, property taxes, or social security systems in LICs. Rather, they reflect the limited fiscal capacity and relatively low revenue mobilization from these sources in low-income economies, which may obscure cross-country variation in redistributive outcomes. The results suggest that LICs relying more heavily on corporate and indirect taxation tend to achieve higher levels of income redistribution, not necessarily because of differences in inherent tax progressivity or welfare programs.
Structural Characteristics
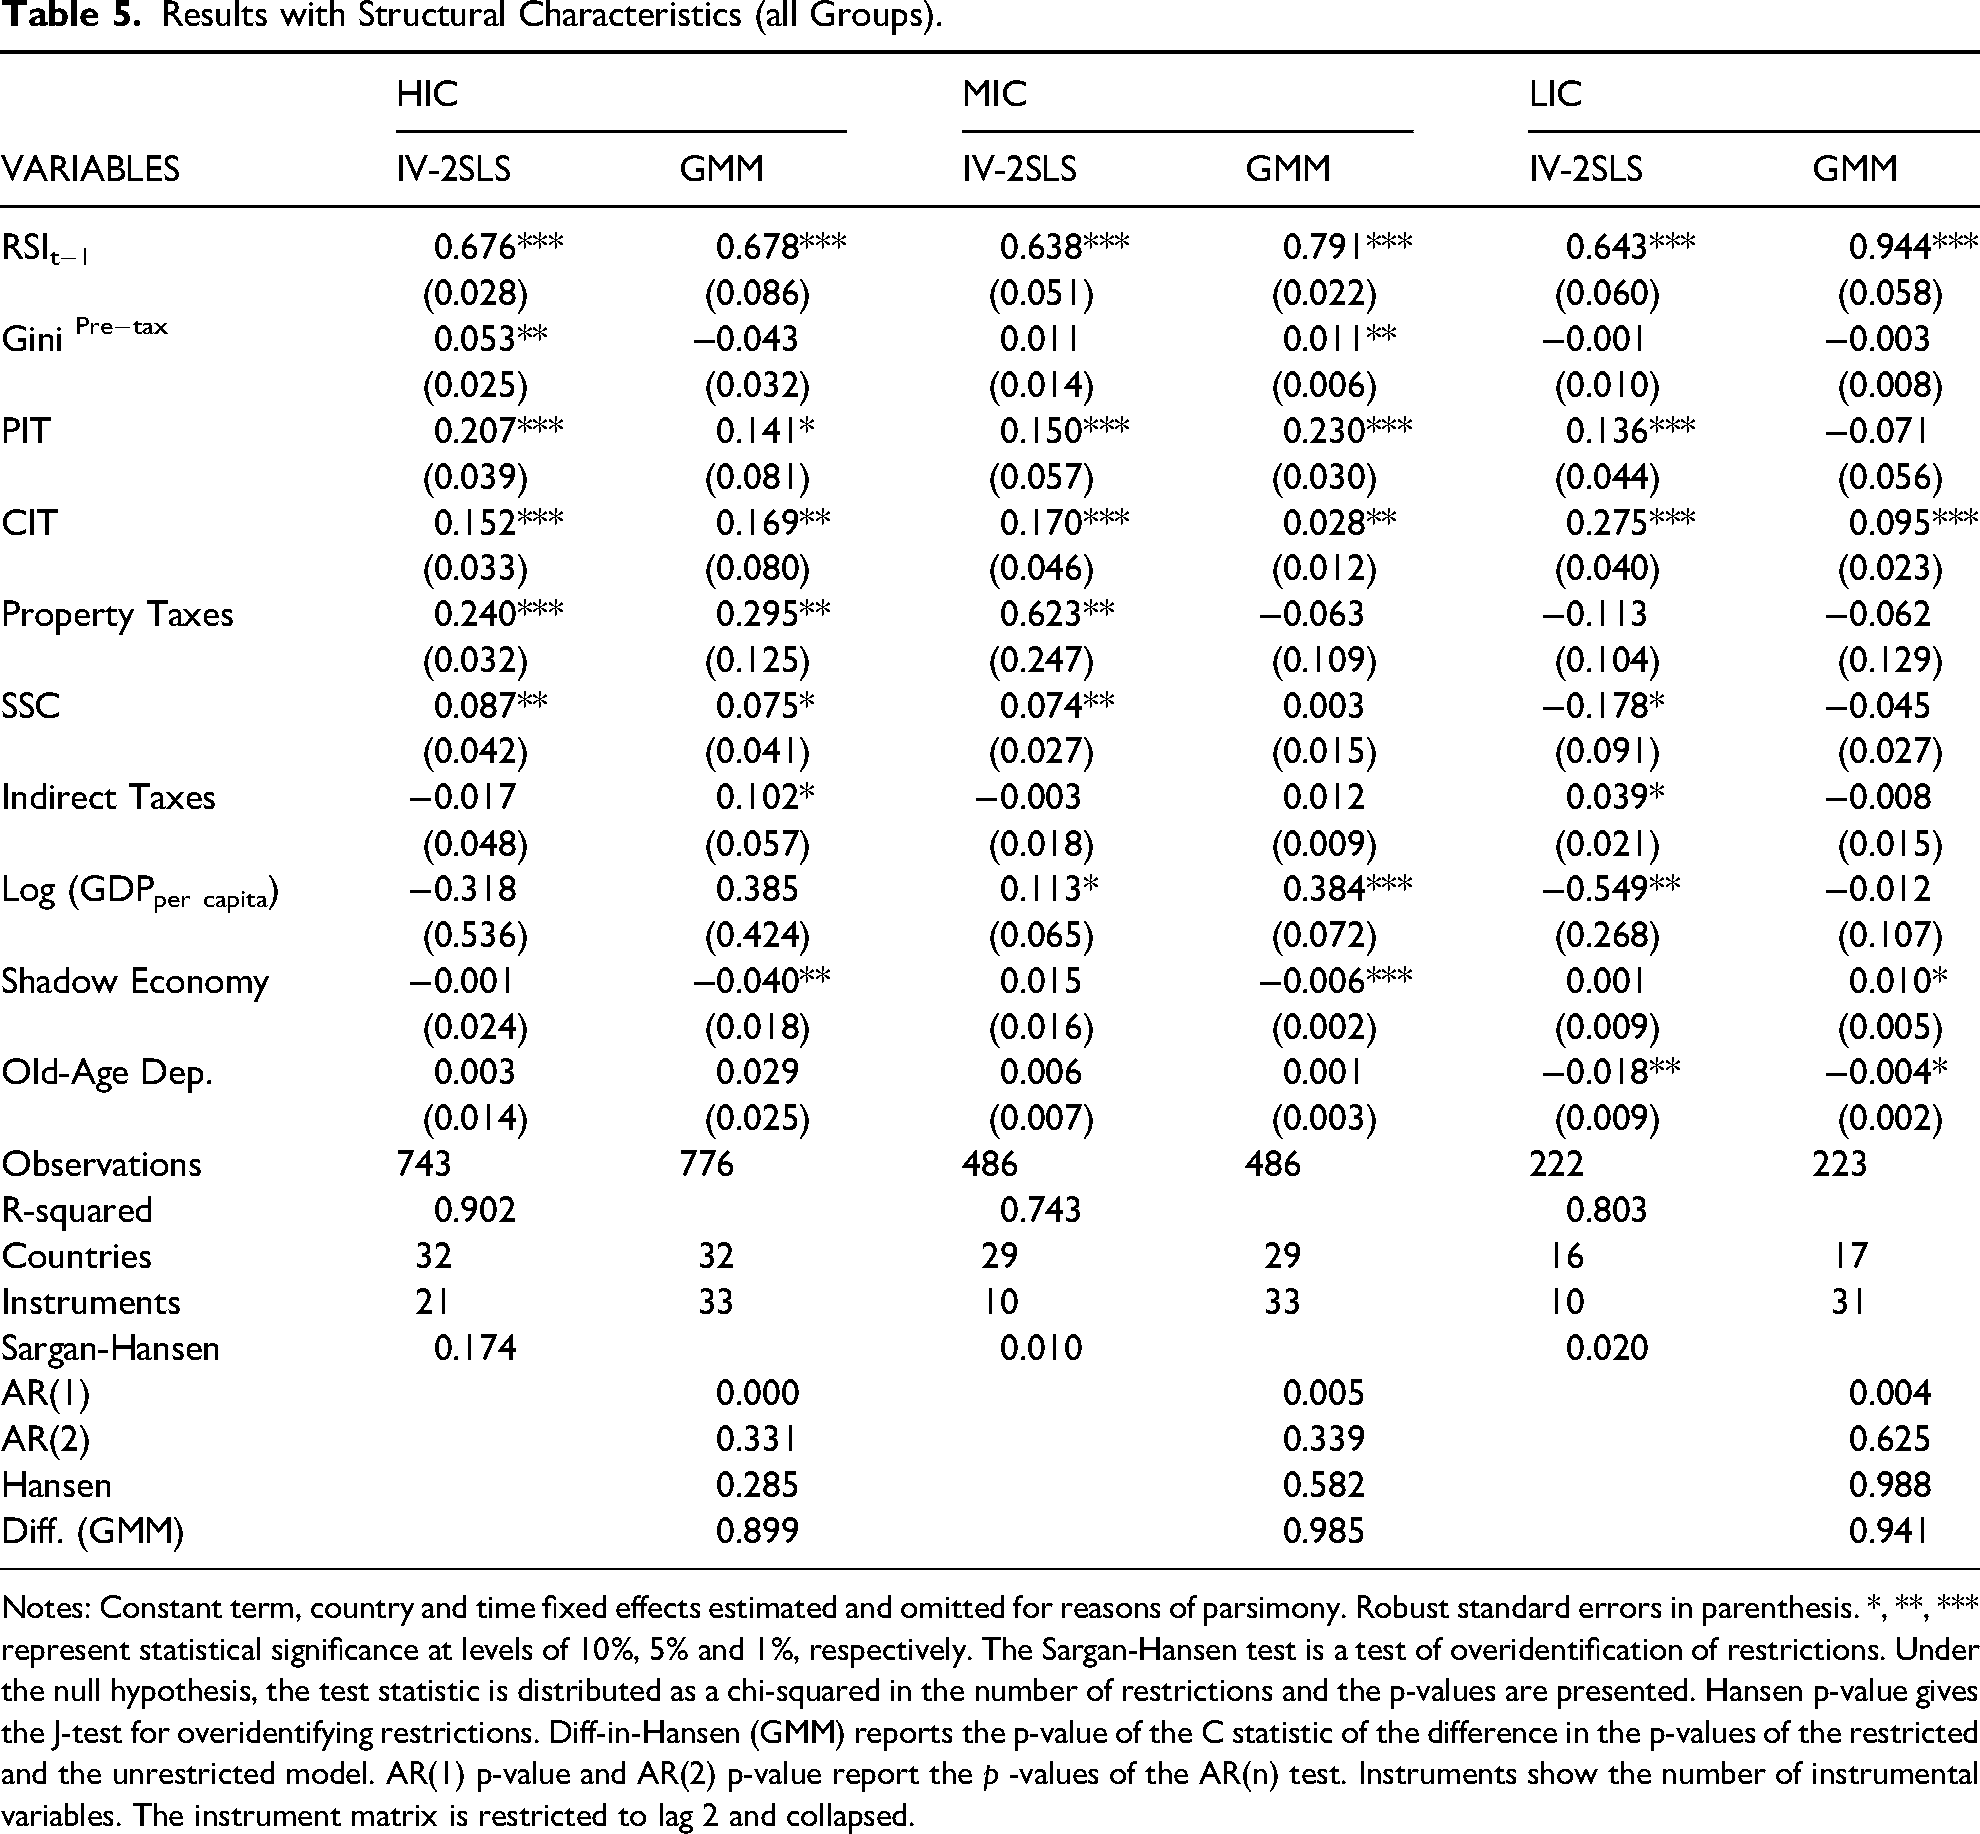
This section examines the influence of structural characteristics on redistribution. Specifically, three key variables are incorporated to capture socioeconomic and demographic dimensions: (i) the logarithm of per capita GDP, reflecting differences in economic development; (ii) the shadow economy indicator, which measures the proportion of economic activity occurring outside formal regulatory frameworks; and (iii) the old-age dependency ratio, defined as the ratio of individuals aged 65 and above to the working-age population, representing demographic pressures on labor markets and social security systems. These variables are selected based on theoretical and empirical literature suggesting that development levels, institutional quality, and demographic composition may significantly shape redistributive dynamics (Jäntti, Pirttilä, and Rönkkö 2020; Muinelo-Gallo 2022). The corresponding results are presented in Table 5.
Results with Structural Characteristics (all Groups).
Notes: Constant term, country and time fixed effects estimated and omitted for reasons of parsimony. Robust standard errors in parenthesis. *, **, *** represent statistical significance at levels of 10%, 5% and 1%, respectively. The Sargan-Hansen test is a test of overidentification of restrictions. Under the null hypothesis, the test statistic is distributed as a chi-squared in the number of restrictions and the p-values are presented. Hansen p-value gives the J-test for overidentifying restrictions. Diff-in-Hansen (GMM) reports the p-value of the C statistic of the difference in the p-values of the restricted and the unrestricted model. AR(1) p-value and AR(2) p-value report the p -values of the AR(n) test. Instruments show the number of instrumental variables. The instrument matrix is restricted to lag 2 and collapsed.
The findings continue to provide empirical support for the Meltzer and Richard (1981) hypothesis in HICs and MICs, where higher pre-tax inequality is associated with increased redistribution. In LICs, however, the relationship appears to be negative, though statistically insignificant, potentially reflecting the challenges faced by highly unequal low-income economies in implementing effective redistributive policies.
Regarding tax instruments, the results reaffirm the strong redistributive effects of PIT, CIT, property taxes, and SSCs in HICs. In MICs, PIT remains the most robust redistributive tool, while CIT, property taxes, and SSCs also contribute meaningfully. For LICs, the evidence continues to highlight CIT as the most significant redistributive tax instrument, consistent with previous findings.
The results in Table 5 also shed light on the influence of structural factors on redistributive outcomes. Economic development, proxied by the logarithm of per capita GDP, appears to significantly contribute to redistribution in middle-income countries (MICs). This is in line with Gründler and Köllner (2017) and may be attributed to the greater heterogeneity in income levels and social conditions within MICs, which contrasts with the relatively more homogeneous contexts of high-income countries (HICs) and low-income countries (LICs), where economic development does not seem to exhibit statistically significant effects.
The informal economy, captured through the shadow economy indicator, demonstrates a negative association with redistribution in both HICs and MICs. This finding underscores the detrimental impact of unregulated and untaxed economic activities on the effectiveness of redistributive policies. Demographic characteristics, represented by the old-age dependency ratio, show a positive but statistically insignificant relationship with redistribution in HICs and MICs. This suggests that a higher proportion of elderly individuals — typically the primary beneficiaries of pension systems — may be associated with increased redistributive efforts.
In contrast, LICs exhibit a significant negative relationship between the old-age dependency ratio and redistribution, potentially reflecting the income vulnerability of older populations and the limited capacity of social protection systems in these economies to mitigate inequality in later life stages.
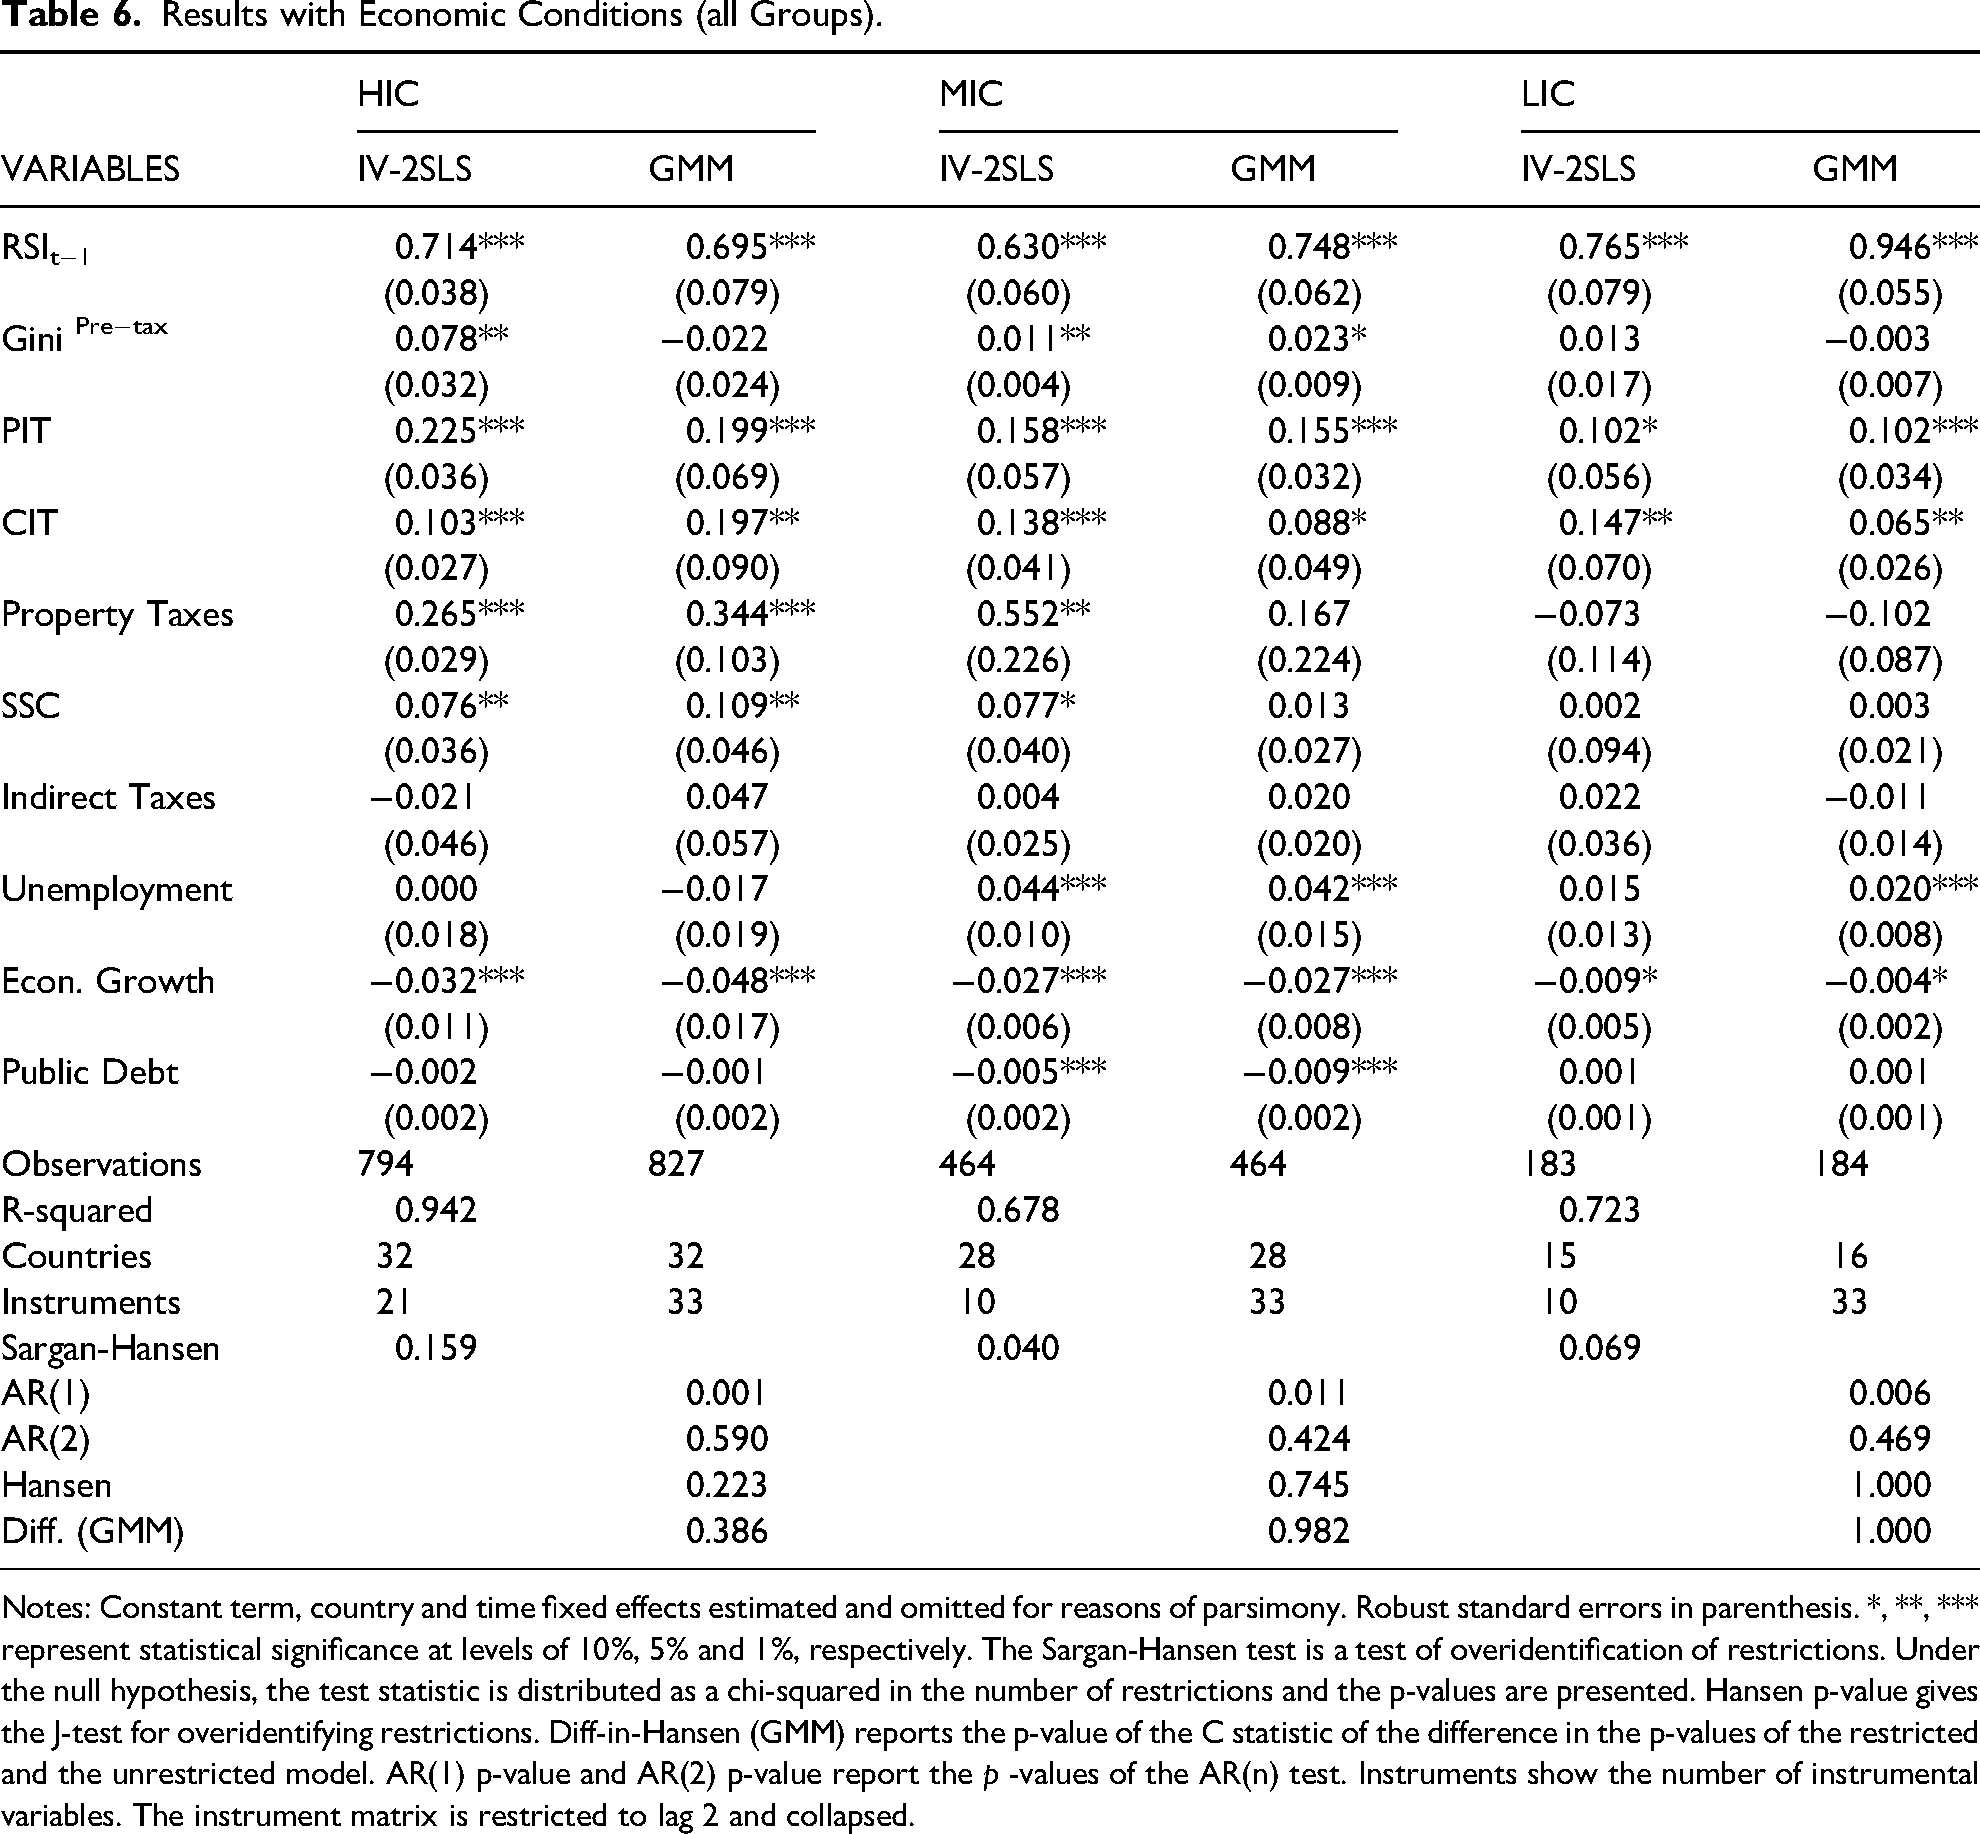
Economic Conditions
This section explores the influence of macroeconomic conditions on redistributive outcomes, focusing on unemployment rates, economic growth, and public debt levels. The corresponding results are presented in Table 6.
Results with Economic Conditions (all Groups).
Notes: Constant term, country and time fixed effects estimated and omitted for reasons of parsimony. Robust standard errors in parenthesis. *, **, *** represent statistical significance at levels of 10%, 5% and 1%, respectively. The Sargan-Hansen test is a test of overidentification of restrictions. Under the null hypothesis, the test statistic is distributed as a chi-squared in the number of restrictions and the p-values are presented. Hansen p-value gives the J-test for overidentifying restrictions. Diff-in-Hansen (GMM) reports the p-value of the C statistic of the difference in the p-values of the restricted and the unrestricted model. AR(1) p-value and AR(2) p-value report the p -values of the AR(n) test. Instruments show the number of instrumental variables. The instrument matrix is restricted to lag 2 and collapsed.
Consistent with previous findings, the positive association between pre-tax inequality and redistribution remains evident in both HICs and MICs, providing continued support for the Meltzer and Richard (1981) hypothesis. The effects of tax instruments also follow similar patterns: direct taxation continues to exhibit strong redistributive effects in HICs, while PIT remains the most robust instrument in MICs. SSCs also maintain their positive impact in both groups. Notably, in LICs, PIT now emerges as a statistically significant redistributive tool, alongside CIT revenues, suggesting a broader role for direct taxation in these economies than previously observed.
Regarding macroeconomic variables, unemployment rates show a positive association with redistribution in MICs and LICs. While this may appear counterintuitive, it likely reflects the role of automatic stabilizers such as unemployment benefits and social transfers, which tend to increase during periods of labor market distress, thereby contributing to income redistribution. The results further reveal that economic growth is significantly associated with reductions in RSI across all country groups. This finding reinforces the notion of a potential trade-off between economic growth and inequality reduction (Muinelo-Gallo and Roca-Sagalés 2012). The magnitude and direction of this effect, however, may depend on the underlying drivers of growth—whether capital- or labour-intensive—as well as the level of economic development and structural complexity of the economy.
Public debt, on the other hand, appears to negatively affect redistribution only in MICs, as these countries may be more vulnerable to fiscal pressures arising from elevated debt levels. Although public borrowing can stimulate economic activity and formal employment, an increase in public debt without the corresponding improvements in macroeconomic fundamentals and fiscal conditions may lead to unsustainable fiscal trajectories. This, in turn, can generate political and economic instability, ultimately constraining the capacity for effective redistribution.
Robustness and Sensitivity
To further validate the empirical findings and assess the stability of the results, a series of robustness checks and sensitivity analyses are conducted. These exercises aim to reinforce the reliability of the estimated relationships and explore alternative specifications.
The robustness analysis begins by addressing the potential influence of outlier observations. This is done by using the Robust Least Squares (RLS) estimator, which performs a series of iterations processes to eliminate gross outliers prior to estimating regression coefficients. In a second exercise, the relative-RSI is employed as the dependent variable to test the consistency of results under an alternative redistribution metric. Thirdly, the SWIID database is utilized to cross-validate findings and assess results with an alternative data source.
The sensitivity analysis includes several additional specifications. Long-run effects are examined through the estimation of a Dynamic Fixed Effects (DFE) model and by using five-year averages of the data. The role of pre-tax inequality is further explored by stratifying regressions according to the quartiles of the Gini index. Finally, the role of tax efforts and tax progressivity is assessed through the construction of two composite indicators, one reflecting statutory progressive features and one indicating structural progressive magnitudes.
Outliers
Outlier observations can compromise the accuracy and reliability of regression results by inflating residual variance, reducing statistical significance, and distorting inference. To address this issue, we follow the approach proposed by Li (1985) and apply the Robust Least Squares (RLS) estimator. This method begins with an initial screening based on Cook's distance and subsequently performs Huber and biweight iterations to eliminate gross outliers. The results of this robustness check are presented in Table A3 in the Appendix.
The findings indicate that the majority of baseline results remain statistically significant and robust. In particular, personal income tax (PIT), corporate income tax (CIT), and property taxes, continue to emerge as the most effective instruments for redistribution in high- and middle-income countries. These are followed by social security contributions (SSC), which also maintain their positive impact. In low-income countries, redistribution appears to be primarily driven by corporate taxation, although PIT also shows potential redistributive effects. These results reinforce the baseline findings and underscore the relative redistributive capacity of each tax instrument across country groups.
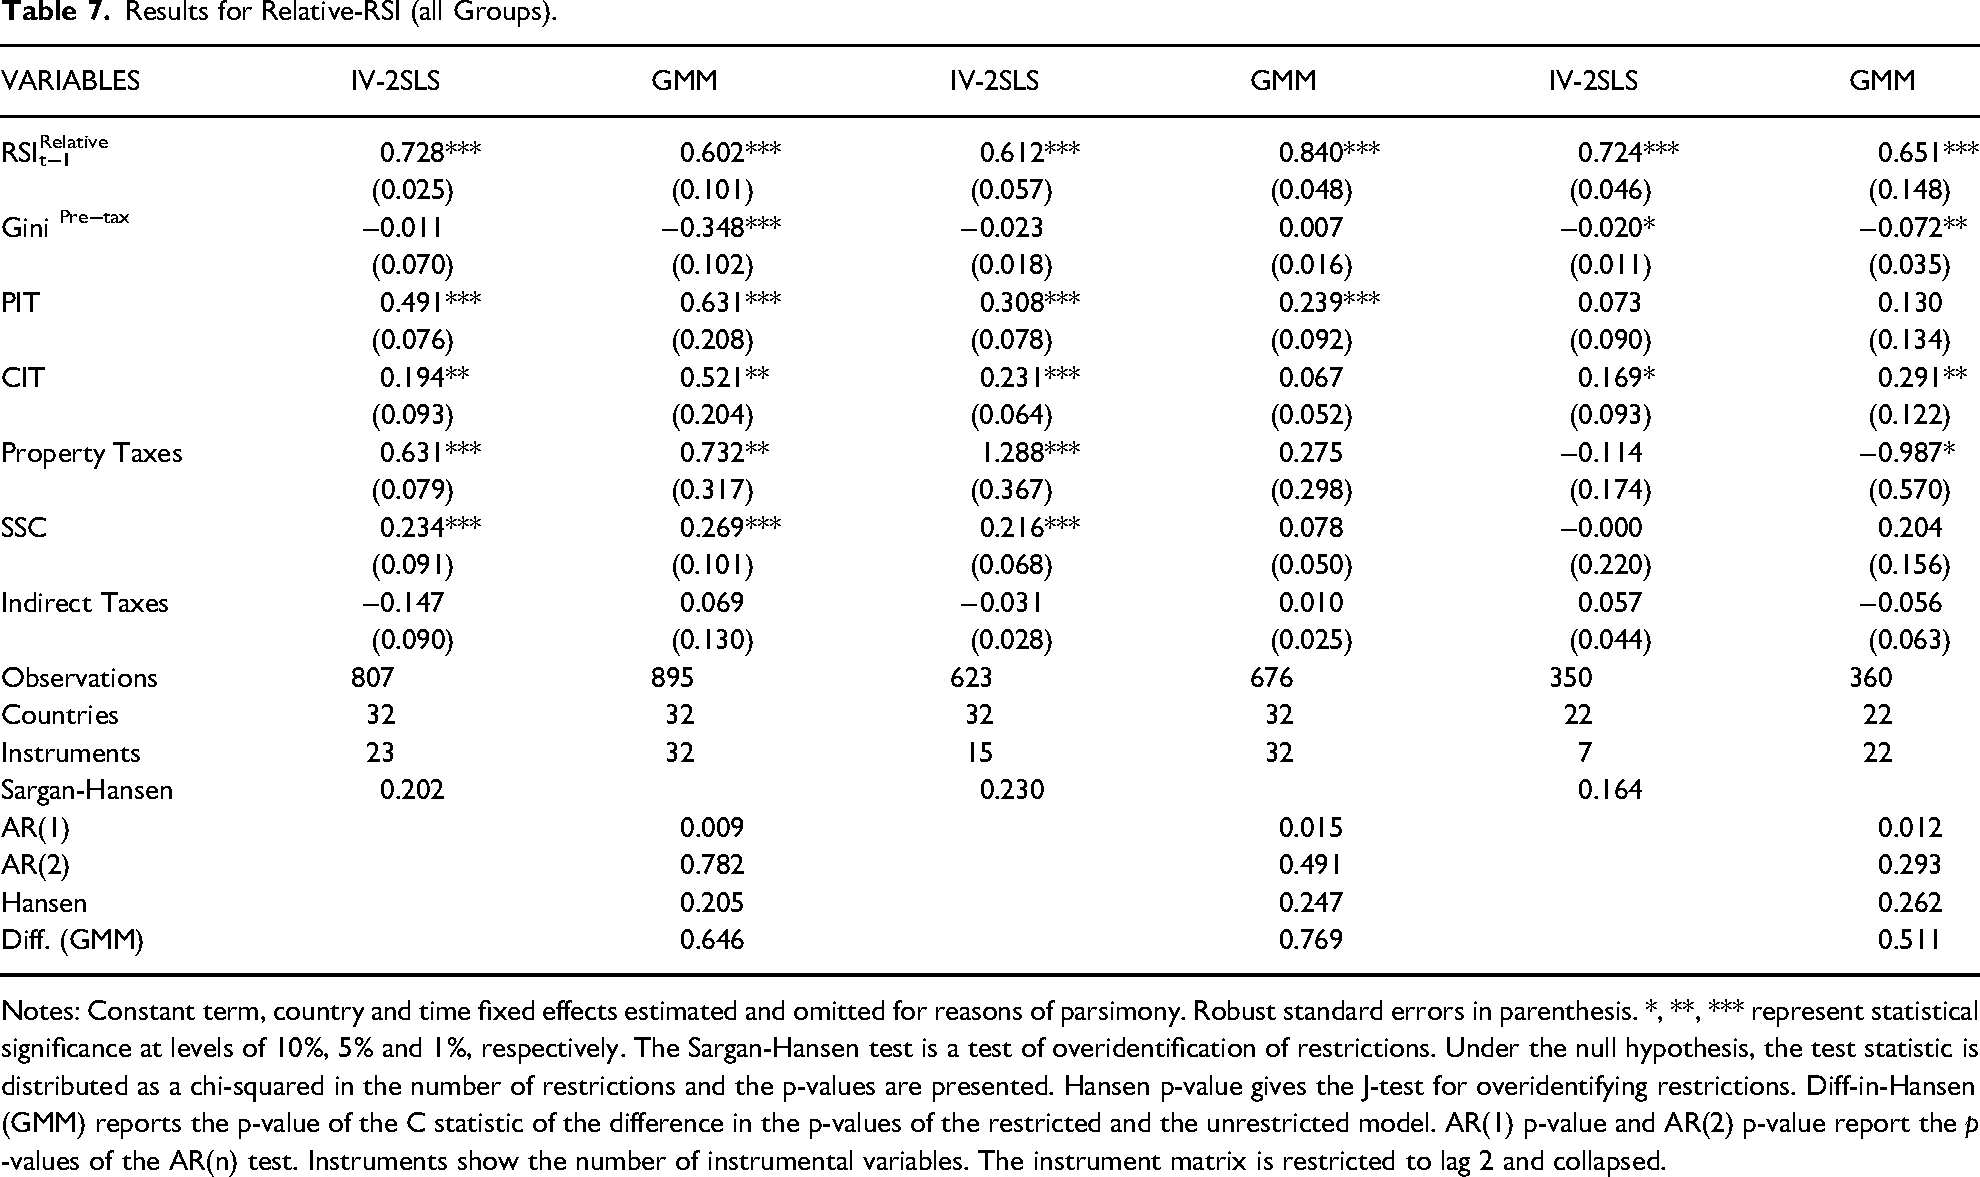
Relative Redistribution
As discussed in Section 3.1, income redistribution can be assessed using either an absolute or relative approach. In the relative framework, the Reynolds-Smolenski Index (RSI) is expressed in percentage terms, capturing the proportional reduction in the Gini coefficient resulting from taxes and transfers. To evaluate the robustness of the baseline results under this alternative specification, regressions are re-estimated using the relative RSI as the dependent variable. The corresponding results are presented in Table 7.
Results for Relative-RSI (all Groups).
Notes: Constant term, country and time fixed effects estimated and omitted for reasons of parsimony. Robust standard errors in parenthesis. *, **, *** represent statistical significance at levels of 10%, 5% and 1%, respectively. The Sargan-Hansen test is a test of overidentification of restrictions. Under the null hypothesis, the test statistic is distributed as a chi-squared in the number of restrictions and the p-values are presented. Hansen p-value gives the J-test for overidentifying restrictions. Diff-in-Hansen (GMM) reports the p-value of the C statistic of the difference in the p-values of the restricted and the unrestricted model. AR(1) p-value and AR(2) p-value report the p -values of the AR(n) test. Instruments show the number of instrumental variables. The instrument matrix is restricted to lag 2 and collapsed.
The use of the relative Reynolds-Smolenski Index (RSI) introduces notable differences in the observation of redistributive effects. One key divergence is observed in the case of pre-tax Gini coefficients for high-income countries (HICs), where the estimated effects become negative. This suggests that the Meltzer and Richard (1981) hypothesis may not hold under a relative redistribution framework, indicating that redistribution tends to decline as inherent inequality increases when measured in proportional terms (see Gründler and Köllner 2017).
Despite this shift, the redistributive impact of direct taxation remains robust in HICs. In middle-income countries (MICs), personal income tax (PIT) continues to be the most significant and consistent determinant of redistribution, although property taxes and social security contributions (SSC) also exhibit positive effects. In low-income countries (LICs), corporate income tax (CIT) remains the most influential redistributive instrument. However, higher levels of pre-tax inequality in LICs appear to hinder redistributive efforts, further emphasizing the structural constraints faced by these economies.
Database
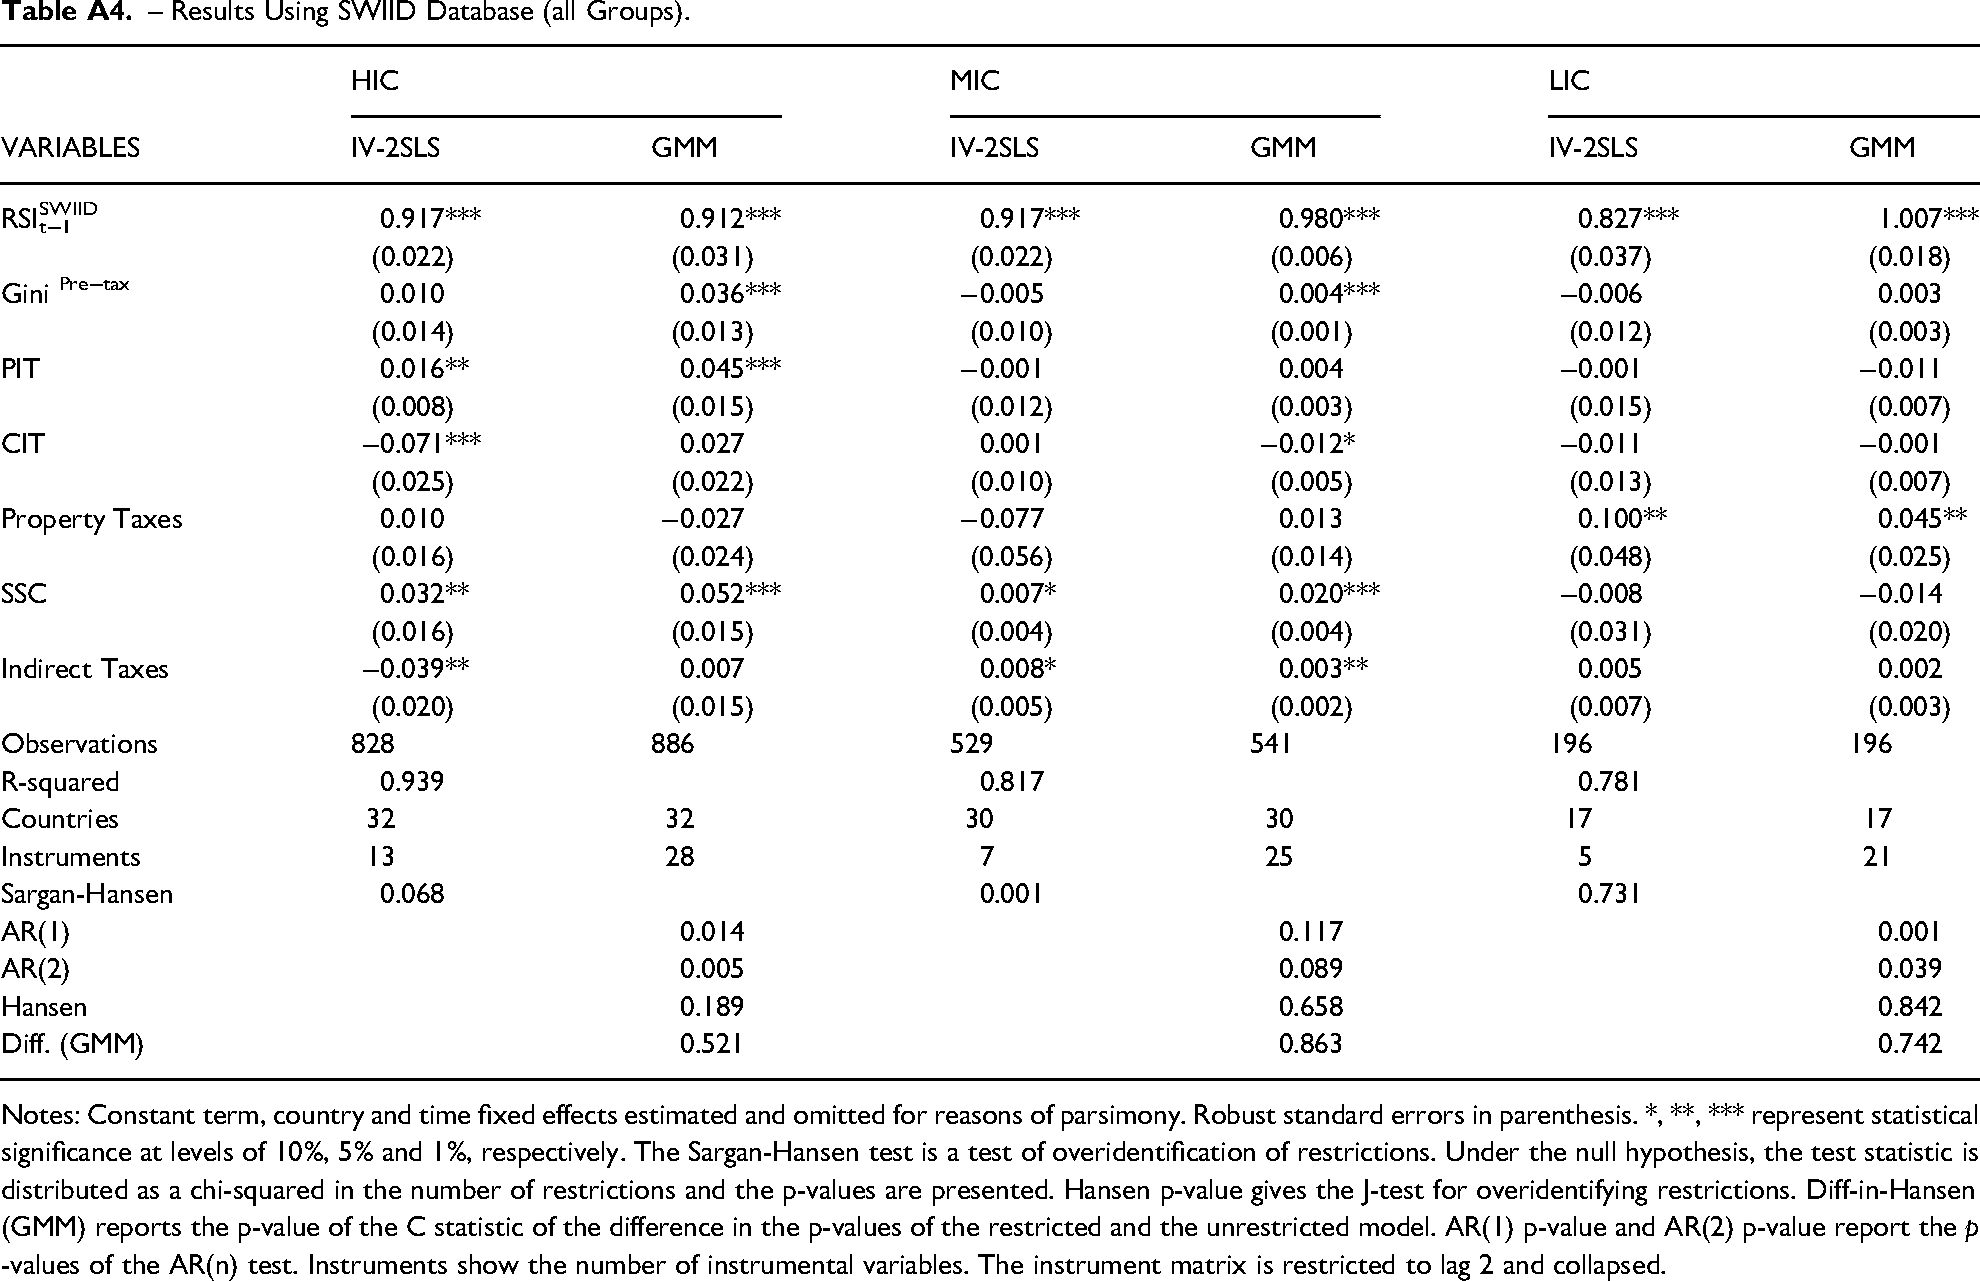
Given the methodological challenges inherent to cross-country inequality analysis, this study examines the robustness of results using alternative data sources to the World Inequality Database (WID). Two widely used datasets offering extensive global coverage over time are the World Income Inequality Database (WIID), maintained by UNU-WIDER, and the Standardized World Income Inequality Database (SWIID), developed by Solt (2020). 7 As discussed in Section 3.4, the WID has emerged more recently as a key initiative of the World Inequality Lab, also providing comprehensive and reliable distributional data for comparative analysis.
A longstanding debate persists regarding the relative suitability of the WIID and SWIID for cross-country inequality research. While early versions of SWIID were derived entirely from WIID, later iterations incorporate data from additional sources. Nonetheless, concerns remain regarding the multiple imputation techniques employed in SWIID's construction (Jenkins 2015). For this reason, WID was selected as the primary data source for baseline estimations, given its advantages in coverage, comparability and reliability.
To assess consistency across datasets, Figure 3 in the Appendix plots inequality data from both WID and SWIID, along with 95% confidence intervals. Although a significant positive correlation is observed, notable discrepancies exist across all income groups, indicating moderate consistency across sources. To further evaluate robustness, regressions are re-estimated using the SWIID as an alternative data source.
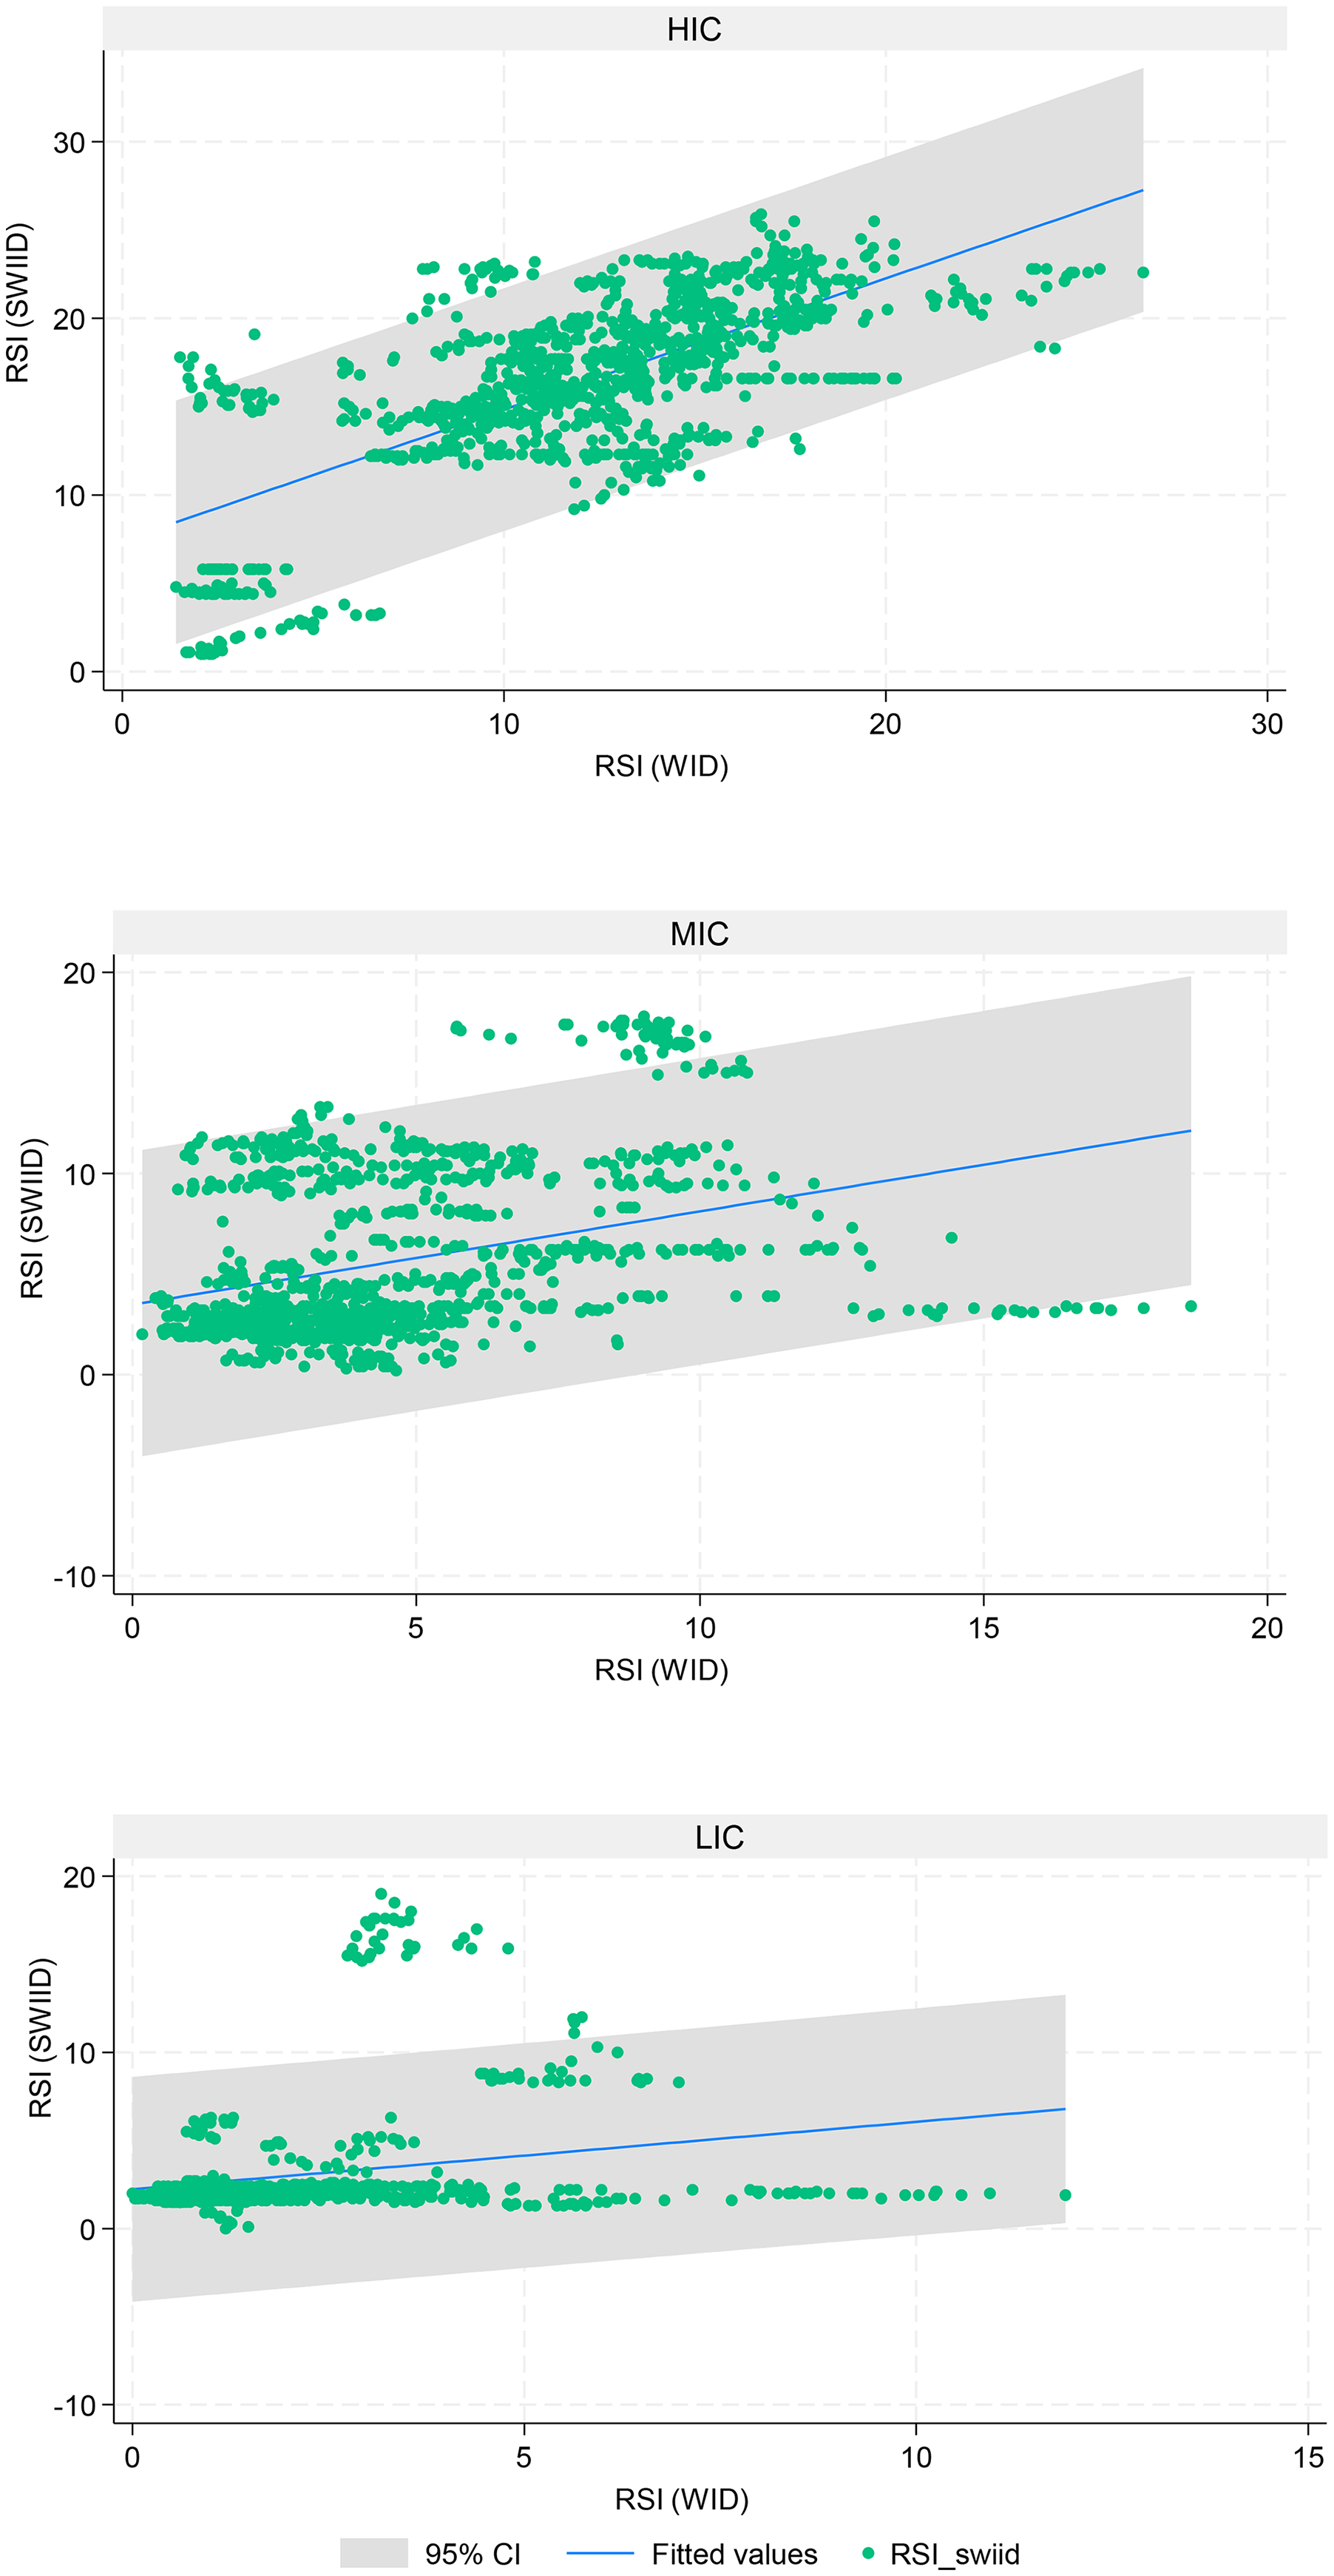
SWIID and WID Comparison. Notes: Data comes from the Standardized World Income Inequality Database (SWIID) and World Inequality Database (WID). The gray-shaded area marks the 95% Confidence Interval.
The results, presented in Table A4 in the Appendix, reveal some variation in coefficient magnitudes. However, the core findings remain intact: direct taxation continues to be a key determinant of redistribution in higher-income countries, while SSCs retain their significance in middle-income economies. These effects, though somewhat attenuated, reinforce the central role of these instruments in shaping redistributive outcomes and signal relevant differences between databases.
Long Run
To assess the long-run relationship between tax structure and redistribution, recognizing that fiscal mechanisms may exert delayed impacts on inequality, this analysis decomposes long term tax effects using a Dynamic Fixed Effects (DFE) model, following Pesaran, Shin, and Smith (1999), and by applying five-year moving averages of observations (Isiaka, Mihailov, and Razzu 2024). The results are presented in Tables 8 and 9, respectively.
Long-run Regression Results (Dynamic Fixed Effects – DFE).
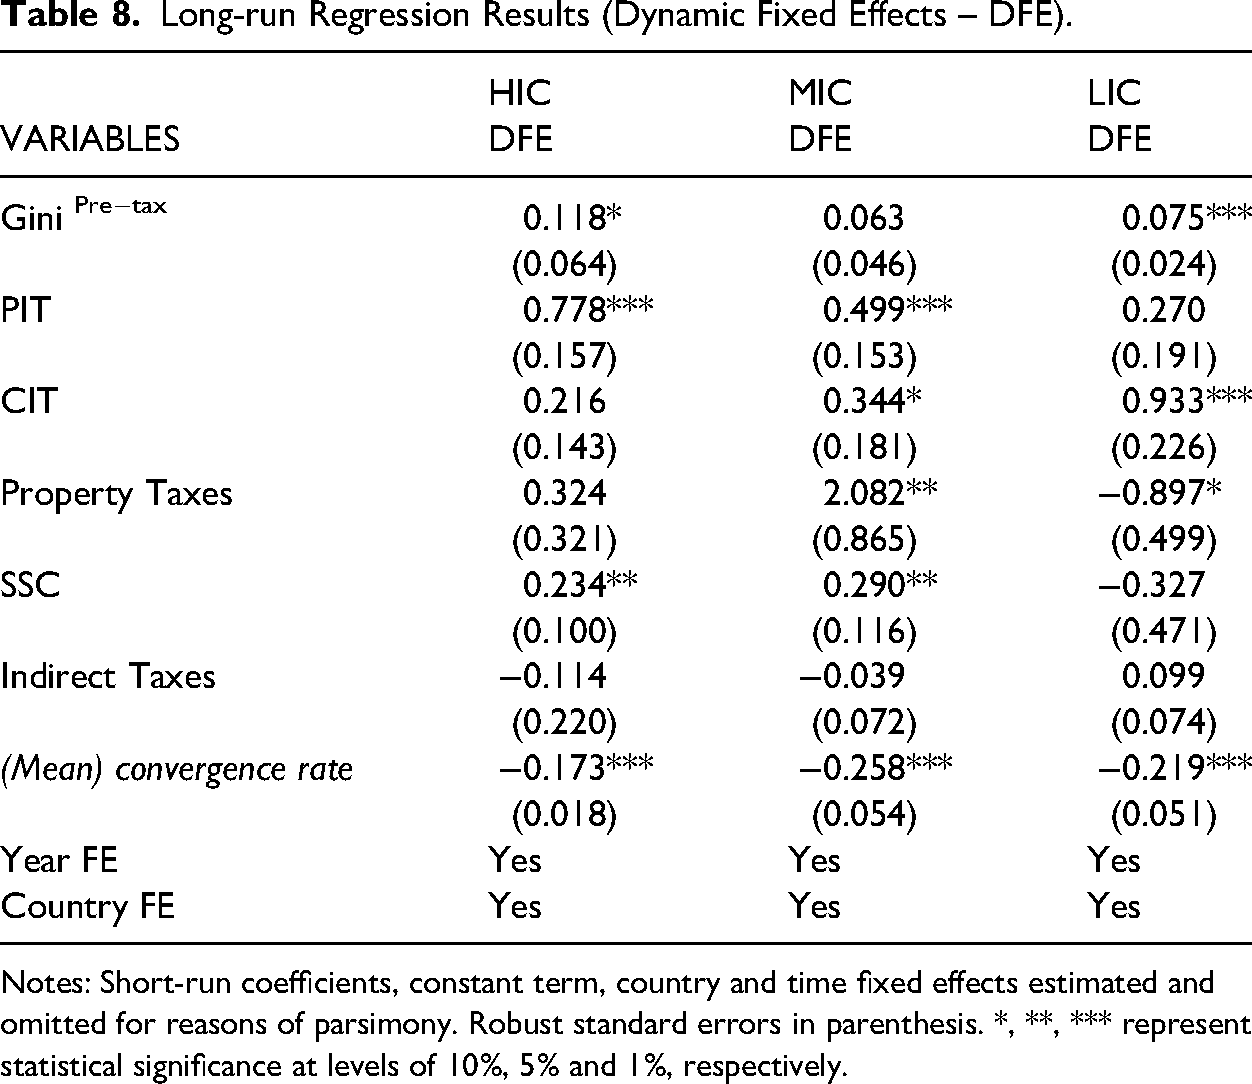
Notes: Short-run coefficients, constant term, country and time fixed effects estimated and omitted for reasons of parsimony. Robust standard errors in parenthesis. *, **, *** represent statistical significance at levels of 10%, 5% and 1%, respectively.
Long-run Regression Results (5-Year Moving Averages).
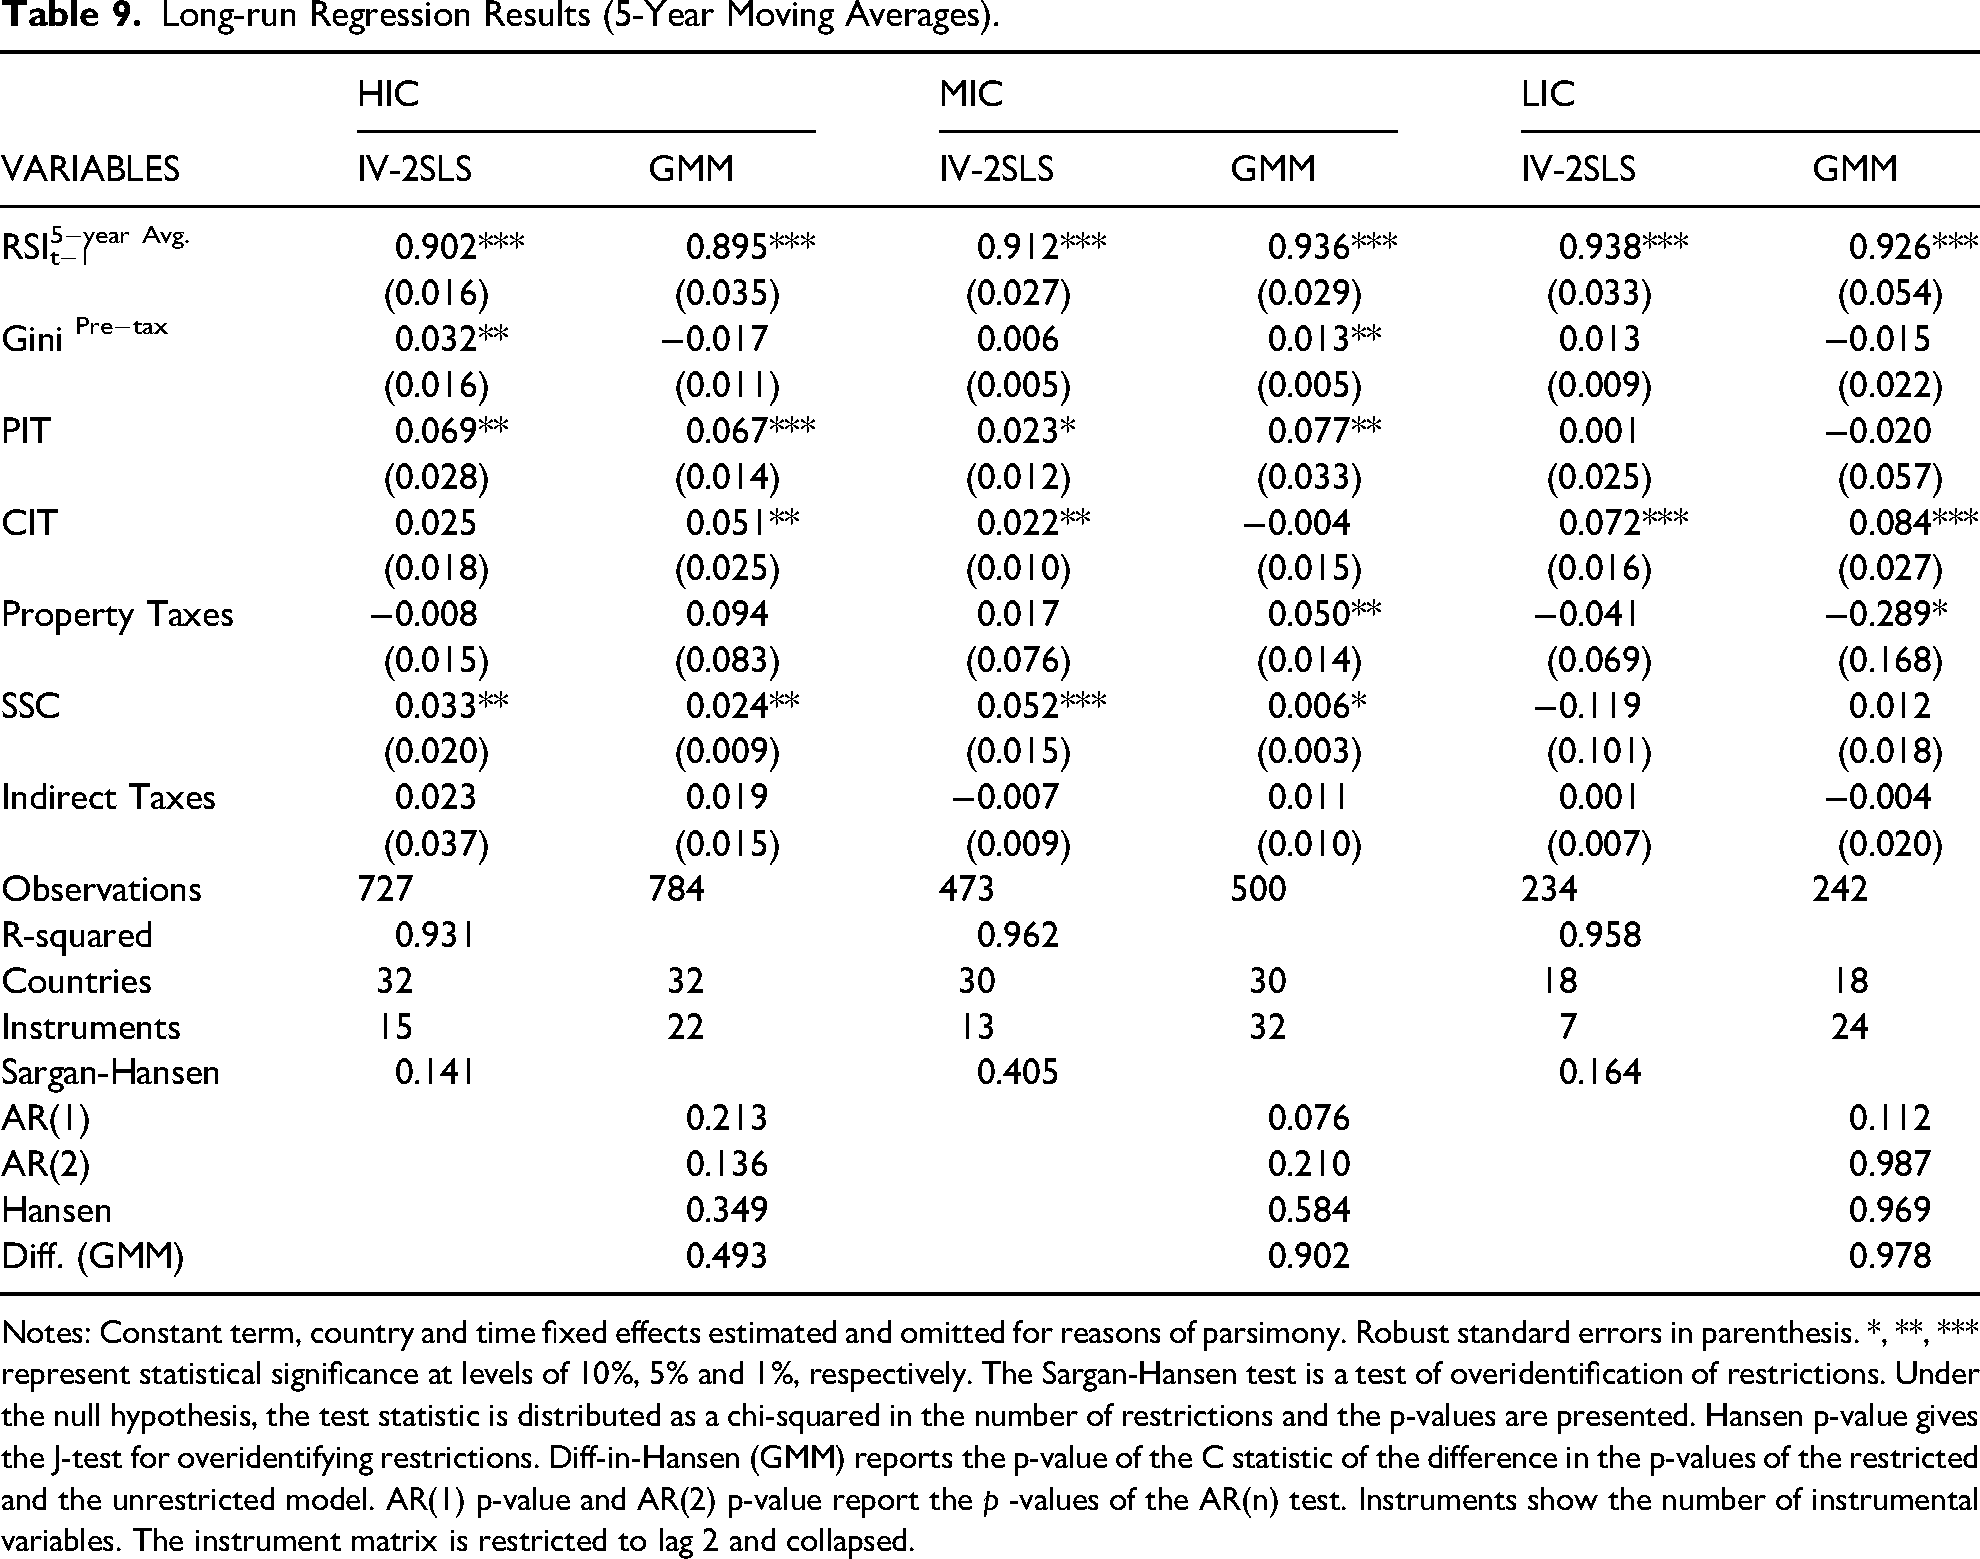
Notes: Constant term, country and time fixed effects estimated and omitted for reasons of parsimony. Robust standard errors in parenthesis. *, **, *** represent statistical significance at levels of 10%, 5% and 1%, respectively. The Sargan-Hansen test is a test of overidentification of restrictions. Under the null hypothesis, the test statistic is distributed as a chi-squared in the number of restrictions and the p-values are presented. Hansen p-value gives the J-test for overidentifying restrictions. Diff-in-Hansen (GMM) reports the p-value of the C statistic of the difference in the p-values of the restricted and the unrestricted model. AR(1) p-value and AR(2) p-value report the p -values of the AR(n) test. Instruments show the number of instrumental variables. The instrument matrix is restricted to lag 2 and collapsed.
For high-income countries (HICs), the most notable change is the loss of statistical significance for property taxes and corporate income taxes (CIT), suggesting that their redistributive effects may diminish over time. This could reflect potential adverse impacts on economic activity, such as reduced investment, employment, and corporate growth. In contrast, the long-run effects of personal income taxes (PIT) and social security contributions (SSC) are amplified, underscoring their role as the primary fiscal instruments for sustained redistribution in HICs.
In middle-income countries (MICs), the redistributive effects of SSCs and direct taxation are reinforced, particularly for property taxes. These findings suggest that taxes targeting wealth accumulation and the effective enforcement of social contributions not only support short-term redistribution but also play a critical role in promoting equity over longer time horizons.
In contrast to the patterns observed in higher-income groups, results for low-income countries (LICs) reveal limited long-run redistributive effects beyond corporate income taxes (CIT), which remain the most significant instrument. Most other tax variables do not exhibit statistical significance, suggesting substantial structural and institutional barriers to perform sustained redistribution in these economies. While some support for the Meltzer and Richard (1981) hypothesis is observed in the long run, the overall redistributive capacity remains constrained.
These findings reinforce the importance of income and wealth taxes, as well as social security systems, in shaping long-term redistributive outcomes. Their continued significance across longer time horizons highlights not only their effectiveness in achieving short-term redistribution but also their capacity to sustain redistributive processes over time. This further validates the baseline results and underscores the critical role of tax structure composition in supporting lasting equitable fiscal policy.
Quartile Regression
To assess the sensitivity of tax effects under varying levels of pre-fiscal inequality, this section evaluates redistributive outcomes across quartiles of the pre-tax Gini coefficient for all country groups. This approach allows for a more nuanced understanding of how fiscal instruments perform under different inequality contexts (see Isiaka, Mihailov, and Razzu 2024). The results are presented in Table 10.
– Results According to pre-tax Gini Quartiles (all Groups).
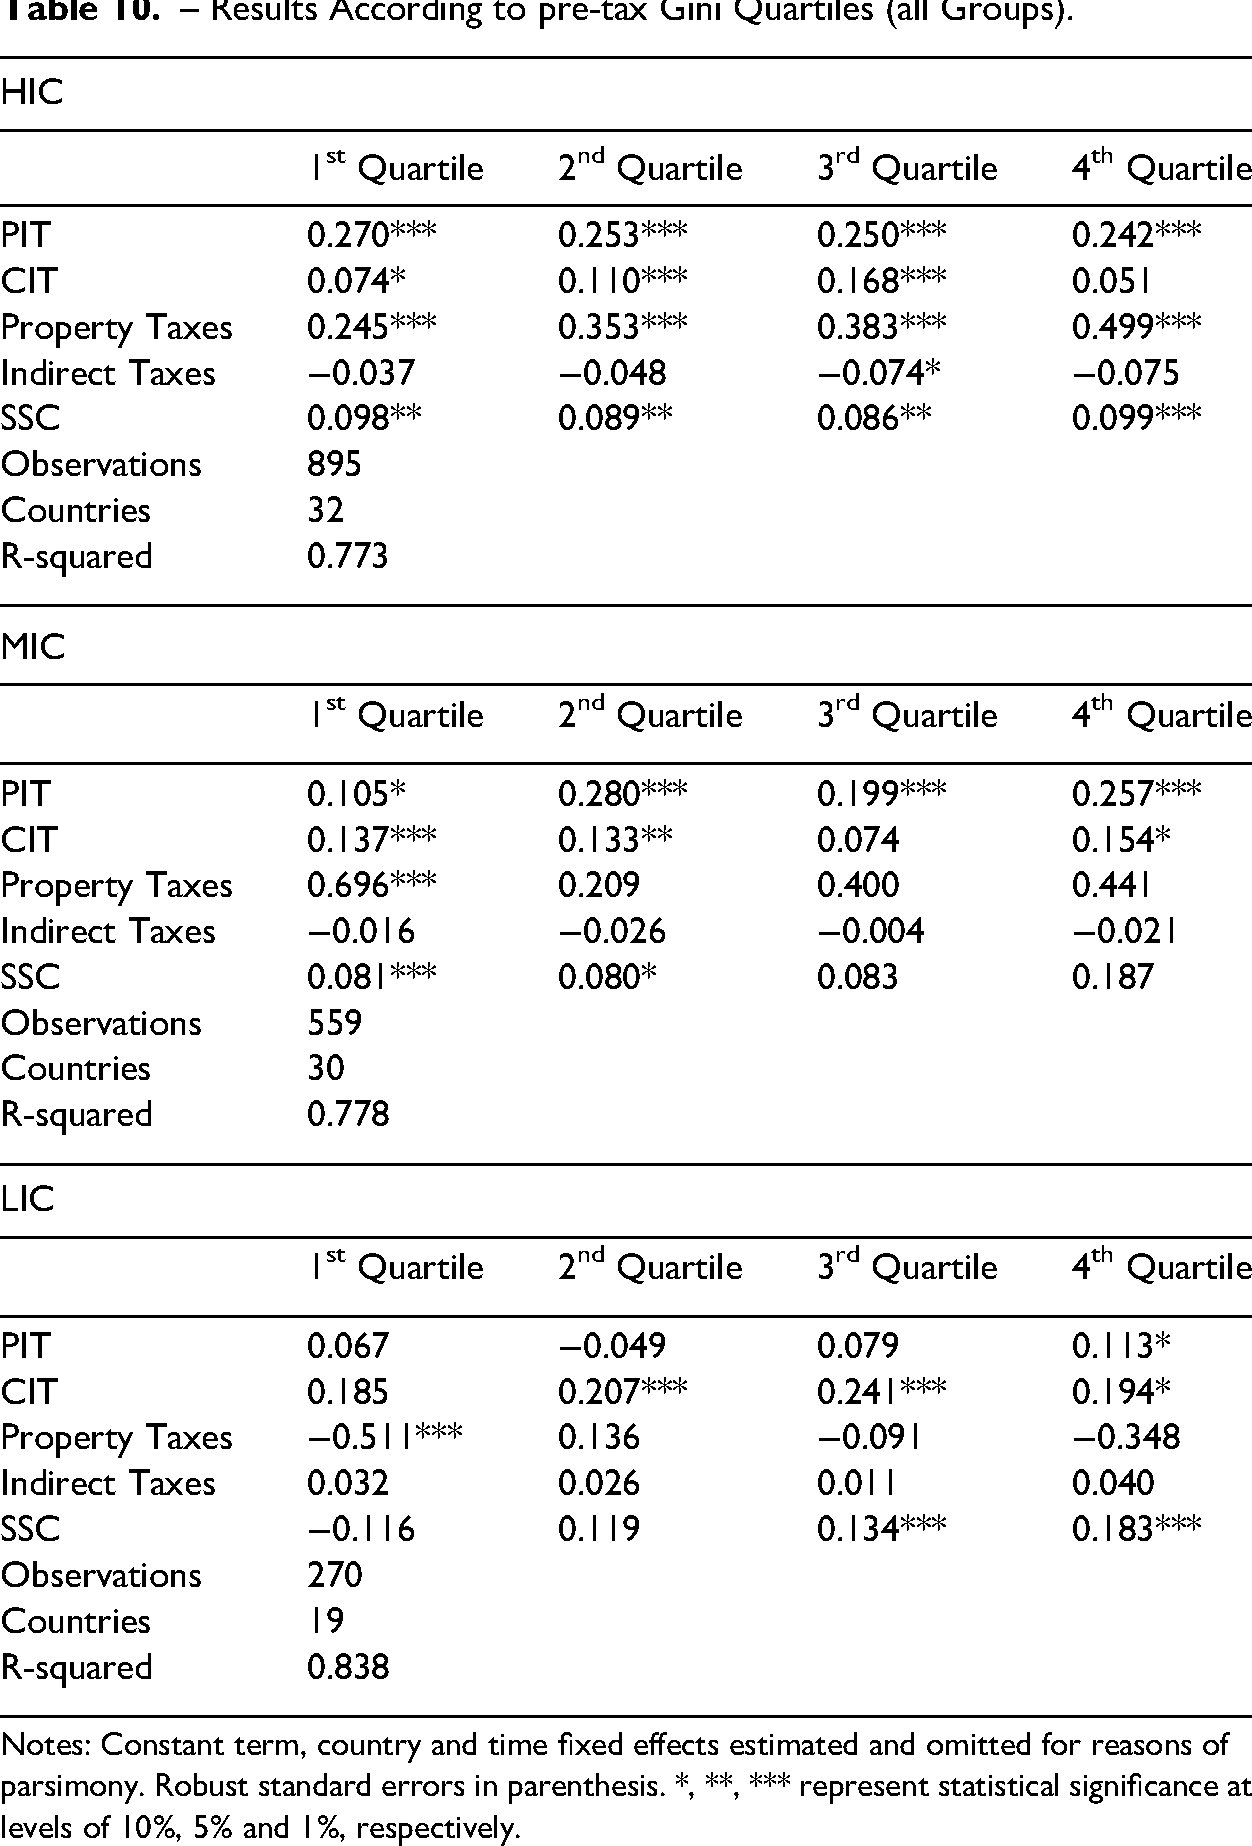
Notes: Constant term, country and time fixed effects estimated and omitted for reasons of parsimony. Robust standard errors in parenthesis. *, **, *** represent statistical significance at levels of 10%, 5% and 1%, respectively.
In high-income countries (HICs), the redistributive impact of personal income taxes (PIT) appears to decline with increasing inequality, suggesting challenges in implementing progressive taxation in more unequal contexts. Conversely, the effects of corporate income taxes (CIT) and property taxes strengthen in higher inequality quartiles, reaffirming their redistributive potential. These results may reflect the conditional nature of their economic impacts — particularly on investment and capital accumulation — depending on the level of inequality. Indirect taxation, however, continues to show weak significance, while social security contributions (SSC) exhibit relatively balanced effects across quartiles.
For middle-income countries (MICs), PIT demonstrates a relatively stable redistributive effect across the upper three quartiles of inequality, while CIT and property taxes seem more influential in countries with lower pre-tax inequality. Indirect taxes do not show significant effects in any quartile, while SSCs display increasing redistributive potential with rising inequality, although coefficients are not statistically significant in the highest quartiles. This pattern may highlight the relevance of life-cycle mechanisms in redistribution, particularly in more unequal societies.
In low-income countries (LICs), PIT and property taxes continue to show limited redistributive impact. CIT remains the most effective instrument across all quartiles, reinforcing its central role in fiscal redistribution in these economies. SSCs exhibit stronger effects in the higher inequality quartiles, suggesting their importance as a redistributive tool even in contexts characterized by poverty and structural inequality. Indirect taxes, however, do not yield significant redistributive outcomes.
Tax Effort and Progressivity
Finally, this section examines the influence of tax efforts and progressivity levels on income redistribution. Data for both indicators are sourced from the Collecting Taxes Database, maintained by the United States Agency for International Development (USAID).
Tax effort is defined as the ratio of actual tax revenues collected to the estimated maximum tax capacity, expressed as a percentage of GDP. It reflects the extent to which a country utilizes its potential for revenue mobilization.
Tax progressivity, by contrast, is a more complex and debated concept, typically measured through the progression of tax rates across income levels or the share of revenues derived from taxes designed to be progressive (Gerber et al. 2020). Due to limitations in cross-country data availability — particularly for middle- and low-income countries — two composite indicators are constructed: 1) Statutory Progressivity: based on the highest marginal personal income tax rate and the corporate income tax rate; 2) Structural Progressivity: following Thomas (2023), based on: i) the ratio of direct to indirect tax revenues, ii) the share of PIT and CIT in total tax revenues, and iii) the ratio of PIT and CIT revenues to GDP. 8
The results, presented in Table 11, indicate that structural progressivity has statistically significant redistributive effects across all country groups. This suggests that the relative size and composition of direct taxation are key determinants of redistribution. Enhancing the share of progressive direct taxes in total revenues could therefore strengthen redistributive outcomes (Martínez-Vazquez, Violeta, and Moreno-Dodson 2012; Sarralde, Garcimartín, and Ruiz-Huerta 2013).
– Progressivity and tax Effort.
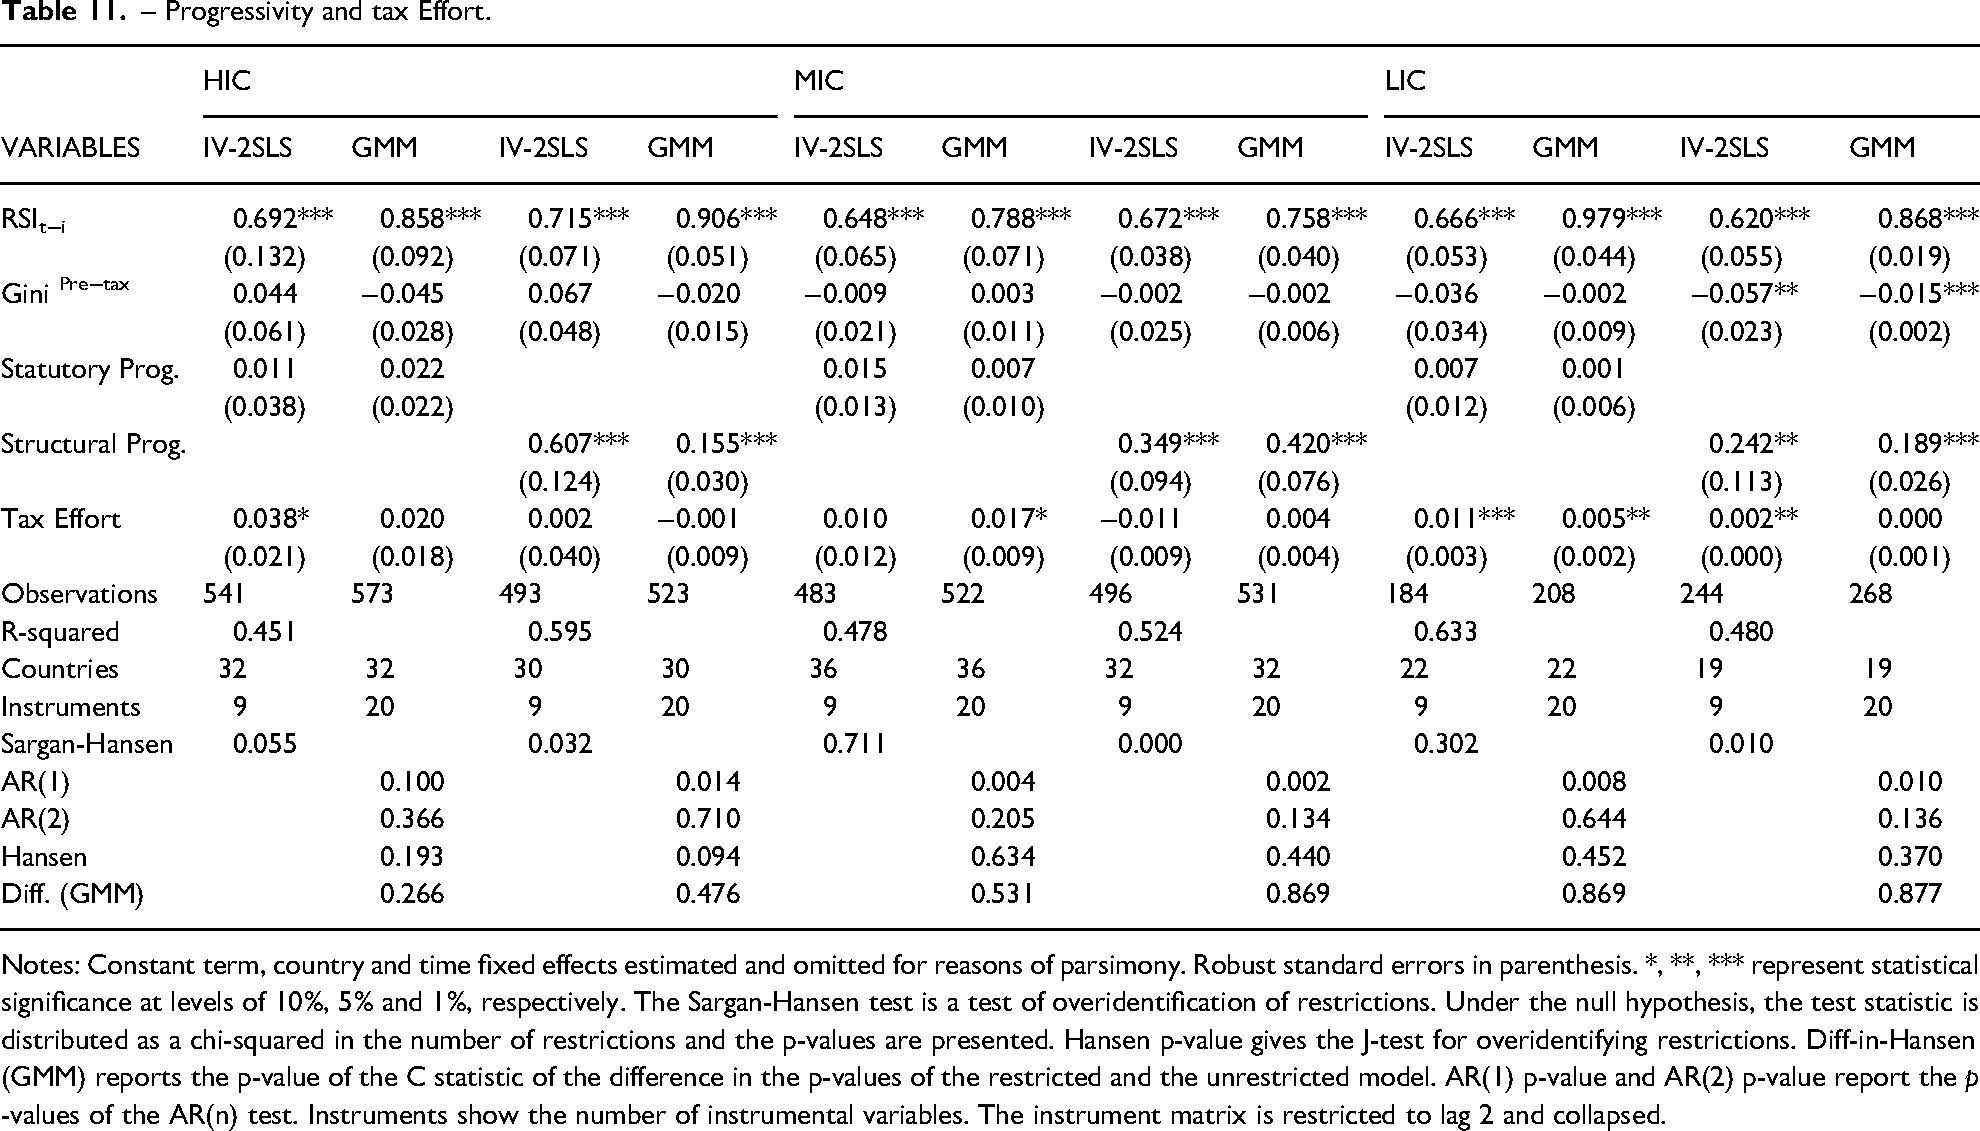
Notes: Constant term, country and time fixed effects estimated and omitted for reasons of parsimony. Robust standard errors in parenthesis. *, **, *** represent statistical significance at levels of 10%, 5% and 1%, respectively. The Sargan-Hansen test is a test of overidentification of restrictions. Under the null hypothesis, the test statistic is distributed as a chi-squared in the number of restrictions and the p-values are presented. Hansen p-value gives the J-test for overidentifying restrictions. Diff-in-Hansen (GMM) reports the p-value of the C statistic of the difference in the p-values of the restricted and the unrestricted model. AR(1) p-value and AR(2) p-value report the p -values of the AR(n) test. Instruments show the number of instrumental variables. The instrument matrix is restricted to lag 2 and collapsed.
While statutory progressivity measures also show positive effects, these are not statistically significant. This implies that legal tax rate structures alone may be insufficient to drive redistribution unless supported by effective enforcement and broader fiscal architecture. Strengthening regulatory frameworks and clarifying legal definitions of tax brackets and rates may help reinforce the redistributive impact of structural progressivity.
Finally, tax efforts seem to significantly improve redistribution in all three country groups, with particularly robust effects in low-income countries. This underscores the importance of revenue mobilization and reduced tax evasion in enhancing the fiscal capacity to support redistributive policies.
Conclusions
This study investigates the impacts of the tax structure composition on income redistribution across 107 countries with varying income and inequality levels from 1990 to 2020. A range of estimation techniques and robustness checks were employed to ensure the reliability of results.
The findings reveal strong temporal persistence in redistribution and relative support for the Meltzer and Richard (1981) median voter hypothesis in high- and middle-income countries, particularly when redistribution is measured in absolute terms. In contrast, relative redistribution measures appears negatively associated with pre-tax inequality.
Macroeconomic variables such as economic growth and the size of the informal economy are negatively correlated with redistribution, suggesting that growth effects depend on labor market dynamics, while informality largely undermines fiscal capacity. Economic development is a significant driver of redistribution only in middle-income countries, while unemployment positively affects redistribution in middle- and low-income countries, likely due to the role of social transfers. Public debt levels constrain redistributive capacity in middle-income economies, and demographic pressures from aging populations hinder redistribution mainly in low-income economies.
The composition of the tax system plays a central role in shaping redistributive outcomes. In high-income countries (HICs), direct taxes — personal income tax (PIT), corporate income tax (CIT), and property taxes — exhibit strong redistributive effects. Indirect taxation shows negative but statistically insignificant effects. In the long run, PIT and social security contributions (SSC) maintain their redistributive power, while CIT and property taxes lose significance, possibly due to adverse effects on labor markets and investment incentives.
In middle-income countries (MICs), PIT emerges as the most robust redistributive instrument, followed by SSC. CIT and property taxes also gain importance over longer time horizons, reinforcing their sustained impacts over time. In low-income countries (LICs), redistribution is primarily driven by CIT and, to a lesser extent, indirect taxes, which represent the main revenue source. SSCs do not show significant effects, likely reflecting underdeveloped social protection systems in these countries.
Structural progressivity — broadly measured by the share of progressive taxes — significantly enhances redistribution across all country groups. Statutory progressivity, however, does not yield significant effects, possibly suggesting that legal tax rate structures alone may not be sufficient to explain redistributive outcomes. Tax effort, defined as revenue collection relative to tax capacity, positively influences redistribution, especially in low-income countries, where improved collection can help to finance redistributive policies and reduce evasion.
Based on the findings, high-income countries should prioritize the enhancement of PIT and SSC, while maintaining attention to CIT and property taxes in the short term. Middle-income countries are advised to broaden PIT and SSC coverage and enforcement, as well as strengthening corporate and property taxation to support long-term redistribution. Low-income countries should focus on CIT as a primary redistributive tool, while gradually formalizing PIT and SSC systems. Across all income groups, enhancing tax efforts and tailoring tax policies to inequality levels are essential, while overreliance on indirect taxes should be avoided due to their limited redistributive impact and regressive nature.
This study faces certain limitations, including potential reranking effects when transitioning from pre-tax to post-tax inequality measures and possible nonlinearities in tax coefficients. Future research should address these issues, refine methods for measuring progressivity, and expand cross-country databases to better capture statutory tax structures.
Footnotes
Acknowledgements
Not applicable.
Availability of Data and Materials
The datasets used during the current study are available from the corresponding author upon reasonable request.
Declaration of Conflicting Interests
The author declared no potential conflicts of interest with respect to the research, authorship, and/or publication of this article.
Funding
This work was supported by the FCT (Fundação para a Ciência e a Tecnologia) [grant number UI/BD/152307/2021]. The opinions expressed herein are those of the author and do not necessarily reflect those of the authors’ employers. Any remaining errors are the author's sole responsibility.
Notes
Author Biography
Appendix
– Results Using SWIID Database (all Groups).
| HIC | MIC | LIC | ||||
|---|---|---|---|---|---|---|
| VARIABLES | IV-2SLS | GMM | IV-2SLS | GMM | IV-2SLS | GMM |
| RSIt−1SWIID | 0.917*** | 0.912*** | 0.917*** | 0.980*** | 0.827*** | 1.007*** |
| (0.022) | (0.031) | (0.022) | (0.006) | (0.037) | (0.018) | |
| Gini Pre−tax | 0.010 | 0.036*** | −0.005 | 0.004*** | −0.006 | 0.003 |
| (0.014) | (0.013) | (0.010) | (0.001) | (0.012) | (0.003) | |
| PIT | 0.016** | 0.045*** | −0.001 | 0.004 | −0.001 | −0.011 |
| (0.008) | (0.015) | (0.012) | (0.003) | (0.015) | (0.007) | |
| CIT | −0.071*** | 0.027 | 0.001 | −0.012* | −0.011 | −0.001 |
| (0.025) | (0.022) | (0.010) | (0.005) | (0.013) | (0.007) | |
| Property Taxes | 0.010 | −0.027 | −0.077 | 0.013 | 0.100** | 0.045** |
| (0.016) | (0.024) | (0.056) | (0.014) | (0.048) | (0.025) | |
| SSC | 0.032** | 0.052*** | 0.007* | 0.020*** | −0.008 | −0.014 |
| (0.016) | (0.015) | (0.004) | (0.004) | (0.031) | (0.020) | |
| Indirect Taxes | −0.039** | 0.007 | 0.008* | 0.003** | 0.005 | 0.002 |
| (0.020) | (0.015) | (0.005) | (0.002) | (0.007) | (0.003) | |
| Observations | 828 | 886 | 529 | 541 | 196 | 196 |
| R-squared | 0.939 | 0.817 | 0.781 | |||
| Countries | 32 | 32 | 30 | 30 | 17 | 17 |
| Instruments | 13 | 28 | 7 | 25 | 5 | 21 |
| Sargan-Hansen | 0.068 | 0.001 | 0.731 | |||
| AR(1) | 0.014 | 0.117 | 0.001 | |||
| AR(2) | 0.005 | 0.089 | 0.039 | |||
| Hansen | 0.189 | 0.658 | 0.842 | |||
| Diff. (GMM) | 0.521 | 0.863 | 0.742 | |||
Notes: Constant term, country and time fixed effects estimated and omitted for reasons of parsimony. Robust standard errors in parenthesis. *, **, *** represent statistical significance at levels of 10%, 5% and 1%, respectively. The Sargan-Hansen test is a test of overidentification of restrictions. Under the null hypothesis, the test statistic is distributed as a chi-squared in the number of restrictions and the p-values are presented. Hansen p-value gives the J-test for overidentifying restrictions. Diff-in-Hansen (GMM) reports the p-value of the C statistic of the difference in the p-values of the restricted and the unrestricted model. AR(1) p-value and AR(2) p-value report the p -values of the AR(n) test. Instruments show the number of instrumental variables. The instrument matrix is restricted to lag 2 and collapsed.