
Abstract
Analysis of the international network of double tax treaties reveals a large potential for tax avoidance. Developing countries are, on average, not more likely to suffer from tax revenue losses than other countries. Yet, this average masks the fact that several countries, such as Bangladesh, Egypt, Indonesia, Kenya, Uganda and Zambia, are vulnerable to substantial potential losses of withholding tax revenue by treaty shopping. The analysis combines tax parameters of more than a hundred countries with an algorithm from network theory, which simulates the tax minimizing behaviour of multinational enterprises. We introduce the notion of potentially aggressive tax treaties. These are the key treaties in treaty shopping routes, that may lead to substantial tax revenue losses in developing countries. Moreover, under the rules of the global minimum tax, the treaty partners are often in a prime position to top-up tax undertaxed profits of developing countries that offer tax incentives to attract investment, thus nullifying the incentive effects.
Keywords
Introduction
The international tax system is first and foremost based on the tax legislation of autonomous nations. The interaction between these tax codes has always left room for tax planning by multinational enterprises (MNEs). Differences can be, and have been, exploited to avoid taxation. The mirror image of MNE tax reduction are losses in tax revenue for national governments. Although tax planning may not be illegal, it can be considered undesirable.
In their attempts to attract international capital, national governments may offer opportunities to MNEs to reduce their tax burden – possibly to the detriment of other countries. The Organisation for Economic Co-operation and Development (OECD) addressed harmful tax competition and harmful tax practices in 1998 (OECD 1998). Since then, the opportunities for tax avoidance only seem to have increased with digitalisation of the economy (OECD 2014). It is known that some large players on the world market have extremely low effective tax burdens.
However, budget concerns of national governments provided impetus for international coordination in the wake of the global financial crisis of 2008. The G20/OECD initiative of BEPS (base erosion and profit shifting) constitutes an ongoing agenda for combatting international tax avoidance. One of the actions on this agenda is to combat tax treaty abuse. When two countries conclude a bilateral tax treaty, they allocate taxing rights to prevent double taxation for enterprises engaging in cross-border economic activities. These double tax treaties often entail reciprocal tax reduction. When third parties, not from the two treaty partners, get access to the treaty benefits, such as reduced withholding tax (WHT) rates, this is often called tax treaty abuse. There are about 3,000 of these treaties, and this creates ample opportunity for tax avoidance in the international tax system.
Treaty shopping is a tax avoidance strategy that makes use of reduced tax rates in tax treaties. The budget concerns of national governments, following tax revenue losses from these practices, may be more pressing for developing countries. In this paper we focus on the potential tax revenue losses from treaty shopping for a set of low- and middle-income countries (LMICs), considering the tax system as an international network. We also identify the tax treaties that could be responsible for these revenue losses, and refer to them as potentially aggressive tax treaties.
The G20/OECD BEPS project has also led to a more ambitious plan to combat both international tax competition by jurisdictions and tax avoidance by MNEs. In October 2021, 136 autonomous nations agreed to the GLoBE rules, introducing a global effective minimum corporation tax rate (GMT) of 15%. Also low-income countries compete heavily for inbound FDI, offering investing MNEs tax cuts in many different ways, beyond reduced rates in treaties (see for instance Celani, Dressler and Hanappi 2022). In the final part of this paper we discuss the taxing rights according to the GloBE (Global Anti-Base Erosion) rules in combination with treaty shopping routes and the possible consequences for tax revenues. Tax treaty partners of developing countries could be in a position to (top-up) tax MNEs with undertaxed profits in these developing countries, when the latter do not have the necessary provisions in place.
In the main part of this study we calculate the withholding tax revenue that would be collected by governments in a hypothetical case, where MNEs structure their operations to make full use of treaty shopping opportunities that minimise WHTs. We compare this with the WHT that would be collected if MNEs instead simply invested directly in their operating countries, without using any intermediate jurisdiction. We perform this analysis using a network analysis (Van ‘t Riet and Lejour 2018), applied separately to dividends, interest and royalty flows. From this analysis we can also identify the most important potential conduit countries for these flows, and more specifically the first conduit country on the tax-minimising routes for income flows from each developing country. In this way we can derive to what extent the treaties between the developing country and the first conduit country have the potential to contribute to treaty shopping and the loss of tax revenue.
Our analysis considers potential changes to WHT revenue, but not to corporate income tax (CIT) in the host, or source, country. We therefore ignore the possibility that reduced treaty rates may be instrumental in attracting more foreign direct investment (FDI). Increased inbound FDI might lead to a larger tax base and higher revenue. We cannot take this into account, and this is a limitation of the study. Our estimates of potential tax revenue losses can therefore best be seen as upper bounds.
We have four main findings. First, developing countries are, on average, less affected by treaty shopping in terms of potential loss of tax revenue than other countries. This might be a surprising conclusion, because the literature on international tax avoidance concludes often differently. 1 However, these studies do not focus on treaty shopping. The outcome follows from the fact that, while headline CIT rates tend to be higher in developing countries, WHT rates are already lower in developing countries, implying that the (relative) revenue losses from WHTs would be lower in these countries. The fact that developing countries have, on average, fewer treaties, with fewer large reductions, also contributes to the lower potential for treaty shopping gains. This is the case for all three income flows, but the effects are even more limited for royalties.
This average outcome, however, masks wide differences between countries, which suggests that we have to look more in-depth. Our second finding is that several countries, including Bangladesh, Egypt, Kenya, Indonesia, Uganda and Zambia, are vulnerable to substantial potential loss of WHT revenue from treaty shopping.
Third, this vulnerability follows from very low or negligible tax rates in a small number of specific treaties. We refer to these treaties as being potentially aggressive. Two examples are the Uganda-Netherlands treaty, and the treaty between Bangladesh and the United Arab Emirates. For most of the countries we studied there is one treaty that is the first stop in the tax-minimising routes leaving the country, making it the largest source of a risk of treaty shopping. Many of these potentially aggressive treaties are with familiar conduit jurisdictions, such as the Netherlands, Switzerland, the United Arab Emirates and Singapore. A policy suggestion is to renegotiate these treaties, keeping an eye on other treaties that could be used for treaty shopping – to avoid these simply becoming a new channel for loss of tax revenue.
Fourth and final, the Global Minimum Tax will probably not be a solution in the short run for the potential loss of tax revenues due to treaty shopping. The reason is that most developing countries do not have implemented these rules while most treaty partners of the aggressive treaties have. The latter can appropriate the revenues from the differences between the global minimum taxation and lower levels of taxation that result from tax incentives in developing countries.
This study proceeds as follows. First we discuss the notion of treaty shopping, and present a review of the literature. Then, we develop the methodology, which involves a network analysis to cover the system aspects of international taxation. It also contains the precise definition of our notion of a potentially aggressive tax treaty. Thereafter, we present the results, respectively at worldwide, country and bilateral levels. We also discuss the Global Minimum Tax. Finally, we conclude and formulate some policy suggestions.
Literature Review
In bilateral tax treaties the treaty partners often agree lower country-specific WHT rates compared to standard WHTs. This opens up a possibility for MNEs to divert their investments via a holding company in a treaty country, to take advantage of treaty benefits that are not found between the destination and originating country of the investments. This practice is called treaty shopping. IMF (2014) identifies this practice as particularly harmful for developing countries, because these countries give up taxing rights. Although the term treaty shopping could be used in a neutral sense of indirect routing, it is now most often understood as treaty abuse. 2
There is at least anecdotical evidence that some tax treaties may not have been in the best interests of developing countries, even when these treaties were entered into and concluded voluntarily. One example is the unilateral termination by Mongolia of its treaty with the Netherlands. Another example is the 2016 revision of the 1971 treaty between Ireland and Zambia. Below we review the literature on treaty shopping.
For multinationals the benefits of treaty shopping can be huge. Van ‘t Riet and Lejour (2018) conclude in a network analysis of bilateral dividends for 108 countries that treaty shopping lowers taxation by about 6 percentage points on average. They also show that it is mostly the host countries of the foreign investment that lose tax revenue, due to the reduction in WHT on dividends. Hong (2018) constructs tax-minimising routes for a set of 70 economies, allowing a maximum of two conduit countries only. He focuses on treaty-specific WHTs on dividends, and concludes that tax rates reduce by 3.7 percentage points wholly due to the use of lower WHTs in third countries. 3 Petkova, Stasio and Zagler (2020) show graphically that these averages reflect a large heterogeneity of outcomes. For many country pairs there is no tax gain, but for others it could be as much as 20 percentage points.
Garcia-Bernardo et al. (2017) also apply a network analysis on firm level data (Orbis) to identify the countries most used as conduit countries, but do not estimate tax savings. The most important conduit countries are the Netherlands, United Kingdom (UK), Singapore, Switzerland and Ireland. However, none of these studies focuses on developing countries.
The question remains whether tax treaties concluded by developing countries are always to their own benefit. Some of these treaties are probably more harmful than others, because they are more attractive for MNEs to include in their international tax planning. Beer and Loeprick (2021) analyse the tax treaties of 41 Sub-Saharan African economies with investment hubs from 1985 to 2015. Their results suggest that signing treaties with investment hubs is not associated with additional investment, yet these treaties tend to come with non-negligible losses of revenue. At the request of the International Research and Policy Evaluation Department of the Dutch Ministry of Foreign Affairs (IOB), Van ‘t Riet and Lejour (2020) analyse six bilateral tax treaties of the Netherlands with developing countries. These treaties are embedded in a tax network of 112 countries (and more than 1,500 bilateral tax treaties). 4 They determine the tax burden on dividends, interest and royalty flows over the network, and compute the impact of diversion of these flows for WHT revenue. For two developing countries, Egypt and Uganda, the loss of tax revenue can amount to 100 per cent, given the use of optimal avoidance routes for MNEs.
Balabushko et al. (2017) analyse the tax sensitivity of dividends, interest and royalty flows from the Ukraine, and conclude that Ukraine loses substantial tax revenue linked to limited taxing rights in their treaties. The authors calculate both the direct and indirect effects due to the behavioural effects of MNEs. Direct revenue costs are simply measured as the difference in the standard WHT rate minus the bilateral one, times the financial flow. In particular, treaties with conduit countries, such as Cyprus, Netherlands and the UK, are responsible for this outcome. The revenue loss for WHT on dividends is more than US$100 million. Janský and Šedivý (2019) estimate the direct revenue costs of WHT on dividends and interest for 14 developing countries. In particular for the Philippines (US$509 million) and Pakistan (US$214 million), the revenue losses are large. Relative to GDP the losses are largest for the Philippines and Mongolia (both 0.17 per cent). However, Janský and Šedivý (2019) do not take account of changes in the tax base, so these results should be interpreted as an upper bound.
Millán-Narotzky et al. (2021) conclude that treaty shopping can be particularly harmful to African countries. The extent to which tax treaties reduce taxing rights is labelled as tax aggressiveness by the authors. An aggressive treaty reduces source tax rights more acutely than other treaties in force in the source jurisdiction. They use a novel dataset (Hearson, Carreras and Custers 2021) on characteristics of tax treaties with developing countries. They conclude that treaties signed with France, Mauritius and the United Arab Emirates most reduce WHT rates. This outcome emphasises the one of Beer and Loeprick (2021). Millán-Narotzky et al. (2021) do not only look at WHTs, but also at other tax rights in tax treaties, such as restricting the definition of permanent establishments. In particular, treaties signed with the UK and France reduce these taxing rights.
Finally, Petkova, Stasio and Zagler (2025) find evidence for bilateral tax competition between developing countries over foreign capital. This competition takes the form of reduced withholding tax rates as agreed upon in bilateral tax treaties with developed countries. This behaviour could increase the potential for treaty shopping.
The Network Approach to Identify Aggressive tax Treaties
This section presents the methodology, which has two parts: i) the network analysis determining optimal tax routes, and ii) the identification and definition of potentially aggressive double tax treaties. First, the main idea of the network analysis is introduced. The country selection, including a subset of LMICs, and required data are introduced thereafter. Subsequently, the construction of bilateral tax rates is discussed. We also discuss the weighting of country pairs, which is especially important for analysing the position of developing countries in the next step. Then, we present our notion of potentially aggressive tax treaties. We conclude this section by discussing some limitations of the methodology and a data caveat. This section relies on earlier published work, in particular van 't Riet and Lejour (2018).
Network Analysis of Treaty Shopping
The network analysis concerns treaty shopping. It considers the international tax system as a transportation network, and computes the ‘shortest’ routes that minimise the taxes that MNEs need to pay on repatriation of income. This income may be distributed as dividends or interest payments, or payments for use of intellectual property (royalties). The tax ‘distances’ are constructed from the CIT rates, non-resident WHTs, and double tax relief systems. Of particular interest are bilateral tax treaties with reciprocal reduction of WHT rates. The MNEs can reduce the taxes on their repatriated income by choosing the ‘cheapest’ route over the network. This could be a direct route, or an indirect route via a conduit entity residing in a third country, a conduit country. In the latter case we speak of treaty shopping. Optimal indirect routes – treaty shopping routes – may have more than one conduit country. This is depicted in Figure 1 for a case of two conduit countries. We use this figure to illustrate the basic idea of the network analysis.
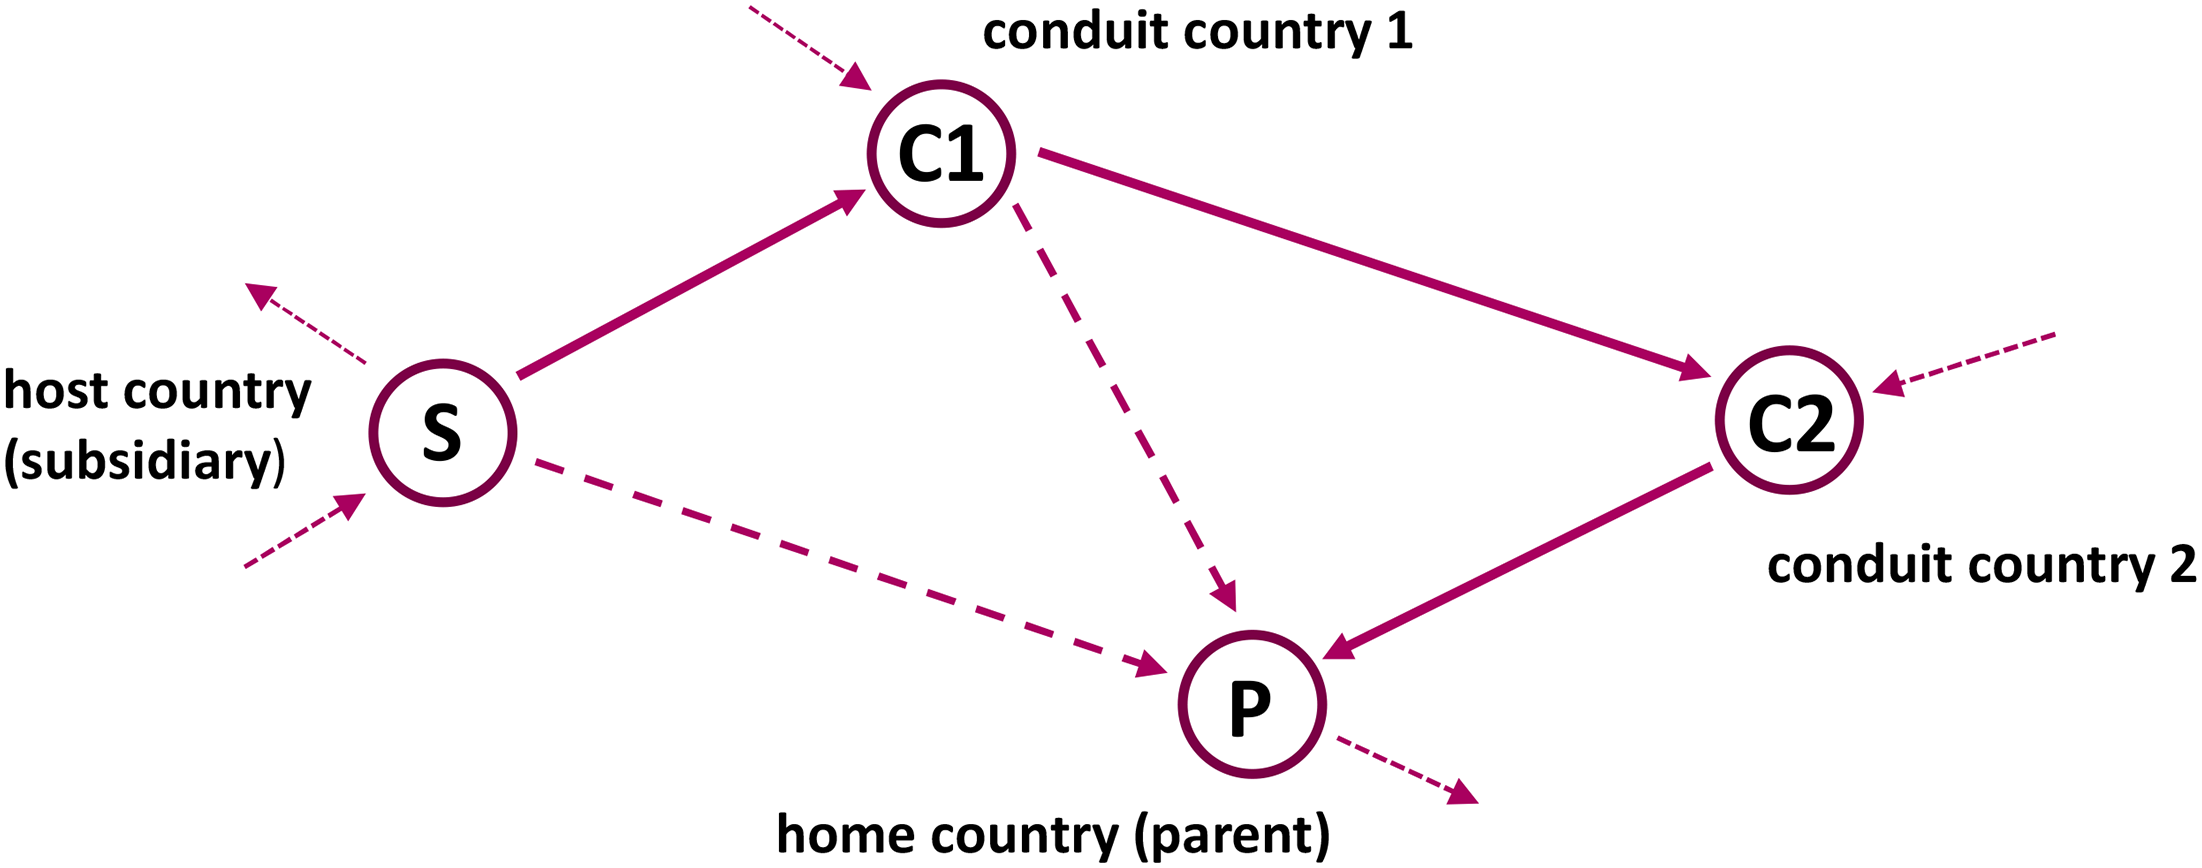
Treaty shopping with two conduit countries.
Consider the repatriation of corporate income from subsidiary S to parent company P. This income flow may be directly repatriated incurring a combined (per unit) tax cost of tS,P. This tax may consist of a WHT levied by the host (S), and CIT in the home country (P). Alternatively, the income may be routed through a conduit country (C1), with a combined tax rate of tS,C1,P. This latter rate may be less than the rate for direct repatriation – for instance, because of a double tax treaty between countries S and C1 that stipulates a reduced WHT rate. Next, a repatriation route involving a second conduit country (C2) may be even more advantageous to the MNE – when tS,C1,C2,P < tS,C1,P < tS,P. Ultimately, the entire network can be searched to find the ‘cheapest’ tax route between a given pair of countries.
The number of possible routes over a network of more than 100 countries is huge, and it is impossible to examine them all. Fortunately, elegant and efficient algorithms from graph theory exist to determine the shortest paths. 5 We apply an adapted version of such an algorithm to find the optimal tax routes.
An optimal route may be direct, without intermediate stations or conduits. Other optimal routes will be indirect. The length of the optimal routes is an outcome of the algorithm. 6 Next, we assume that MNEs structure their financing so that these tax-minimising routes will be used.
In earlier work, we developed this approach to study dividends distributed in international participations (Van ‘t Riet and Lejour 2018). For a network of 108 jurisdictions, we found that treaty shopping leads to a potential reduction of the worldwide average of taxes on repatriated dividends of about 6 percentage points. In addition, we used a centrality indicator that identified the countries most used as conduits for dividend repatriation. Based on 2013 data, these were the UK, Luxemburg and the Netherlands.
Countries and Data
For this paper, we study a network consisting of 118 countries. 7 The selection contains most high- and upper-middle-income economies. 8 This is augmented with lower-middle income countries with relatively large economies, such as India, Indonesia and the Philippines. In total, 18 LMICs have been selected as developing countries in the analysis. The overriding selection criterion is the availability of sufficient tax data. The combined set makes up 97 per cent of worldwide GDP, and 96 per cent of worldwide FDI stocks in 2018 – see annex A. The selection also includes many jurisdictions classified as a tax haven, as these are usually small and affluent – see, for instance, Dharmapala and Hines (2009). The importance of including tax havens is evident – they are likely conduit countries, if only for their characteristic of low or zero taxes (OECD 1998).
The 18 LMIC countries are: Angola (AGO), Bangladesh (BGD), Egypt (EGY), Ethiopia (ETH), Ghana (GHA), India (IND), Indonesia (IDN), Kenya (KEN), Mongolia (MNG), Morocco (MAR), Nepal (NPL), Nigeria (NGA), Pakistan (PAK), the Philippines (PHL), Tanzania (TZA), Uganda (UGA), Vietnam (VNM) and Zambia (ZMB).
Data: tax Parameters
The data required for the network analysis are tax parameters from all 118 jurisdictions. The tax data was obtained from the International Bureau for Fiscal Documentation (IBFD), sometimes supplemented with data from EY's World Corporate Tax Guide (several editions). The parameters are mainly for 2018, and when not available from earlier years. For some countries added later the data may be more recent than 2018. This seeming inconsistency is discussed later on.
The statutory CIT rate is required for each country, as are their standard rates of non-resident WHTs on dividends, interest and royalties, and systems for double tax relief. We use the reduced WHT rates agreed in the treaties. This is bilateral data. Sometimes reduced rates are only applicable to specific sectors, or depend on the degree of participation (percentage of shares). For dividends we took the lowest rate, 9 assuming that MNEs would structure these so that the conditions would be met. For interest and royalties there is usually only one rate – where there are various rates we have selected the second lowest rate, as often the lowest rate was only applicable to a specific sector. 10 In addition to the bilateral treaties we take into account the Parent Subsidiary Directive and Interest and Royalty Directive of the EU; these directives specify that within the EU there is no withholding taxation between member states. The US Tax Reform of 2018 has been implemented. 11 Because most of the data pertains to the year 2018 we treat the UK as a member state of the EU – Brexit was official from 31 January 2020. In a robustness check we implement Brexit, and find very little difference in the results (see Annex 3).
Construction of tax Distances
From the tax parameters we compute the tax distances by country pair for the three income types – dividends, interest and royalties. These bilateral tax rates consist of three components: i) the CIT in the source country (host), ii) WHT and iii) CIT in the residence country (home). The treatment of the latter depends on the double tax relief system the residence country applies, which can be preferential. In the case of an optimal indirect route there may be a fourth component: iv) taxation in the conduit country or countries. We briefly touch upon these four components.
With respect to the treatment of corporate income tax in the source country, there is a fundamental difference between dividends on the one hand, and interest and royalty payments on the other hand. With dividends we analyse the cross-border profit distribution after taxation in the source country. In contrast, cross-border interest and royalty payments are, in principle, deductible from the tax base for the CIT in the source country. These international payments are then expected to be taxed in the destination country, unless they are directly channelled to another country. If the latter is not the case, the CIT of the home country will be levied. Clearly, if the rate of CIT in the residence country is lower than the rate in the source country, there is a tax advantage. We emphasise that the network analysis determines the optimal repatriation routes, and the treaty shopping that it entails. It does not model the erosion of the tax base in source countries that strategic allocation of intellectual property (IP) and debt entails. 12 These tax avoidance strategies are often more advantageous for MNEs than treaty shopping. 13
The WHTs are levied by the source country, and may be a standard rate or reduced bilateral rate, as agreed upon in a double tax treaty. The double tax relief methods of the residence country include exemption of foreign source dividends, credit method (taxes paid in the source country are offset (credited)), or the deduction method (taxes paid at source are deducted from the taxable income). For interest and royalty income offsetting is common, given that the taxes due in the residence country are at least equal to those paid in the source country. A few countries do not apply double tax relief at all, and a few other countries have preferential relief systems for their treaty partners. 14 Taxation in the conduit country is expected to be minimal – if not, the MNE would not have chosen the route. In Annex 2 we give an example of the construction of bilateral tax rates; for details we refer to Lejour, Möhlmann and van ‘t Riet (2022).
The tax rates are computed for three reference cases. These cases are no treaties (NOT), direct routes (DIR) and optimal routes (OPT), where optimal means tax-minimising for the MNEs. NOT: where there are DIR: where there are OPT: where there are
The comparison of case DIR with case NOT will give the potential loss of WHT revenue for countries due to reduced rates concluded in the treaties. The comparison of OPT with DIR will give additional loss of revenue as a consequence of treaty shopping.
Consistent with the notion of optimal routes, we exclude interest and royalty payments that incur a tax loss. In case OPT we assume that MNEs do not structure their debt or locate their intellectual property, so a loss may occur. We perform this exclusion with zero weights, discussed in the next subsection.
Weighting of Country Pairs
The results of the network analysis are presented at three levels – world, country and bilateral levels. There are 118 × 117 = 13,806 of these bilateral links. This high number makes aggregation of the results unavoidable, and for this we use weighted averages. As in our previous work, we apply double GDP-weights for dividends. This works as follows. We distribute 100 units over all 118 countries according to their share in total (world = 118) GDP. Next, for each of these 118 source countries, we determine the flow to each of their 117 destinations, again proportional to GDP. 15 Our motivation for this weighting is that we deem the economic relevance between two large economies, say the US and Japan, more important for dividend repatriation than a link between two small countries. For interest and royalties, other considerations are at stake.
However, double GDP weights may not do justice to the fact that most developing countries are net capital importers. This is confirmed by statistics on FDI positions (stocks) in 2018 shown in Table 1, based on Annex A. The last but one row shows US$151 billion outgoing FDI as the total for our selection of LMICs, whereas total incoming FDI equals US$780 billion. This may suggest that FDI data could be used for constructing bilateral weights. Yet these statistics contain the double-counting of FDI stocks due to treaty shopping, or the rerouting of FDI for tax purposes. The top 20 positions in the ranking of countries in terms of outward and inward FDI are listed in Table 1. The top four, both for inward and outward FDI, have been the same countries for years – the US, Netherlands, Luxembourg and the UK. Next are four economies known as financial centres – Hong Kong, Ireland, Switzerland and Singapore. There are also four island tax havens in the top 20 – the British Virgin Islands, Cayman Islands, Bermuda and Jersey, all with extreme ratios of FDI to GDP. As these tax havens and/or conduit countries are prevalent in the top ranking of FDI data, they must be rejected for use in our bilateral weights.
Top 20 Countries Outward and Inward FDI, 2018.
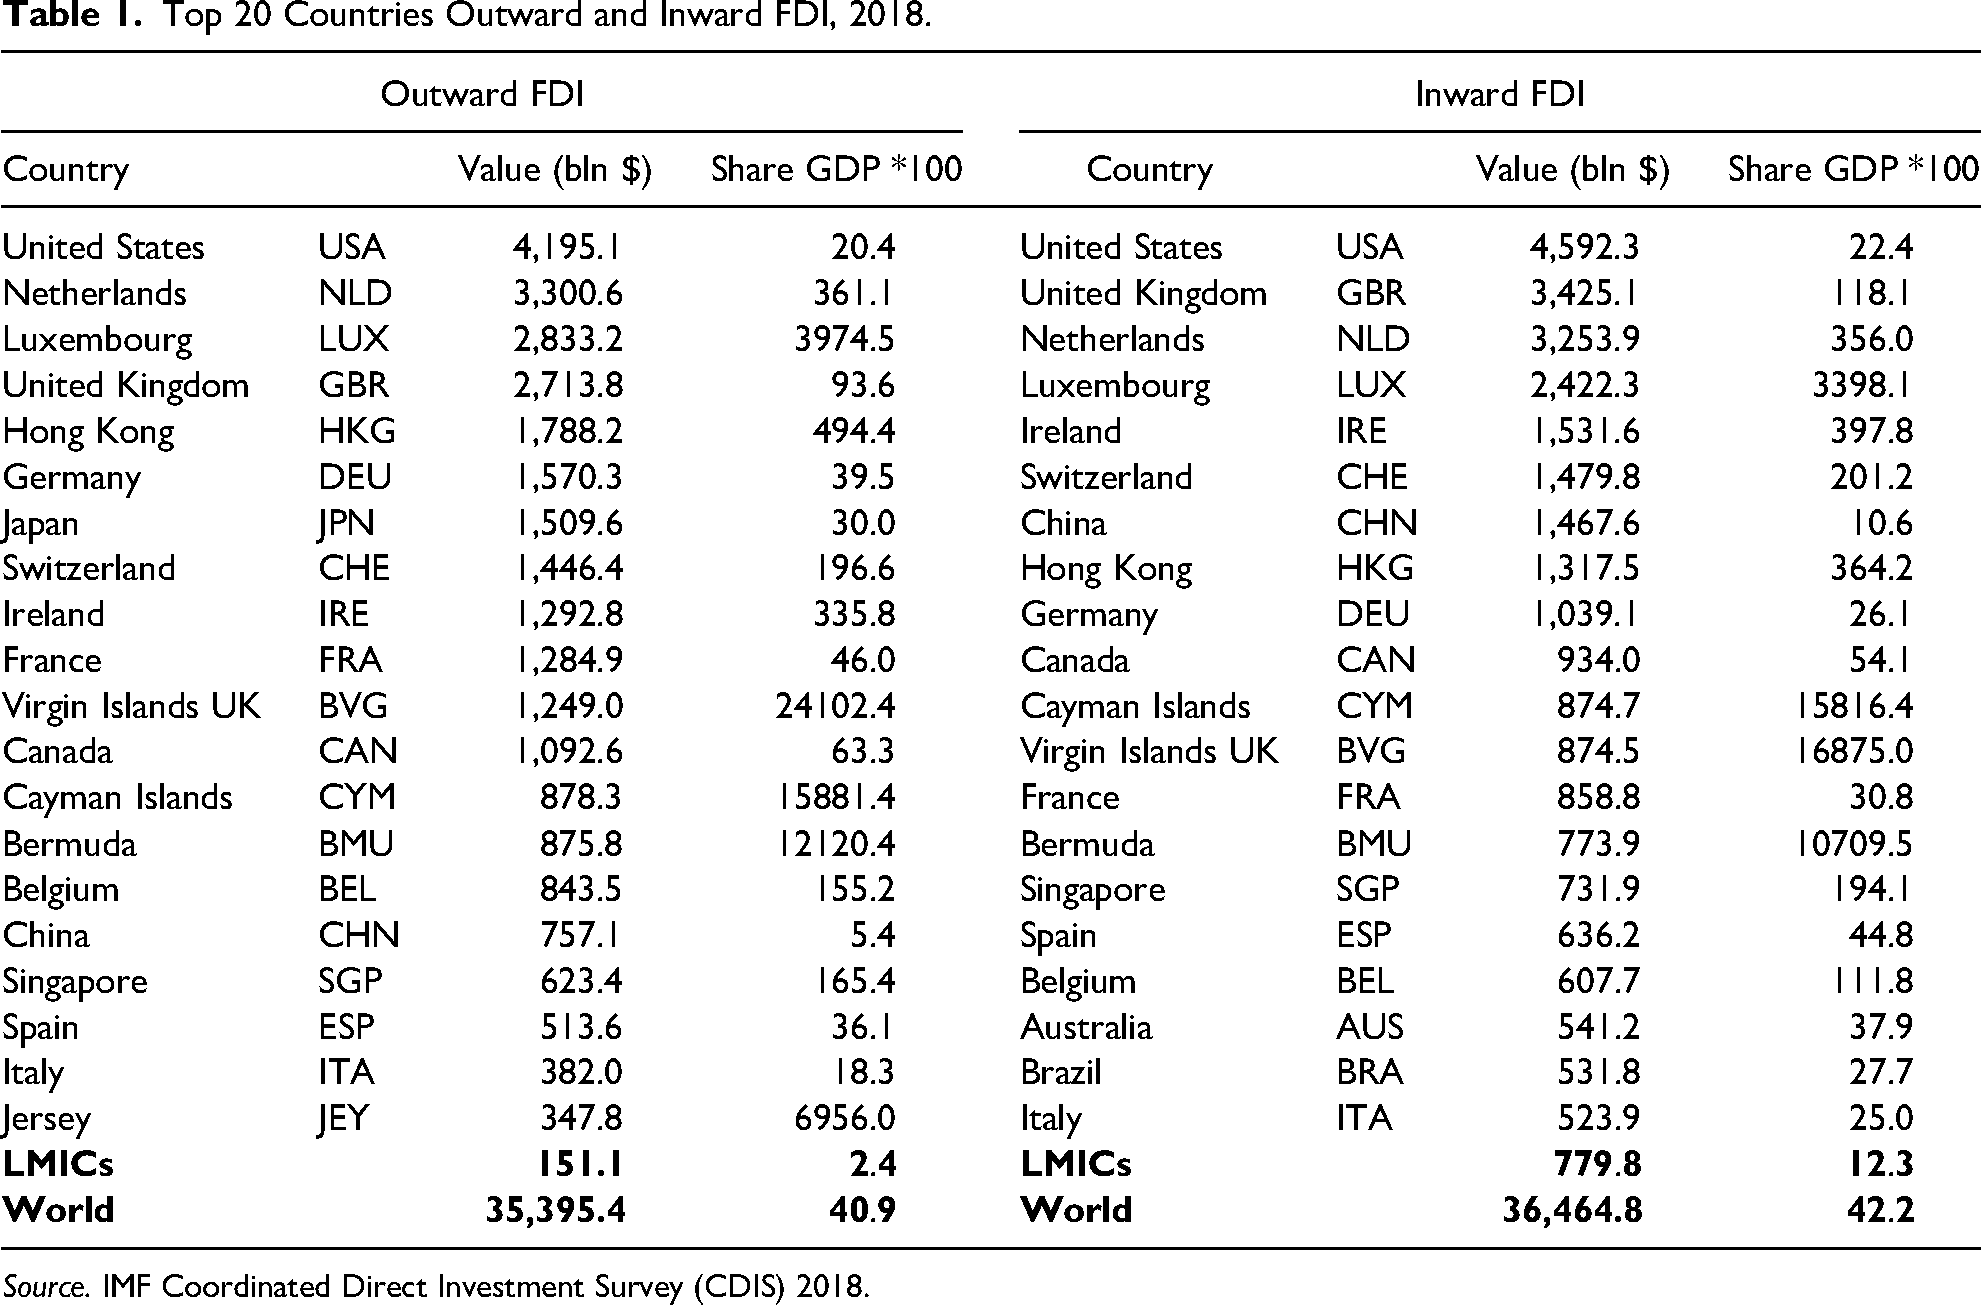
Source. IMF Coordinated Direct Investment Survey (CDIS) 2018.
Alternative Weighting of Country Pairs with Interest and Royalty Flows
With GDP weighting of the country pairs, we find minimal worldwide average tax benefits of the optimal diversion of interest and royalty flows – less than 1 percentage point, while this average is about 6 percentage points for dividends. Moreover, for only a fifth and a quarter of all country pairs is there a tax benefit by using indirect routes, for interest and royalties respectively. For dividends this share is about two-thirds. 16 It is also clear that not all country pairs are relevant for profit shifting. Interest and royalty costs are preferably deducted in countries with a high statutory tax rate, while the payments are supposed to end up in low tax jurisdictions. Strategic location of intellectual property or debt are examples of this. This leads us to apply an alternative weighting scheme for interest and royalties, that at the same corresponds with the notion of case OPT (optimal routes).
This version (dCIT) 17 only has positive weights for those country pairs AB for which it holds that the statutory tax rate of country A is higher than that of country B: cit(A) > cit(B). The reverse of the condition holds as well, where the weight of country pair BA will be zero. With this condition all flows between country pairs for which the MNE would have a tax loss are excluded. Next, we combine this with the economic relevance of source country A: GDP(A). Finally, the larger the difference in tax rates, the larger the incentive to shift profits, and hence the weights. All this amounts to: dCIT(AB) = GDP(A)*(cit(A) – cit(B)). 18
As stated before, the network analysis does not actually model profit shifting by intra-group loans and sub-licensing of IP. However, for every flow with the alternative weights, it holds that profits are reduced in a high tax country and are ultimately taxed in a country with a lower tax rate. This leads to
Finally, the network analysis is applied on dividends, interest and royalty flows, each independently. This implies that transformation of the type of flow in the conduit countries, say from dividends to interest, is not considered. This is a limitation of the approach, especially for the conduit role. In a study with firm-level data on special purpose entities (SPEs) in the Netherlands, substantial transformed income flows are observed. 19
Identifying Potentially Aggressive tax Treaties
The network analysis generates worldwide average potential tax gains for MNEs that are presented in the next section. These are averages weighted over country pairs, either with double GDP weights or with alternative weights. Beyond worldwide averages we generate results at country level, and even at the level of individual country pairs. At country level we observe the potential loss of, especially, WHT revenue. This is the logical counterpart of the tax avoidance gains for MNEs. The gains and losses are with reference to the case without treaty shopping (DIR). In addition we present the implied WHT revenue loss because of reduced treaty rates. The reference here is a hypothetical case of no treaties, or no reduced rates (NOT).
Given the results for a specific source country, we have information on the conduit countries on tax-minimising routes. For all outgoing flows we know the first conduit country on the tax-minimising routes. This first country is a tax treaty partner of the source country with a reduced WHT rate. There can be several first conduit countries, because source countries have often concluded dozens of treaties with different treaty partners. As different treaties may determine the first part of the optimal routes we work with shares.
By combining the potential tax revenue losses and the relevant treaties responsible for these, we can define a potentially aggressive tax treaty. When the product of the share of the potential tax loss and the share of an individual treaty instrumental in this loss exceeds 25 per cent we deem the treaty as potentially aggressive. For example, given a country that faces a WHT revenue loss of 60 per cent because of treaty shopping, and a particular treaty is 50 per cent responsible for this loss, we classify this treaty as potentially aggressive because the product of 60 per cent and 50 per cent is 30 per cent. The threshold of 25 per cent is arbitrary, but reflects the substantial impact of an individual treaty on tax revenue loss. We expect this choice, and the comprehensive analysis, to shed light on the idiosyncrasies of the current international tax system.
Caveats
Methodological Limitations
We re-emphasise two important methodological limitations of our analysis. First, the analysis does not take into account the fact that tax treaties may attract new investment into a country. This in turn may generate income that can be taxed, leading to additional tax revenue. 20 We focus on the potential loss by treaty shopping. The analysis is completely static. We note here that, also for existing investment, financial restructuring of MNEs may lead to other treaties becoming applicable, with a consequent revenue loss. Second, we construct the case where we assume that MNEs fully optimise their financial structures, so that repatriating income incurs the least possible taxation. Obviously, this is not a realistic situation. We use this to determine the full potential for tax revenue losses by treaty shopping, and the results should be interpreted as an upper bound.
Notwithstanding the above limitations, our results have been obtained with public available tax parameters and an objective mathematical method. Moreover, the centrality indicator has been used as an explanatory variable in regressions of bilateral FDI (IMF-CDIS). The indicator proves to be statistically significant in a large number of specifications (Van ‘t Riet and Lejour 2018). Countries with a high conduit ranking in our analysis do, indeed, have more foreign investment flowing through the country.
Data Caveat
The analysis is based on a mix of older (2018) and some more up-to-date data. This is not ideal, because the set of data may not describe the current situation, or not even a situation that ever existed. It is not a perfect snapshot of a moment in time. Two remarks are in order. First, this tax data does not change frequently, as countries do not change their CIT rates, standard WHT rates, or reduced rates in existing treaties frequently. This suggests that tax rates will be relatively stable. Second, new tax treaties come into force all the time, and replace standard WHT rates by agreed lower bilateral tax rates. Therefore the dataset will never be completely up-to-date. This is a problem for all applied quantitative research.
The worldwide aggregate results have proven to be very robust. However, the results of the network analysis are sensitive to the set of bilateral tax treaties and their reduced rates. This certainly holds for specific treaties, and sometimes for some country-specific results. In spite of this, the systematic approach of the international tax system by a network analysis shows the potential of the system for treaty shopping. Even if some specific country and bilateral results of the network analysis do not hold due to changes in a treaty, it still shows robust outcomes for other countries.
Network Analysis Results – Worldwide Averages
In this section the worldwide average results of the network analysis are presented for the three income types – dividends, interest and royalties. The next section treats the potential loss of tax revenue for individual countries. The three sets of results concern two weighting schemes – GDP-weights for dividends, and alternative weights for interest and royalties - as discussed before.
Table 2 shows the results for each of the income flows for the tax network of 118 countries. The worldwide weighted average potential Treaty Shopping Gains (for MNEs) are respectively 5.6 percentage points for repatriated dividends, 7.4 percentage points for interest, and 7.7 percentage points for royalty payments – see row 7. These are the main results at the worldwide level, and these potential treaty shopping gains for MNEs correspond to potential loss in tax revenue for the countries. We discuss these results.
Network Analysis of Treaty Shopping.
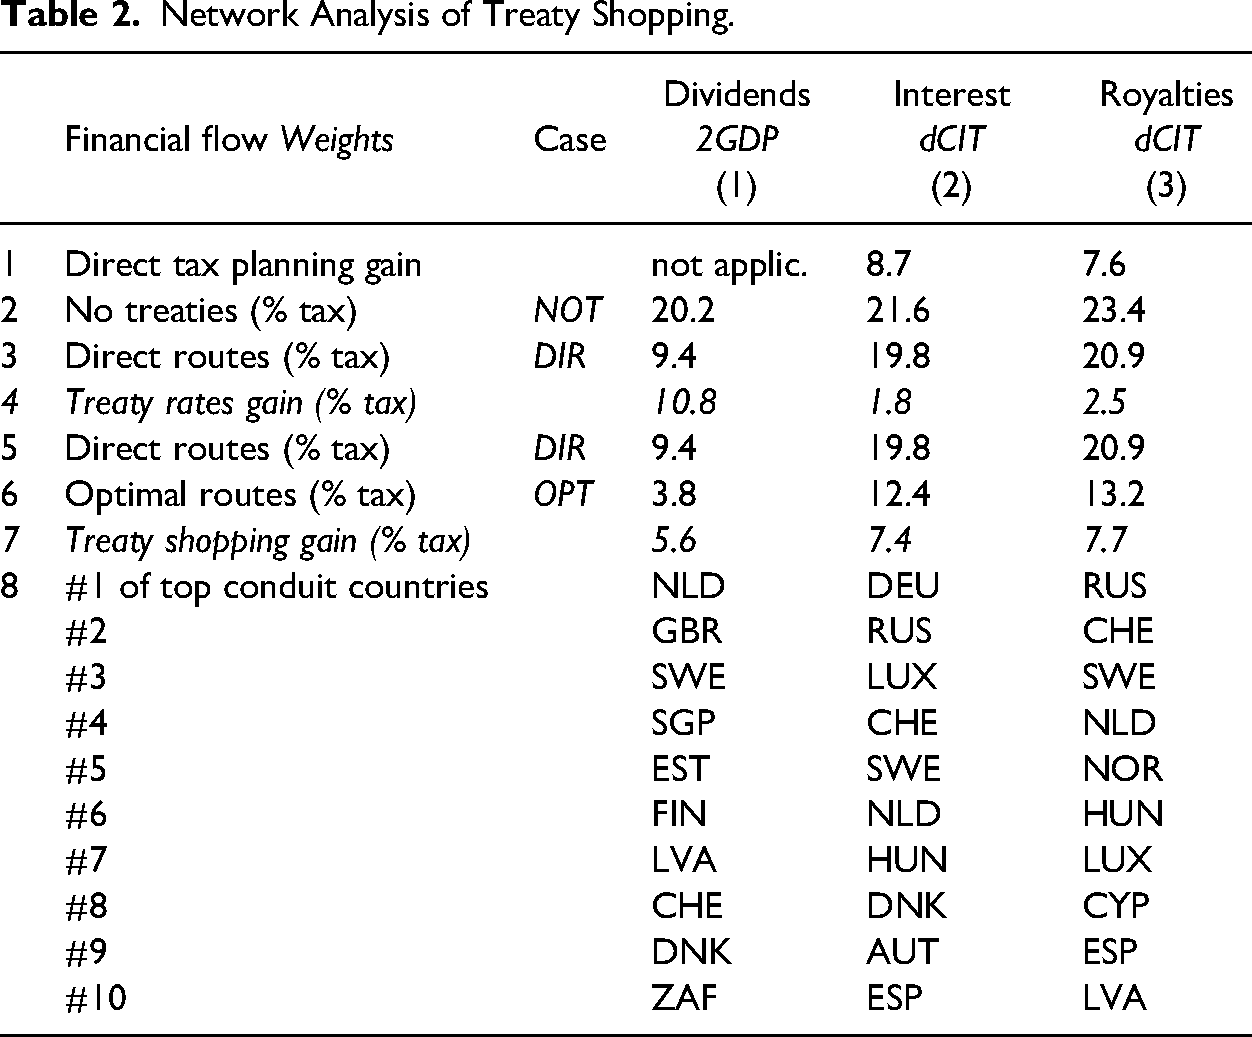
The important difference in the results between dividends on the one hand, and interest and royalties on the other hand, is double taxation of dividends. The CIT for dividends is due in the source country, and possibly also the residence country. With interest and royalties, CIT is due in the residence country, most often with the credit method for double tax relief.
Interest and royalty flows are thus taxed less than dividends. In fact, the interest cost and royalty payments can be deducted from taxable profits in the source country if these are sufficiently high. This amounts to a direct tax planning gain of 8.7 percentage points for interest, and 7.6 percentage points for royalties – see row 1 of Table 2. This gain does not exist for dividends.
Next we consider the average taxation on bilateral flows, as if no treaties existed (NOT). The double taxation on dividend flows then amounts to 20.2 percentage points, whereas it is somewhat higher for interest and royalties – see row 2. The average double taxation on repatriated dividends via the direct routes, with the treaty rates (DIR), is 9.4 percentage points. For interest and royalties this average is more than 10 percentage points higher – see row 3. This dichotomy also translates to the difference between cases NOT and DIR, which is the treaty rates gain, given in row 4 of Table 2. This gain is very limited for interest and royalty payments. The explanation is the use of different double tax relief methods. For interest and royalties, the dominant relief is the credit method. Reduced WHT rates in the source country means less credit against CIT in the residence country. Thus, the taxing rights move from one country to the other, with no net tax change for the taxpayer. For dividends, exemption is a common relief method. Here the residence country has already given away its taxing rights, so reduced treaty rates immediately translate into a tax reduction for the MNE on the income flow.
The average double taxation on repatriated dividends via the direct routes is 9.4 per cent, with optimal diversion this is 3.8 per cent. Hence, the average potential reduction of taxation by treaty shopping is 5.6 percentage points. 21 The benefit of optimal diversion for interest and royalties would be, respectively, 7.4 per cent and 7.7 per cent.
Finally, from row 8 onwards, Table 2 gives the top ten ranking of the conduit countries. For all three income types, the Netherlands, Luxembourg and Switzerland are in the top eight. In general, EU member states are attractive as conduits, because of the Parent Subsidiary Directive (for dividends) and the Interest and Royalty Directive in the EU. For dividends the UK and Estonia have a standard WHT rate of 0 per cent. Sweden has concluded a relatively large number of tax treaties with reduced rates for dividends and zero rates on interest and royalties, which contributes to its high ranking as a conduit country.
The top ranking of Russia and Germany with interest flows may seem surprising. It appears that both Russia and Germany have negotiated low tax rates on interest with their treaty partners – lower than other countries have done with these treaty partners. This makes it relatively advantageous to channel interest via Russia and Germany. For Russia this applies to its treaty with China, which does not levy WHT on interest flows to Russia, and for royalties there is a rate of 6 per cent instead of the standard rate of 10 per cent. Since China is the second largest economy in the world, the flows from China have a relatively high weight. For Germany there is a similar situation with a zero rate on interest from Japan.
Developing Country Results
Now we consider our subset of 18 LMICs. First, on average (unweighted) they have only 24 double tax treaties, which is clearly less than the overall average of 34 treaties. The latter number even includes low tax havens, which almost never have double tax treaties. A second observation is that the average CIT rate is higher for LMICs – 28.9 per cent compared to the overall average of 25.4 per cent. Of course, these averages are based on nominal CIT rates, which are applied throughout the analysis. We have no systematic information on the benefits of tax rulings or other preferential tax regimes for some investors.
Tables 3a-c give average rates for different types of income flow. Table 3a concerns dividends. The (weighted) average standard rate (NOT) on dividends is for LIMCs less than half of what it is overall – 8.6 per cent instead of 18.6 per cent. This average rate is dominated by India, which does not levy a withholding tax on outgoing dividends. 22 The unweighted averages are 14.5% (all) and 16.0% (LMICs). The weights, however, require an interpretation of the tax gains for MNEs in terms of the size of flows between countries. The weighted average in the LMIC group without India is 16.2 per cent.
Average Rate % – Dividends (2GDP Weighted).
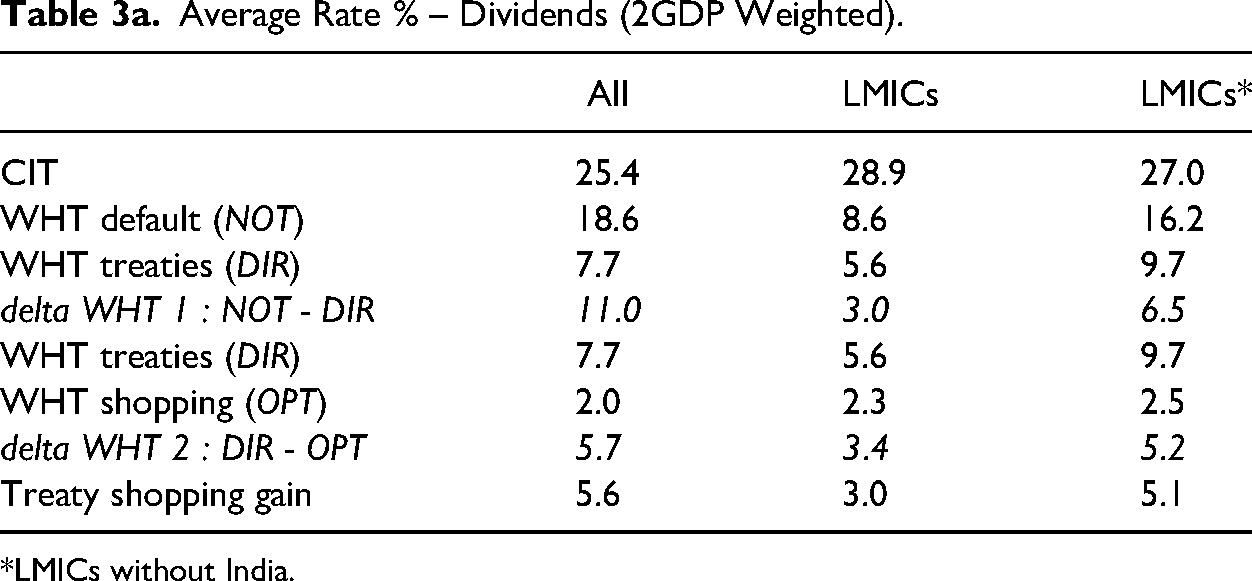
*LMICs without India.
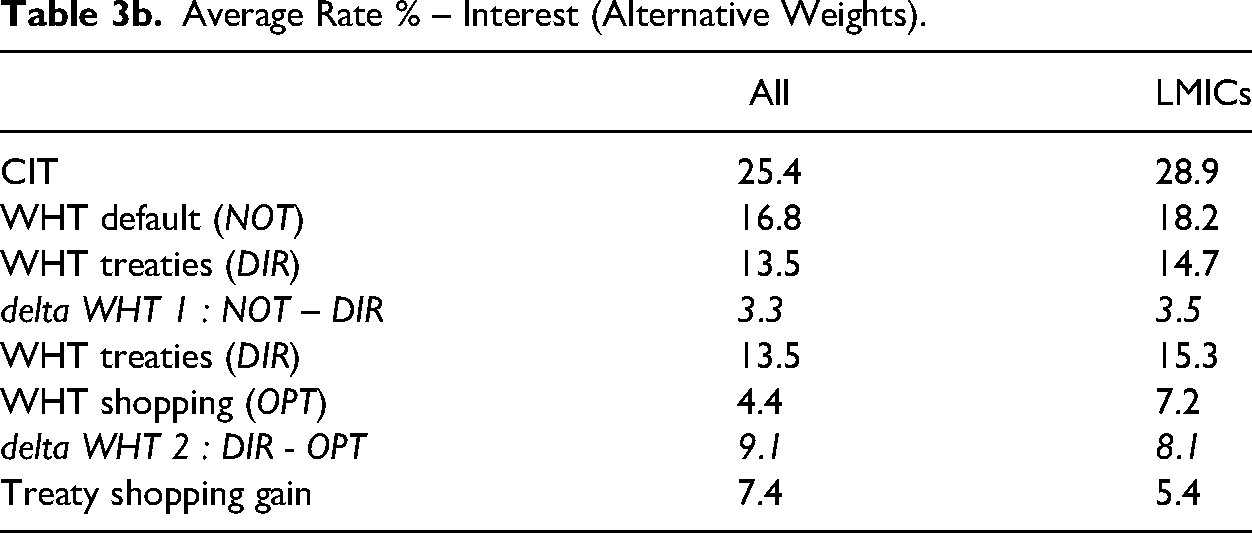
Average Rate % – Interest (Alternative Weights).
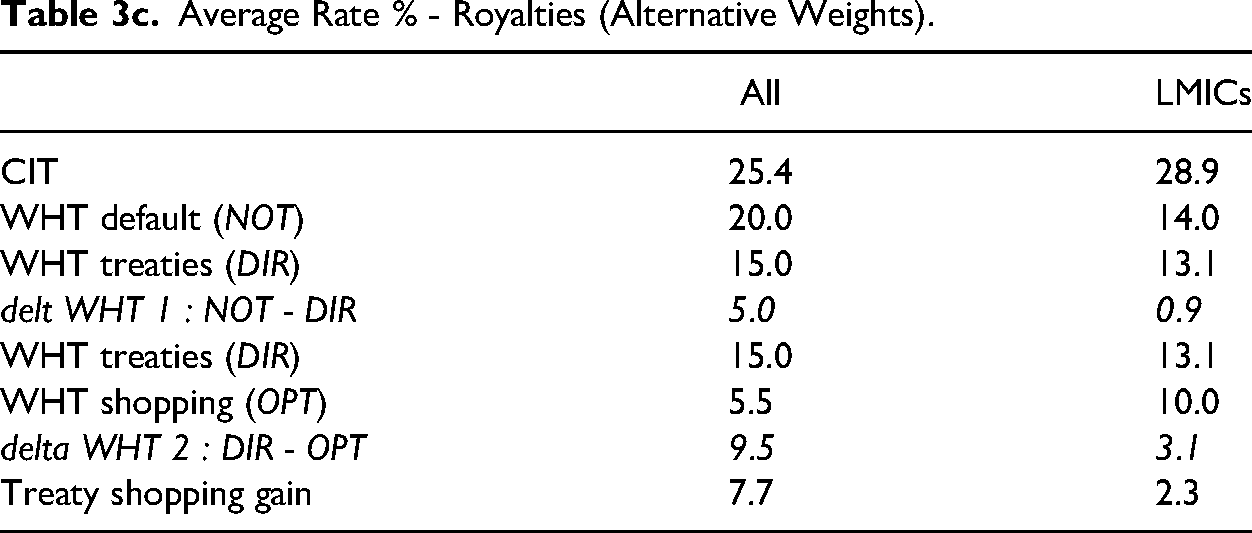
Average Rate % - Royalties (Alternative Weights).
Comparison of the default WHT rates (NOT) with the treaty rates (DIR) shows a far larger difference (delta WHT 1) for the world average than for the group of LMICs – 11 percentage points versus 3.0 percentage points. Here we observe that the US has reduced its dividend WHT rate to zero with quite a few of their European treaty partners, and vice versa, implying large reductions. Also, the zero rate WHT on outgoing dividends of India cannot be reduced, leading to a lower average reduction.
The final potential treaty shopping gain on dividends from LMICs is 3.0 percentage points. This is clearly less than the 5.6 percentage point average for all. Again, the situation of India plays a role – there is no treaty shopping gain to be made when the initial WHT is zero for all destination countries. Without India in the LIMC group, the average treaty shopping gain on dividends would be 5.1 percentage points.
The treaty shopping gain is predominantly determined by the difference in the source taxation – withholding tax. Residence taxation may differ as well, and there may be some taxation in conduit countries on indirect routes. The latter category is responsible for the small difference between ‘delta WHT 2: DIR - OPT’ in the table and the treaty shopping gain.
Table 3b concerns world averages for interest payments. The treaty rates gains (delta WHT 1: NOT – DIR) are modest: 3.3 percentage points (All) and 3.5 percentage points (LMICs). But we observe large potential differences in the source taxation between direct and optimal indirect routes (delta WHT 2), respectively 9 percentage points (All) and 8 percentage points (LMICs). The difference between the overall gain for LMICs and all countries is 2 percentage points. With interest payments the treaty shopping gain is substantially lower than delta WHT 2, implying that residence and conduit taxation is more important than dividends. As explained above, the credit method matters here. India has the opposite role with interest compared to what it has with dividends – without India the treaty shopping gain from LMICs is only 3.5 percentage points (not in the table) instead of 5.4 percentage points, and the difference with the worldwide result is larger. We discuss this in the next section.
For royalties the difference between All and the LMICs is more pronounced – see Table 3c. The potential gains for MNEs from optimal treaty shopping with royalties from the LMICs is 2.3 percentage points, compared to the average for the whole set of countries of 7.7 percentage points. India has no reduced rates on royalties for its treaty partners. Removing India from the set of LMICs, the treaty shopping gain is still only 4.3 percentage points (not in the table).
Over the three income types we consistently observe on average less potential gains from treaty shopping for our set of LMICs, with or without India. This suggests that LMICs have concluded less treaties with very low rates for specific countries – less than most other countries. This reduces the scope for tax gains from treaty shopping.
Potential tax Revenue Losses – by Country
Tax gains for MNEs are revenue losses for national governments. In this section we compare the situation where only direct routes are allowed (DIR) between a country pair, with the situation with optimal routes (OPT), which allows for indirect routes. Before presenting the results, we discuss four mechanisms that affect tax revenue. Possible changes in the tax base that may result from other investment decisions of MNEs are not part of the analysis.
Optimal Routes: Four Economic Mechanisms of Changed tax Revenue
International enterprises can structure their investments so that they make use of the most advantageous rates of WHTs, as set out in bilateral tax treaties. Treaty shopping therefore signifies primarily a reduction in WHTs, and loss of tax revenue in source countries. This is the dominant mechanism.
The reduction in WHTs can impact tax revenue in the home country (residence). Tax revenue may increase, depending on the double tax relief system of the home country. Consider the credit method as a relief system to avoid double taxation. The WHTs already paid are a ‘credit’ for CIT in the home country. With less taxes already paid, less can be credited.
The third mechanism derives from some countries having preferable relief systems for their treaty partners. For example, where the default system is the credit method, this can be replaced by exemption, leading to a reduction in tax revenue in the residence country. We indeed find that optimal routes make use of these preferential relief systems. This mechanism applies almost exclusively for dividends.
Finally, there could be taxation in the conduit country. A dividend flow passing through a conduit country could, in principle, be taxed. In our model, an optimal route will generally only pass through conduit countries in which the CIT rate incurred by the conduit entity is zero. Yet such a structure could still incur WHTs – interest and royalty flows passing through the conduit will be taxed by the source country as they enter the conduit jurisdiction, but simultaneously the outgoing flow will be deducted from the conduit's taxable profit. Given the nature of the optimal routes (tax minimising), this revenue will be low. However, when other tax revenue is modest, a minimal conduit tax revenue may be relatively large for some countries.
Results for Dividends
For each of the income flows we present the loss of tax revenue in a table for the selected LMICs. We also present the totals, and compare these with the world totals. Table 4a shows tax revenue and loss caused by treaty shopping for dividends. For reference with direct routes, revenue is shown for WHT (column 1) and for CIT in the residence country (column 2). For optimal routes, there is also possible revenue from taxation in the conduit country (column 5). Tax losses are presented as a percentage of total revenue (col. 6) and WHT (col. 7).
Tax Revenue Results – Dividends.
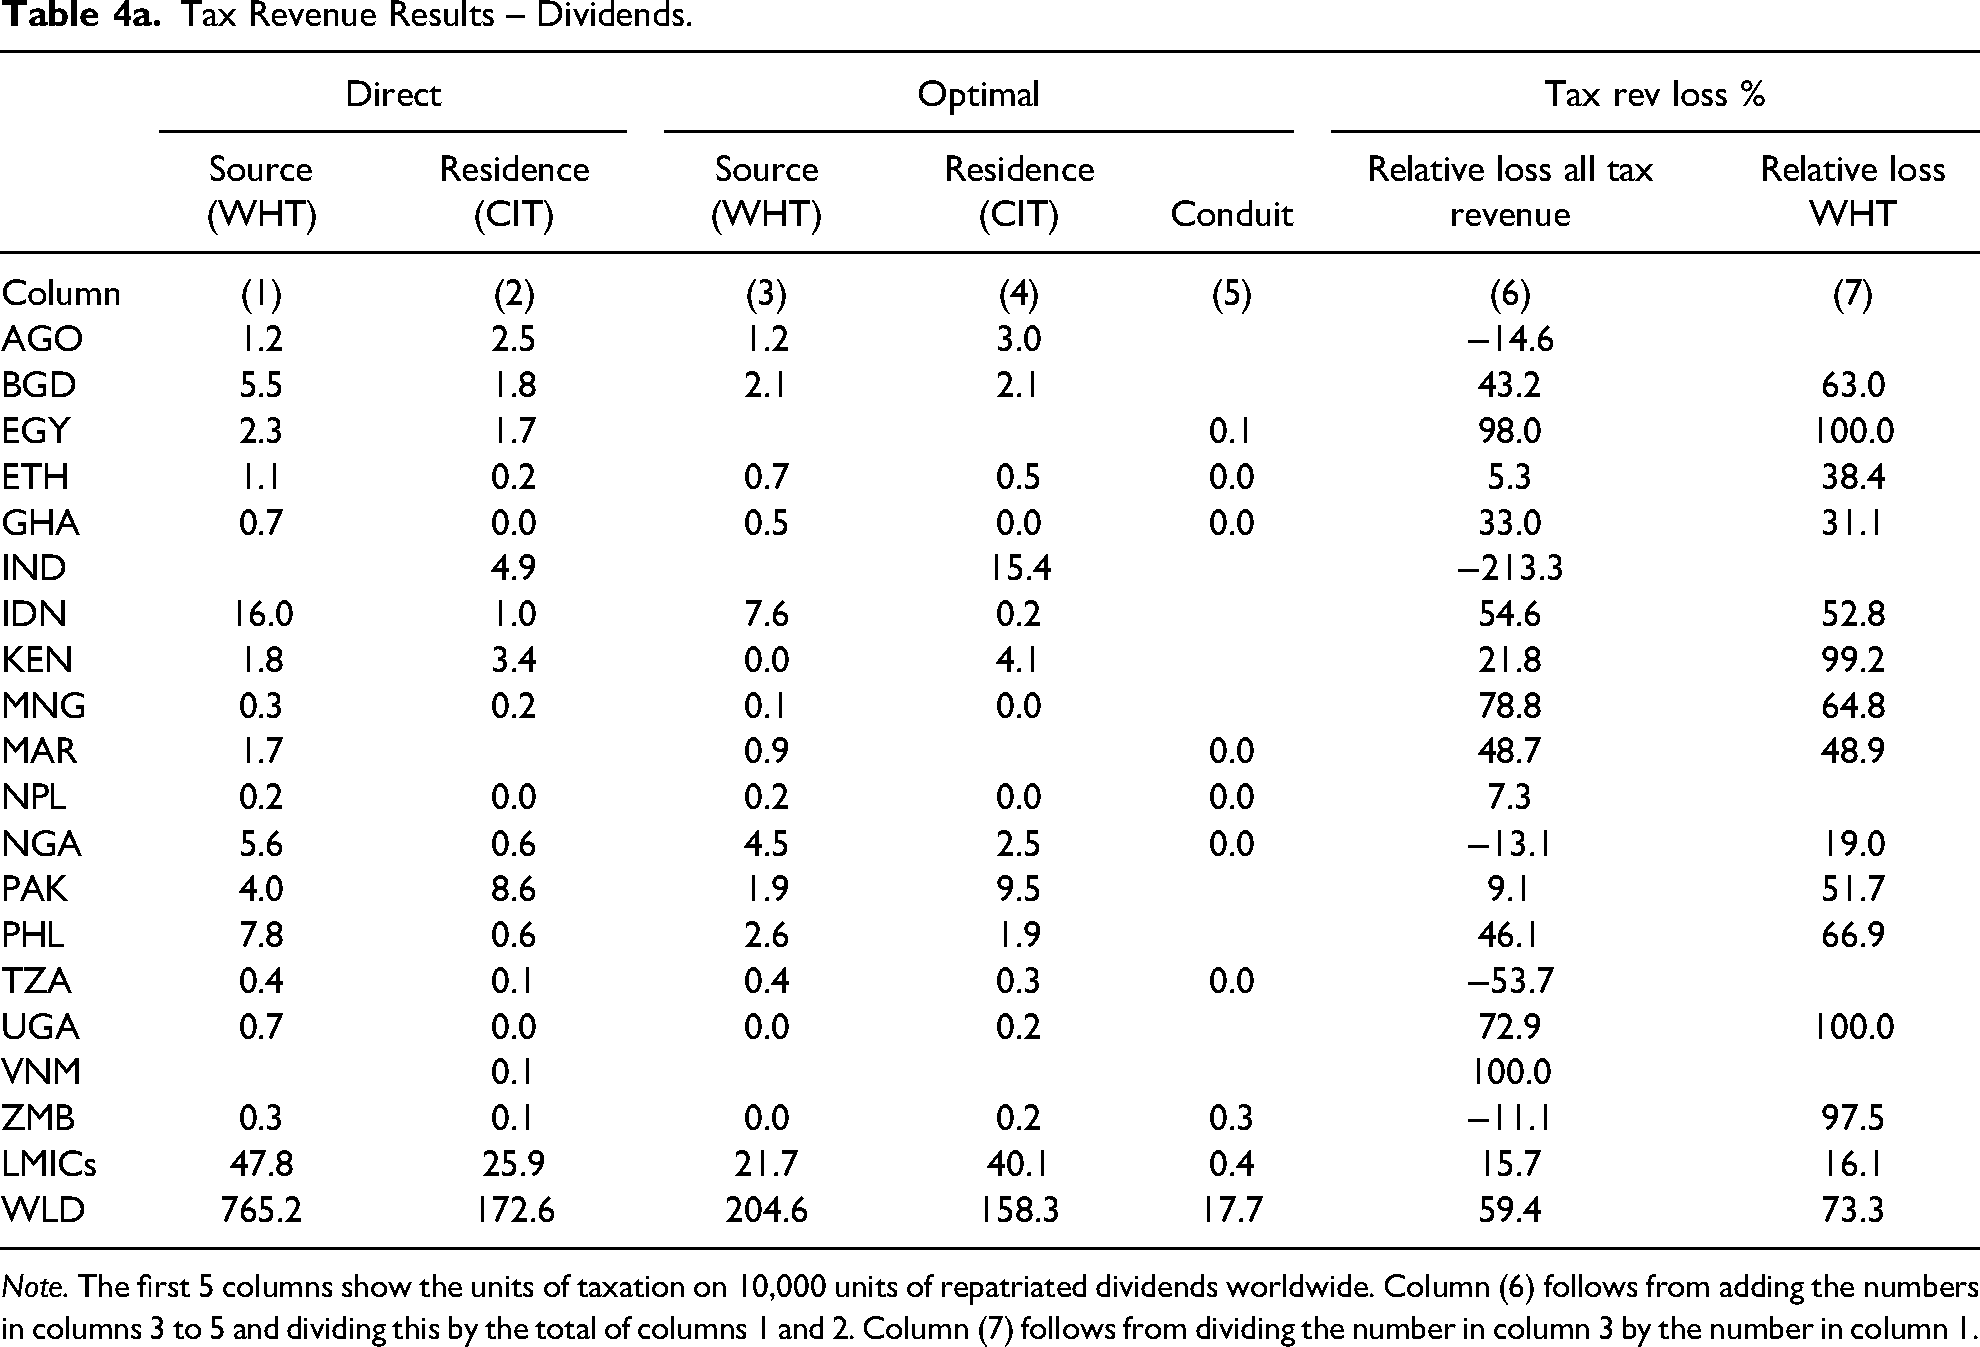
Note. The first 5 columns show the units of taxation on 10,000 units of repatriated dividends worldwide. Column (6) follows from adding the numbers in columns 3 to 5 and dividing this by the total of columns 1 and 2. Column (7) follows from dividing the number in column 3 by the number in column 1.
We explain the table with an example. Bangladesh receives in the reference situation 5.5 units of WHTs on dividends as the source country, and 1.8 units of CIT as the residence country. With optimal routes these taxes are respectively 2.1 and 2.1 units. These numbers are thousandths of a per cent (0.001 per cent) of the world total of repatriated and taxable dividends (100 per cent = 10,000 units). At the bottom of the table we observe for the world total (WLD) a percentage of almost 7.65 per cent (765 of 10,000 units) for WHTs in the reference situation (direct routes).
The total of source and residence taxation for Bangladesh is 7.3 (= 5.5 + 1.8) units in the reference situation; with treaty shopping this becomes 4.2 (= 2.1 + 2.1) units. Bangladesh does not have conduit taxation revenue. The loss of tax revenue as a percentage of the total is 100*(7.3–4.2)/7.3 = 43.1%. For WHTs this is 100*(5.5–2.1)/5.5 = 63.0%.
Egypt loses both its source and residence taxation entirely. These are illustrations of the first and the third mechanism discussed above. Egypt has, for dividend payments, a preferential double tax relief system for its treaty partners. It receives some conduit taxation, but this is nearly negligible. Obviously this is not a realistic situation. It is the outcome of the assumption that MNEs completely structure their financing so that all their dividend repatriation is tax-minimising. A similar example is Kenya. We do not expect that it will lose almost all its dividend WHT revenue through a tax treaty with Zambia (as we see later), but this is how the mechanism in our model works.
India had no WHT on dividends, and therefore could not lose revenue as a source country. It is also the opposite for its role as a residence – India would benefit from all MNEs choosing optimal routes. Because these routes minimise WHTs the taxable profits that arrive in India are larger and less taxes can be credited, thus increasing residence taxation in India. This is the second mechanism described above. This economic mechanism is also dominant in Angola and Tanzania, although these countries also levy a WHT. However, this revenue is not affected by treaty shopping. Nigeria and Zambia lose source taxation but would gain in residence taxation, with a net gain (thus a negative loss in column 6). For Bangladesh, Ethiopia, Pakistan, Philippines, Uganda and Zambia the revenue from residence taxation does increase, but by less than the decrease in source taxation. Zambia also receives some conduit taxation (mechanism 4, column 5) due to treaty shopping. As a result total tax revenue increases. We repeat that these results are not empirical estimates, but come from an exercise where we assume that all repatriated income follows tax-minimising routes.
The last two rows of Table 4a give the totals and percentages for LMICs and the world. Clearly, all countries lose from treaty shopping. However, relatively, LMICs lose substantially less revenue on average. Some LMICs, however, have large potential losses.
Results for Interest
The pattern is somewhat different for interest payments – see Table 4b. The losses are larger. We also observe that, worldwide, residence tax revenue increases, from about 6.38 per cent to 7.76 per cent (bottom line of Table 5.1b, columns 2 and 4). This is caused by the increased tax base for residence taxation following reduced withholding taxation (the second mechanism). Nearly all LMICs receive more residence taxation. Nine countries even receive more tax revenue with optimal structures for the MNEs. The potential losses for developing countries vary, but remain considerable for some countries – more than 50 per cent in Philippines and Indonesia, and up to 67 per cent for India. India has a standard rate of 20 per cent, and treaty rates of 15 per cent and 10 per cent. The optimal routes will make use of the treaty rates of 10 per cent. The WHT revenue losses for LMICs are much larger than for dividends, and are again smaller than those for other countries.
Tax Revenue Results – Interest.
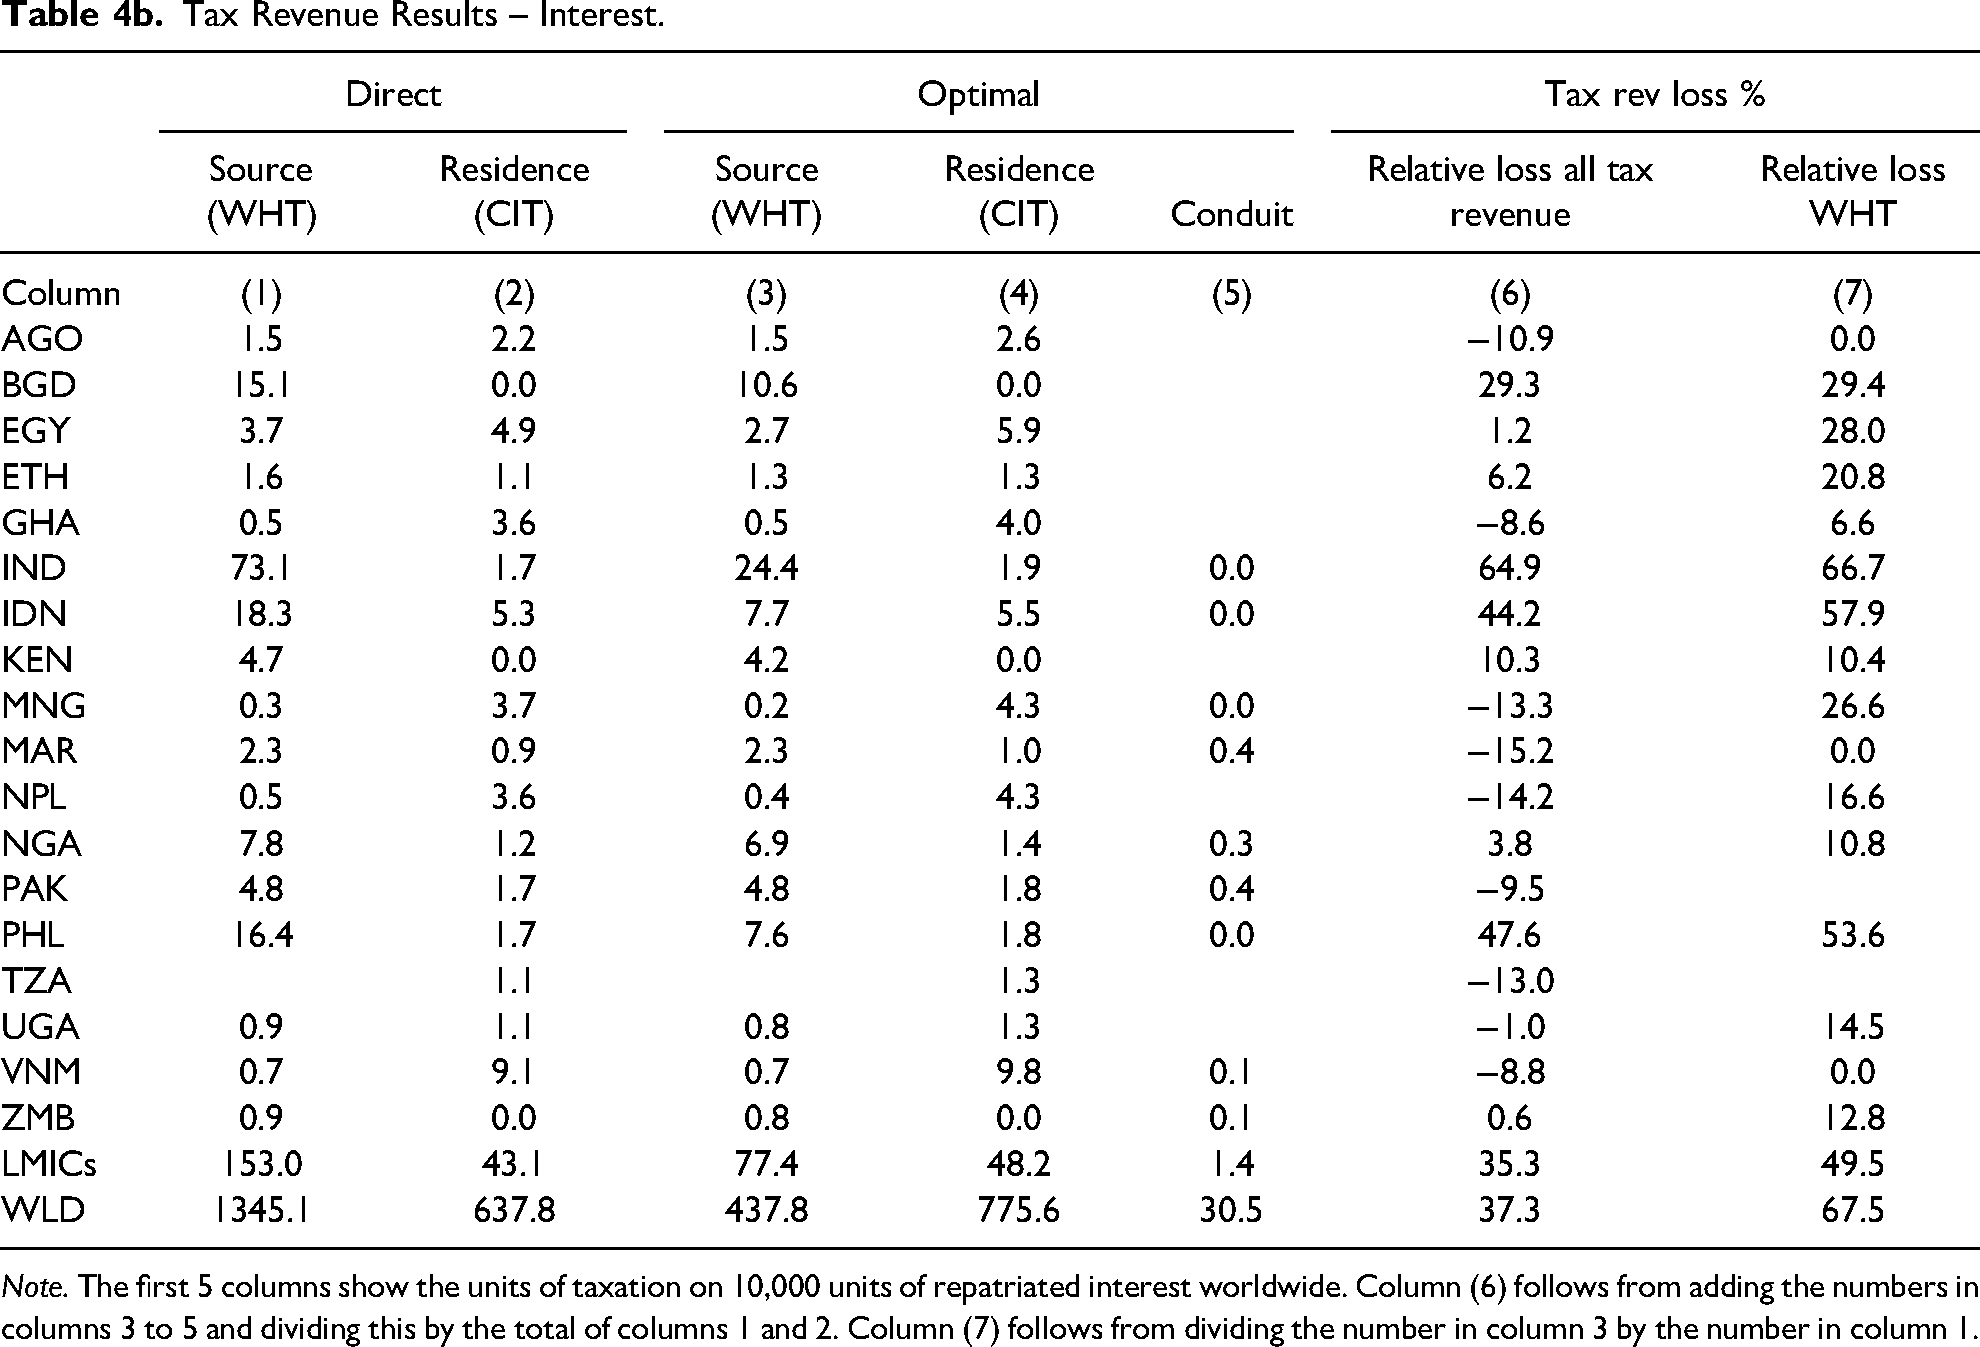
Note. The first 5 columns show the units of taxation on 10,000 units of repatriated interest worldwide. Column (6) follows from adding the numbers in columns 3 to 5 and dividing this by the total of columns 1 and 2. Column (7) follows from dividing the number in column 3 by the number in column 1.
Results for Royalties
The pattern for royalties is somewhat similar to that of interest – see Table 4c. Nearly all LMICs gain in their residence taxation. With royalties this would affect the possible location of intellectual property in these countries. The variation in WHT revenue losses is large. This ranges from nil for Angola, Ethiopia, India, Morocco, Nepal and Vietnam, to 85 per cent for Egypt. India, for instance, has no preferential treaty rates for royalties. In comparison with other countries and with interest, the average potential WHT revenue loss is small for LMICs. The revenue on WHTs also determines the overall tax revenue in this framework. Relatively Pakistan receives a lot of conduit taxation, but this does not compensate for revenue loss from withholding taxation.
Tax Revenue Results – Royalties.
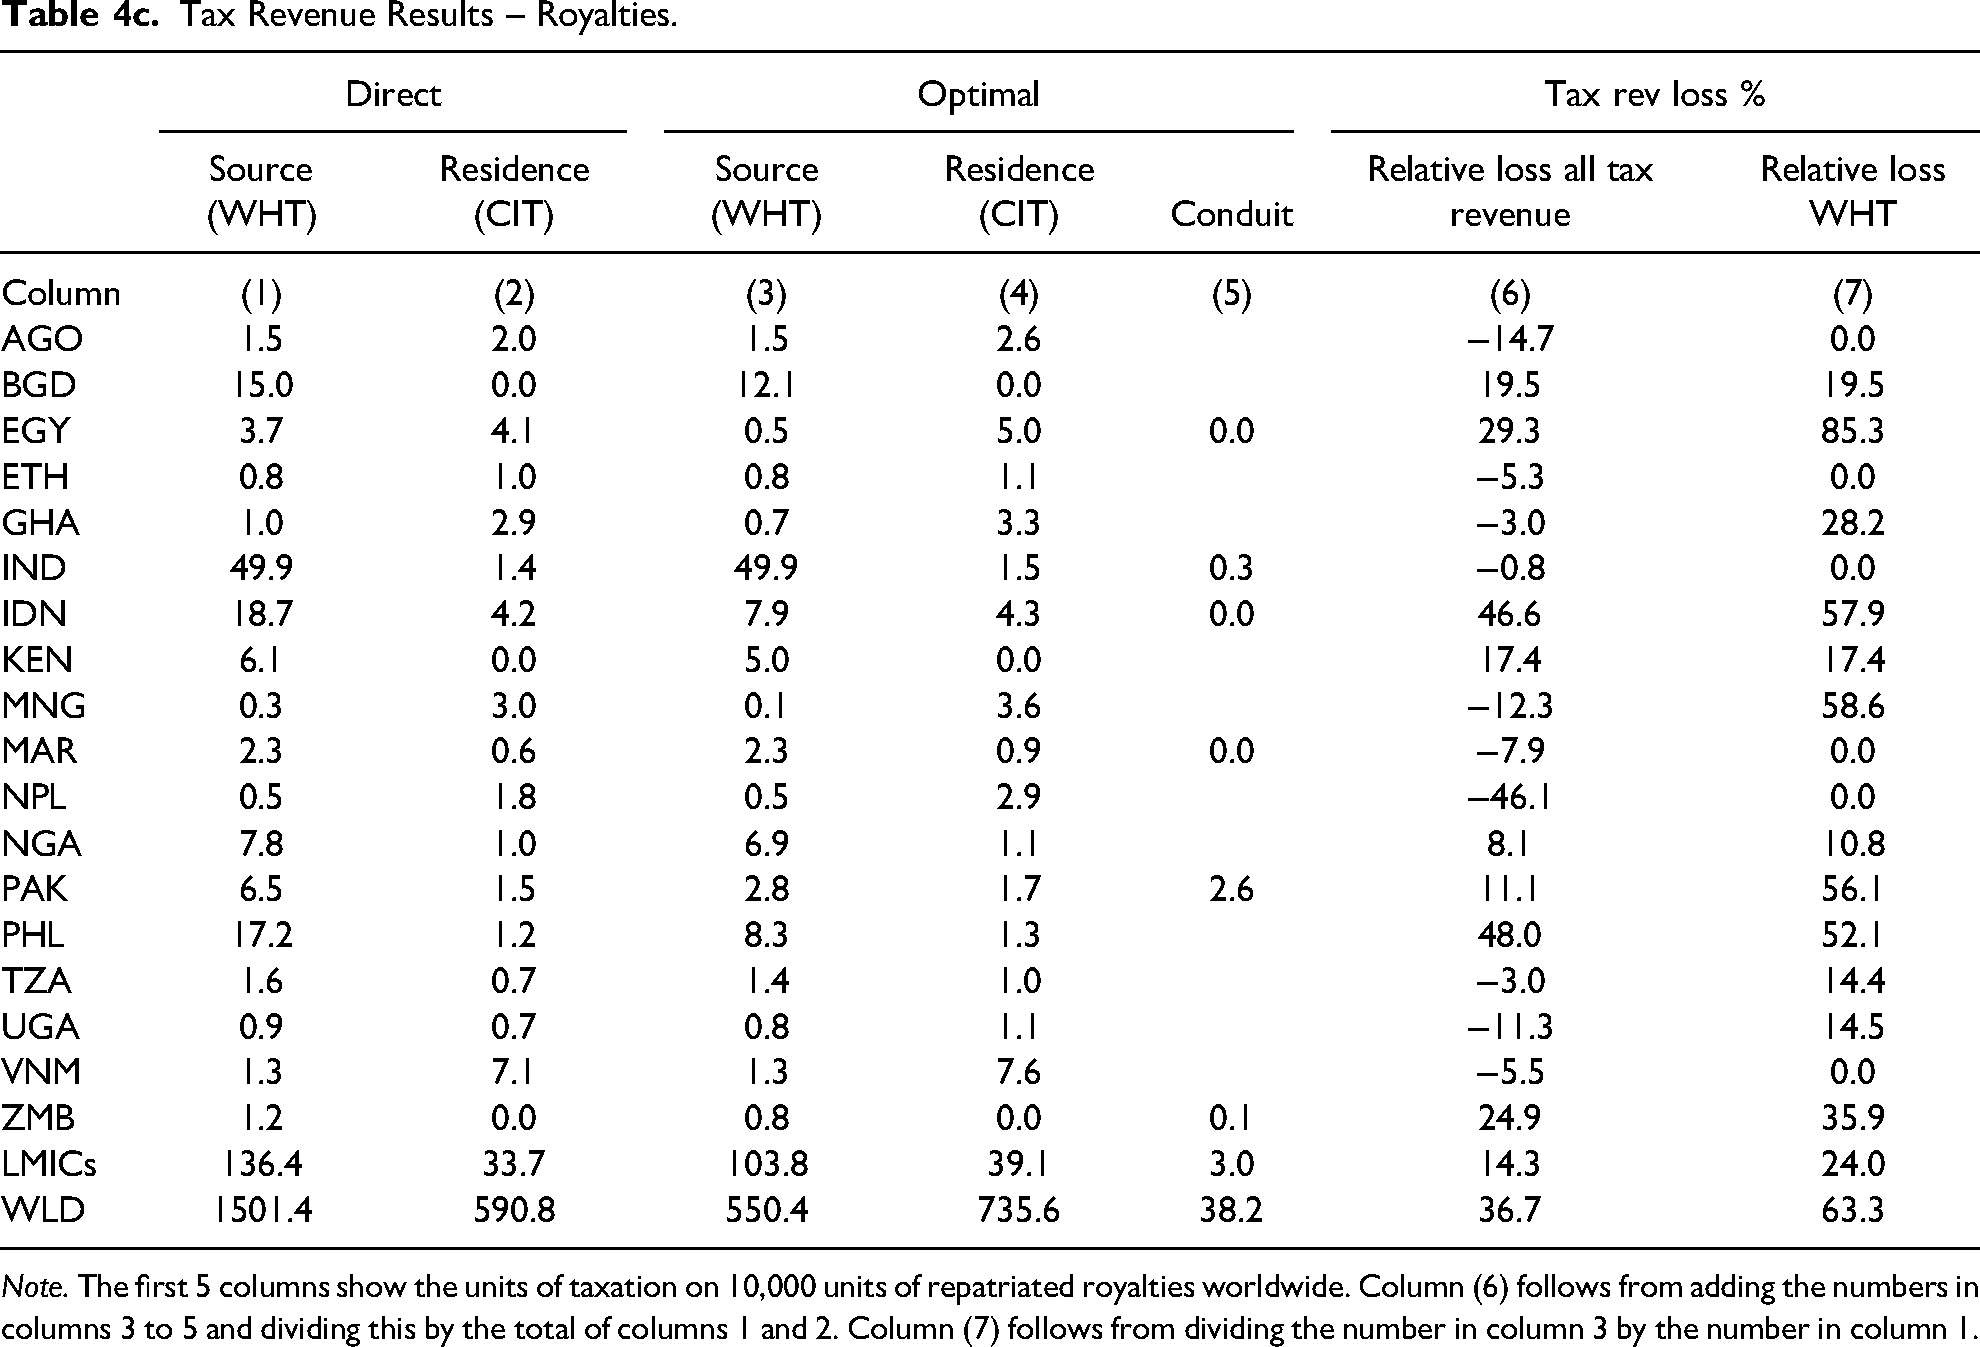
Note. The first 5 columns show the units of taxation on 10,000 units of repatriated royalties worldwide. Column (6) follows from adding the numbers in columns 3 to 5 and dividing this by the total of columns 1 and 2. Column (7) follows from dividing the number in column 3 by the number in column 1.
Potentially Aggressive tax Treaties – Bilateral Level
We proceed with withholding tax, because its revenue and losses dominate those of residence and conduit taxation. This focus also better reflects the position of low-income countries as capital importers. In the previous section we identified the share of WHT revenue for selected countries that will be foregone when MNEs chose their optimal investment routes. In this section we identify the tax treaties that are responsible for these losses. This concerns the first country on the optimal routes that lead to tax reduction (for the MNEs). This first conduit country is determined by a tax treaty concluded by the source country with a reduced WHT rate. Because most countries have a number of tax treaties, different treaties and thus partner countries can determine the first part in the optimal routes from a given source country. Therefore we again present shares. For each income type we present a table with the selection of LMICs as columns. The rows are the treaty partners that appear as the first intermediate country on optimal routes (to all other 117 countries). Only shares of 25 per cent or more are presented in the tables below, to focus on the most important treaty partners. As a consequence, LMICs that do not have a treaty partner with at least a 25 per cent share do not appear as a column in the tables.
Table 5a presents the share for repatriated dividends. For all dividend flows leaving the Philippines (PHL), Germany (DEU) is the first conduit country on all routes (100 per cent). The Philippines has a standard rate of 30 per cent, and reduced rates of 15 per cent or 10 per cent for a number of treaty partners – but only for Germany is there a rate of 5 per cent. As a member state of the EU, Germany is well connected to the rest of the world in minimising the taxation on distributed dividends.
Share (>25%) of Optimal tax Routes by Treaty Partner – Dividends.
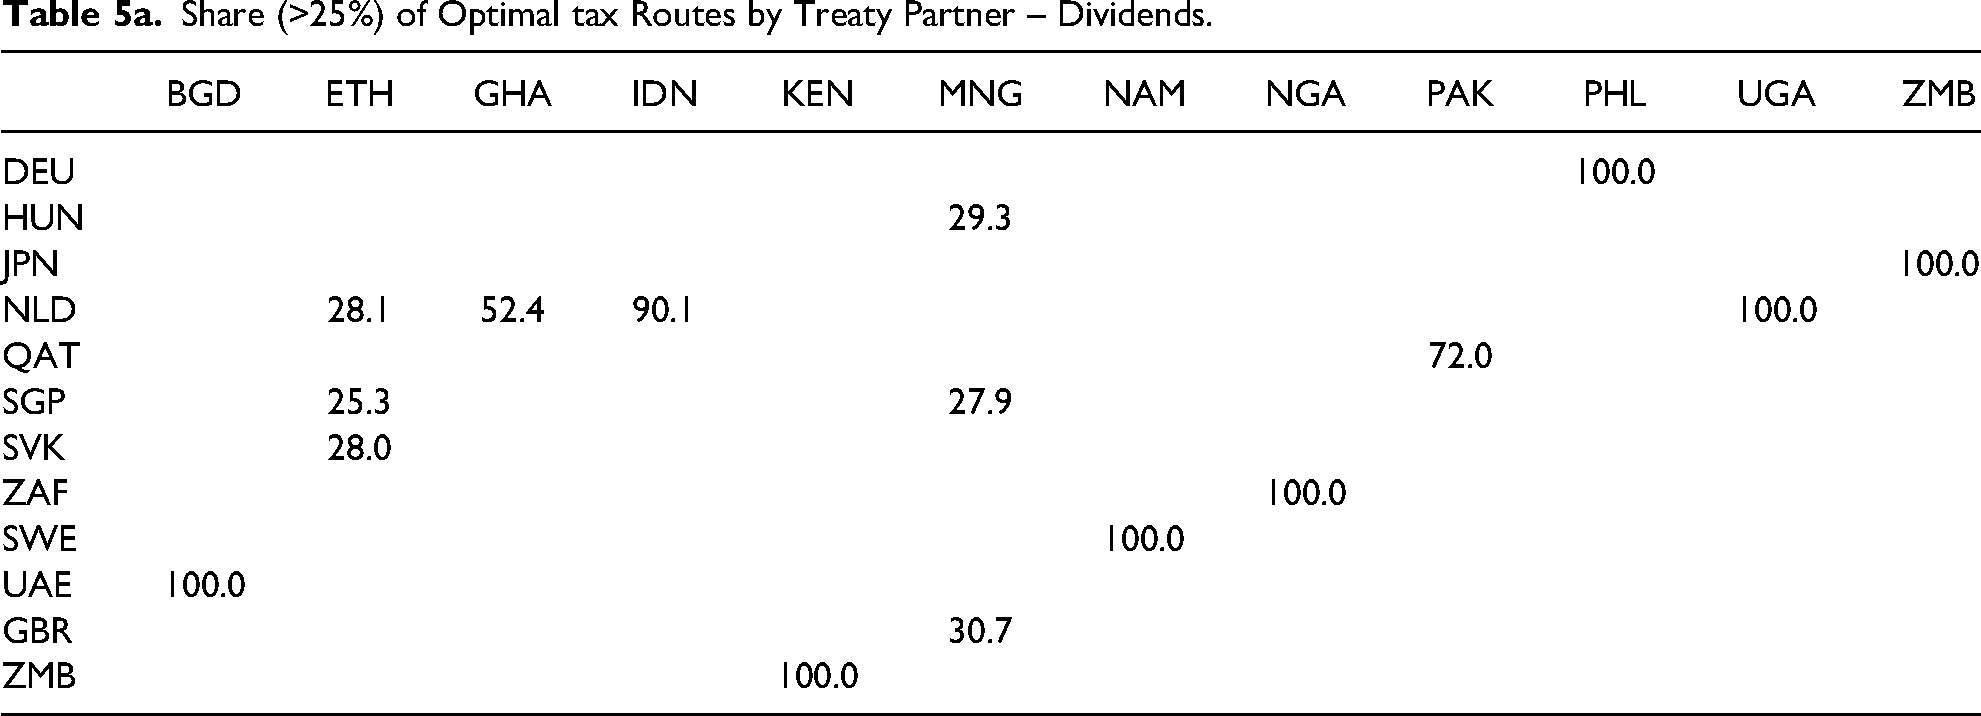
As a second example we look at Ethiopia. It has a standard rate of 20 per cent, but a reduced rate of 10 per cent for a number of treaty partners. Of these countries, there are three with a share of more than 25 per cent as a first stop on the optimal routes for dividend repatriation – the Netherlands, Singapore and Slovakia. All have conducted a treaty with Bangladesh with a reduced rate of 10 per cent on dividends.
One treaty partner is responsible for 100 per cent of the loss on WHTs on dividends in several other cases – Bangladesh (BGD), Kenya (KEN), Namibia (NMB), Nigeria (NGA), Uganda (UGA) and Zambia (ZMB). These losses are due to treaties with, respectively, the United Arab Emirates (UAE), Zambia (ZMB), Sweden (SWE), South Africa (ZAF), the Netherlands (NLD) and Japan (JPN).
Bangladesh has a standard rate of 20 per cent, for a number of countries a reduced rate of 15 per cent, for 20 treaty partners a 10 per cent rate, and only for the United Arab Emirates (UAE) a reduced rate of 5 per cent. This implies that not all revenue will vanish, but the revenue loss is substantial. Table 5a shows the revenue loss is 63 per cent. The treaty with the Netherlands is responsible for a 90 per cent loss for Indonesia (IDN). This is also due to the low rate on WHT agreed in the treaty.
Initially, in a first run, we found that the treaty with Ireland (IRL) was responsible for a 100 per cent tax loss for Zambia (ZMB) when the dataset contained the reduced rates from an old treaty (from 1971) between these two countries. Since 2016 a new treaty has been in force with higher rates, which are now used in the analysis. However, now the treaty with Japan is responsible for the revenue loss. The earlier outcomes illustrate the need for developing countries to review and possibly revise their tax treaties. However, if one treaty is revised another treaty can become critical for revenue losses, which can also require a review and revision of that treaty. At the same time it illustrates the sensitivity of the data for specific treaties and data sources on the outcomes.
Interestingly, our model identifies Zambia as a conduit country for all dividend flows from Kenya. Clearly, we do not state that this is the observed practice. The result emerges because Kenya's treaty with Zambia has, uniquely, a zero rate, compared to the statutory rate of 15 per cent and a few reduced treaty rates.
Table 5b shows the share of revenue losses regarding interest, again with the criterion that shares must equal or exceed 25 per cent. For three of the LMICs, Bangladesh (BGD), India (IND) and Indonesia (IDN), the tax revenue loss is caused by one country (100 per cent) – respectively the Netherlands, Switzerland (CHE) and the United Arab Emirates (UAE). The latter country is also the first stop on 95 per cent of tax-minimising routes from Kenya. Mauritius (MUS) is the first stop on routes for interest payments leaving Ghana (GHA), and the treaty with South Africa is responsible for nearly all potential WHT revenue losses in Nigeria. The Netherlands and United Arab Emirates seem to have three treaties in this set of LMICs that could cause large revenue losses on WHT on interest flows.
Share (>25%) of optimal tax routes by treaty partner – interest.
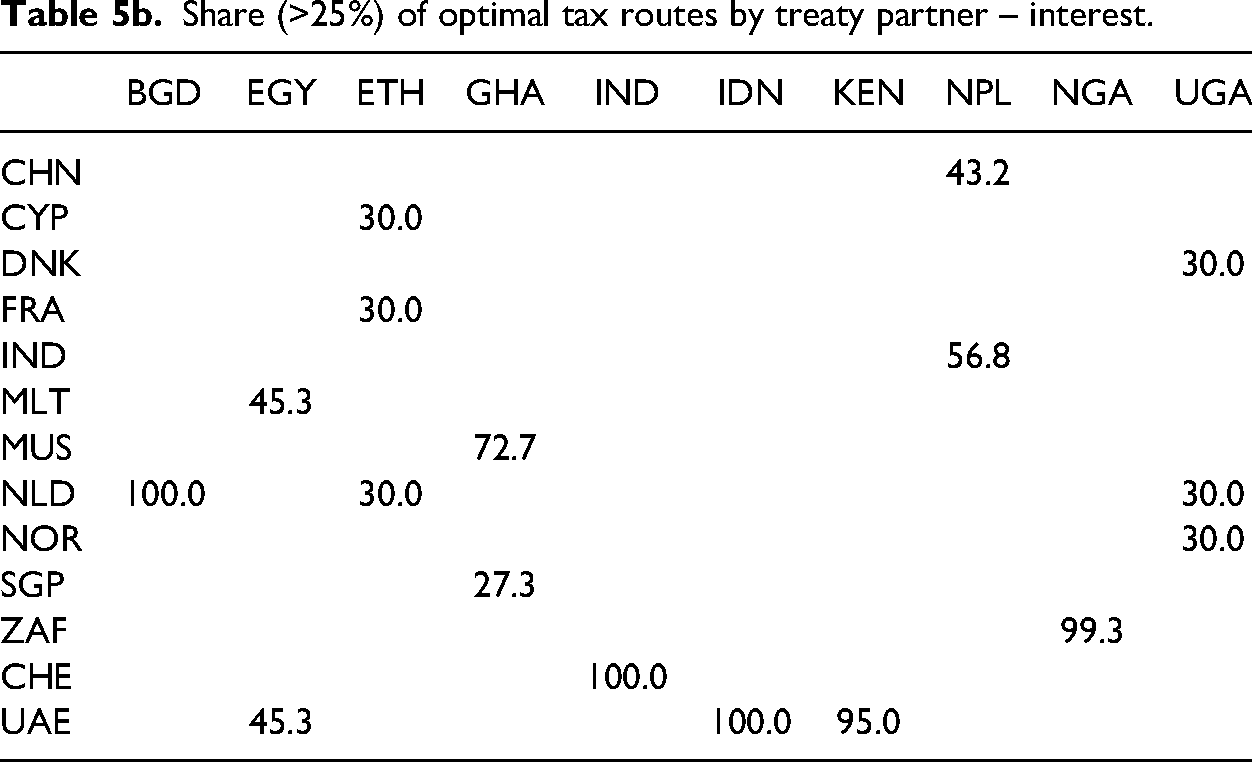
Table 5c presents the share for royalties. Among the treaty partners we observe the reappearance of a number of countries discussed above, which also have critical tax treaties with the LMICs concerning dividends or interest. Three countries are new: Austria (AUT), Ireland (IRL) and the US (USA). We explain the appearance of the latter. Pakistan has a default WHT rate of 15 per cent for outgoing royalty payments. We find a few reduced rates of 10 per cent in its treaties, such as a rate of 7.5 per cent for Spain, but only for the US is there a zero rate. Hence all optimal flows have the US as a first stop.
Share (>25%) of Optimal tax Routes by Treaty Partner – Royalties.
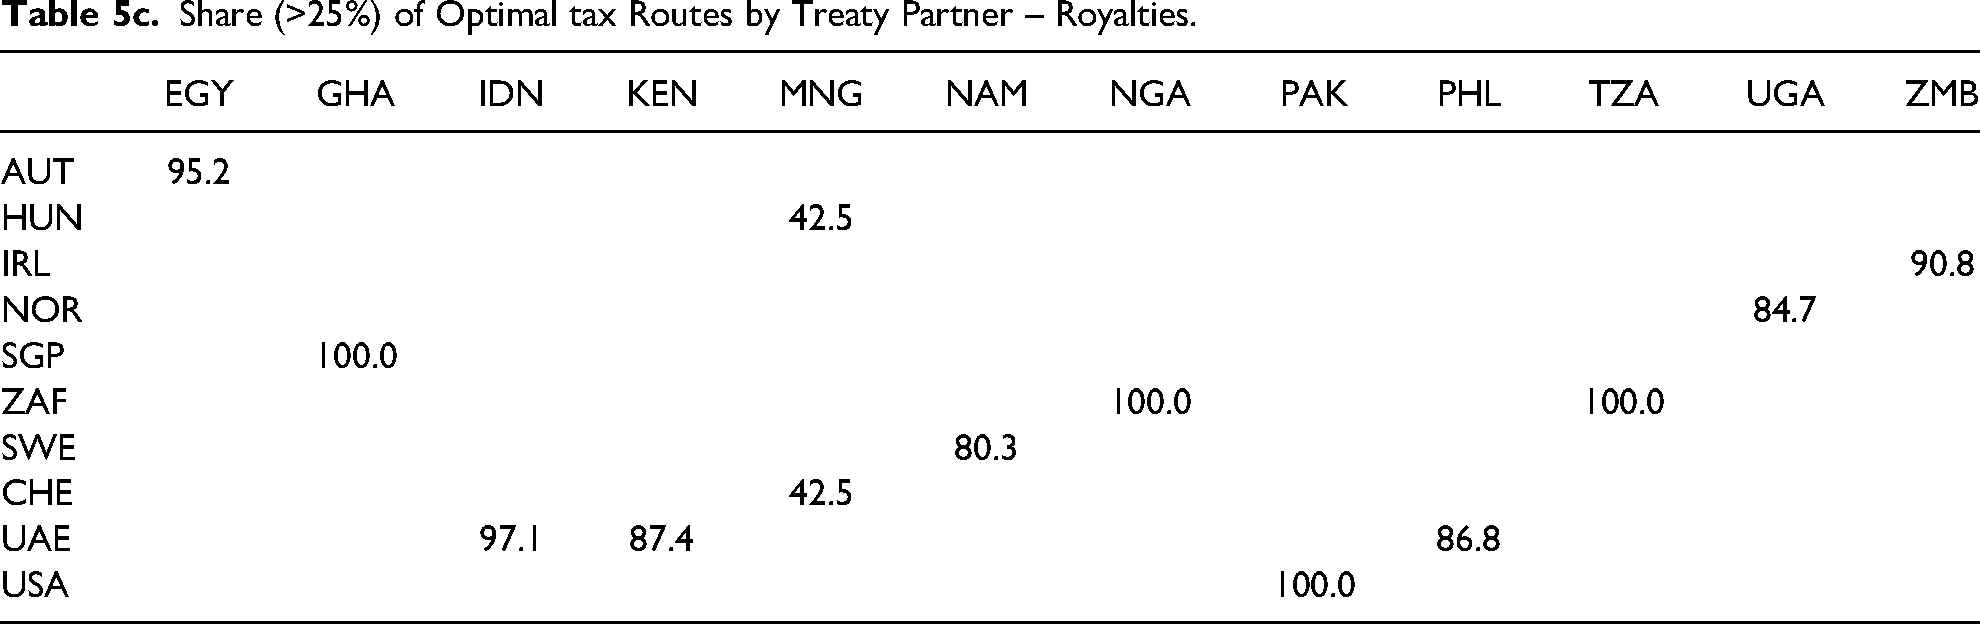
One conduit country is also responsible for all diversions for Ghana, Nigeria and Tanzania. These are Singapore and South Africa (for the latter two LMICs). For Egypt, Indonesia, Kenya, Philippines, Uganda and Zambia, one conduit country diverts nearly all royalty flows.
Identifying Potentially Aggressive tax Treaties
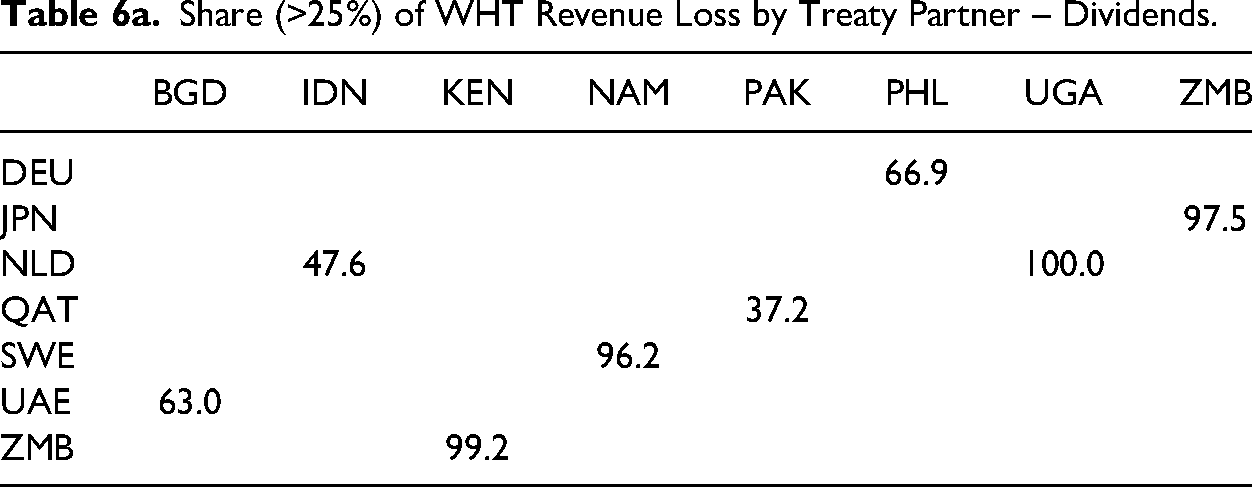
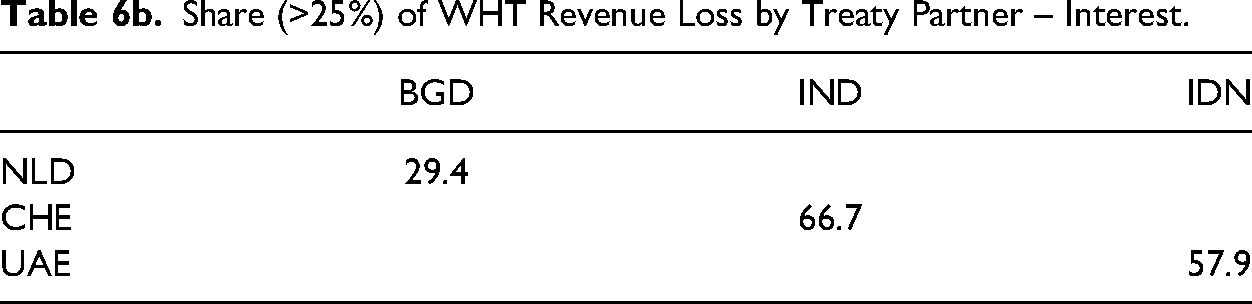
The final step in the approach is to multiply the share of tax revenue losses in Tables 4a-c with the share on diversion in Tables 5a-c. The results are found in Tables 6a-c. Again, we use a cut-off of 25 per cent, which is arbitrary, apart from that it yields an uncluttered set of results. Thus we deem a treaty as potentially aggressive when it is responsible for 25 per cent or more of the loss of WHT revenue with optimal treaty shopping, compared to revenue without treaty shopping.
Share (>25%) of WHT Revenue Loss by Treaty Partner – Dividends.
Share (>25%) of WHT Revenue Loss by Treaty Partner – Interest.
Share (>25%) of WHT Revenue Loss by Treaty Partner – Royalties.
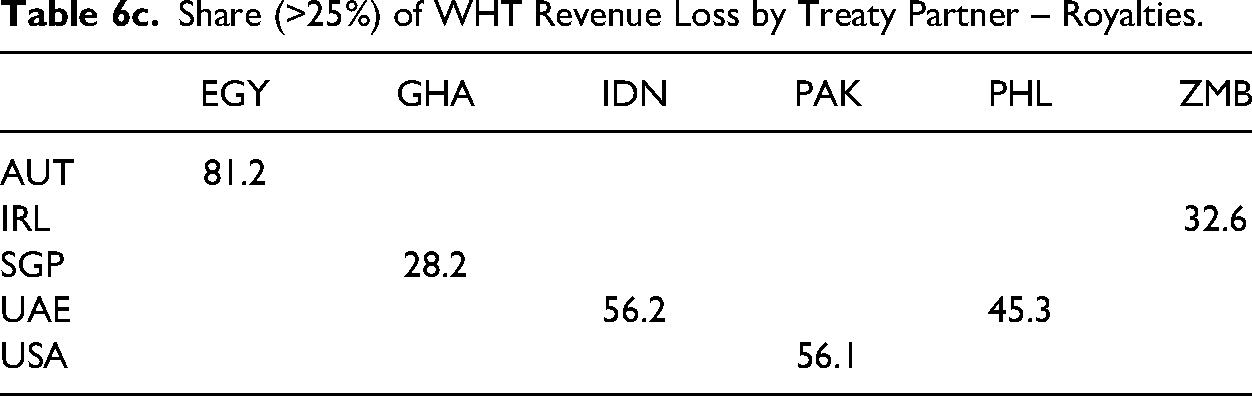
A modest number of treaties remain, with a number of treaty partners (the Netherlands, United Arab Emirates, Switzerland and Singapore) that are known from anecdotical evidence and empirical studies to be conduit countries (see the literature review before and the tax haven list in Gravelle (2009)). Most of the selected LMICs, 11 out of 18, are signatory to a potentially aggressive double tax treaty, some of them for more than one of the income types. In particular, Indonesia seems to be vulnerable to losing tax revenue by treaty shopping because of its treaty with the Netherlands for dividends, and its treaty with the United Arab Emirates for interest and royalty payments.
We observe that, even with a more conservative cut-off of 50 per cent, still about a dozen double tax treaties can be deemed aggressive, and this is for only a selection of LMICs. An international tax system with such a characteristic ought to cause concern.
There is no quick fix to the problem. The outcomes of a simulation in which all eight aggressive tax treaties regarding dividends are eliminated reveal that in some cases other treaties take their place and tax revenue loss is hardly reduced. These outcomes are reported in Annex A4. The overall lesson is that simple elimination of single aggressive treaties may result that alternative treaties take their aggressive role and tax revenue loss may still be significant.
Global Minimum Tax and Treaty Shopping
In addition to identifying potentially aggressive tax treaties we explore the role of these treaties with the introduction of the Global Minimum Tax (GMT). We will show that for LMICs this is especially relevant when they offer tax incentives to attract investment and activities of MNEs. This section is not intended to be a full discussion of the GMT and developing countries.
The G20/OECD GMT agreement stipulates an effective tax rate of 15% on the profits of multinational enterprises (MNEs) with (consolidated global) revenue above EUR 750 million. Since January 2024 a number of countries, such as the EU Member States, have begun to implement the GMT rules (and are transposing it into their national legislation). 23 These rules are introduced below as GloBE rules. Importantly, the signatory countries not yet introducing the rules do accept the application by others, possibly implying the forfeiting of some of their taxing rights. We notice that some LMICs have not signed the Pillar Two agreement (Kenya, Nigeria, Pakistan) and many others have not implemented it yet. First, we present the GMT rules and next we briefly discuss tax incentives that may bring effective taxation below the global minimum rate.
GloBE Rules 24
The Global Anti-Base Erosion (GloBE) rules start with determining for an in-scope MNE group the effective tax rate (ETR) by jurisdiction where it operates. The ETR equals the ratio of taxes paid in the jurisdiction (covered taxes) and the GloBE income in that same jurisdiction. The difference between the global minimum tax rate of 15% and the ETR is the rate for the top-up taxation.
The tax base for the jurisdictional top-up taxation is calculated as GloBE Income 25 in excess of the Substance-Based Income Exclusion (SBIE), which excludes a ‘routine’ return from the GloBE tax base. GloBE Income includes all profits and losses of entities in the same jurisdiction of a subgroup of in-scope MNEs. The SBIE excludes a share of GloBE Income from the tax base under the GloBE Rules, based on the amount of tangible assets and payroll reported in a jurisdiction. There are different rules governing the SBIE, which we are not addressing here, for some details see Hugger et al. 2024.
Following the top-up rate and tax base the question arises where the top-up taxation will take place, by which jurisdiction it is collected. There is a strict hierarchy of rules, or GMT agreed rule order, with three rules or principles: the Qualified Domestic Minimum Top-up Tax (QDMTT), the Income Inclusion Rule (IIR) and the UnderTaxed Profits Rule (UTPR).
Undertaxed profits are identified in a ‘low taxed constituent entity’ that is part of an MNE group depicted in Figures 2 and 3. The jurisdiction in which the undertaxed entity is resident with the undertaxed profits can collect the top-up tax itself by implementing a QDMTT (Panel a). Any top-up tax remaining after the application of QDMTTs can be collected by the UPE resident jurisdiction under the Income Inclusion Rule (IIR, Panel b). If the IIR has not been implemented by the UPE jurisdiction, top-up taxes can also be collected under the IIR by the jurisdiction that provides tax residence to an intermediate parent entity (IPE, Panel c). The IIR will generally apply where jurisdictions choose not to implement a QDMTT.
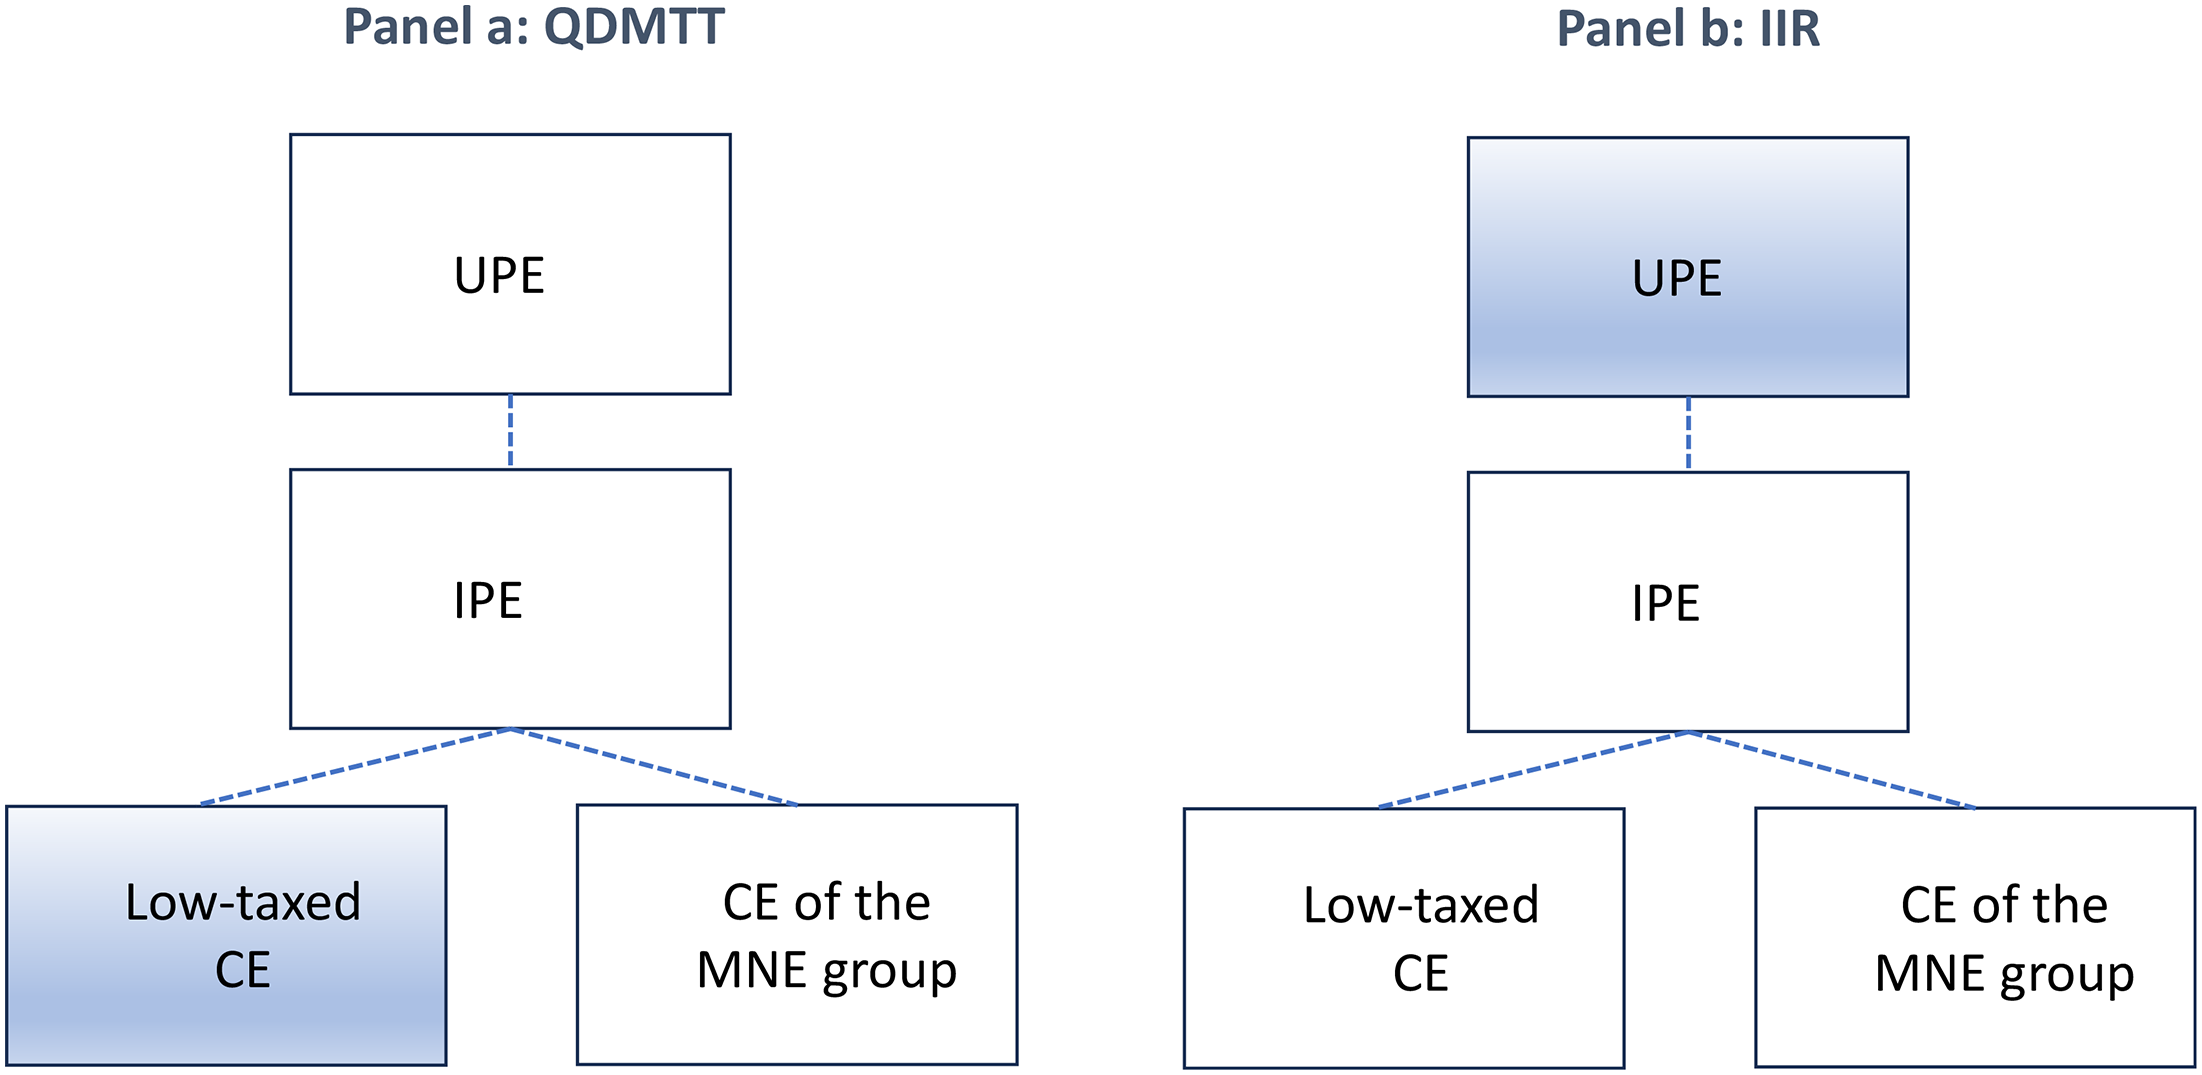
GMT agreed rule order - panels a. and b. (QDMTT and IIR). Note. QDMTT = Qualified Domestic Minimum Top-up Tax, IIR = Income Inclusion Rule, UTPR = UnderTaxed Profit Rule. And UPE = Ultimate Parent Entity, IPE = Intermediate Parent Entity and CE = Constituent Entity. The Figure is taken from Hugger et al. (2024). Source. OECD (2023).
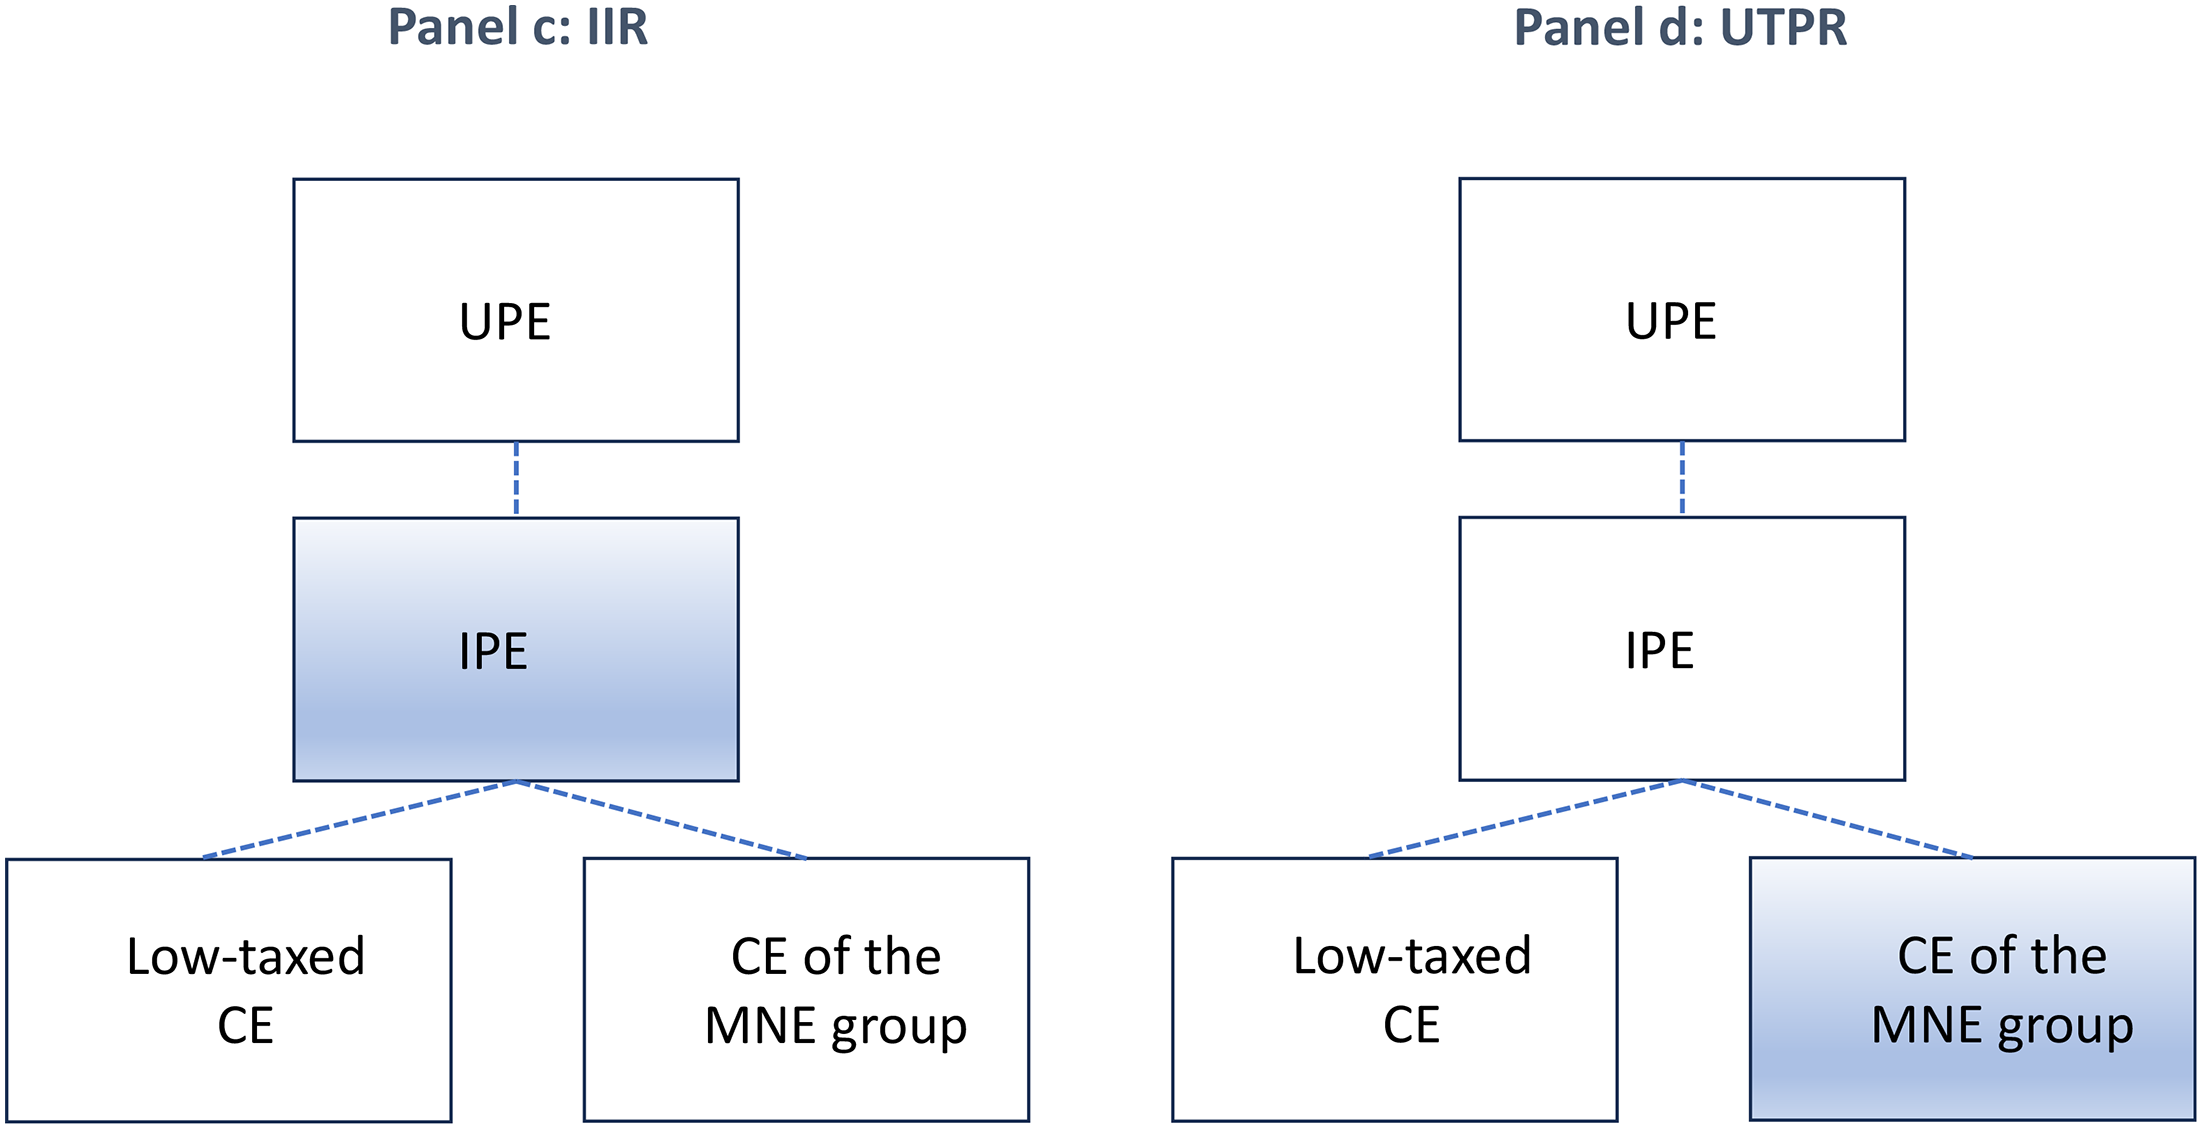
GMT agreed rule order : panels c. and d. (IIR and UTPR). Note. QDMTT = Qualified Domestic Minimum Top-up Tax, IIR = Income Inclusion Rule, UTPR = UnderTaxed Profit Rule. And UPE = Ultimate Parent Entity, IPE = Intermediate Parent Entity and CE = Constituent Entity. The Figure is taken from Hugger et al. (2024). Source. OECD (2023).
Finally, if any top-up tax still remains, it can be imposed by multiple jurisdictions under an implemented UTPR (Panel d). The UTPR is a backstop to ensure that all low-taxed income is captured under the GMT. Each jurisdiction which has adopted the UTPR can collect the top-up tax in proportion to the amount of substance of the MNE group in the jurisdiction, where substance is measured by tangible assets and employees at equal weights. These interlocking rules mean that the top-up tax collected by a given jurisdiction depends on the actions of other jurisdictions.
Thus, when a jurisdiction with undertaxed profits does not have a QDMTT in place, the UPE jurisdiction is the first to top-up tax. Next in line to top-up tax is the jurisdiction of the IPE. The latter typically is a conduit country of an attractive treaty shopping route. The treaty partners of the potentially aggressive tax treaties are therefore especially well positioned to effectuate the global minimum tax and raise tax revenue where they could not before.
All this only applies to undertaxed profits, leading to an ETR below the minimum rate. In the context of cross-border income flows it is important to know to which jurisdiction non-resident withholding taxes are allocated. With profits distributed to foreign ultimate or intermediate parents the withholding taxes are part of the covered taxes in the source jurisdiction. For international interest and royalty payments the withholding taxes paid in the source jurisdiction are attributed to the covered taxes in the recipient jurisdiction, for the purpose of the computation of the ETR.
Special Economic Zones and Other tax Incentives
The statutory corporate tax rates of nearly all LMICs are above the GMT rate of 15%. This seems to suggest that the Pillar Two issues would not apply. Yet, countries provide a range of special tax incentives to firms to attract their investment and activities, see for instance Celani, Dressler and Hanappi (2022). They compute effective tax rates for seven Sub-Saharan countries in two sectors and in Special Economic Zones (SEZs) and find significant reductions of the ETRs, and the most generous tax treatment is typically offered within SEZs. Celani, Dressler and Hanappi (2022) state ‘in some specific cases tax incentives can reduce ETRs to nearly zero’.
This strategic behaviour of countries may lead to a tax race to the bottom. The GMT of the OECD's global tax reform initiative is meant to stop this race. However, the proposal allows for substance-based income exclusion (carve-outs). Perry (2023) argues that this means that competition remains possible, and discusses the complexity of the strategic choices for low-income countries. With given corporate income tax (CIT) rates in the source countries, our analysis cannot directly contribute to the tax competition discussion of Pillar Two. We focused above on an upper bound of the cost of treaty shopping, ignoring any anti-abuse and minimum tax rules. However, we can confront the GloBE rules with the information on the treaty shopping routes.
The problem that arises with GMT is that other countries may top-up tax the undertaxed profits where incentives have led to low ETRs. This nullifies the possible investment effects of these incentives, as the MNEs will face the interlocking rules in order to tax until the ETR of 15% is met. And, in addition, these other countries also appropriate the tax revenue. It is outside the scope of this paper to comment on the best strategy for developing countries in this respect. Others have been critical of tax incentives and SEZs and advise to re-visit and evaluate them (Celani, Dressler and Hanappi 2022; Waruguru Ndubai-Ngigi 2024).
In our set of LMICs three countries have SEZs: Kenya, Morocco and Zambia. Special reduced CIT rates below 15% exist for Angola and Ghana, respectively 10% and 8%. Angola and Zambia have signed the Pillar Two agreement, Kenya has not. 26 QDMTTs have not been adopted. In contrast, the typical conduit countries, and treaty partners of potentially aggressive tax treaties, have signed the Pillar Two agreement, and have adopted the IIR (Netherlands, Switzerland, Singapore). These examples illustrate the possibility that the investment effects of tax incentives by LMICs being nullified by tax treaty partners through their use of top-up taxes. We observe that the tax incentives may apply to MNEs that are not in-scope and hence top-up taxation will not be in order.
A final remark concerns the interest and royalty payments from LMICs to low tax jurisdictions, with a CIT rate below 15%. Fifteen countries in our set have lower rates, including tax havens. With treaty shopping, the combined taxation of withholding taxes and CIT in the recipient jurisdiction, taxation remains below the minimum rate in most cases. This implies undertaxed profits in the recipient, low tax jurisdiction. This can be top-up taxed by 1) the recipient low tax jurisdiction (QDMTT), 2) the ultimate parent jurisdiction (IIR) or 3) the source LMIC (UTPR). Clearly, the GMT is meant to make this sort of profit shifting flows to disappear and is likely to do so for treaty shopping routes in which at least one country has implemented the GMT.
Conclusion – Summary, Policy Suggestions and Limitations
Optimal tax routes for MNEs are simulated in this quantitative study. These routes minimise tax costs for these enterprises for distribution of dividends, interest and royalty payments. These routes involve tax treaty shopping over the international tax system. The potential loss of tax revenue for a selection of LMICs are found to be somewhat lower than potential losses for the entire set of countries. This holds for all three income types.
Although several articles in the literature suggest that developing countries are relatively more hurt by international corporate tax avoidance by multinational firms than other countries 27 we find relatively small effect for potential losses by treaty shopping. Treaty shopping is, of course, only one of the tax avoidance strategies, and probably not the most important one but IMF (2014) warns for the vulnerability of developing countries for treaty shopping.
A main reason is that the bilateral WHTs of developing countries are, on average, already lower than those of developed countries, in particular for dividends, so that the (relative) revenue losses from WHTs are also lower. However, the average loss of revenue masks large differences between countries, which suggests that we have to look more in-depth. Countries like Bangladesh, Egypt, Indonesia, Kenya, Uganda and Zambia are seriously vulnerable to losing WHT revenue due to treaty shopping.
The potential losses result from multinational firms exploiting beneficial arrangements in specific treaties, as already noted by Beer and Loeprick (2021) and pointed out for treaties of African countries with Mauritius. Examples in this study are the Philippine-Germany treaty, Uganda-Netherlands treaty, and the treaty between Bangladesh and the United Arab Emirates for dividends.
The United Arab Emirates’ treaty with Indonesia potentially leads to all revenue loss of WHT on outgoing interest. The same applies for the Bangladesh-Netherlands and India-Switzerland treaties. These are examples of treaties we refer to as potentially aggressive. Our, admittedly somewhat arbitrary, benchmark is that the tax revenue loss for the national government exceeds 25 per cent of the WHT revenue. We find a number of these treaties for dividends, interest and royalties. They are illustrative of the potential that the system contains for multinationals to minimise their taxes, and corroborate some anecdotical and empirical evidence on specific treaties.
A first policy suggestion would be to renegotiate these treaties, keeping an eye on other treaties to avoid them becoming a new channel for loss of tax revenue.
A second policy suggestion from these outcomes and comparisons is that developing countries could set higher standard WHTs, in particular on dividends. If countries do not set higher standard rates, they could also decide not to lower these rates in a bilateral treaty, because the standard rate is already low. This policy option also reduces the possibility of treaty shopping. Having a minimum rate, or, preferably, equal rates for WHTs in all treaties, is another suggestion that follows from the analysis in this paper.
A specific advantage for firms in one country can lead to a complete loss of revenue, as the examples above and analysis in this paper suggest. Of course, lower rates raise the after-tax return on investment, possibly attracting investment. But our analysis here shows that an advantageous treaty could have major consequences beyond the bilateral relations between the two treaty partners. Treaty negotiators in all countries should be aware of this. In particular, if the treaty is with a prospective partner having favourable tax incentives with other countries – think of members of the European Union – the treaty could be exploited by many multinationals present in other countries.
Finally, we list a number of limitations of the study. Next to the three income types that have been examined, there is remuneration for management and technical services. These payments are deductible from taxable income in the source country. They could be, and sometimes are, subject to withholding taxation. There seems to be ample scope for tax planning with these services, such as embedded royalties. This income type is not included in the network analysis. Moreover, tax treaties have other arrangements, such as for taxing capital gains and requirements for permanent establishment, which are not included in this study.
In line with the above limitation, other forms of tax planning, such as transfer pricing manipulation or tax deferral, have not been taken into account. This paper only concentrates on treaty shopping and the role of specific tax treaties on revenue in developing countries.
We also ignore the question of why countries, developing or not, conclude bilateral tax treaties. 28 The obvious answer is that they expect to be better off with them. These benefits are often related to more FDI, employment and economic growth, although the treaties also contain provisions for better cooperation between tax authorities. This beneficial side of the treaties, required for an overall assessment, is outside the scope of this work. Moreover, the literature assessing these benefits tries to identify a causal relation between the treaties and FDI, and the outcomes remain inconclusive. 29
And, last but not least, the Global Minimum Tax changes the playing field. Minimum rates for corporate income tax and/or withholding tax could seriously affect the attractiveness of various bilateral tax treaties for treaty shopping. This will not only have a positive effect on tax revenue, but could also have a negative effect on FDI. The analysis of Petkova, Stasio and Zagler (2020) suggests that the treaties effectively used in treaty shopping are also the ones that have a positive impact on FDI. However, developing countries may not benefit from these higher tax revenues.
When they do not have the provision in place to top-up tax the undertaxed profits of MNEs reported in their country themselves (QDMTT), other jurisdictions where the MNE group operates may top-up tax these profits, or a part of these profits. Jurisdictions well placed to execute this cross-border taxation are the conduit countries on treaty shopping routes starting in the developing countries. These conduit countries may apply the Income Inclusion Rule, as they host the intermediate parent entities. The outcome could be that the developing country does not receive extra tax revenue and also does not benefit form higher foreign direct investment because the returns are taxed in the conduit countries.
Footnotes
Acknowledgements
The authors thank Martin Hearson, and two anonymous referees for their helpful and constructive comments.
Declaration of Conflicting Interests
The authors declared no potential conflicts of interest with respect to the research, authorship, and/or publication of this article.
Funding
The author(s) disclosed receipt of the following financial support for the research, authorship, and/or publication of this article: ICTD Contract No: 21/498 Project No: GV/21007, Both autors each 2500 English pounds. International Centre for Tax & Development, (grant number Contract No: 21/498 Project No: GV/21007 2 x 2500).