
Abstract
Two dimensions of the intensity of interparty rivalry are used to test the hypothesis that greater interparty competition enhances government efficiency. Using data from a set of 14 large Indian state governments between 1957 and 2018, we find confirmation for two political rivalry hypotheses. The first is that the ex-post size of the first versus second place seat share winning margin is a useful metric of the (in)effectiveness of rival party policing of incumbent spending behavior. The second is the hypothesis that excessive spending by the incumbent governing party is decreased by the expectation of greater election contestability and that contestability is related to the expected effective number of competing parties (ENPSeats) nonmonotonically. Our analysis suggests that contestability across Indian States reaches a maximum when the incumbent faces an expectation of ENPSeats that is closer to 5 than to Duverger's 2.
Keywords
Introduction
It is increasingly common for both political scientists and economists to see political party rivalry within democratic political systems as being multidimensional, affecting the functioning of many areas of government policy and operating with varying degrees of effectiveness on the delivery of government services (Bartolini 1999, 2000; Winer and Ferris 2022). Competition among parties for the right to govern is seen as providing the incentive for political parties to promise programs that better respond to the wishes of voters (Downs 1957; Laver 2005); for holding party winners accountable for their program promises (Ferejohn 1986; Jones 2013; Persson, Torsten and Tabellini 1997); for improving the quality of party representatives and decision makers within government (Buchler 2011; De Paola and Scoppa 2011); and for producing policies that benefit, rather than opportunistically disadvantage, the overall electorate (Hillman and Ursprung 2016; Wittman 1989). And in each of these cases, more successful performance is thought to depend on greater party competitiveness. To test these hypotheses, economic outcomes, government budget responsiveness, overall government size and its composition have been related to a variety of political and electoral measures of competitiveness (Besley, Persson and Sturm 2010; Ferris, Park and Winer 2008; Rogers and Rogers 2000; Skilling and Zeckhauser 2002; Winer et al. 2021). In many of these cases, greater rivalry is found to be associated with superior performance (see, however, Winer and Ferris 2022, chp. 4).
In India the role of electoral competition in improving the quality of state government policy, restraining government size, and raising economic outcomes has long been appreciated. Besley and Burgess (2002), for example, demonstrate how the provision of more relevant electoral information induces a party program response that results in state spending more responsive to voters’ wishes. This efficiency conclusion is reinforced by Ghosh (2010) who finds higher state incomes and faster economic growth associated with greater electoral competition. At the sectoral policy level, Besley and Burgess (2002) find greater party competition leads to a faster response to flood disasters while Kailthya and Kambhampati (2022) find that greater party competition increases state health expenditures that in turn have improved health outcomes. Dash and Mukherjee (2015) show that these competitive benefits extend more generally, producing higher overall levels of human development. As an alternative to using winning margins as a measure of the competitiveness of party rivalry, Chhibber and Nooruddin (2004) argue that political competition works through party structure and find that multiparty states have lower public good expenditure than do states with two dominant parties.
Perhaps most widely studied has been the role of electoral competition in moderating the opportunism that can result in a political business cycle. Thus, while arguing that many dimensions of political influence do matter for the choice of government policies, neither Khemani (2004), Chaudhuri and Dasgupta (2006) nor Dash and Raja (2013) find evidence to suggest that aggregate state expenditures or budget deficits increase in the year or year prior to an election. Rather, writers including Khemani (2004, 2007) and others such as Kohli (2021) and Ferris and Dash (2019) find evidence of political cycles arising in various subcomponents of the state budget. Finally, it is important to recognize that not all forms of political competition have been found to be beneficial. In the case of Indian states, writers such as Acharya et al. (2015), Bauman and Leech (2012), and Driscoll (2018) have found that electoral competition based on caste, ethnicity, and/or patronage has led to higher levels of corruption and/or electoral violence.
In contrast to these approaches, we are concerned not with electoral competition nor with the expenditure size of government per se but with the efficiency of government economic performance between elections and the role of political parties in minimizing the agency costs that arise in political party governance (Jensen and Meckling 1976; Persson and Tabellini 2000, chp. 4). Here, agency costs are interpreted broadly as the use of government resources to further private party interests that are in addition to those valued by voters. To test these hypotheses, we use the ex-post closeness of an election as a metric of the extent to which the winning party can exploit its electoral success. That is, large realized winning margins leave political party rivals in the legislature less able to influence the behavior of the incumbent party and so police the dissipation of governance rents through excessive spending. However, while large victories increase the incumbent's opportunity to redistribute at the cost of the electorate, the willingness of the incumbent to take advantage of its current advantage depends upon the degree to which the upcoming election is expected to be contestable. In Duverger's view, effective competition in winner-take-all elections leads the effective number of parties (ENP) to converge on two (Duverger 1954). As ENP falls toward two, the credibility of the incumbent's rival as a viable alternative to govern increases, restraining the incumbent's willingness to exploit its temporary advantage (Dash et al. 2019; Demsetz 1968). On the other hand, as the number of effective competitors falls toward two, the parties remaining have a greater opportunity to collude at the expense of the electorate so that contestability is likely to fall. These two considerations raise the possibility of a nonmonotonic relationship arising between ENP and excessive government size.
The idea that the effect of political competition on economic performance through government policy may be nonmonotonic is not new and has been argued by Acemoglu and Robinson (2006) and tested for (and confirmed) by authors such as Leonida et al. (2015) and Alfano and Baraldi (2015). In these cases, the relationship between the number and/or effective number of political parties and economic growth is found to be U-shaped; that is, political competition is less effective in its effect on growth when the effective number of rivals is either too few or too many. In Ferris and Voia (2023), a U-shaped relationship is found in the relationship between the effective number of political parties (ENPSeats) and excessive government size in Canada. Here, we test for the presence of a similar relationship on a panel of Indian states.
India like Canada provides a good opportunity against which to test hypotheses that highlight interparty rivalry. Both have Westminster-based majoritarian parliamentary governments with federal structures that consist of multiple states (provinces) governments with often widely different industrial and resource bases and with populations that encompass significant linguistic, religious, and ethnic differences. Perhaps because of this, both countries have been recognized as exceptions to Duverger's Law that under majoritarian election rules the effective number of political parties will convergence on 2. 1 In India, it is not unusual for state elections to feature as many as 100 competing parties with up to a dozen parties holding one or more seats in the state legislature. 2
The paper proceeds in
Finally, while Indian state data are found to be consistent with the hypotheses advanced and despite the temporal separation of independent and dependent variables that mimic the causal relationships implied, the estimates remain correlations that cannot preclude the influence of hypotheses implying reverse causation. This seems less likely in the case of large ex-post winning margins and excessive spending but may be more of a concern with the expected values of ENPSeats, particularly in rural and lesser developed Indian states where clientelism is often argued to be a more established electoral practice. 3
Between Election Rivalry Hypotheses
If greater political party rivalry can be viewed as reducing excess government size, to what measure of size is it viewed as being excessive? Following Ferris et al. (2008), we assume that an established democracy such as India's can be viewed as achieving a level of competitiveness sufficient to produce the convergence of government size onto an equilibrium time path reflective of the country's underlying fundamentals (the tastes of its voters, its resources, and underlying technology). Such an equilibrium will incorporate a level of agency cost that is consistent with voters’ expectation of “typical” government shirking behavior. However, during any party's governing tenure political and economic shocks, along with unexpected changes in a country's fundamentals, will result in period-specific variations to both the degree of party competitiveness and the level of government spending. For example, the timely revelation of political scandal, the unexpected performance of a new party leader, the unanticipated arrival of a financial crisis or pandemic can all be expected to produce an election outcome and/or government size that differs from what was expected. The hypothesis that is tested below is that these two sets of departures will be related such that ex-post closeness, measured as the size of the elected party's seat share winning margin (SeatMargin), will be related positively to the size of the discrepancy between actual and expected long-run government size. 4 The larger is the winning margin, the smaller will be the main opposition party's representation on parliamentary committees, the less informed will the opposition be to exploit question period and hence the greater will be the opportunities for the governing party to exploit its realized electoral advantage. With a larger mandate from voters, party leaders have greater credibility with the press, diminishing the opportunities the opposition has to effectively present their criticism and policy alternatives to voters. 5
The degree to which the current governing practices of the governing party are constrained by party rivalry also depends on how credible rival parties are as challengers to the incumbent and hence on how contestable the upcoming election is. While the incumbent must worry about being replaced by any party (weighted by their likelihood of winning), rival party criticism will be more meaningful to voters (and hence to the incumbent) if the proposed alternatives are more likely to be implemented (Laakso and Taagepera 1979). Hence, the winner-take-all nature of plurality elections and the associated unwillingness of voters to waste their vote on an unlikely winner lead competition to winnow the expected number of party numbers toward 2 (Duverger 1954). This implies that the more fragmented is the opposition (the larger is the expected number of political parties, ENPSeats), the less effective will be party competition and hence the larger will be agency costs and government size. 6 On the other hand, as the number of effective competitors falls toward two, the smaller numbers raise the opportunity for the remaining now dominant parties to collude, facilitating greater partisan spending in areas that are less visible to voters. 7 This will be reflected in the mutual acceptance of certain accepted institutionalized perks that can be enjoyed while in office. That is, as ENPSeats converges upon 2, the less intensely will rival parties choose to police agency costs. In combination these reasons imply that the relationship between (excessive) government size and ENPSeats is expected to be nonmonotonic, initially falling as ENPSeats rise above two before rising again as party fragmentation increases.
The Data
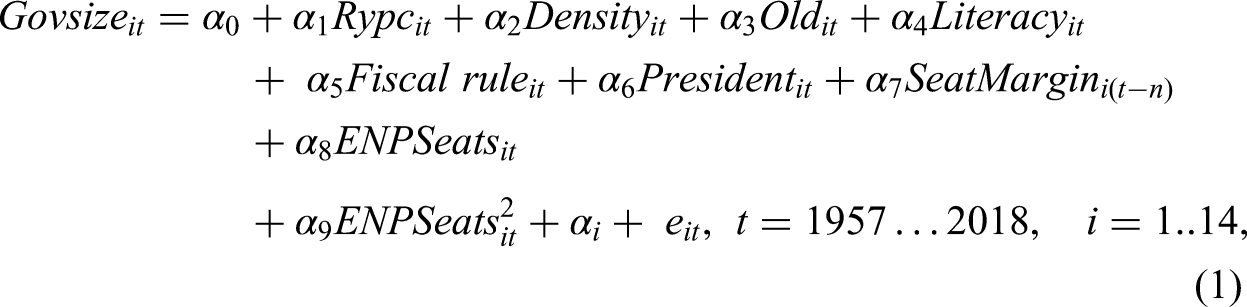
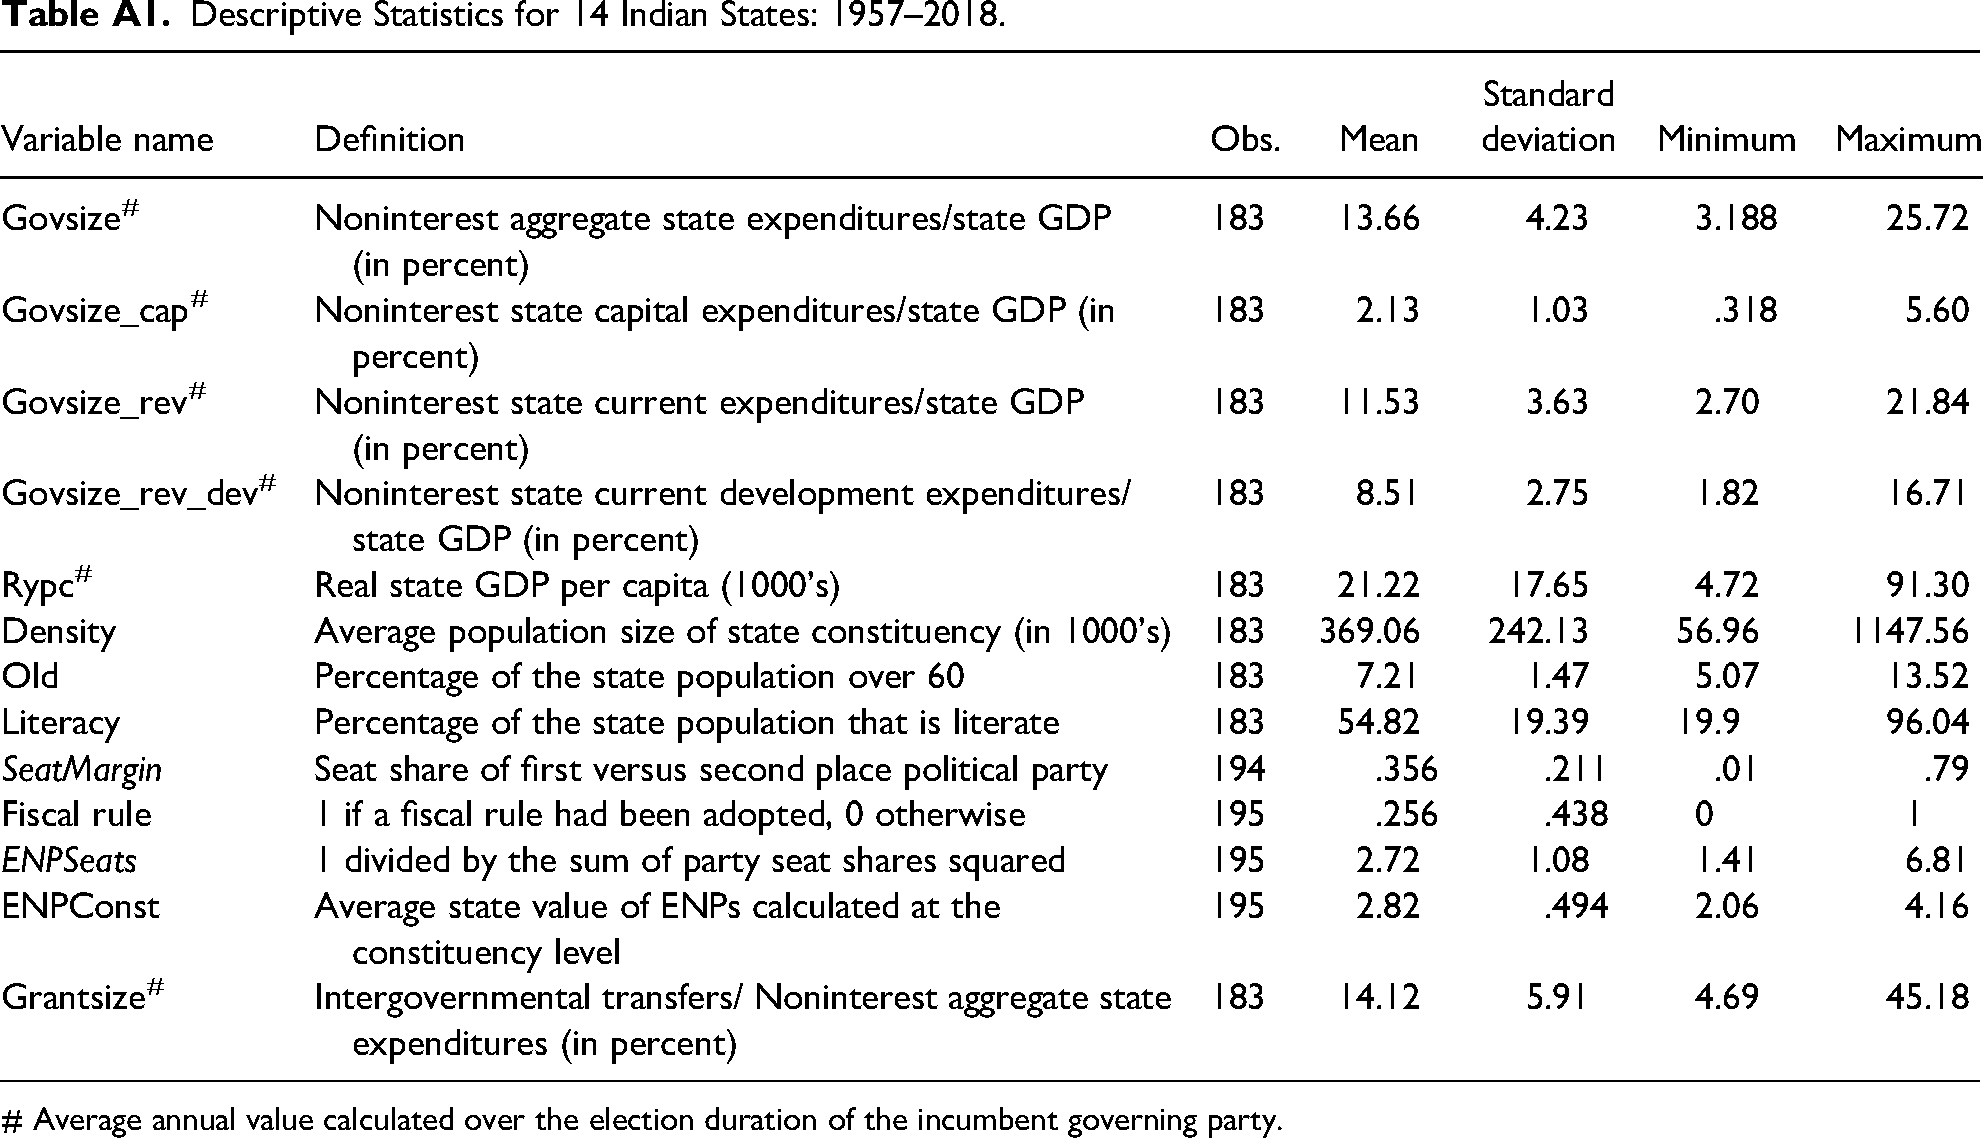
The political data used in our test were collected for all Indian state elections held in 14 major states between 1957 and 2018. 8 The time dimension of our panel is then the election year so that the demographic data refer to the values arising in that election year. On the other hand, the economic data refer to the average yearly values arising over the entire governing interval (that correspond to that election year). Of the 195 state elections that took place over this time interval, we have complete data on 180 of these elections. 9 Descriptive statistics and data sources are presented in Appendix to this paper, and the data itself can be accessed at Ferris and Dash (2023).
The dependent variable in our analysis, the aggregate expenditure size of state government, is measured as the sum of current/consumption and capital expenditures as a ratio of state gross domestic product (Govsize). 10 To model its long-run size, explanatory variables that can proxy its underlying economic and demographic fundamentals are needed. We represent the evolving scale of the state economy by the time path of real state GDP per capita (Rypc). The use of real GDP is suggested by Wagner's Law. However, the expected sign of Rypc is complicated by the combination of an expected positive effect coming from increased complexity and a negative effect arising from the expected presence of economies of scale in state spending associated with larger population size. The variables used to represent the changing demands on government arising from demographic change are the proportion of the population sixty and older (Old), the degree of state literacy (Literacy), and the population density of state constituencies (Density). All three demographic variables are expected to contribute to the growth of government spending.
Before introducing our political competition variables, we control for two specific institutional features whose differential invocation across time and states has had a direct influence on Indian state expenditures. First, Article 356 of the Indian constitution requires the central government to ensure the availability of a state government in every state. Hence, when no political party or party coalition can form a majority in the legislature and/or a state fails to function as the constitutional provisions, President's rule can be imposed (whereby the central government through the office of centrally appointed Governor assumes control of the state government until the rule is revoked). In such cases of political conflict, state expenditures are not subject to the same degree of restraint and so can diverge from underlying fundamentals (see Dash and Ferris 2021). 11 Elections in states that were subject to President's rule are represented in the panel by a dummy variable (President = 1 under rule; 0 otherwise). A second institutional feature of Indian public finance that has the potential to affect government size for reasons other than underlying fundamentals involves the adoption of a fiscal rule. In 2003, the central government passed the Fiscal Responsibility and Budget Management Act which legislated a set of budgetary rules to induce financial stability. 12 While all state governments have since adopted legislation imposing rule-based fiscal controls to offset the tendency to run large and persistent deficits, different states have adopted the fiscal rule at different points in time (from Karnataka in 2002 to West Bengal in 2010). 13 The elections in which a state government operated under a fiscal rule are denoted by a dummy variable (Fiscal rule = 1 if in effect; 0 otherwise) where the adoption of the fiscal rule is expected to have reduced the expenditure size of government.
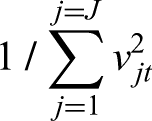
The two variables used to measure the intensity of interparty rivalry between elections are SeatMargin and ENPSeats.
14
SeatMargin is defined as
Results
The results of our panel test are presented in stages corresponding to the five columns of Table 1. In column (1), the results of a fixed effects regression model of Indian state government size using only economic and demographic fundamentals are presented. In column (2), President's rule and the adoption of a fiscal rule are added to control for important political differences that arise across states and through time. In both cases, the models perform well as a description of state government size, explaining 68 and 70 percent of the variation in state expenditure size over the 1957–2018 time period. The addition of the institutional differences in column (2) adds only marginally to the explanation of size: the negative coefficient on the adoption of a fiscal rule suggests a constraint on state spending plans (but can be considered significant only if a nonstandard 11 percent confidence interval is accepted) while the positive coefficient on President's rule is associated significantly with a higher level of state expenditure. The combined model in column (2) then represents the base model of government size from which the effects of our proxies for interelection party rivalry can be assessed. It finds that the size of Indian state governments has increased as population has gradually aged, as it has become increasingly literate and as the size of its voting districts has become denser. Increases in real state GDP per capita across states and over time are associated with decreases in government size.
Fixed Effects Regressions of Average Government Size: 14 Indian States, 1957–2018 (Absolute Value of Robust t Statistics in Brackets).
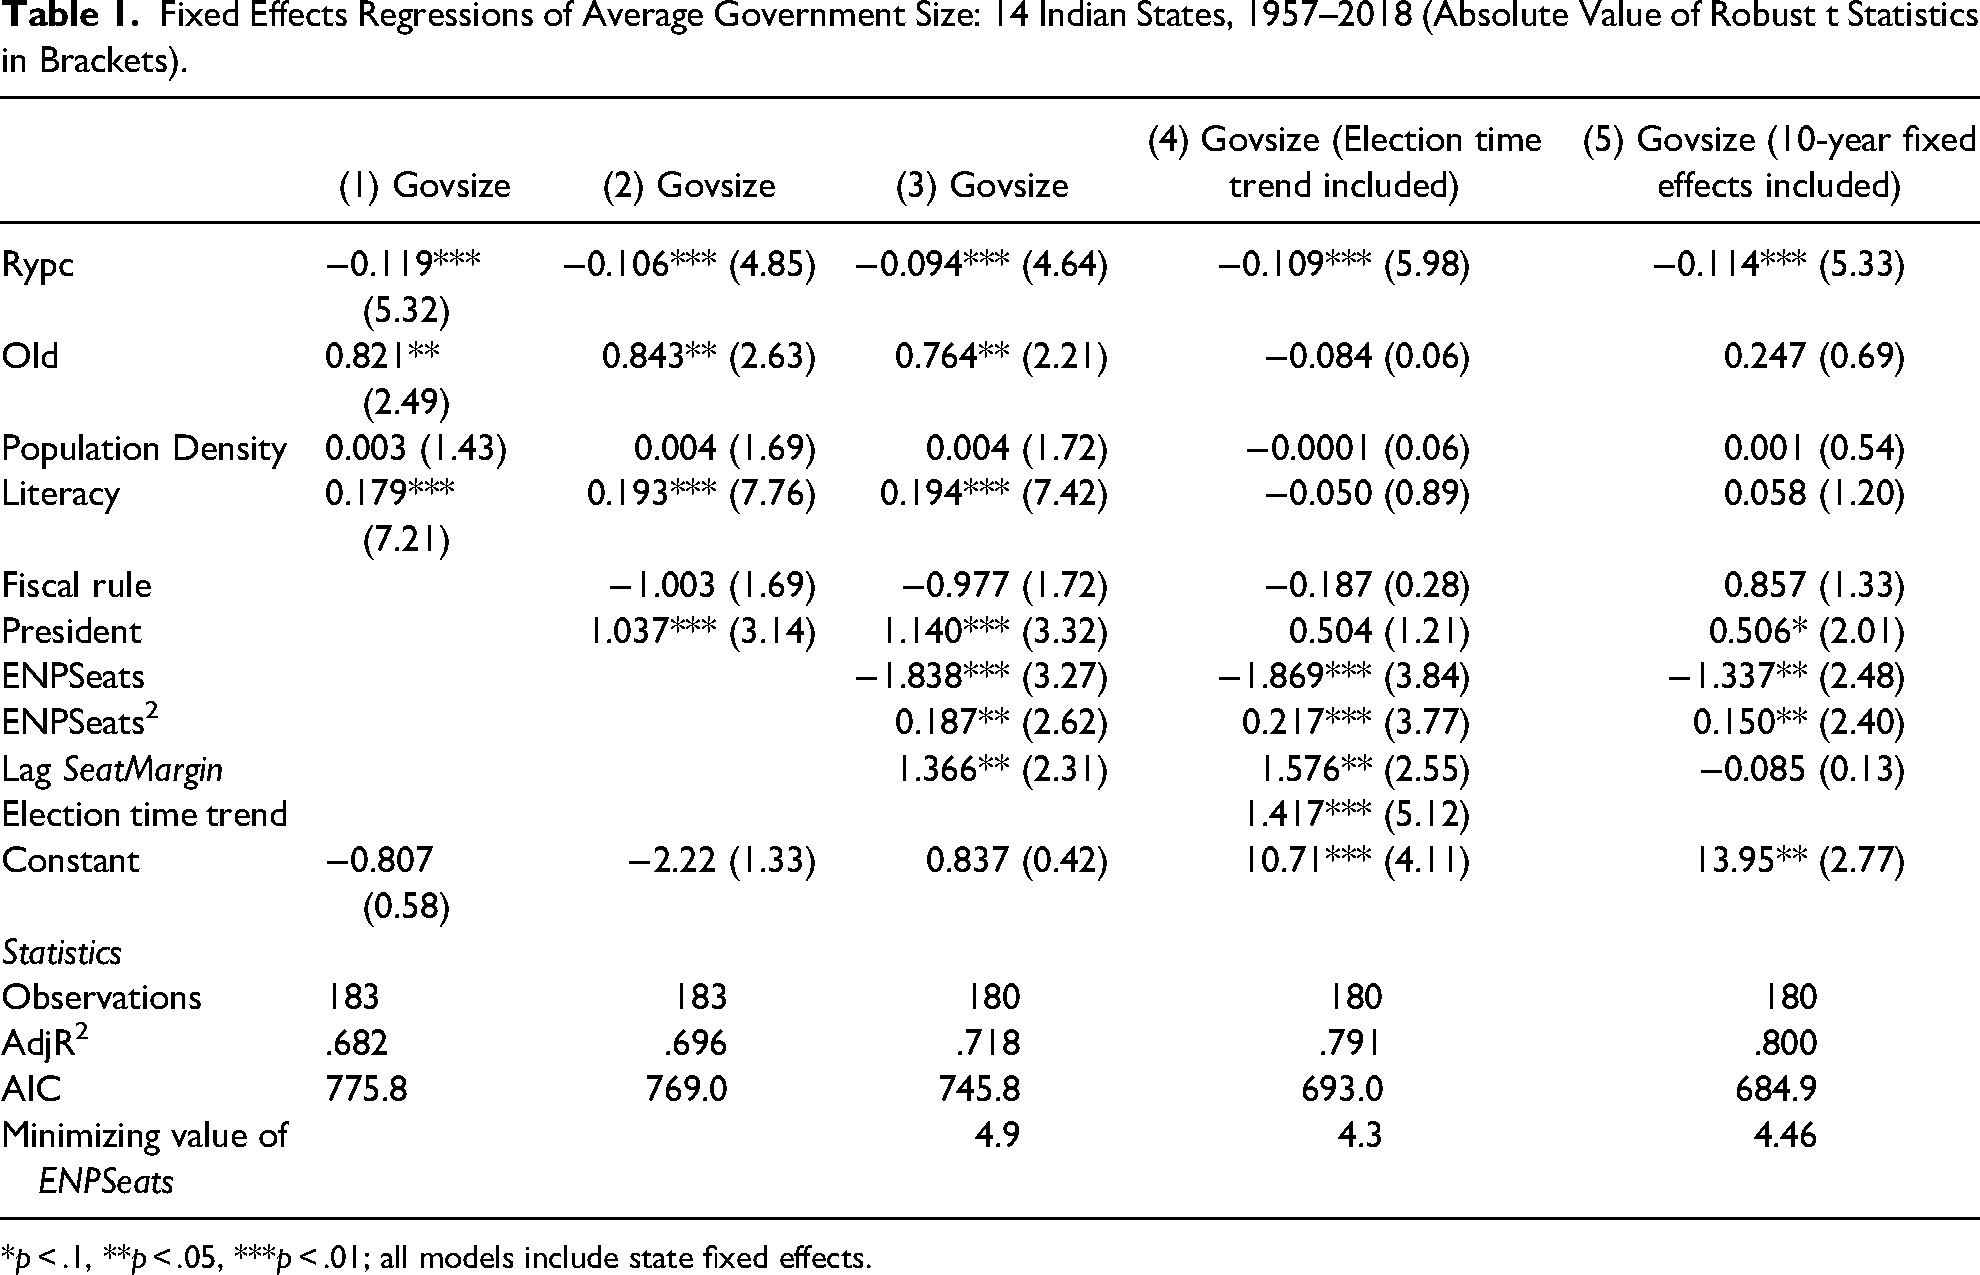
*p < .1, **p < .05, ***p < .01; all models include state fixed effects.
To this model, we then add our measures of the intensity of political party rivalry. As can be seen from the statistics in column (3), the addition of the political competition variables both increases the explanatory power of the model (the adjusted R2 rising from .696 to .718) and lowers the AIC measure (from 769 to 745), indicating that the enhanced model provides a better overall fit with the data. In terms of the individual hypotheses, a larger first- versus second-place winning margin is associated with a significantly increased government size. This is consistent with the hypothesis that a larger seat majority allows rivals fewer opportunities to oppose the government's spending program and leaving the incumbent party less constrained in pursuing party-specific spending goals in addition to fulfilling its election promises. The introduction of ENPSeats quadratically tests the hypothesis of a U-shaped relationship between electoral contestability on government size. The sign ordering of the significant ENPSeats coefficient estimates □ ENPSeats (negative) and ENPSeats squared (positive) □ indicates the presence of a U-shaped relationship that falls to a minimum at an ENPSeats value of 4.9 before rising again. 17 A Wald test of the contribution of the three competition variables to an explanation of federal government size confirms that their addition to the model does add significant explanatory power (F(3, 13) = 5.32 with prob = .01).
In columns (4) and (5), we add an explicit time dimension to the model. Column (4) adds an election trend variable that captures the growth in the size of all state governments over our time period. As might be expected, its inclusion significantly reduces the explanatory power of those variables that have grown through time and are believed to have contributed to the growth of government size, variables such as the aging of India's population, the growth in literacy, and state population densities. The addition of a time trend, however, has not decreased the size or significance of our set of party competition variables. ENPSeats retains its U-shaped effect on government size and the lagged winning margin is again associated with a significantly larger government size. The addition of election-year fixed effects dramatically reduces our degrees of freedom and in the limit allows for almost all elections to be accounted for by the combination of a state and time fixed effect. 18 To minimize the degrees of freedom issue, Jensenius (2017) and Ferris and Dash (2023) have used periodic fixed effects instead of the usual yearly ones. Assuming that the unobserved state invariant factors do not vary much over a decade, we have used ten-year periodic fixed effects. The results of using period effects are presented in column (5) and show an effect on the model like that those produced by the time trend in column (4). Their inclusion reduces the significance of the time variables while leaving the sign and significance of real GDP per capita unchanged. In terms of competition hypotheses, the time dummies have not reduced the significance of our measure expected electoral contestability nor its quadratic nature. It does, however, result in our measure of ex-post party rivalry losing its significance. For both cases that incorporate explicit time effects, the estimated value of ENPSeats that minimizes government size falls, values of ENPSeats lower than 4.5 rather than closer to 5 in models estimated without either time trend or time dummies.
While the quadratic forms found in columns (3–5) of Table 1 are consistent with the hypothesized U-shaped effect of ENPSeats on government size, the assumption that the nonlinear relationship is quadratic imposes a parametric shape that is symmetric about its minimum point. This parameterization then restricts the ability of the model to capture its actual shape if the underlying relationship is not symmetric. To allow greater flexibility in the form/shape of the relationships that can be estimated, we used Stata's fractional polynomial (fp) regression package that tests among 44 possible representations of a second-degree fractional polynomial and selects the best fit for ENPSeats. The results are presented in Table 2, and the shape of the best-fitting ENPSeats relationship is shown in Figure 1.
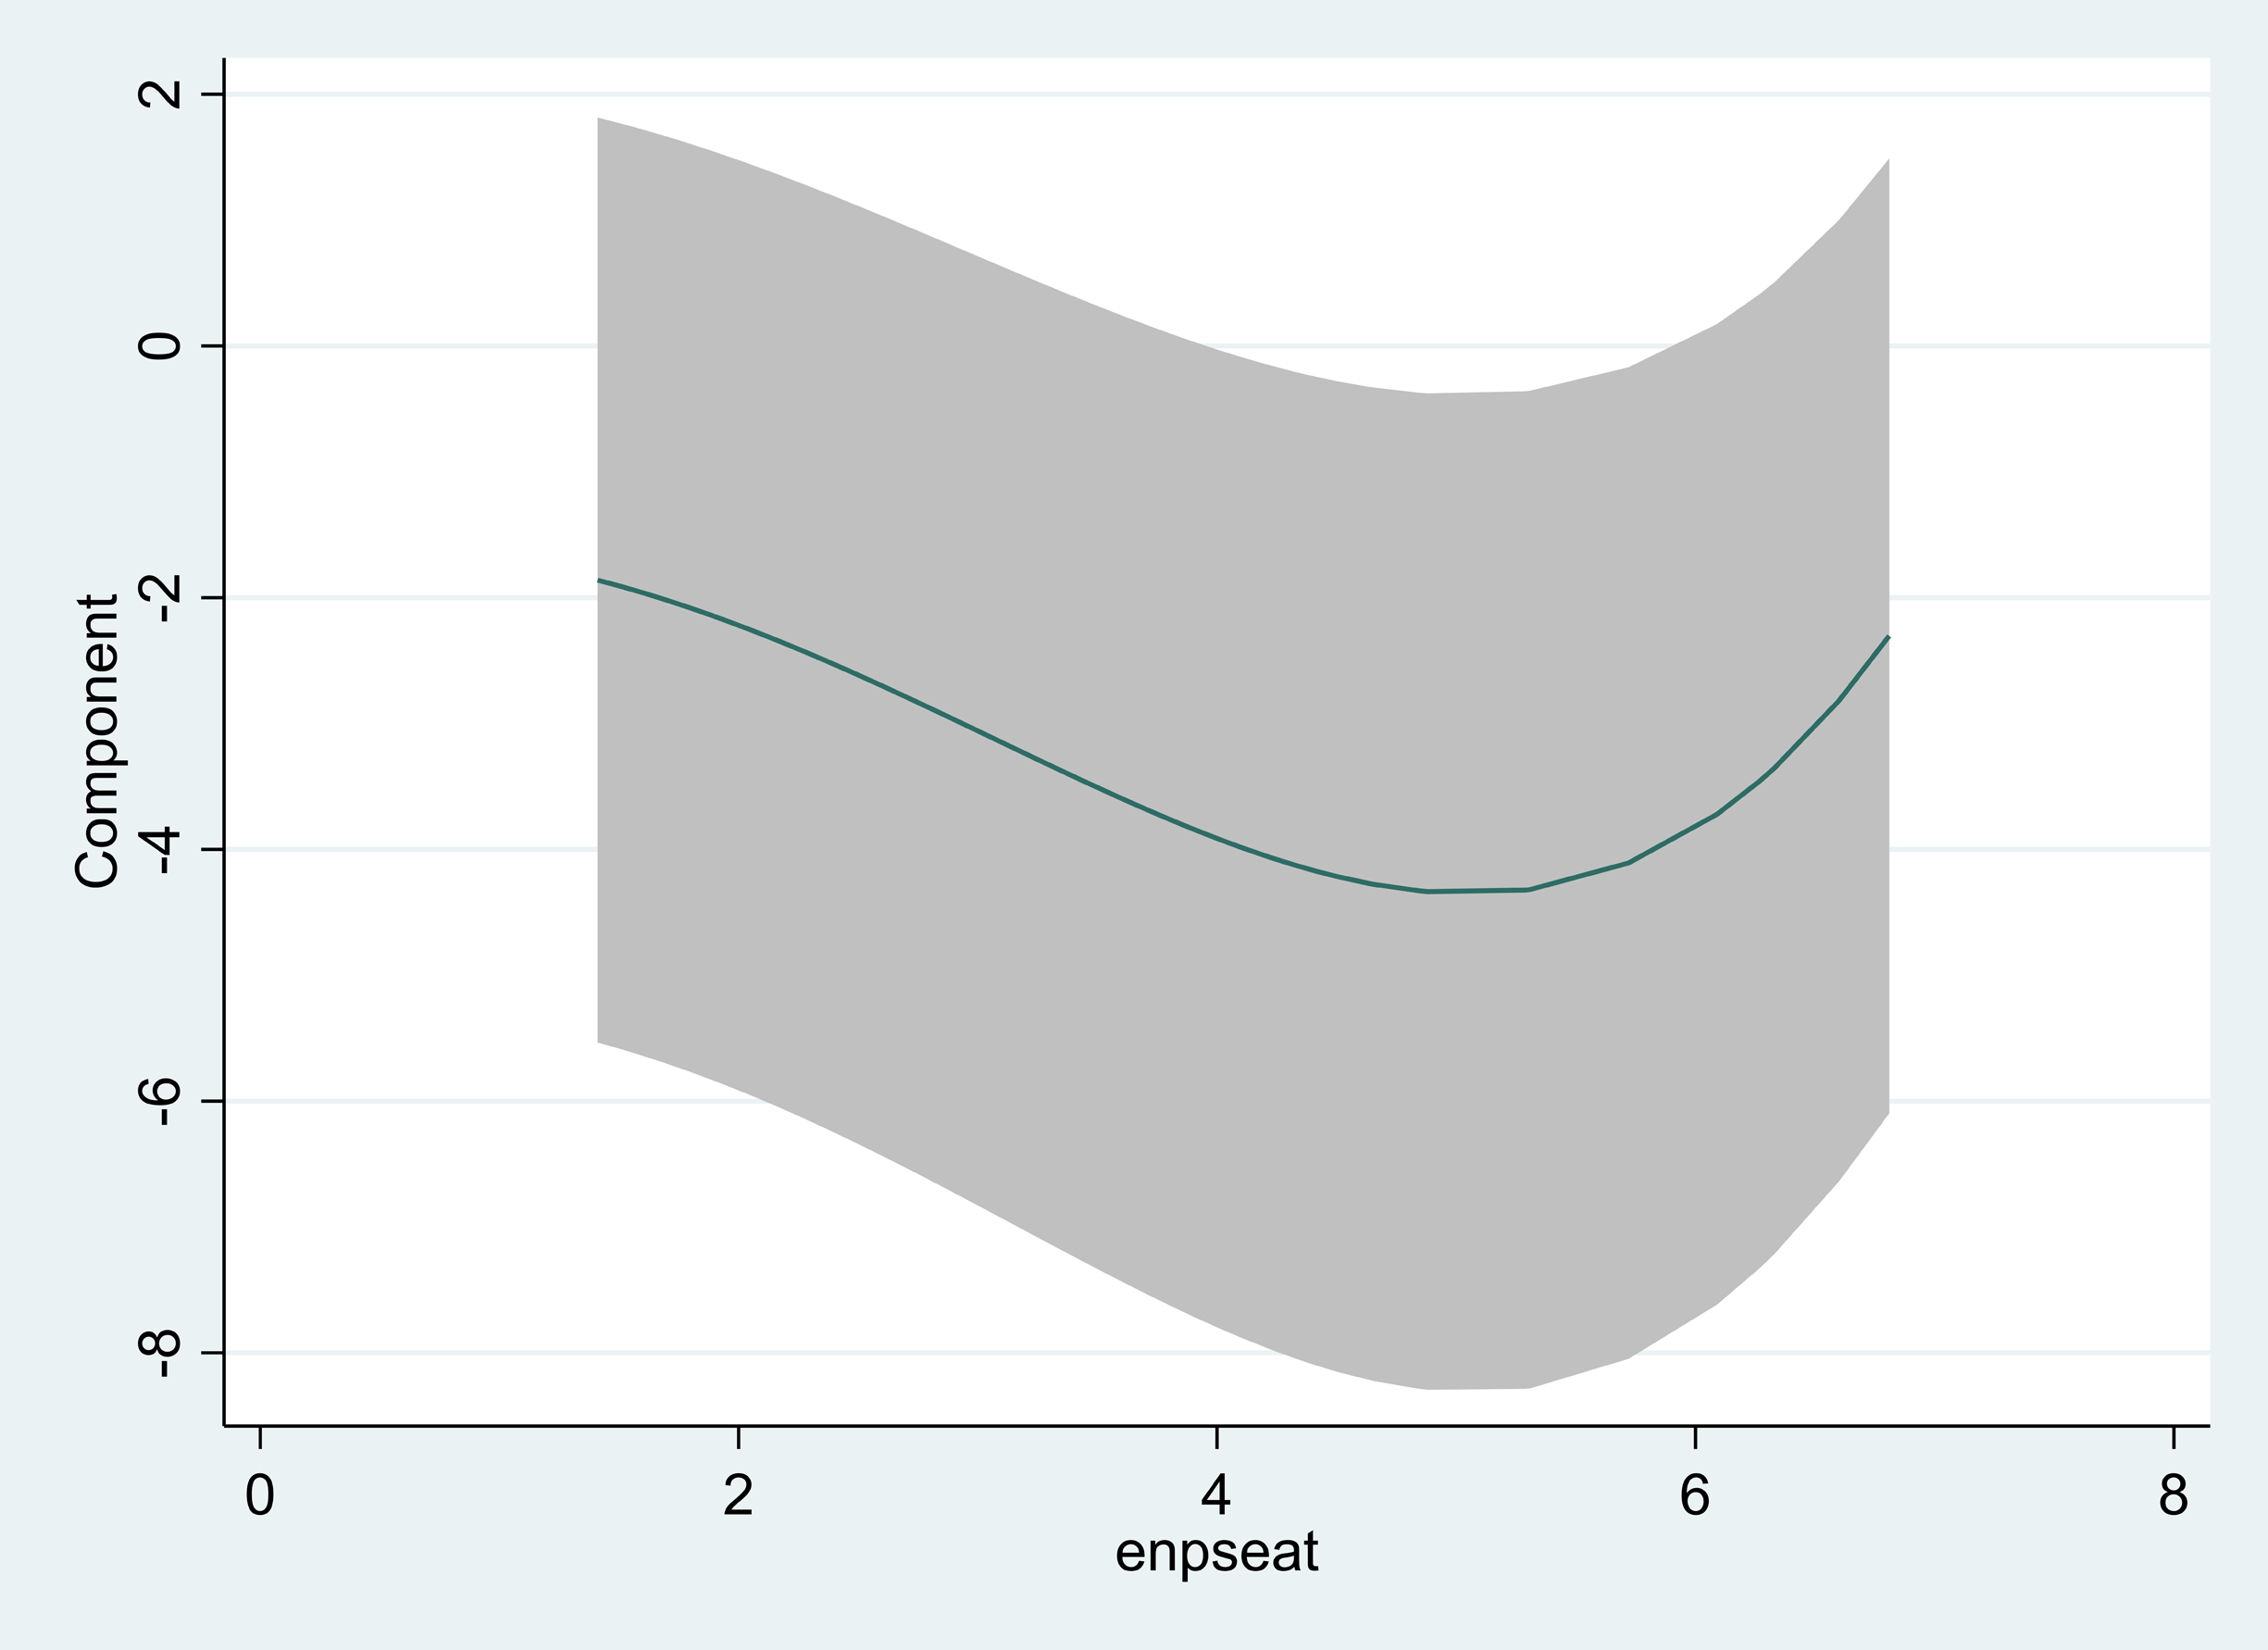
Component plot of best-fitting fractional polynomial model.
Fractional Polynomial Comparisons.
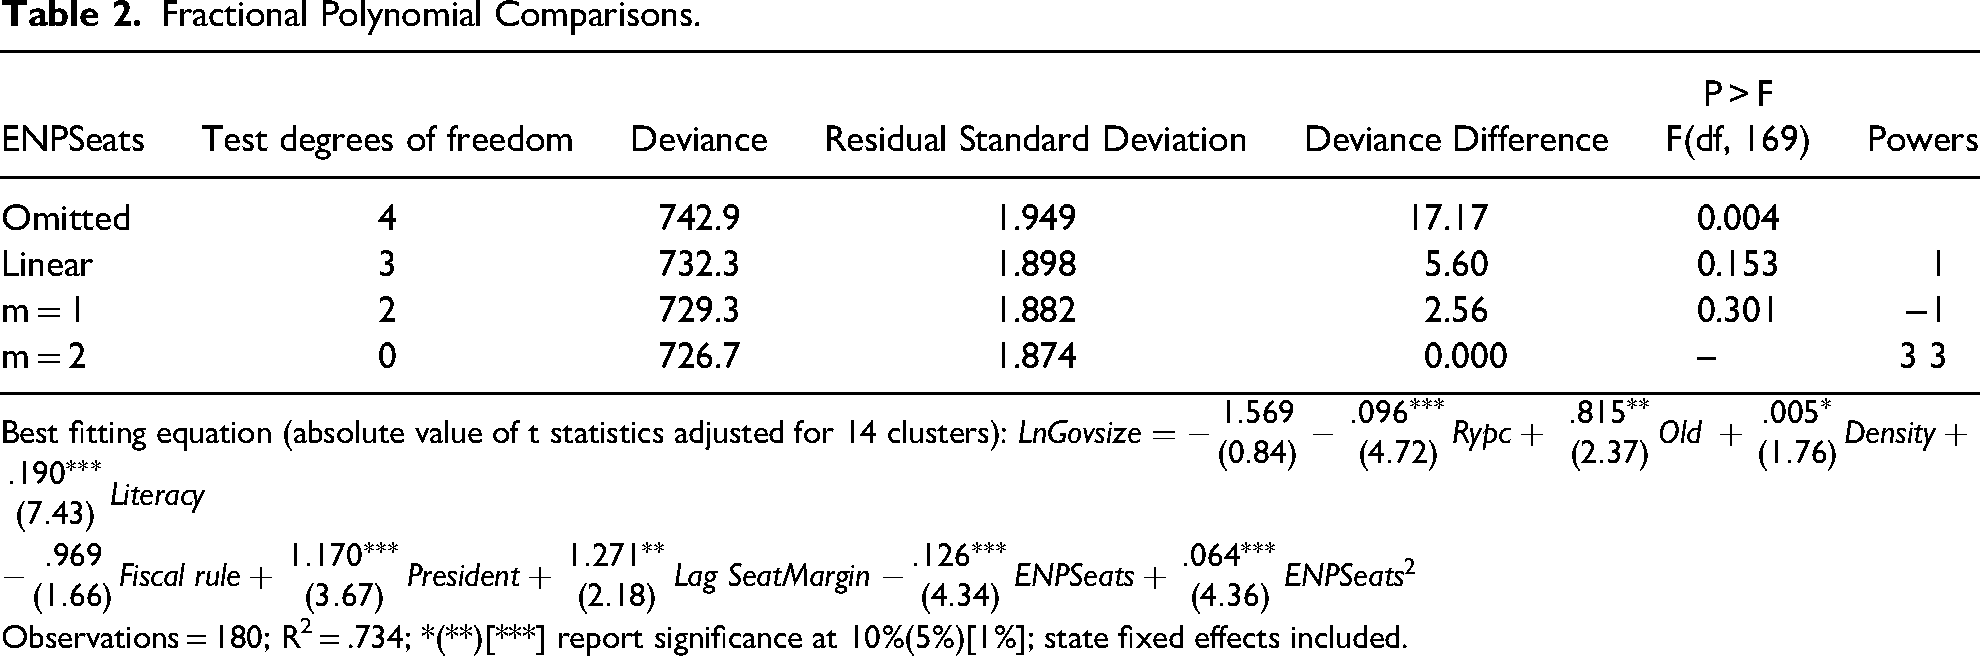
Best fitting equation (absolute value of t statistics adjusted for 14 clusters):
Observations = 180; R2 = .734; *(**)[***] report significance at 10%(5%)[1%]; state fixed effects included.
The successive rows of Table 2 indicate that the search for the best fitting form rejects equations that: omit ENPSeats entirely, include it either linearly or quadratically relative to a second-degree polynomial whose best fitting shape is plotted in Figure 1 (immediately below the estimated equation). As Figure 1 illustrates, the optimal fractional polynomial has the hypothesized U-shaped relationship between ENPSeats and government size and can be seen to be asymmetric. Govsize falls more slowly as ENPSeats rises beyond 2 to approach its minimum point (at about 5) than it rises as ENPSeats increases beyond the minimum. Expressed in terms of the hypothesized effect of contestability on agency costs and excessive government size, the empirics are consistent with contestability being low when the ENPs is small and the opportunity for collusion is high. Further increases in ENPSeats then reflect rising party competition and falling excessive government size. However, the rise in contestability as ENPSeats increases does peak, with further increases reflecting a rapid loss in contestability as party structure continues to fragment. The results imply that contestability is at its highest at a level of ENPSeats larger than Duverger's 2. As the ENPs continues to rise above the minimum, the credibility of rival party challengers diminishes and through this their ability as a group to police incumbent spending effectively.
Extensions and Robustness
Disaggregating State Expenditure
In this section, we examine whether the party rivalry hypotheses apply equally to different subcomponents of government expenditure. Table 3 applies the test to the two major subcomponents of government expenditure. In addition, because our panel covers sixty years of data, we include the results of panel cointegration tests to assess more formally the reliability of the models’ coefficient estimates. Column (1) repeats the two-hypothesis test on aggregate state expenditure from Table 1 together with the results of two-panel cointegration tests (the Kao Adjusted Dickey Fuller test statistic [ADF] and the Pedroni Modified Phillips-Perron t test [PP]). Columns (2) and (3) repeat these tests separately on capital and current consumption expenditure, the main division of total state expenditure. Because a considerable portion of state consumption expenditure is nondiscretionary, we present in column (4) a test of the development subcomponent of current expenditure that is more discretionary in nature. 19
Fixed Effects Regressions of State Government Size and its Subcomponents: 14 Indian States, 1957–2018 (Absolute Value of Robust Standard Errors).
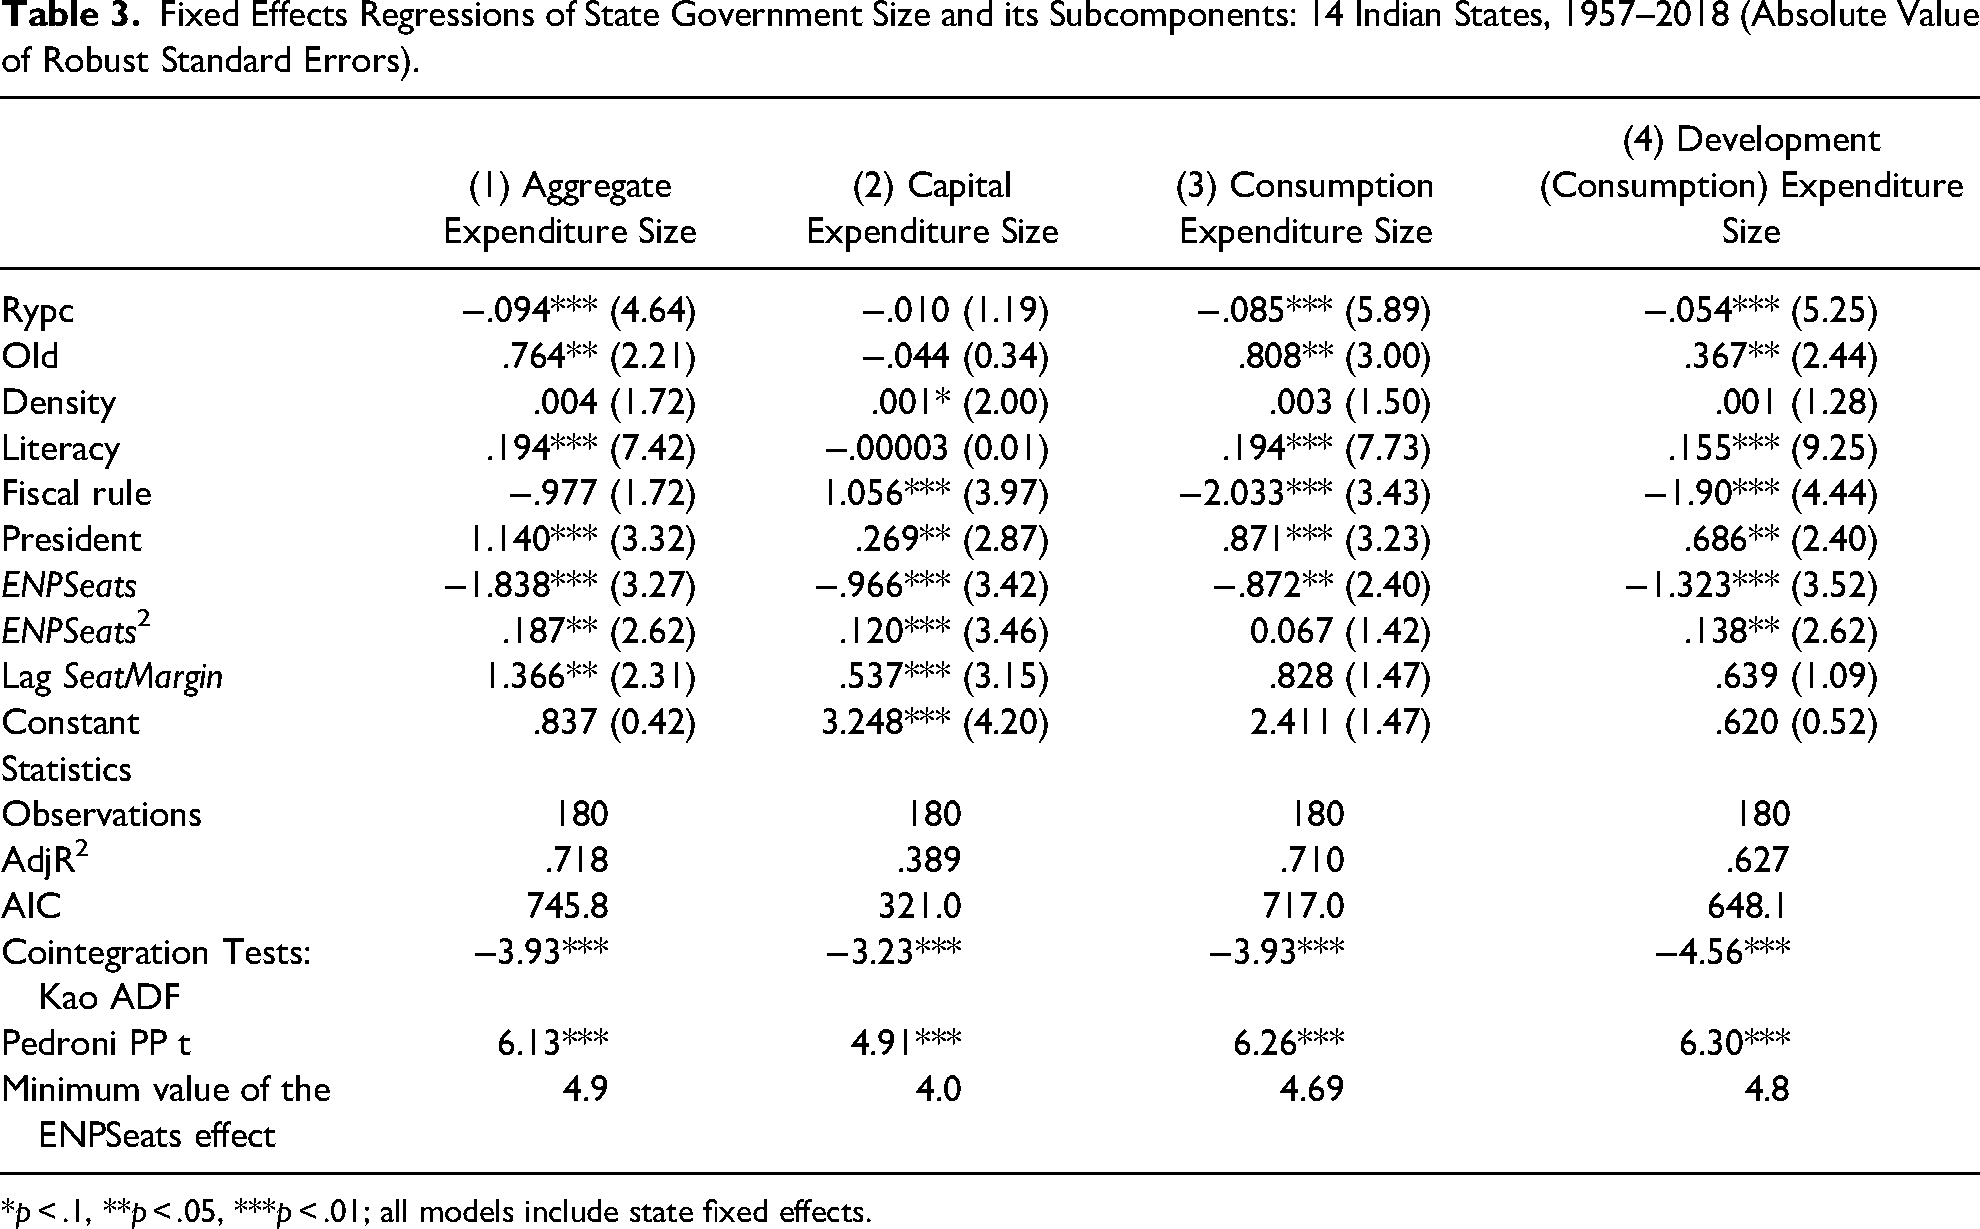
*p < .1, **p < .05, ***p < .01; all models include state fixed effects.
The cointegration test results appearing at the bottom of Table 3 indicate that we can reject the hypothesis that the long-run equation estimates of government size are not cointegrated and have increased confidence that the ENPSeat, ENPSeat2, and Lag SeatMargin coefficient estimates on our political competition variables are not spurious. With this reassurance, we note that of the twelve coefficient estimates generated by the four models, all signs are consistent with the political competition hypotheses and nine of them are significantly different from zero. In relative terms, there is less support given to ex-post closeness than to the role of contestability.
While the predictions of interparty rivalry on excessive government size hold generally across all state spending categories, the results also find important differences in the different subcomponents of state expenditure. Long-run changes in state fundamentals are found to play a more significant role in explaining the consumption portion of state spending, explaining roughly 70 percent of the variation in state consumption as opposed to less than 40 percent of the variation in capital expenditure. This comes primarily from the ability of fundamentals and political competition more generally to better explain the nondiscretionary portion of state consumption spending. Capital expenditures, on the other hand, exhibit greater responsiveness to our political competition variables consistent with infrastructure and investment decisions based on discretionary criteria that differ from those driving the more deterministic day-to-day requirements of state governments. 20 To the extent that a large realized winning margin indicates a greater potential for the winning party to exploit its electoral advantage, the data imply that this will be implemented more in relation to its capital rather than consumption spending. This finding is consistent with Acemoglu and Robinson (2006) who suggest that because of the growth-promoting aspects and long gestation period of capital assets, the incumbent governing party will be more likely to pursue such projects when its legislative position is consolidated and there is no immediate threat to power.
Though the expectation of greater electoral contestability reduces the excessive size of all subcomponents of state expenditures, the discretionary portions of state consumption and capital expenditures are found to be more responsive to our measure of electoral contestability. Like the case of aggregated expenditure in column (1), the results for the ENPSeats coefficients (presented in the bottom row of Table 3) indicate that for each of the disaggregated state expenditure categories maximum contestability arises at a level of ENPSeats larger than Duverger's 2. For both consumption categories this arises at an ENPSeats value between 4.7 and 4.8, whereas for capital expenditure, interparty contestability generates a maximum effect on government size at a lower ENPSeats value of 4.0. 21
The results also indicate that while the imposition of President's rule is associated with higher spending in all categories, state adoption of the fiscal rule has a differential impact on the different parts of state expenditure. That is, while the fiscal rule was found earlier to have only a marginal effect in reducing aggregate government size (in column (1)), the disaggregated results indicate that the adoption of a fiscal rule has a significant negative effect on state consumption spending and a significant positive effect on capital expenditure. That is, not only does the fiscal rule serve to constrain consumption spending but it also serves to redistribute aggregate state expenditures away from consumption to state investment activities. The results then reinforce the fiscal balance findings of Chakraborty and Dash (2017) while pointing to its role in focusing the state budget more on longer term development objectives.
Constituency-Based Measure of ENP and Incorporating Central Government Grants
Although the evidence of a U-shaped relationship between ENPSeats and government size is quite strong, one reason to question its applicability to the proposed competitive hypothesis is that the minimum point is found at a value that is larger than might be thought needed to counter collusive spending by a small number of dominant state parties. For example, in the Canadian case, the point at which a minimum is found is closer to 2.5 than the 4.5–4.9 found for Indian states.
One reason why the point of maximum contestability may be larger in the Indian state case is because of the widespread appearance of coalition party governments in many Indian state legislatures. In our sample of 14 states, for example, roughly 37 percent of state elections resulted in coalition party governments, many of which are formed prior to the state election. In these cases, coalition parties would often agree not to contest in the same constituency and put up a single candidate to represent the coalition's interests. 22 This implies that in states with coalition governments, the number of parties in the legislature will often represent more party choices that are actually available to a typical state constituency voter. 23 Somewhat more generally, constituency-based measures of ENP are often found to be smaller than ENP measures calculated at the state or national-based measures. 24 This can happen when the state or nation contains regionally separate ideological, religious, or ethnic groups, each with their own party. Together these considerations suggest that for the typical voter, the contestability of an election may be better reflected in the ENPs in their constituency than their counterpart at the state or national level.
In Table 4, then, using equation (1), we redo the analysis contrasting the use of ENPSeat and ENPSeat2 in column (1) with their equivalent using a measure of average constituency measure of party ENP in columns (2) and (3). More formally, we define ENPConst as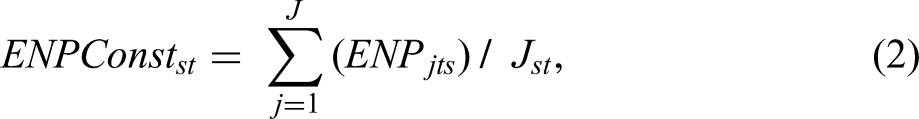
Fixed Effects Regressions of State Government Size: 14 Indian States, 1957–2018 (Absolute Value of Robust Standard Errors).

*p < .1, **p < .05, ***p < .01; all models include state fixed effects.
Inspection of Table 4 reveals results for the ENPConst models in columns (2) and (3) that are similar to those found earlier for ENPSeats (in Table 3) and the enhanced Grantsize-ENPSeats model of column (1). All equations have essentially the same explanatory power, and the coefficient estimates of the effect of the control variables have similar size, sign, and significance across models. Perhaps surprisingly, as can be seen by comparing the results from columns (1) and (3), the addition of Grantsize to both ENP models does not add explanatory power, implying that while grants from the center may have an important effect on the composition of state expenditure, they have not affected overall size. The addition of Grantsize to the model, however, reduces the significance of the size of the winning seat margin (Lag SeatMargin) in the case of ENPSeats while increasing the size for ENPConst. Controlling for the effect of grants from the center reveals a result consistent with smaller ex-post winning margins being an effective monitor of excessive spending in that model.
The use of a constituency-based measure of ENP does change one important element of the relationship between ENP and government size. That is, while the quadratic effect in both models still implies a U-shaped relationship consistent with the monitoring effectiveness of contestability first increasing and then decreasing as the ENPs increase, the U-shaped ENP relationship in the constituency model is found to be both shallower and bottoming out at a lower number of effective parties. 26 The implied point at which contestability is highest occurs at an ENPConst value of 3 as opposed to 4.5–5 in the ENPSeats version of the model. To the extent that political parties view the constituency as the appropriate base for electoral contestability, the ENPConst model of column (3) suggests that a minimum of three effective parties would be sufficient to achieve effective monitoring while larger numbers would fragment party options, generate less contestability and result in higher agency costs.
Conclusion
In this paper, we have tested the effectiveness of two measures of party rivalry in policing the expenditure size of state governments in India between elections and found evidence consistent with their hypothesized role in minimizing excess government size, where excessive size is measured as a positive departure from the long run equilibrium path determined by the economy's fundamentals. Larger electoral victories are associated positively with excessive size, consistent with the incumbent party using its current electoral advantage to pursue party-specific objectives in addition to those desired by the electorate. Similarly, the data are consistent with the incumbent party being constrained by the expected contestability of the upcoming election. Here, contestability is viewed as related to the ENPs nonmonotonically, increasing as ENP rises above two before peaking and falling as the larger ENPs reduces the credibility of rival challengers. Indian state data suggest that contestability peaks when at the aggregate level of ENP is somewhere between 4.5 and 5. Using a constituency-based measure of ENP the peak is suggested as being closer to 3.
While the data support the hypotheses at the aggregate level, the predictions of the model receive even greater support in relation to those subdivisions of state expenditure that permit greater spending discretion, in our case capital (rather than consumption) expenditure and development (rather than nondevelopment) expenditure. The investigation also finds other interesting insights. In particular, the adoption by states of a fiscal rule is found to be associated not only with lower levels of state consumption spending but also with the reallocation of government spending from consumption to investment purposes. Similarly, the imposition of President's rule and its suppression of internal party competition (or its recognition of the breakdown of effective political party competition) is associated with a larger state government size than would otherwise be expected. And finally, the finding that grants from the center have had no significant effect on the average size of state governments is not inconsistent with the hypothesis that central transfers have allowed less advantaged states to maintain a level of state services comparable to more fortunate ones.
We conclude with a note of caution. While the estimated regressions are cointegrated and the coefficient estimates are generally consistent with the proposed hypotheses, the endogeneity issues surrounding the determination of government size and political competition make the presumption of causality somewhat problematic. In our case, we have linked predetermined election outcomes with contemporaneous state spending and contemporaneous spending with future outcomes to mitigate simultaneous effects and used state-specific fixed effects to mitigate the effect of omitted variables. This increases confidence in our interpretation of the data but does not rule out the existence of other forms of causality, particularly between government size and the number of competing parties.
Footnotes
Data Appendix
Appendix
Descriptive Statistics for 14 Indian States: 1957–2018.
| Variable name | Definition | Obs. | Mean | Standard deviation | Minimum | Maximum |
|---|---|---|---|---|---|---|
| Govsize# | Noninterest aggregate state expenditures/state GDP (in percent) | 183 | 13.66 | 4.23 | 3.188 | 25.72 |
| Govsize_cap# | Noninterest state capital expenditures/state GDP (in percent) | 183 | 2.13 | 1.03 | .318 | 5.60 |
| Govsize_rev# | Noninterest state current expenditures/state GDP (in percent) | 183 | 11.53 | 3.63 | 2.70 | 21.84 |
| Govsize_rev_dev# | Noninterest state current development expenditures/state GDP (in percent) | 183 | 8.51 | 2.75 | 1.82 | 16.71 |
| Rypc# | Real state GDP per capita (1000's) | 183 | 21.22 | 17.65 | 4.72 | 91.30 |
| Density | Average population size of state constituency (in 1000's) | 183 | 369.06 | 242.13 | 56.96 | 1147.56 |
| Old | Percentage of the state population over 60 | 183 | 7.21 | 1.47 | 5.07 | 13.52 |
| Literacy | Percentage of the state population that is literate | 183 | 54.82 | 19.39 | 19.9 | 96.04 |
| SeatMargin | Seat share of first versus second place political party | 194 | .356 | .211 | .01 | .79 |
| Fiscal rule | 1 if a fiscal rule had been adopted, 0 otherwise | 195 | .256 | .438 | 0 | 1 |
| ENPSeats | 1 divided by the sum of party seat shares squared | 195 | 2.72 | 1.08 | 1.41 | 6.81 |
| ENPConst | Average state value of ENPs calculated at the constituency level | 195 | 2.82 | .494 | 2.06 | 4.16 |
| Grantsize# | Intergovernmental transfers/ Noninterest aggregate state expenditures (in percent) | 183 | 14.12 | 5.91 | 4.69 | 45.18 |
# Average annual value calculated over the election duration of the incumbent governing party.
Acknowledgment
The authors would also acknowledge the comments and suggestions of a referee who has helped strengthen the reasoning and findings of this paper.
Declaration of Conflicting Interests
The author(s) declared no potential conflicts of interest with respect to the research, authorship, and/or publication of this article.
Funding
The author(s) received no financial support for the research, authorship, and/or publication of this article.