
Abstract
We contribute to the empirical literature on the debt bias of corporate income taxation through a firm-level evaluation of the allowance for corporate equity (ACE) in Austria. We find that the Austrian ACE tax system increased corporate equity ratios by approximately 1.36 to 2.30 percentage points. Additionally, we find significant differences in the application of the ACE tax system depending on firm-specific dividend levels and firm-specific ownership structures. In particular, we find that the cost of constraining dividends appears to be higher than the tax benefit of the ACE tax system. Additionally, we find that firms with dispersed ownership refrain from applying the ACE tax system, which might be due to the fact that firms with less dispersed ownership can react more quickly to tax law changes.
Keywords
Introduction
If interest payments on debt are tax deductible while dividend payments to equity investors are not, firms will prefer debt over equity (Devereux and Freeman 1991; Graham 2000; Devereux, Griffith and Klemm 2002; Fehr and Wiegard 2003; De Mooij and Devereux 2009, 2011; Auerbach 2012; De Mooij 2012; Devereux 2012; Mirrlees et al. 2012; Feld et al., 2013; Devereux and Vella 2014; Brekke et al. 2017). The IMF (2011) and the European Commission (EU 2016) have named the asymmetric taxation of equity and debt as the main reason for the existence of very low equity levels in firms. From a general economic perspective, low equity levels have been found to escalate the risk of bankruptcy (Bonfim 2009), especially in years of economic downturns (Brownlees and Engle 2017).
One way to mitigate the asymmetric taxation of debt and equity is the adoption of an allowance for corporate equity (ACE), which is a tax system that provides for a deduction of notional interest on equity. ACE tax systems have been frequently introduced into the tax policy debate over the last few years (IMF 2011; IFA 2012; Shay et al. 2015; EU 2016), including the Allowance for Growth and Investment (AGI) proposal by the EU Commission in 2016 (EU 2016) and the EU's DEBRA proposal in 2022. From a fiscal perspective, the adoption of an ACE tax system narrows the tax base of firms and thus generates less tax revenue than a classical corporate income tax system (Finke et al., 2014); however, such an adoption could lead to macroeconomic welfare gains. There exist multiple examples of countries that have adopted ACE tax systems, such as Austria, Belgium, Brazil, Croatia, Cyprus, Italy, Latvia, Portugal, and Turkey.
The empirical documentation of the effect of ACE tax systems on a firm's capital structure in single-country studies is limited to Belgium (Princen 2012; Van Campenhout and Van Caneghem 2013; Panier et al., 2015; Schepens 2016) and Italy (Bernasconi et al., 2005; et al., 2012; Branzoli and Caiumi 2020). The results document that ACE tax systems increase equity ratios and decrease debt ratios of firms. However, the size of the effect varies substantially across different ACE tax systems. For the Belgian ACE tax system, which provides for an interest deduction of the whole book value of equity, equity ratios are found to increase by 5 to 13 percentage points. The Italian ACE tax system, which considers only interest on recent equity increases, features smaller effects of approximately 3 to 5 percentage points.
The primary motivation of this paper is to contribute to the debate on the effect of ACE tax systems on a firm's capital structure. To this end, we investigate the introduction of the ACE tax system in Austria in 2000. Identification has been shown to be a crucial issue in prior empirical research on ACE tax systems. Except for Branzoli and Caiumi (2020), who use past equity injections in an instrumental variable (IV) approach to overcome identification issues, most studies use a control group research design to disentangle the effects from the introduction of the ACE tax system from random time-effects. We follow this path and apply a difference-in-difference (DD) analysis with Sweden and Belgium as control countries. We choose Sweden and Belgium for several reasons: first, when comparing average statutory corporate income tax rates and effective average and effective marginal tax rates (Devereux and Griffith 1999, 2003) over the period 1996–1999 (pre-reform) to 2000–2003 (post-reform), we do not observe major tax changes in Sweden and Belgium; second, like Austria, both countries were EU member states during the observation period (1996–2003) and Sweden and Belgium are comparable to Austria regarding the overall size and development of their economy and population. Also, Austria and Belgium joined the euro area in 1999; third, data availability in AMADEUS for Sweden and Belgium are similar to Austria.
Our study adds to the existing literature with regard to the effect of ACE tax systems on a firm's capital structure in several ways. First, compared to ACE tax systems currently in effect in Belgium and Italy, the Austrian ACE tax system provided for a smaller relief in asymmetric taxation of equity and debt, as it did not allow for a full deduction of notional interest and therefore had smaller negative tax revenue effects. Analyses of the Belgian and Italian ACE tax systems have yielded heterogeneous results with respect to the size of their effect on equity ratios. It is thus unclear whether the tax benefit of the Austrian ACE tax system was strong enough to actually affect equity ratios of Austrian firms in a similar way to those in other countries. Second, we focus on the effect of ACE tax systems on firm-level changes in equity ratios rather than analyzing their effect on debt. We focus on equity and equity ratios, respectively, because of the specific goals of the Austrian ACE tax that explicitly aimed at increasing corporate equity levels (Austrian Parliament 1999). While equity and debt finance are related to each other, there might be nontax reasons that prevent firms from increasing their equity ratios, that is, investors’ demand for dividends. At the same time, we would not expect these nontax reasons to affect the debt ratios. Third, we add to the currently growing literature on the effect of ownership structures on capital structure decisions by identifying cross-sectional conditions under which the effect of the ACE tax system on debt ratios differs from the baseline effect.
We find that, on average, the introduction of the ACE tax system significantly increased equity ratios of Austrian firms by approximately 1.36 to 2.30 percentage points. Compared to previous results, this effect is much lower than that of the currently employed Belgian ACE tax system but only slightly lower than the effect of the current Italian regime. In further cross-sectional tests, it appears that agency conflicts and the diverging interests of owners outweigh the tax benefits of the ACE tax system. Our first cross-sectional analysis documents that firms with high levels of past dividends do not significantly increase their equity ratios after the introduction of the ACE tax system, which is consistent with prior empirical findings that firms are reluctant to constrain dividend payouts. In the second cross-sectional analysis, we provide evidence that widely held firms, that is, firms without a majority owner, are less successful in adopting their equity ratios after the introduction of the ACE tax system than firms with concentrated ownership. Furthermore, we document a weaker effect of the reform among larger firms and among firms with higher levels of equity and equity ratios in pre-reform years.
Our results are also important for policy makers who are considering the adoption of an ACE tax system as a policy tool to increase equity ratios. We provide valuable information on the effect of this policy tool and of the cross-sectional circumstances that moderate the effect of an ACE tax system on equity ratios.
Theoretical and Institutional Background
Modigliani and Miller (1958, 1963) demonstrate that in the absence of taxes and the costs of bankruptcy and with perfect capital markets, firm value is not affected by capital structure. This result, however, does not hold if taxes at the corporate level are considered, since the payments for debt financing (interest) are tax deductible whereas the payments for equity financing (dividends) are not. Corporate tax systems that allow for a full interest deduction thus favor debt financing over equity financing (“tax benefit of debt”). In a meta-study that covers estimates from forty-eight studies, Feld et al., (2013) find that the influence of corporate taxes on capital structure is indeed substantial. The identified mean effect of corporate taxes on a firm's debt ratio is 0.13, indicating that an increase in the corporate tax rate of 10 percentage points increases the debt ratios of firms by 1.3 percentage points. Weichenrieder and Klautke (2008) present an effect that is similar in magnitude and amounts to 0.14 to 0.16.
To reduce the tax benefit of debt, a country can adopt an ACE tax system. The theoretical foundations of the ACE tax system were developed by Wenger (1983) and Boadway and Bruce (1984). Their idea was to abolish the deductibility of actual interest payments and to replace it with an allowance for the normal return, applied to the book value of the entire firm's capital. The ACE is slightly different in that it maintains the deductibility of interest payments for loans (Devereux and Freeman 1991; IFS 1991). However, it additionally allows for a notional return on equity to be deductible. An ACE tax system thus fully eliminates the tax benefit of debt if it is applied with a notional interest rate that equals the interest rate used for serving debt. Otherwise, an ACE tax system lowers the tax benefit of debt but does not fully eliminate it.
Among economists, a number of proponents have repeatedly argued in favor of a tax system that provides for a deduction of notional interest on equity, highlighting several attractive features of an ACE tax system. First, such a system obtains neutrality between debt and equity finance and thus makes thin capitalization rules unnecessary. Second, an ACE system is neutral with respect to marginal investment decisions. In fact, by allowing a deduction for both debt interest and the normal rate of return on equity the ACE system leaves capital income untaxed. The third characteristic of the ACE is that it offsets the investment distortions that are induced by the differences between economic depreciation and depreciation for tax purposes (Devereux and Freeman 1991; Wagner and Wenger 1996; Devereux, Griffith and Klemm 2002; Fehr and Wiegard 2003; De Mooij and Devereux 2009 and 2011; Auerbach 2012; Devereux 2012; Mirrlees et al. 2012; Devereux and Vella 2014; Brekke et al. 2017). There have also been skeptics, however, who have pointed out the difficulties that an ACE tax system may encounter in practice. Isaac (1997) highlights the difficulties that may arise as a result of the interactions between ACE tax systems and classical corporate income tax systems if only a few countries were to adopt the ACE. Additionally, an ACE tax system necessarily narrows the tax base. To collect the same revenue as collected under a classical corporate income tax system, the tax rate needs to be higher (Finke et al., 2014). In a closed economy, this should not distort investment. In a globalized economy in which multinationals decide where to undertake their investment projects, the statutory income tax rates are regularly used as important benchmarks (Chetty et al., 2009; Blaufus et al. 2013; Graham et al. 2017; Petutschnig 2017).
ACE tax systems were adopted for the first time during the late 1990s and early 2000s by a small number of mostly European countries. The main difference among the adopted ACE tax systems was the definition of the corresponding ACE base, that is, the question of whether to consider the whole book value of equity or only the annual increase in equity as the basis for the notional interest deduction. This distinction is used to differentiate between so-called hard and soft ACE tax systems (Klemm 2007; Hebous and Ruf 2017). A hard ACE tax system allows for a deduction of notional interest in total equity, while a soft ACE tax system considers only the recent equity increase. Hard ACE tax systems have been introduced in Belgium (since 2006), Croatia (1994–2000), and Liechtenstein (since 2011). Austria (2000–2004), Brazil (since 1996), Cyprus (since 2016), Italy (1998–2003 and since 2012), Latvia (2009–2014), 1 Portugal (2010–2013), 2 and Turkey (since 2016) have maintained soft ACE tax systems over different periods of time (Massimi and Petroni 2012; Hebous and Ruf 2017). The AGI, as proposed by the EU Commission in 2016, provides for a notional interest deduction based on the annual increase in equity and can therefore be classified as a soft ACE regime.
Several studies have analyzed the effect of an ACE tax system on capital structure, with most attention being paid to the Belgian ACE tax system (Princen 2012; Van Campenhout and Van Caneghem 2013; Panier et al., 2015; Schepens 2016) and the Italian ACE tax system (Bernasconi et al., 2005; Panteghini et al., 2012; Branzoli and Caiumi 2020). Only one study evaluates the effect of ACE tax systems in a multicountry setting. Hebous and Ruf (2017) document that ACE tax systems reduce the debt ratio of subsidiaries of German-based multinationals by approximately 3 to 5 percentage points. Furthermore, their results suggest that a hard ACE tax system is more effective in reducing debt ratios than a soft ACE tax system.
Austria's ACE tax system, which was introduced in 2000, has thus far not been empirically examined. 3 As a soft regime, the Austrian ACE tax system provided for a notional interest deduction on the increase of equity. The basis for the notional interest was the increase of the book value of equity during the respective taxable year compared to the highest increase in book value of equity over the preceding seven years. The interest rate was based on long-term governmental bonds, published annually by the Austrian Ministry of Finance, and varied between 4.9 percent (2000) and 6.2 percent (2001). In contrast to other soft ACE tax systems, the Austrian system did not allow for a full deduction of notional interests on the increase in equity but only offered a reduced tax rate for the notional interest. Technically, the notional interest was first deducted from the regular tax base and then taxed at a reduced rate, which amounted to 25 percent, compared to the regular corporate tax rate of 34 percent at that time. The effective tax savings thus amounted to 0.441 percent to 0.558 percent of the increase in equity (notional interest rate multiplied by the difference between regular and preferential tax rate). The Austrian ACE tax system was repealed in 2004. Its repeal was part of a broader corporate tax reform, which reduced the standard corporate tax rate to 25 percent. The Federal Austrian Statistics Agency (Statistics Austria 2021) reports aggregated information regarding the usage of the ACE by Austrian corporations and its effect on overall corporate tax revenue over the period 2000–2003. In Table 1, we summarize this information on an annual basis (Panel A) as well as on a total basis and by taxable profit (Panel B).
Data on Actual use of Allowance for Corporate Equity (ACE) in Austria, 2000–2003.
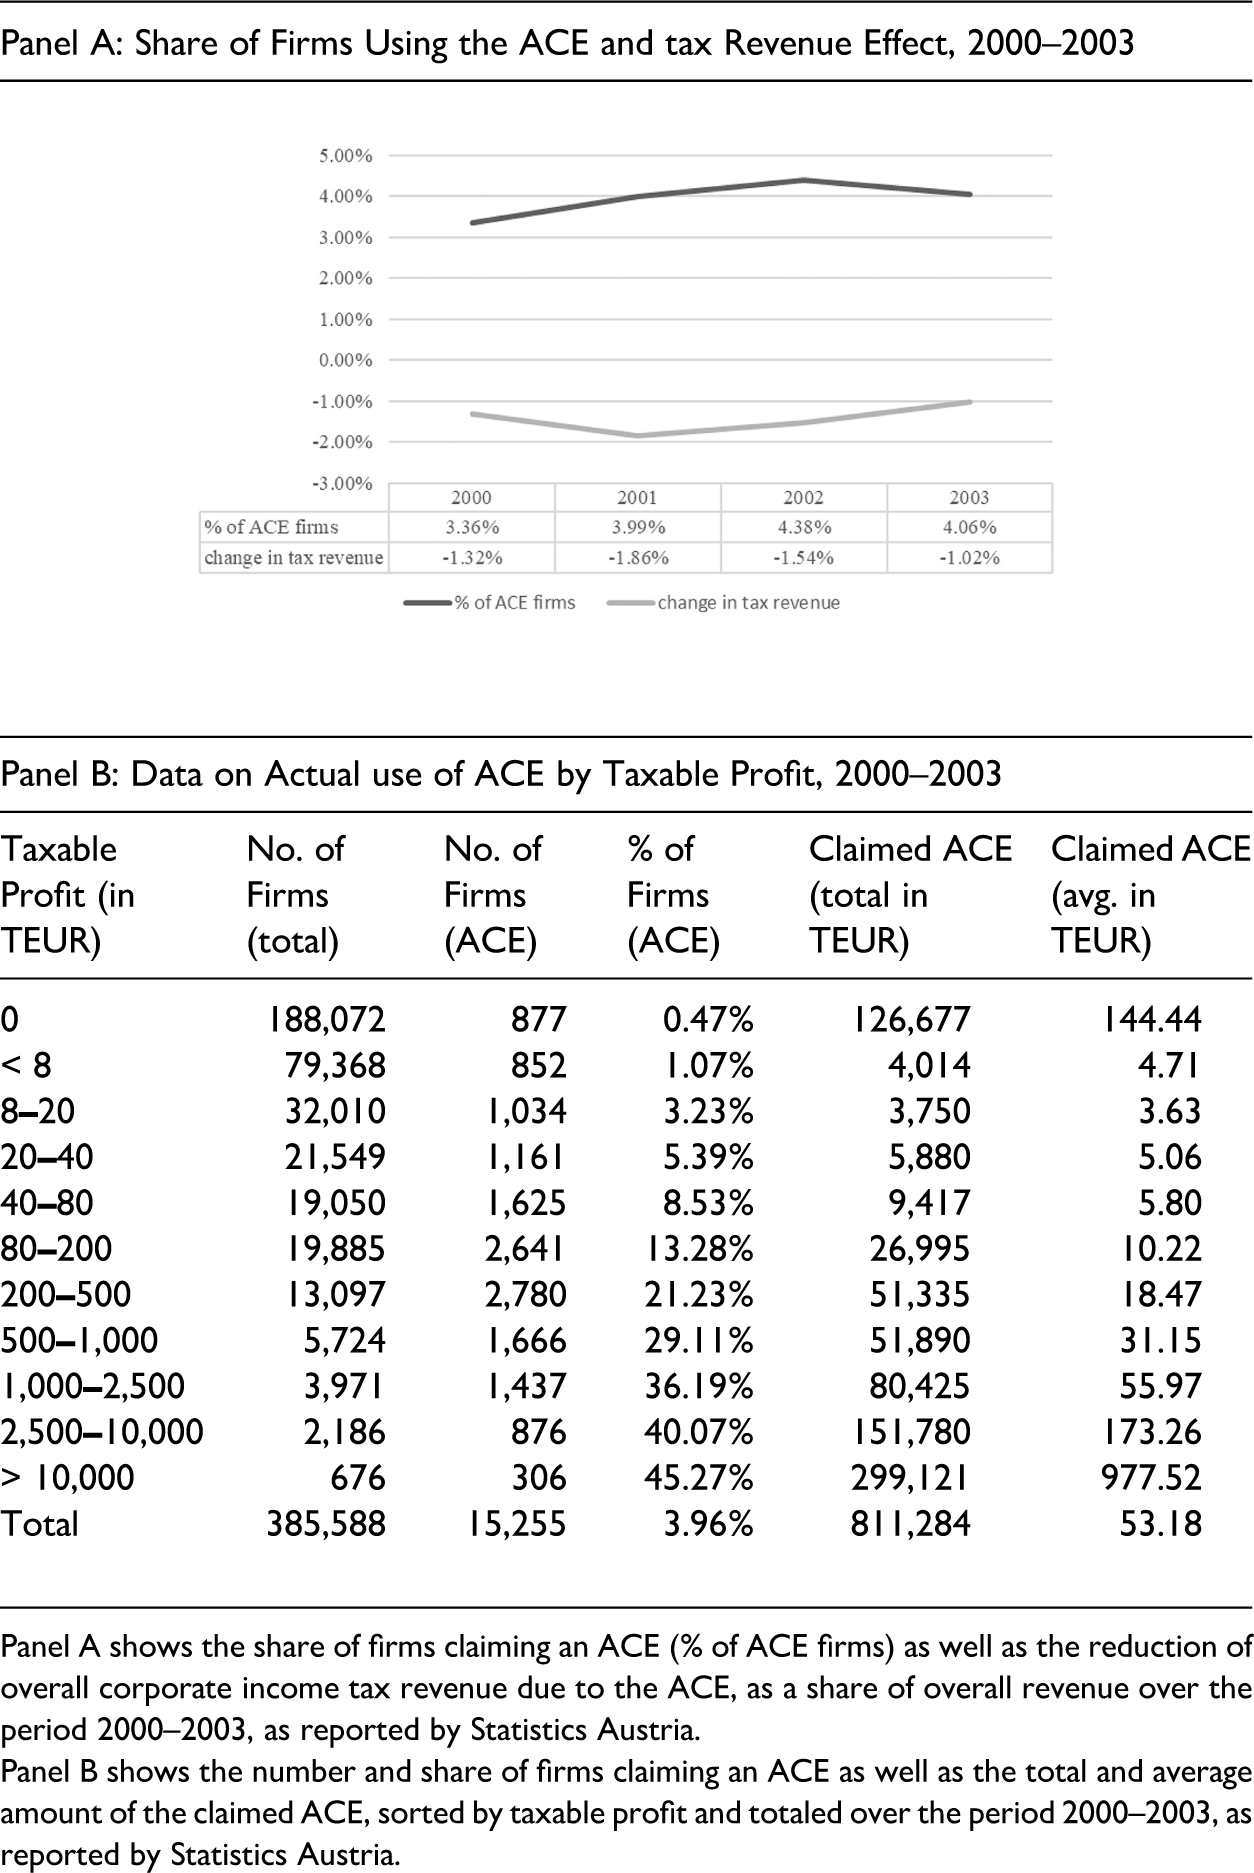
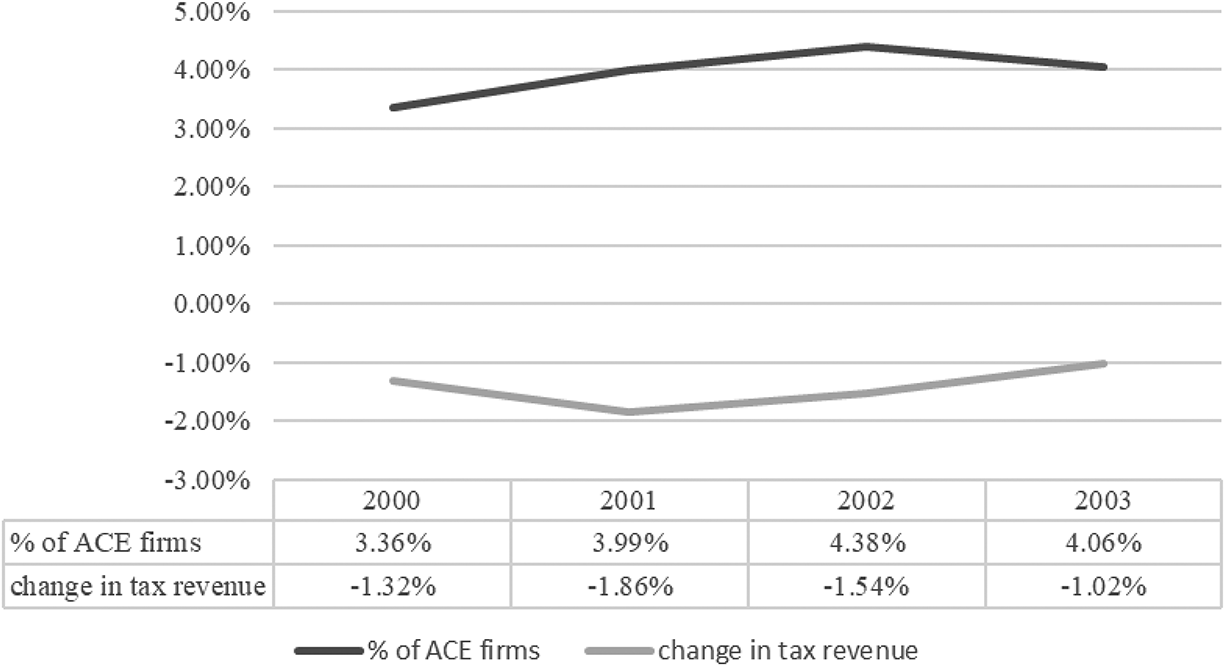
Panel A shows the share of firms claiming an ACE (% of ACE firms) as well as the reduction of overall corporate income tax revenue due to the ACE, as a share of overall revenue over the period 2000–2003, as reported by Statistics Austria.
Panel B shows the number and share of firms claiming an ACE as well as the total and average amount of the claimed ACE, sorted by taxable profit and totaled over the period 2000–2003, as reported by Statistics Austria.
On average, about 4 percent of Austrian firms claimed an ACE over the period 2000–2003, with a total amount of 811 million euro claimed. The average ACE deduction amounted to 53,182 euro. The share of firms that claimed an ACE deduction remains relatively stable over the period 2000–2003 and ranges from 3.36 percent in 2000 to 4.38 percent in 2002. The annual corporate income tax revenue reduction due to the ACE ranged between 59 million euro (2000) and 92 million euro (2001), which represents between 1.32 percent (2000) and 1.86 percent (2001) of the overall corporate income tax revenue in those years. Over the whole observation period of 2000–2003, the tax revenue loss amounted to 275 million euro (1.43% of corporate income tax revenue). This relatively small revenue reduction is due to the specific structure of the Austrian ACE tax system that provided for a reduced rate for the notional interest rather than a full exemption.
Data in Panel B of Table 1 shows that the propensity to claim an ACE increases with the firm's taxable profit. On average, 45.27 percent of firms with a taxable profit of more than 10 million euro claimed an ACE and the average deduction claimed amounted to 977,520 euro. In contrast, only 1.07 percent of firms with a taxable profit of up to 8,000 euro claimed an ACE and the average deduction amounted to 4,711 euro. Furthermore, 0.47 percent of firms with a negative taxable profit also claimed an ACE and the average amount claimed by loss firms is a substantial 144,444 euro. This shows that tax loss firms were still able to increase their book equity either by not distributing financial accounting profits or via an equity injection by owners.
As for all types of ACE tax systems, the Austrian ACE tax systems decreased the tax benefit of debt and therefore reinforced the relative attractiveness of equity financing vis-à-vis debt. Companies aiming at benefitting from the ACE thus had to increase their equity. Our baseline hypothesis therefore reads as follows:
H1: Firms increased their equity ratios after the introduction of the ACE tax system in Austria.
Compared to other ACE tax systems, the Austrian ACE offered only a small decrease in the tax benefit of debt, which mainly narrowed down to a reduction in the tax rate on notional interest on equity increases of 9 percentage points. Nontax factors could therefore be important enough to prevent firms from applying the ACE tax system.
One potential issue is that the Austrian ACE tax system was applicable only to increases in equity. These equity increases could be established either by equity injections from owners or by retaining earnings. Equity injections (such as the issuance of new shares), however, were subject to a capital duty at the rate of 1 percent of the raised capital. Since the capital duty on equity injections was higher than the effective tax rate reduction of the Austrian ACE variant, it was not feasible to use equity injections to benefit from the ACE system. Therefore, we assume that companies applying the ACE system were predominately retaining earnings, and thus constraining dividend payouts, rather than raising new capital.
The first theoretical model that explains how firms choose their dividend payout ratio has been provided by Lintner (1956). Based on survey interviews, Lintner (1956) describes that firms, in general, determine their dividend payout as a targeted ratio of dividends to profits. Yet he finds that the dividend payout policy does not react immediately to annual changes in profits. Since the management aims to avoid making non-sustainable changes to the dividend policy, the dividend ratio is adjusted only partially to changes in profitability. As a result, he describes dividends to be sticky, based on long-term average profitability levels rather than the current year's profits and smoothed from year to year. There exists a vast number of studies providing empirical support for the partial adjustment theory (Fama and Babiak 1968; DeAngelo 1991; Benartzi et al., 1997; Brav et al. 2005). These studies further show that owners prefer stable payout ratios over time. Another stream of empirical studies (Asquith and Mullins 1983; Healy and Palepu 1988; Michaely et al., 1995) documents that the absolute magnitude of stock price change is larger for dividend omissions than for dividend initiations, indicating that owners are more sensitive to firms decreasing their dividend payments from year to year.
Bhattacharya (1979), John and Williams (1985), Miller and Rock (1985), and Allen et al., (2000) explain dividend payouts of the firm based on a signaling model. In this model, dividend payout of firms serves as a signal of expected future earnings in an imperfect-information setting. Firms refrain from constraining dividend payments to avoid a negative signal to the capital market.
We argue that the relatively small tax benefit of the Austrian ACE could be overcompensated by the negative ramifications of dividend omissions, especially in the case of high dividend payout levels in the past. We expect firms with higher historic dividend levels to refrain from using the ACE tax system, which leads to the following hypothesis:
H2: The increase in equity ratios is lower for firms with higher levels of past dividends.
Another theory uses agency considerations to explain dividend payouts of firms. In the Jensen and Meckling (1976) framework, managers of public firms might use excess resources such as free cash flow for investments that benefit themselves but are not in the best interest of the owners. One way to avoid this problem is for owners to constrain the cash flow available for managerial spending, for example, by demanding high levels of dividend payouts (Grossman and Hart 1980; Jensen 1986). Brav et al. (2005) point out that agency considerations are likely to be more severe in public firms than in private firms. As a result, the demand for high levels of dividends is lower in private firms (Grullon et al.,) and, in general, closely linked to the ownership structure of the firm (Michaely and Roberts 2012). Privately held firms and firms with a single controlling owner depend less on the equity market. Furthermore, privately held firms do not have to consider the reactions of the capital market when changing their payout policy. Private firms can thus use the Austrian ACE and increase their equity levels by retaining earnings without exposing them to negative ramifications from the capital markets to the reduced payout levels. Additionally, majority-owned firms are significantly less averse to omitting or constraining dividends since there is little if any separation between ownership and control in majority-owned firms (Jensen and Meckling 1976).
Another potential issue for firms with dispersed ownership is that of different (tax) preferences among the owners of the firm. These different preferences could range from strategic differences to differences in the day-to-day management of the company. In general, the more owners a company has the more different opinions regarding the decisions of the company might arise. Different opinions might lead to suboptimal utilizations of tax rules by the firm (Jacob and Michaely 2017). With regards to the research questions of this paper, the most important business decision, which might cause different opinions among the owners, is the question of applying the ACE tax system. Owners face the trade-off between the tax benefit of a notional interest deduction on retained earnings (which could increase the value of the firm in the long run) and the maintenance of (high) dividend payments, which could decrease the overall cash holdings of the owners (in the short run). In a majority-owned firm, the majority owner can choose according to their preferences. In firms with dispersed ownership, however, preferences among owners might differ and firms might not be able to use the ACE tax system at all or at least not to the maximum possible amount. Our third hypothesis therefore reads as follows:
H3: The increase in equity ratios is higher for majority-owned firms than for firms with dispersed ownership.
Data and Research Design
Sample
Since all Austrian firms could apply the ACE tax system, identifying the effect of the tax reform, in the absence of a mere time trend, requires adding at least one control group from a different country to the analysis. To find a suitable control group country, we perform the following procedure: first, in order to consider only countries with a similar economic environment, we limit the countries that could potentially serve as a control group to the 14 EU member states (besides Austria) in 1996; second, we compare average statutory tax rates on corporate income as well as dividend income for the fourteen countries over the period 1996–1999 (pre-reform) to 2000–2003 (post-reform) and exclude nine countries with major changes in at least one of the average statutory tax rates. 4 Third, we control for major changes in the corporate tax bases in the remaining countries by comparing effective average and effective marginal tax rates (Devereux and Griffith 1999, 2003), both at the corporate as well as the owner level, over the period 1998–1999 to 2000–2003. 5 We do not observe major changes in average or effective marginal tax rates in any of the remaining countries (Belgium, Denmark, Finland, Sweden, and the United Kingdom). In a final step, we evaluate data coverage in the AMADEUS database, used for our analysis, and have to exclude Denmark and Finland because of restricted data coverage in the earlier years of our analysis. Also, we exclude the United Kingdom since the size of the country and economy is very different from Austria. We finally arrive at two countries that are suitable as control groups: Belgium and Sweden. Austria and Sweden joined the European Union in 1995 and thus faced similar adjustments of their local economy and legal systems to the new market. However, whereas Austria and Belgium joined the euro area in 1999, Sweden decided to keep its currency. We collect data on Austrian, Belgian, and Swedish firms from the AMADEUS database. We identify 724 Austrian firms, 6,875 Belgian firms, and 1,623 Swedish firms with available unconsolidated financial statement data over the full period of 1996–2003. One key assumption for the DD analysis is that the treatment and control groups have the same pretreatment characteristics. We, therefore, perform one-to-one nearest neighbor propensity score matching with no replacement for Belgian and Swedish firms separately to identify firms that are similar to the Austrian firms. We base the matching approach on three financial statement items (size, revenues, and profit, each for the year 1996) and enforce a strict matching only within country industries, based on the firms’ two-digit NACE industry codes. After the matching procedure, the final sample consists of 2,172 firms, that is, 724 from Austria and 724 each from Belgium and Sweden, and 11,584 firm-year observations. 6 Table 2 assesses the quality of the matching procedure in more detail (Garrido et al. 2014). To this extent, we provide measures of standardized differences and the overall reduction in standardized bias for all variables that enter the matching procedure (size, revenues, and profit) in Panel A of Table 2.
Assessment of the Matching Procedure.
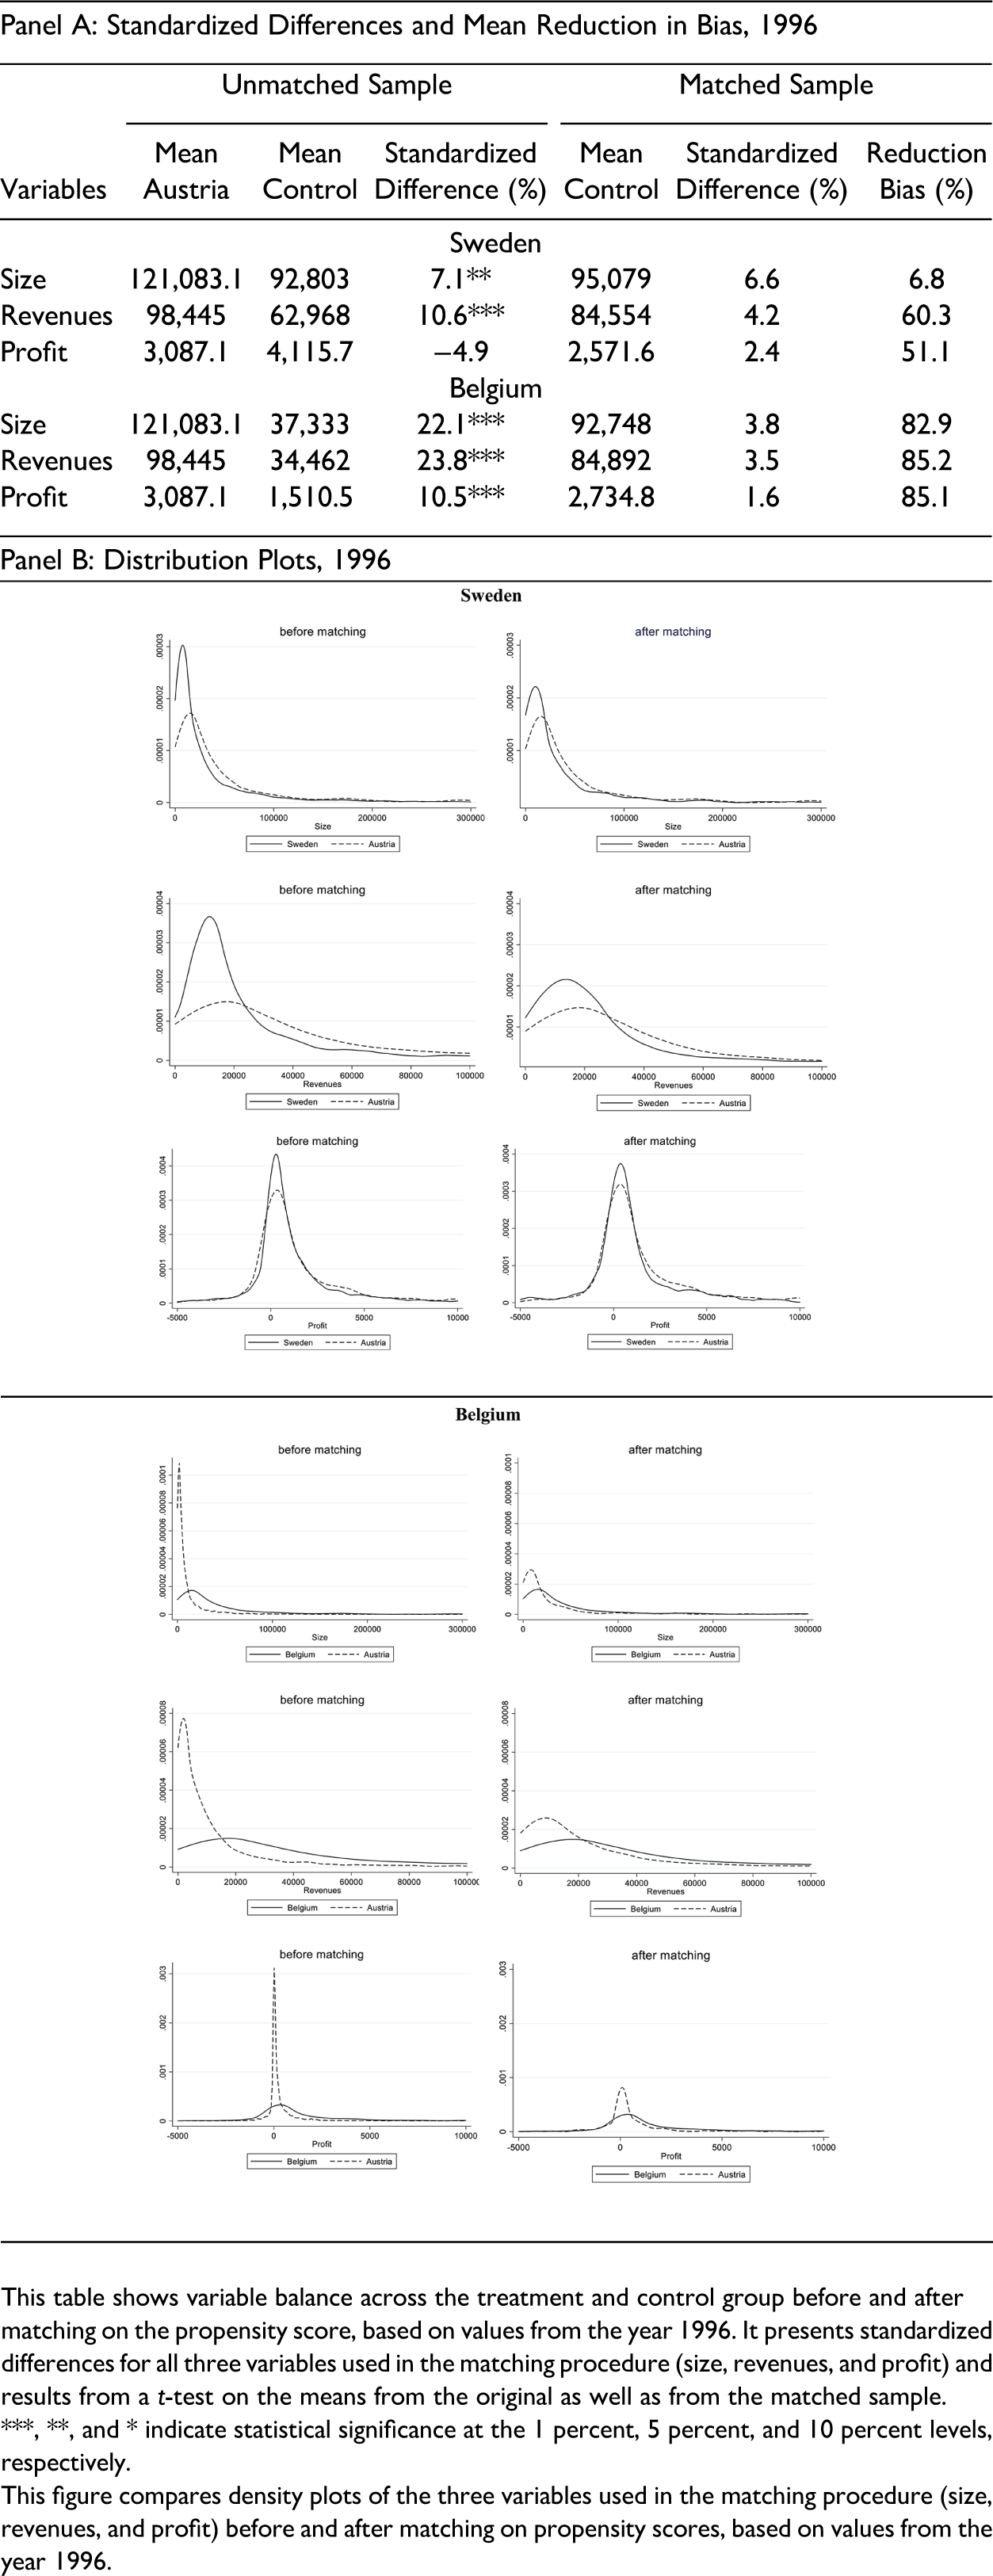
This table shows variable balance across the treatment and control group before and after matching on the propensity score, based on values from the year 1996. It presents standardized differences for all three variables used in the matching procedure (size, revenues, and profit) and results from a t-test on the means from the original as well as from the matched sample. ***, **, and * indicate statistical significance at the 1 percent, 5 percent, and 10 percent levels, respectively.
This figure compares density plots of the three variables used in the matching procedure (size, revenues, and profit) before and after matching on propensity scores, based on values from the year 1996.
After propensity score matching, the means of all variables are balanced across the treatment group and the two control groups. The observed standardized differences in means after matching are below 10 percent for all variables and below 5 percent for all variables except for size when using Sweden as the control group. Based on a t-test, five out of six variables show a significant difference in their means before the matching procedure, whereas no significant difference can be found after the matching procedure. Additionally, we observe a reduction in bias of over 50 percent for five out of six variables. Panel B of Table 2 presents plots of the distributions of the size, revenues, and profit before and after propensity score matching. The distribution of all variables in both specifications is reasonably similar after propensity score matching.
Another important assumption in a DD analysis is that the equity ratios of the treated and nontreated firms would follow a parallel trend in the absence of the introduction of the ACE tax system in Austria. Although the parallel trend assumption cannot be formally tested, the trends in equity ratios can be compared graphically and statistically for the pre-reform period (Angrist and Pischke 2008; Roberts and Whited 2013). Panel A of Table 3 shows the mean equity ratios for Austrian (solid black line), Swedish (dashed gray line), and Belgian (dashed blue line) sample firms over the period of 1996–2003. Before the introduction of the Austrian ACE in 2000, the equity ratios in the three countries appear to follow a parallel trend. This outcome is further supported by a statistical analysis. To this extent, we assess the difference between the equity ratios for Austrian and Swedish (Belgian) firms in the pre-reform period. We regress the equity ratios on the treatment indicator variable interacted with year indicators for the pre-reform years 1997 to 1999, along with firm-fixed and year-fixed effects. The interaction coefficients of this regression compare the relative annual changes in equity ratios in the pre-reform period of the treatment group to the control group. To support the parallel trends assumption, the interaction coefficients should be statistically and economically zero in the pre-reform period (Angrist and Pischke 2008; Roberts and Whited 2013). In Panel B of Table 3, none of the interaction coefficients in the pre-reform period appears to be statistically significant, as indicated by the inclusion of zero in the 95% confidence intervals.
Assessment of the Parallel Trend Assumption.
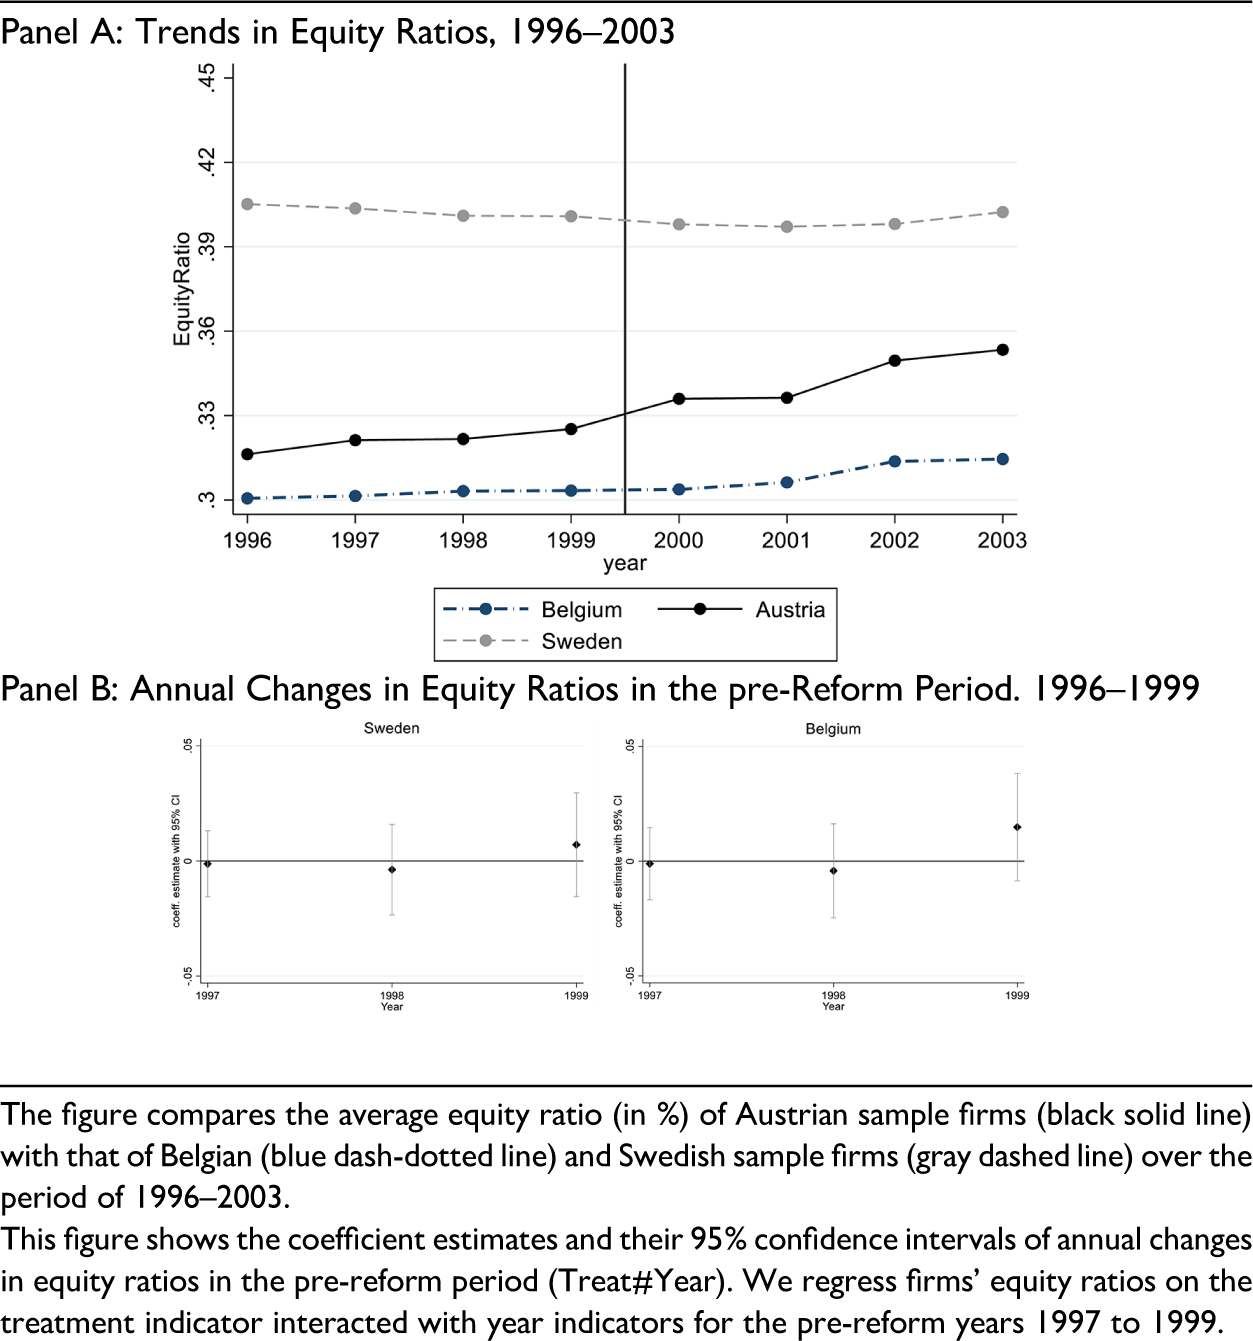
The figure compares the average equity ratio (in %) of Austrian sample firms (black solid line) with that of Belgian (blue dash-dotted line) and Swedish sample firms (gray dashed line) over the period of 1996–2003.
This figure shows the coefficient estimates and their 95% confidence intervals of annual changes in equity ratios in the pre-reform period (Treat#Year). We regress firms’ equity ratios on the treatment indicator interacted with year indicators for the pre-reform years 1997 to 1999.
Regression Model and Definition of Variables
We analyze the effect of the introduction of the Austrian ACE tax system in 2000 on the equity ratios of Austrian firms. We calculate a firm's equity ratio, 
DeAngelo and Masulis (1980) show that the existence of tax shields other than interest payments affect the capital structure of firms (substitution hypothesis), that is depreciation, investment tax credits, or loss carryforwards. We implement NOL to control for whether a firm has unused tax loss carryforwards. Information on tax loss carryforwards is not available in AMADEUS. We follow MacKie-Mason (1990) and, in particular, Overesch and Völler (2010) and proxy for the existence of tax loss carryforwards using the firm's EBIT lagged by one year. NOL is a dummy variable that takes the value of 1 if a firm has a negative EBIT in the previous year and 0 otherwise. We expect a negative coefficient for NOL. Previous studies such as Wald (1999) have found that the profitability of a firm has an influence on its capital structure. There are several theories regarding the effect of profitability on capital structure. According to the trade-off theory as well as the free cash flow theory, more profitable firms should have higher debt ratios than less profitable firms as there is a lower risk of financial distress (Kraus and Litzenberger 1973; Jensen 1986), while the pecking order theory argues that firms with (better) investment opportunities are more profitable and less leveraged than those firms without such opportunities (Myers and Majluf 1984). We calculate Profitability as the EBIT deflated by total assets, both lagged by one year. To control for size effects, we add Size to our model, which is measured as the natural logarithm of total assets (Schulman et al. 1996). Prior empirical research has shown that smaller firms tend to have lower equity ratios than larger firms (Frank and Goyal 2009). The incentive to accumulate additional equity is therefore higher for smaller firms. Additionally, we include Tangibles, that is, the tangible assets divided by total assets, into our regression model (Scott 1976; Harris and Raviv 1990). Additionally, Pfaffermayr et al., (2013) show that the capital structure of a firm changes throughout its life cycle. We therefore add the variable Age, which is calculated as the natural logarithm of the years between incorporation and the year under investigation. Hebous and Ruf (2017) document that firms belonging to a multinational group show a different reaction to the introduction of an ACE tax than domestic firms. We therefore include MNE, a dummy variable that takes the value of 1 if the firm is part of a multinational group and 0 otherwise. A firm is part of a multinational group if it is either held (indirectly or directly) by a foreign owner or if it owns foreign subsidiaries itself.
To control for time-variant country-specific effects, we add two country-level variables to the model. We control for the annual growth in GDP per capita with GDPGrowth, as well as the annual percentage change in consumer prices with Inflation, both of which we obtain from the World Bank.
To reduce the effect of outliers, we winsorize all variables at the first and ninety-ninth percentiles. All regressions include firm-fixed and year-fixed effects, and, since our main analysis is based on matching without replacement, we estimate heteroscedasticity-robust standard errors clustered at the country-industry level (Abadie and Spiess 2020).
For our cross-sectional tests (H2 and H3), we need further data on the dividend payout ratio as well as the ownership structure of the firm. As we have mainly nonlisted firms in the sample, we cannot directly observe the dividend payments. Instead, we follow the approach of Rünger et al., (2019) and calculate the firm-specific dividend ratio, Div, as a function of the firms’ profit/loss per period, 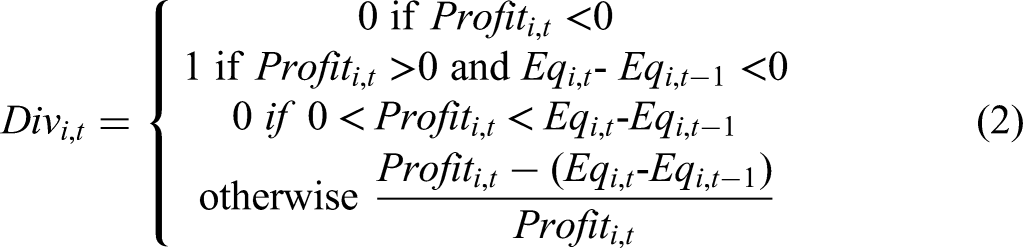
To test H2 and H3, we separately add Div and MajOwner to our regression specification in equation (1) and additionally interact Div and MajOwner with the DD variables. According to equation (2), a change in equity affects both Div and our dependent variable of interest (equity ratios) at the same time. We are still confident, however, that a sample split based on Div does not mechanically separate high and low responders to the reform since the basis for the notional interest was the increase of the book value of equity during the respective taxable year compared to the highest increase in book value of equity over the preceding seven years (see Theoretical and Institutional Background section). In addition, we further mitigate endogeneity concerns by including Div as a one-year lagged variable in the estimations. As a result, we obtain a triple difference-in-difference estimation (DDD). Following our hypothesis, we expect a negative (positive) coefficient for the DD interaction with Div (MajOwner).
Results
Summary Statistics and Parametric Tests
Our sample consists of observations for 2,172 firms (724 per country) over a time period of eight years, resulting in a total of 17,376 observations. Panel A of Table 4 shows summary statistics for all variables used in the regression analyses over the period of 1996–2003 by countries.
Summary Statistics.
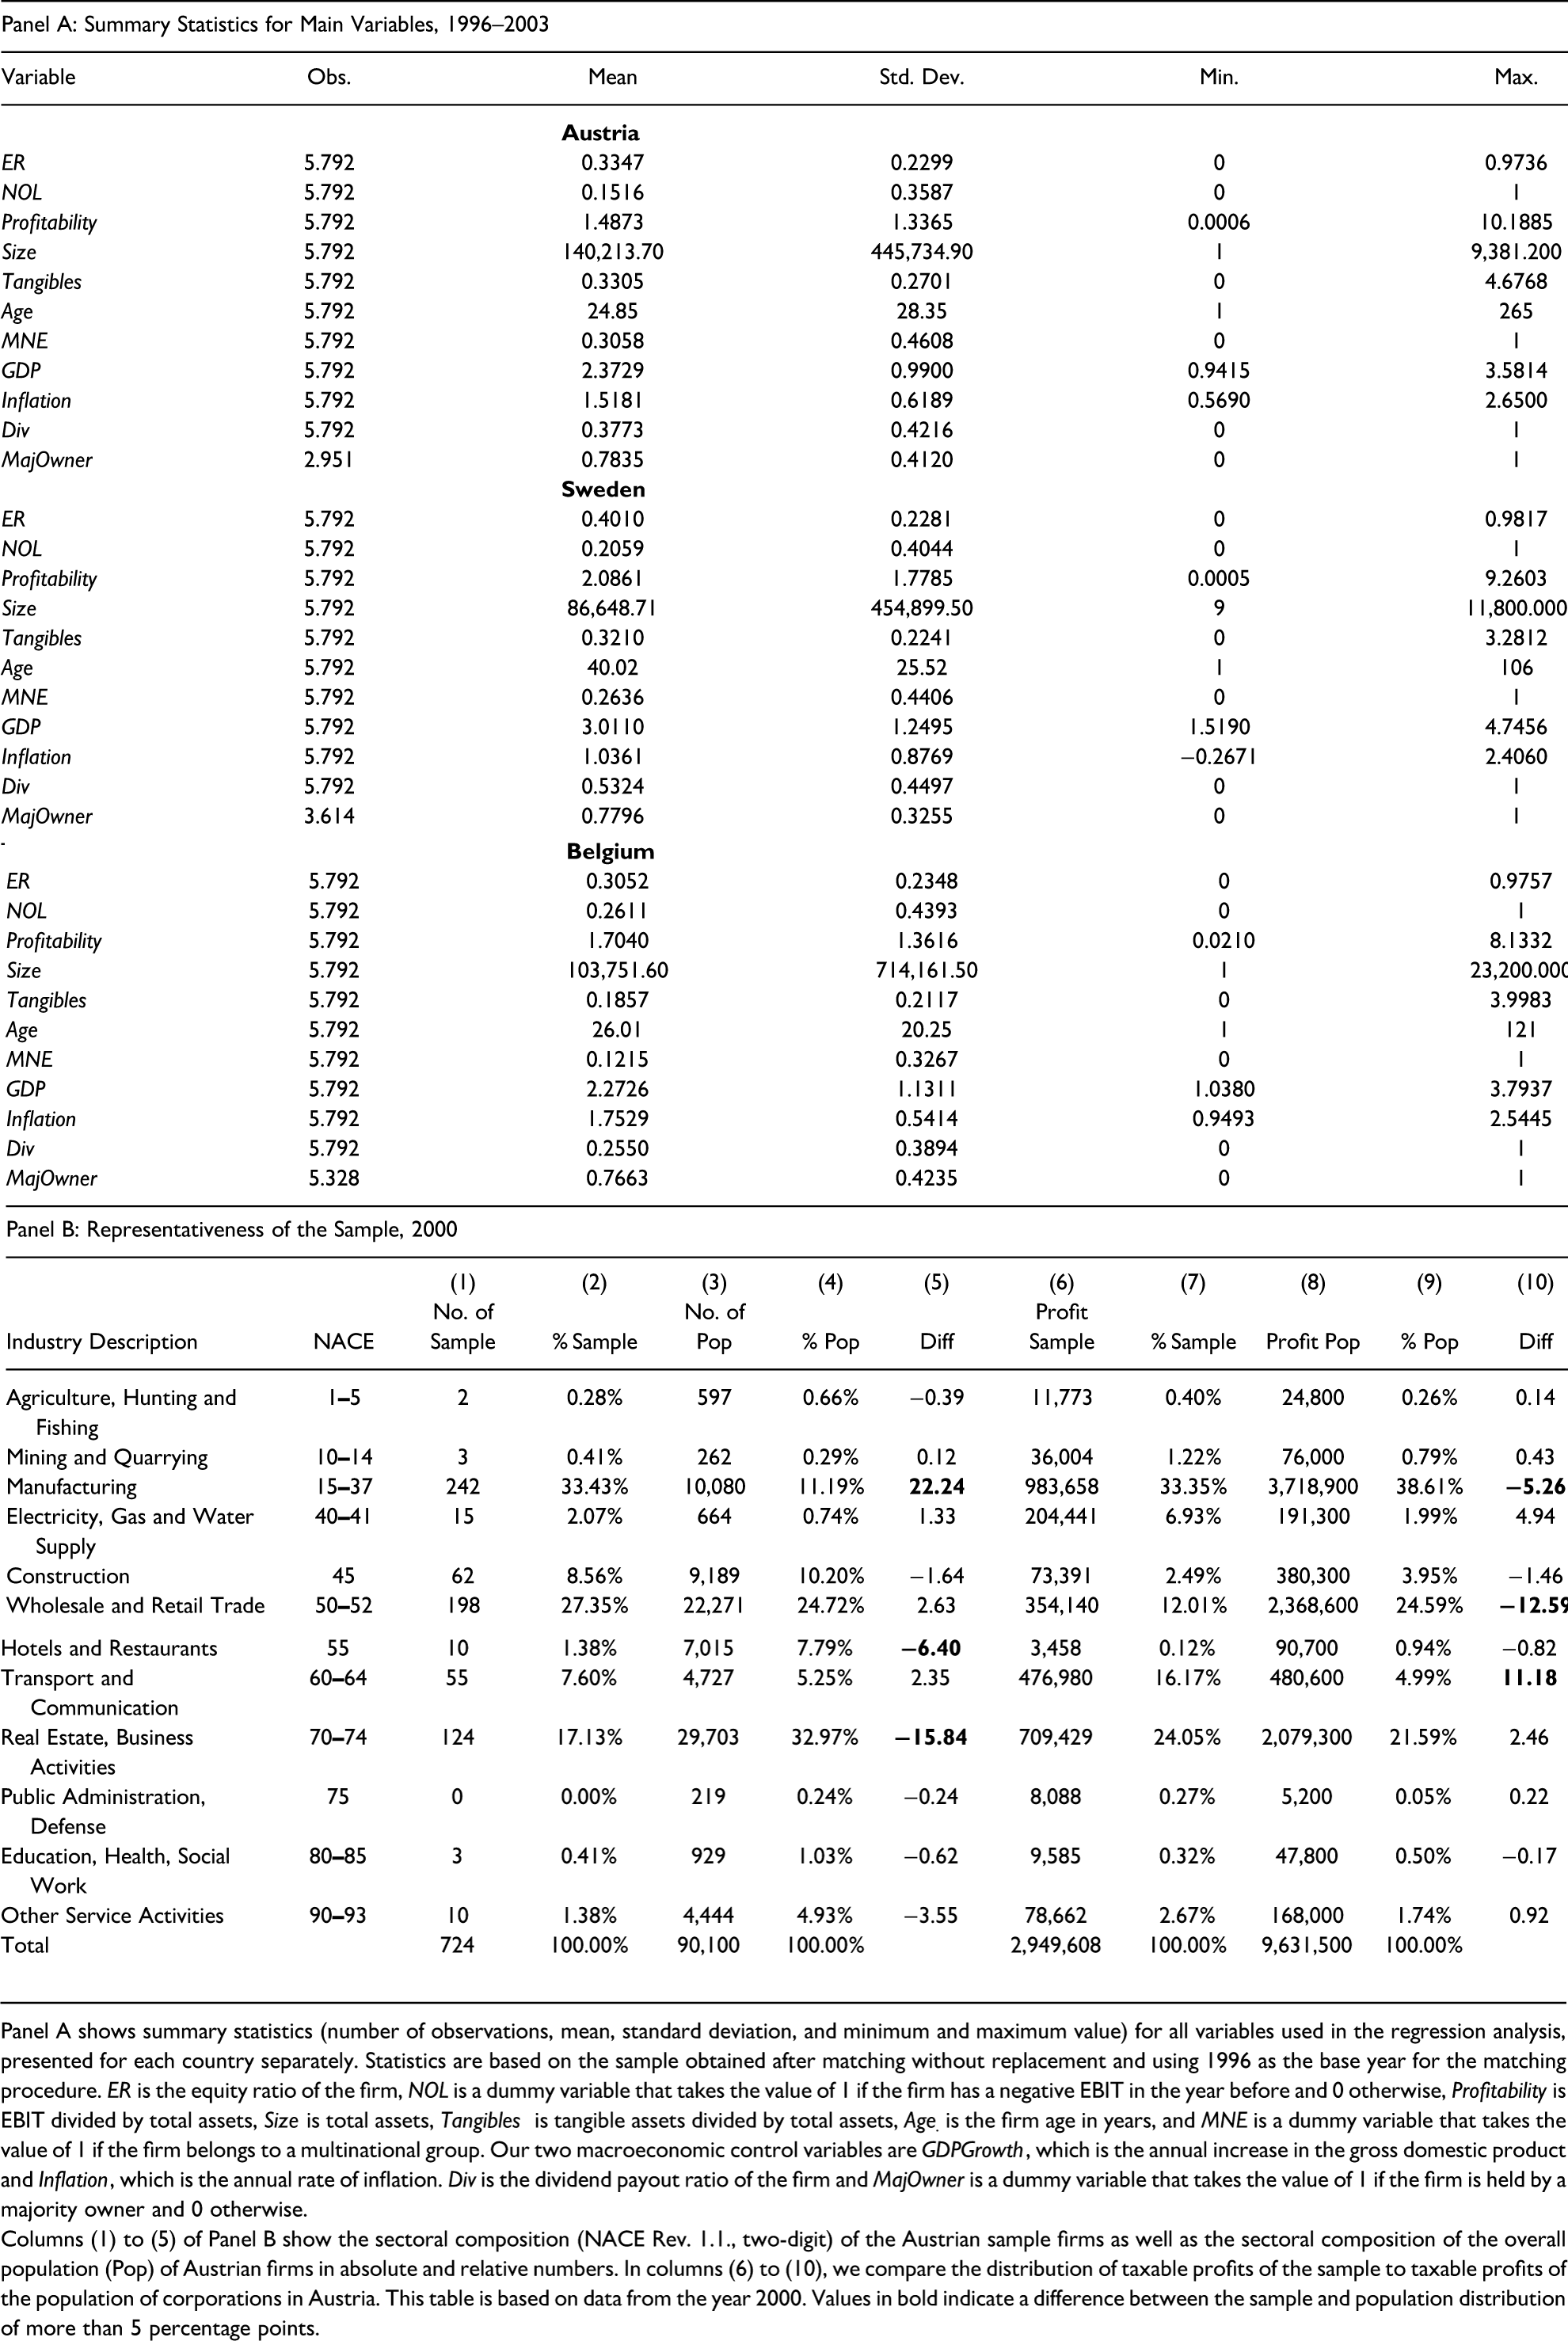
Panel A shows summary statistics (number of observations, mean, standard deviation, and minimum and maximum value) for all variables used in the regression analysis, presented for each country separately. Statistics are based on the sample obtained after matching without replacement and using 1996 as the base year for the matching procedure.
Columns (1) to (5) of Panel B show the sectoral composition (NACE Rev. 1.1., two-digit) of the Austrian sample firms as well as the sectoral composition of the overall population (Pop) of Austrian firms in absolute and relative numbers. In columns (6) to (10), we compare the distribution of taxable profits of the sample to taxable profits of the population of corporations in Austria. This table is based on data from the year 2000. Values in bold indicate a difference between the sample and population distribution of more than 5 percentage points.
On average, the equity ratios of our sample firms vary between 30.52 percent (Belgium), 33.47 percent (Austria), and 40.10 percent (Sweden). The share of firms with a negative EBIT in the past year is highest in Belgium (26.11%) and lowest in Austria (15.16%). Firms in all three countries show similar average profitability (1.48%–2.08%). Firms are, on average, smallest in Sweden (total assets of about 86 million euro) and largest in Austria (total assets of about 140 million euro). Tangible assets of Austrian and Swedish firms amount to about 32 to 33 percent of total assets, whereas Belgian firms have a lower mean value of about 18 percent. On average, sample firms from Austria and Belgium are about twenty-five years old, whereas Swedish firms are older (forty years, on average). Only 12% of Belgian firms in the sample are part of a multinational group, whereas 26 to 30 percent of Swedish and Austrian firms are part of a multinational group. The dividend payout ratio of Swedish firms (53.24%) is higher than the dividend payout ratio of Austrian (37.73%) and Belgian (25.50%) firms. For all three countries, about 76 to 78 percent of firms are held by a majority owner.
In Panel B of Table 4, we assess the representativeness of our sample. To this extent, we analyze the sectoral composition of the sample 7 as well as the distribution of taxable profits across industries in our sample, both compared to the overall population 8 of Austrian corporations. Most of our sample firms (33.43%) belong to the manufacturing sector, NACE Rev. 1.1. codes 15 to 37. In total, 27.35 percent of firms belong to the wholesale and retail trade industry, NACE Rev. 1.1. codes 50 to 52 and another 17.13 percent to the real estate, renting and business activities industry, NACE Rev. 1.1. codes 70 to 74. These three industries together cover 77.91 percent of our sample. We find a similar distribution of industries in the overall population of Austrian firms. The three most important industries in our sample amount to 68.88 percent of the population of corporations in Austria. Manufacturing firms, however, form a smaller part (11.19%) of the population of Austrian corporations, and the country's firms in the real estate, renting and business activities industry form a larger part (32.97%) of the population. In terms of taxable profit, however, our sample firms appear to have substantially larger taxable profits than the overall population. On average, our sample firms have a taxable profit of 4.07 million euro, whereas the average taxable profit of the overall population is 106,900 euro. The reason for this discrepancy is the fact that firms covered in AMADEUS are larger firms and firms with higher profits. The results obtained from our sample might still be representative for the following reasons: first, our 724 sample firms together represent 30.63 percent of taxable profits of the overall population of Austrian corporations; second, as we have shown in Table 1, firms with small taxable profits were less likely to adopt the ACE. Inferences based on large firms might therefore give an even more representative picture of the overall effect of the introduction of the ACE on corporate equity levels; third, when comparing the distribution of taxable profits across industries we find rather similar results. Firms in the manufacturing and wholesale industry are more profitable and firms in the transport, storage, and communication industry are less profitable in the overall population compared to our sample, but differences are always below 15 percentage points. Taken together, we are confident that our sample firms are suitably representative of the overall population of Austrian corporations.
Table 5 provides the results from parametric t-tests comparing the mean equity ratios for Swedish (Belgian) and Austrian firms over the pre-reform (1996–1999) and post-reform (2000–2003) periods.
Parametric Tests, 1996–2003.
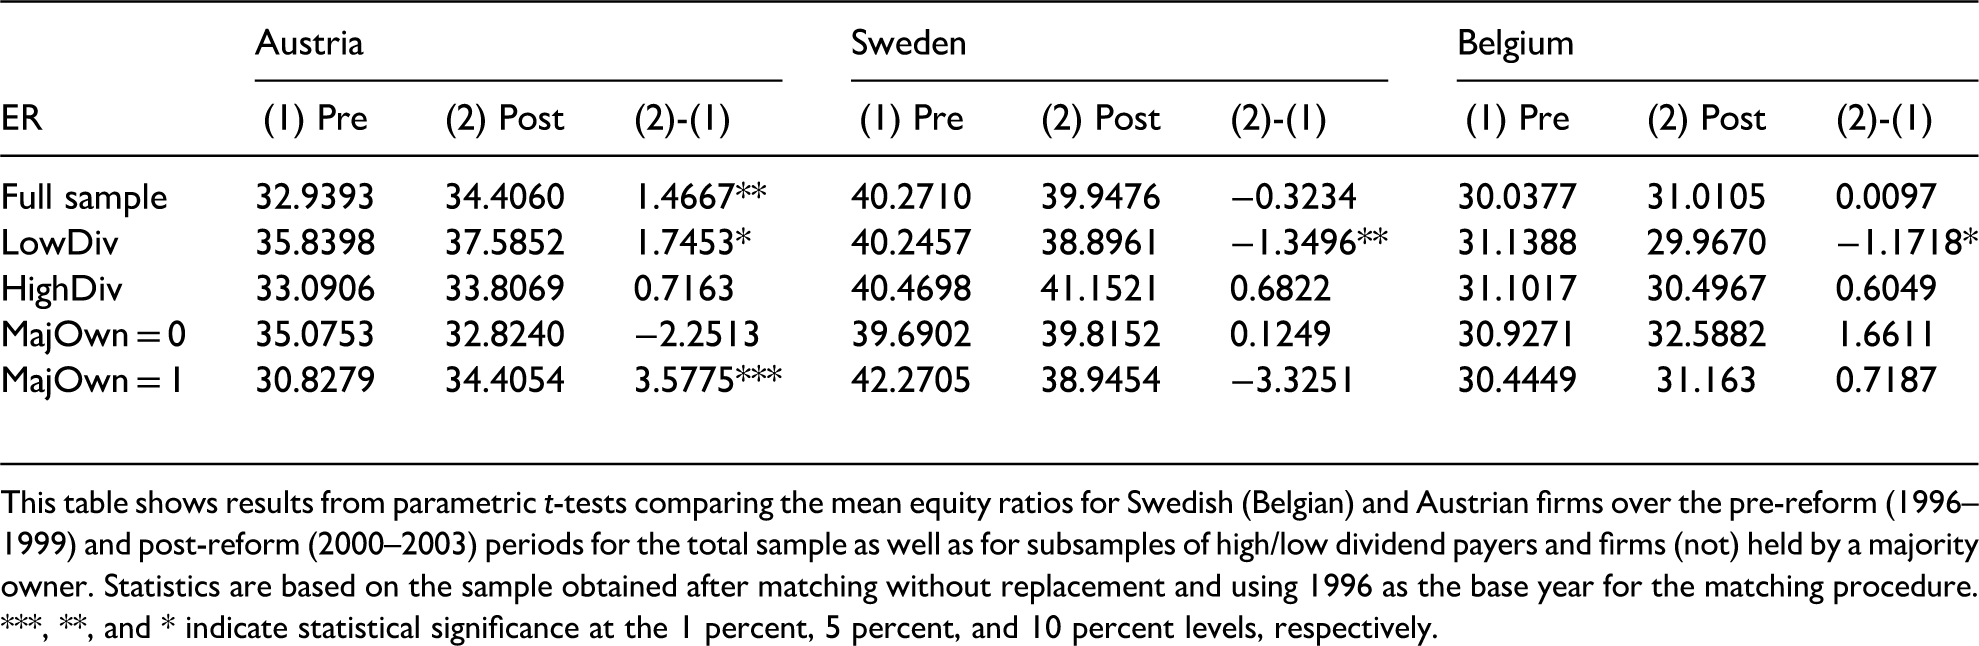
This table shows results from parametric t-tests comparing the mean equity ratios for Swedish (Belgian) and Austrian firms over the pre-reform (1996–1999) and post-reform (2000–2003) periods for the total sample as well as for subsamples of high/low dividend payers and firms (not) held by a majority owner. Statistics are based on the sample obtained after matching without replacement and using 1996 as the base year for the matching procedure. ***, **, and * indicate statistical significance at the 1 percent, 5 percent, and 10 percent levels, respectively.
Columns (1) and (2) show that the equity ratios of Swedish (Belgian) firms slightly decrease (increase) in the post-reform period, but the difference from the pre-reform period is not significant. On the other hand, columns (3) and (4) show that equity ratios of Austrian firms increase by approximately 1.47 percentage points in the post-reform period. This difference is significant at the 5 percent significance level.
We also conduct t-tests with the firms split into subgroups, according to H2 and H3. First, we perform a median sample split according to the firm's average dividend payout ratio in the pre-reform period (1996–1999). 9 We find that Swedish and Belgian firms in the lower half of the sample (LowDiv) significantly decrease their equity ratios in the post-reform period. Austrian firms in the low dividend subsample, however, significantly increase their equity ratios after the introduction of the ACE tax system. This outcome is the first indicator that Austrian firms with low dividend payout ratios in the past significantly increased their equity ratios after the introduction of the ACE tax system. In contrast, we do not find that firms in the high dividend subsample significantly change their equity ratios in the post-reform period. This result holds for Swedish, Belgian, and Austrian firms.
Next, we compare the equity ratios for firms with no majority owner and firms with a majority owner. We do not observe significant changes in the equity ratios for widely held firms in either country. Additionally, we do not find that Swedish or Belgian firms with a majority owner significantly change their equity ratios in the post-reform period. However, we do find that Austrian firms with a majority owner have significantly higher equity ratios in the post-reform period. Again, this is the first indicator of a heterogeneous response to the ACE tax system among Austrian firms.
Regression Results
Following our first parametric results, we perform a linear DD analysis based on equation (1) and present the results in Table 6.
Difference-in-Difference (DD) Analysis of the Austrian Allowance for Corporate Equity (ACE) tax System, 1996–2003.
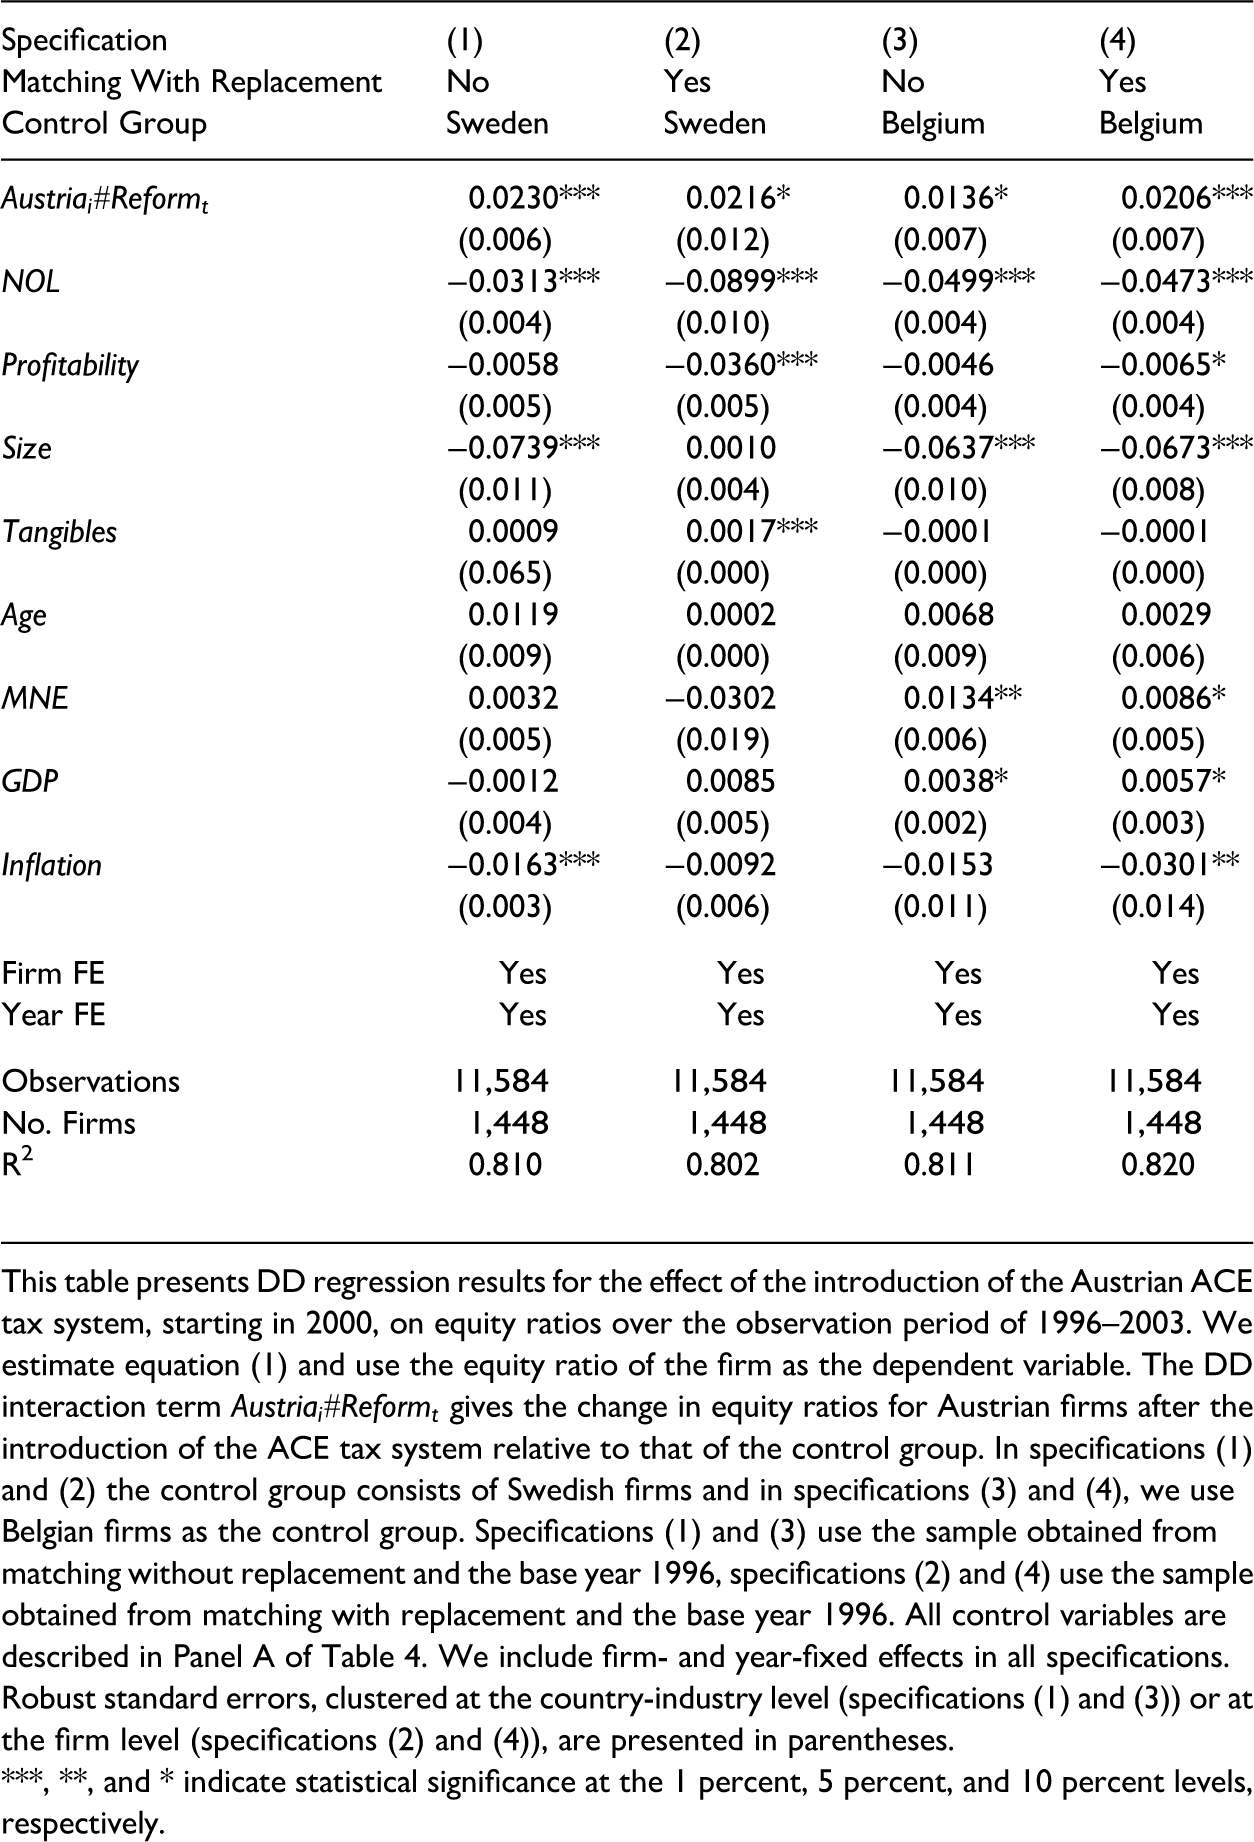
This table presents DD regression results for the effect of the introduction of the Austrian ACE tax system, starting in 2000, on equity ratios over the observation period of 1996–2003. We estimate equation (1) and use the equity ratio of the firm as the dependent variable. The DD interaction term
The main variable of interest in the DD model is
Specifications (1) and (3) in Table 6 report regression results using the sample obtained from propensity score matching without replacement, and specifications (2) and (4) in Table 6 report regression results using the sample obtained from propensity score matching with replacement. Among all four specifications, we find the expected positive and significant coefficient for
To test for cross-sectional differences in firm behavior, we apply a linear DDD regression. First, we interact the DD estimation in equation (1) with Divi,t−1, which is the firm-specific dividend payout ratio of the past year calculated as shown in equation (2). If firms are reluctant to constrain dividend payments, then firms with high levels of dividends in past years have to maintain their dividend payments and might not respond to the introduction of the ACE tax system. We, therefore, expect a negative coefficient for the DDD estimator. We present the results for the DDD estimation in Table 7.
Cross-Sectional Differences, 1996–2003.
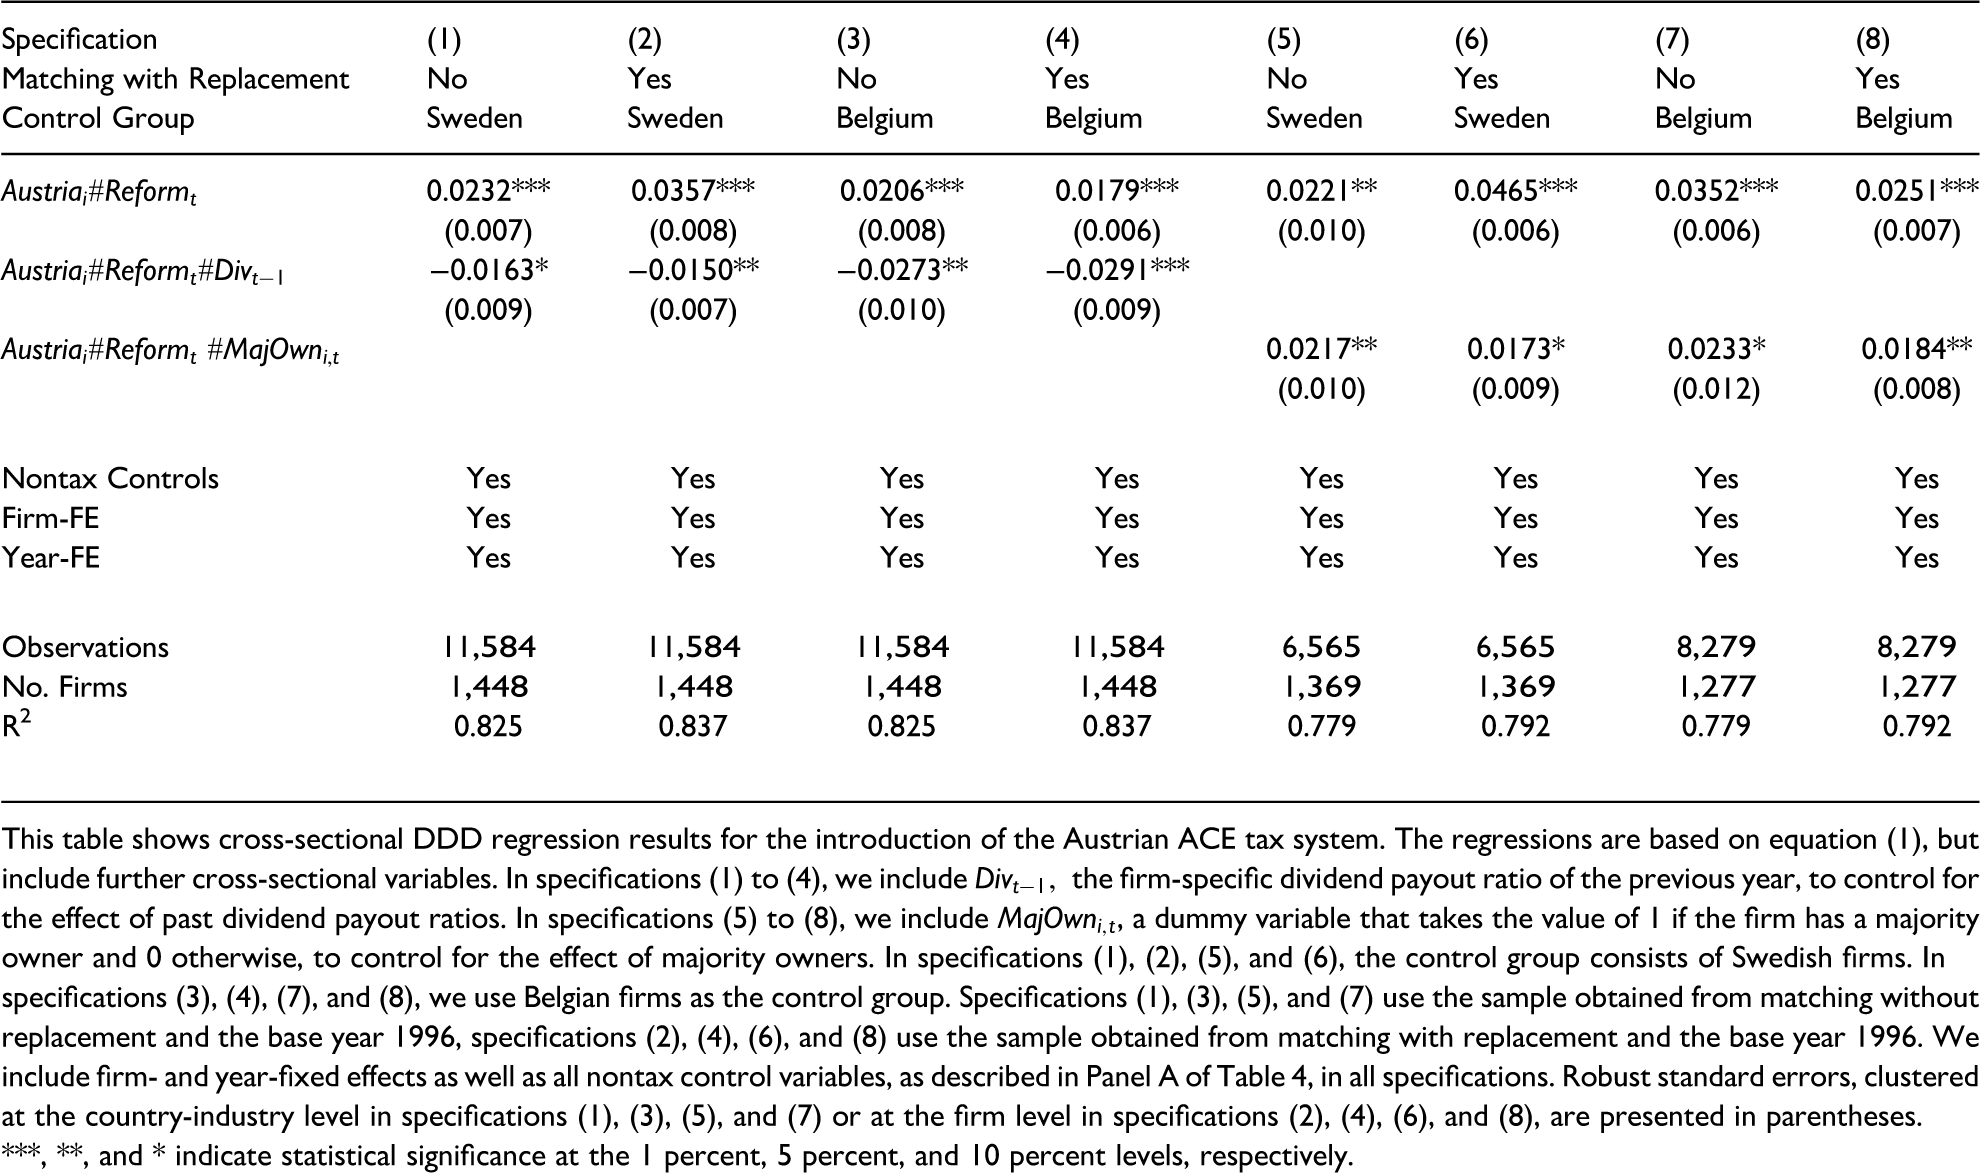
This table shows cross-sectional DDD regression results for the introduction of the Austrian ACE tax system. The regressions are based on equation (1), but include further cross-sectional variables. In specifications (1) to (4), we include
The results of the DDD estimation support hypothesis H2. After the introduction of the ACE tax system, we find the equity ratios of nondividend-paying firms in Austria to be approximately 2.32 to 3.57 percentage points higher than those of Swedish firms. Moving from a nondividend-paying firm to a firm with a dividend payout ratio of 1 significantly decreases this effect by 1.50 to 1.63 percentage points. Thus, Austrian firms with a dividend payout ratio of 1 show significantly lower equity ratios than nondividend-paying firms after the introduction of the ACE tax system compared to Swedish firms. The overall effect of the introduction of the ACE tax system on equity ratios of Austrian firms with a dividend payout ratio of 1, however, is still positive (0.0232–0.0163 = 0.0069 for firms matched without replacement and 0.0357–0.0150 = 0.0207 for firms matched with replacement). If we use Belgian firms as our control group, we again find higher equity ratios among nondividend-paying Austrian firms (1.79 to 2.06 percentage points). Also, this effect decreases significantly if moving to a firm with a dividend payout ratio of 1 (−2.73 to −2.91 percentage points). Contrary to the specifications with Swedish control firms, the overall effect of the introduction of the ACE tax system on equity ratios of Austrian firms with a dividend payout ratio of 1 is now negative (0.0206–0.0273 = -0.0067 for firms matched without replacement and 0.0179–0.0291 = −0.0112 for firms matched with replacement). For firms with very high dividend payout ratios, the benefit of maintaining their dividend levels seems to (almost) completely outweigh the tax benefit of the ACE tax system.
In the second cross-sectional test, we interact the DD estimation in equation (1) with MajOwneri,t, which is an indicator variable that takes the value of 1 if the firm has a majority owner and 0 otherwise. We hypothesize that in widely held firms, different preferences among the owners might prevent firms from applying the ACE tax system. As hypothesized, we find the expected positive coefficient for the DDD estimator. If firms have a majority owner, we find an incremental effect of majority ownership on equity ratios of Austrian firms of approximately 1.73 to 2.17 percentage points after the introduction of the ACE tax system compared to Swedish firms. The overall effect of the introduction of the ACE tax system on equity ratios of Austrian firms with a majority owner amounts to 4.38 (2.21 + 2.17) to 6.38 (4.65 + 1.73) percentage points and is up to twice the effect of widely held firms. We find similar results when using Belgian firms as the control group. In this case, the incremental effect of majority ownership on equity ratios of Austrian firms is approximately 1.84 to 2.33 percentage points and the overall effect is 4.35 (2.51 + 1.84) to 5.85 (3.52 + 2.33) percentage points. Among Austrian widely held firms, conflicts among the owners appear to hinder firms from applying the ACE tax system.
Robustness Tests, Placebo Analysis, and Additional Cross-Sectional Tests
In this section, we provide further DD results for alternative specifications of the matching procedure, results of a placebo analysis to further strengthen the parallel trend assumption of the DD approach, as well as results from additional cross-sectional tests.
To assess the robustness of our results with respect to the matching procedure, we vary the base year of the matching procedure. Rather than using 1996, the first year of our observation period, we base our matching procedure on size, revenues, and profit of any of the other pre-reform years (1997, 1998, and 1999) as well as on the average value of size, revenues, and profit over the pre-reform period (1996–1999). Again, we use firms from Sweden and Belgium as our control firms. We repeat the estimation of equation (1) with the matched samples and present results in Table 8.
Difference-in-Difference (DD) Results for Alternative Matching Approaches, 1996–2003.
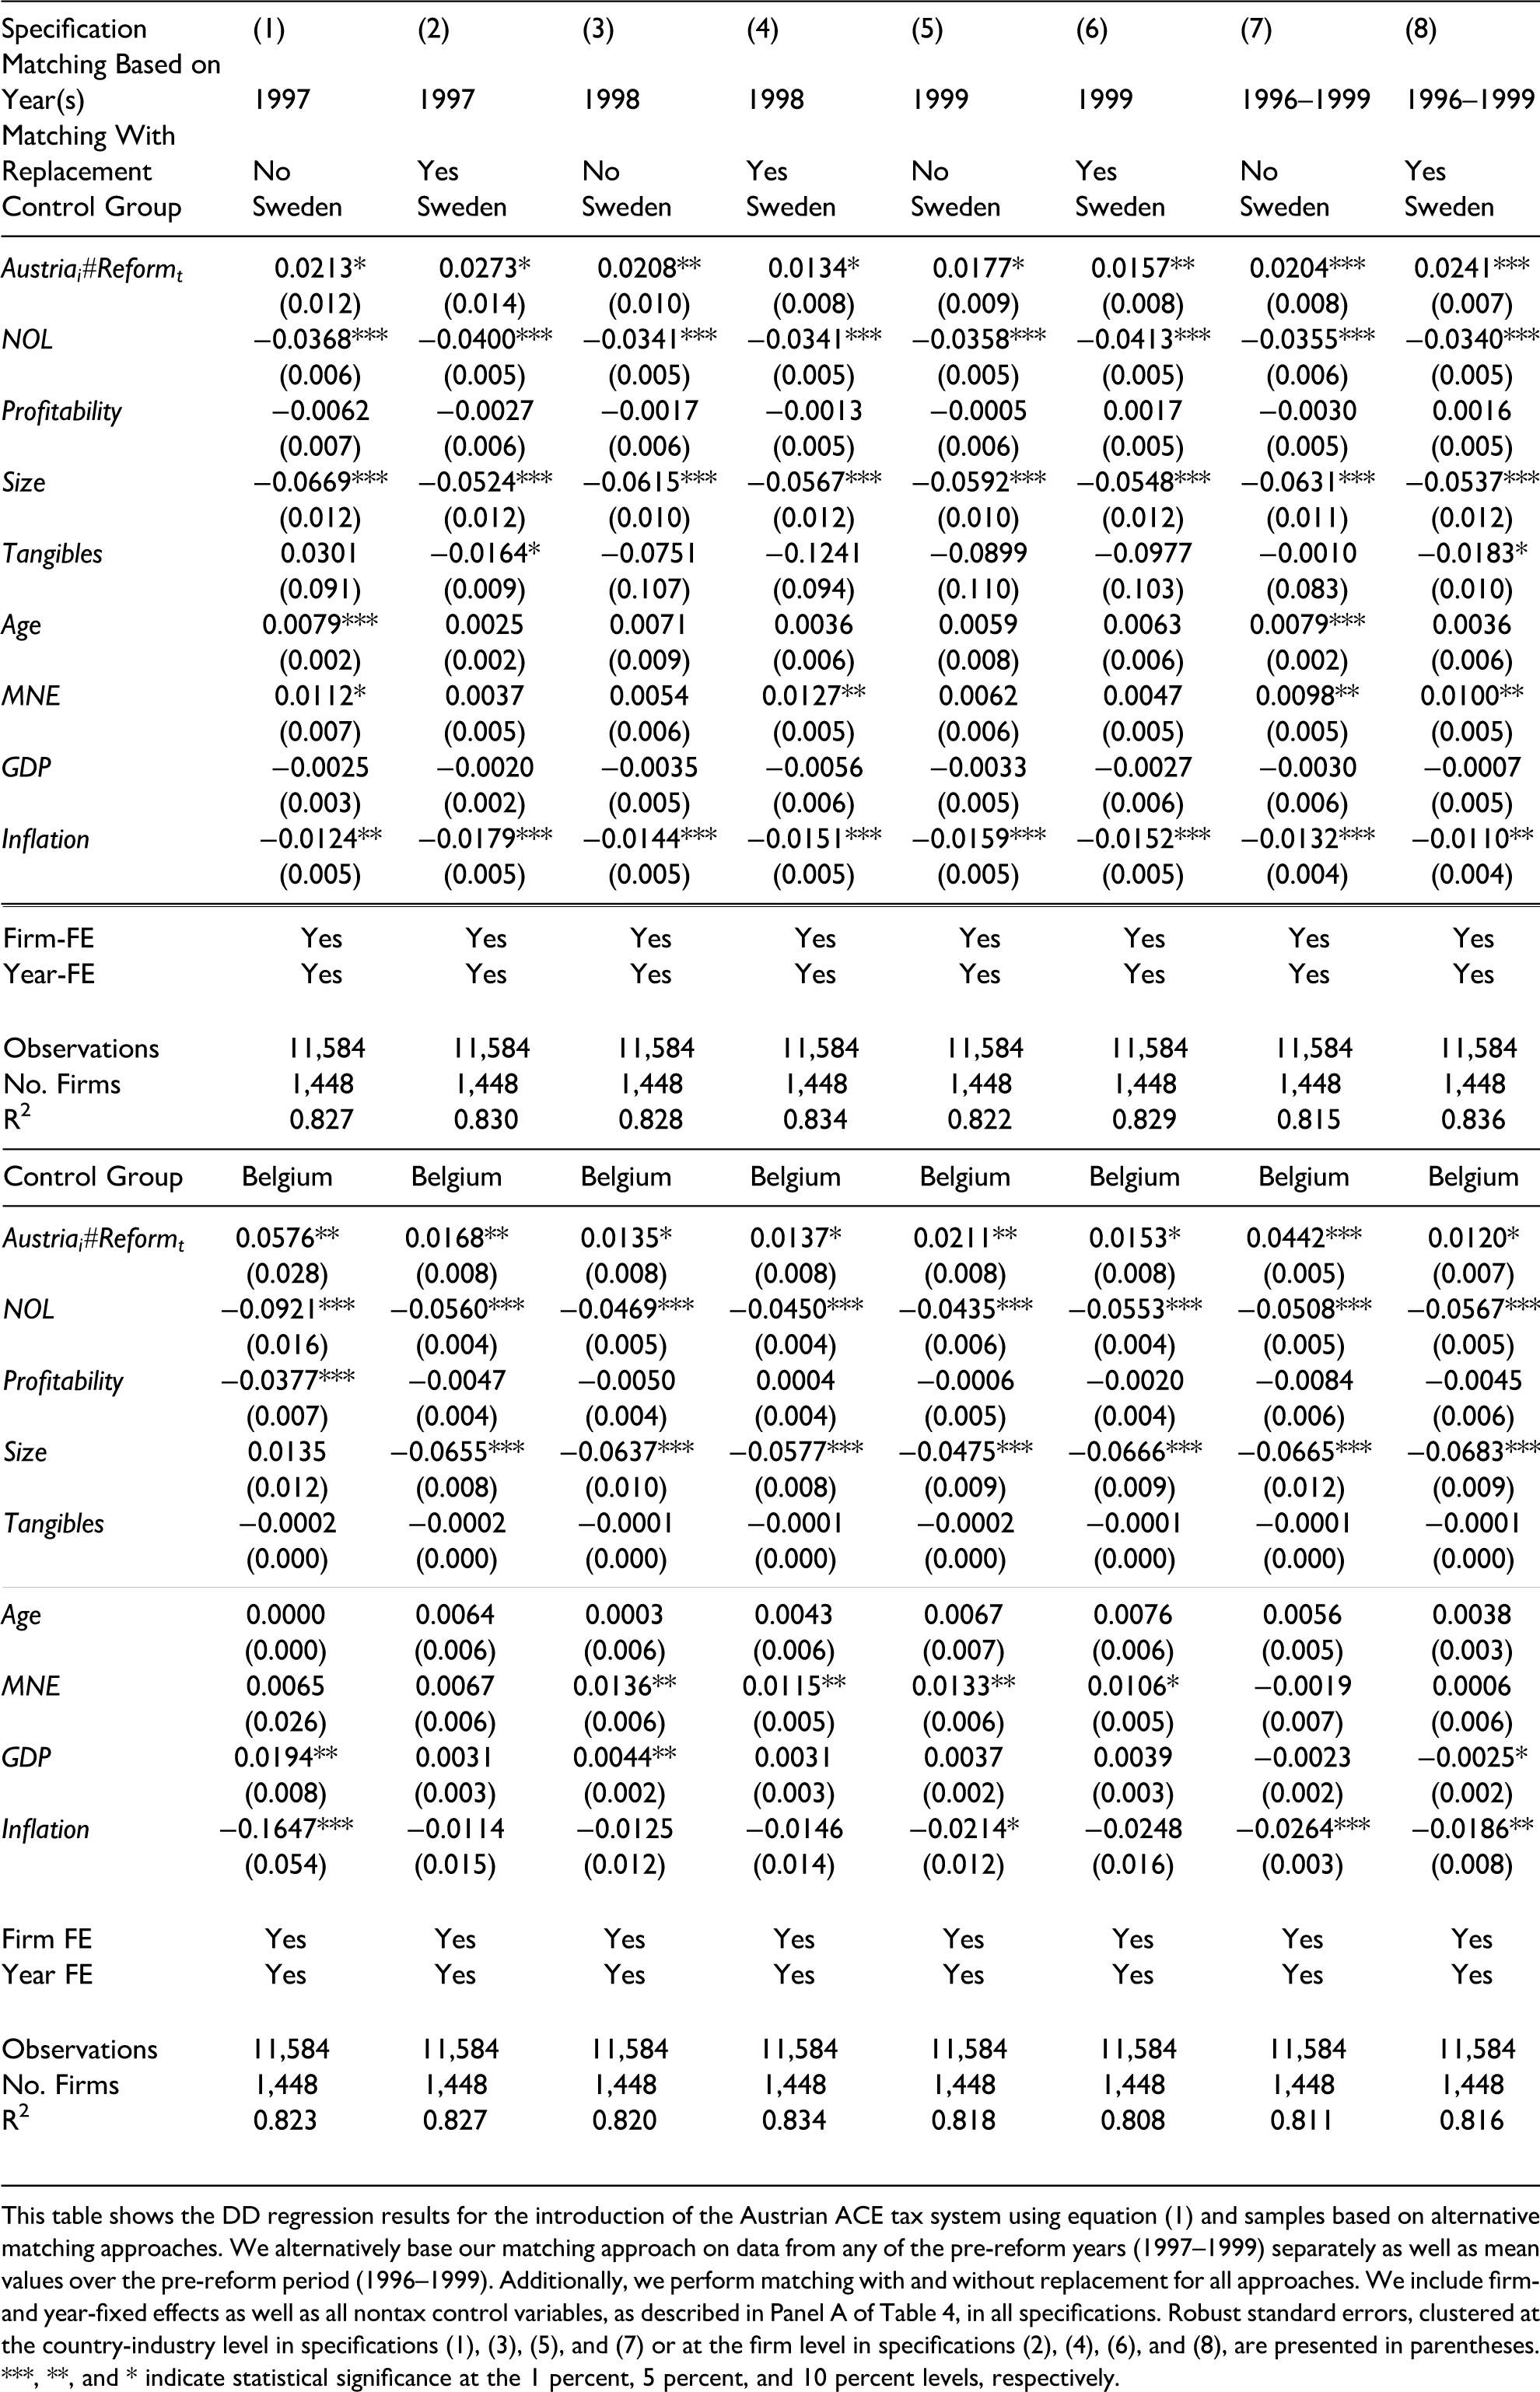
This table shows the DD regression results for the introduction of the Austrian ACE tax system using equation (1) and samples based on alternative matching approaches. We alternatively base our matching approach on data from any of the pre-reform years (1997–1999) separately as well as mean values over the pre-reform period (1996–1999). Additionally, we perform matching with and without replacement for all approaches. We include firm- and year-fixed effects as well as all nontax control variables, as described in Panel A of Table 4, in all specifications. Robust standard errors, clustered at the country-industry level in specifications (1), (3), (5), and (7) or at the firm level in specifications (2), (4), (6), and (8), are presented in parentheses. ***, **, and * indicate statistical significance at the 1 percent, 5 percent, and 10 percent levels, respectively.
Our results in Table 8 show that the main findings from Table 6 also hold if we use data from other pre-reform years for the matching procedure. If we use Swedish (Belgian) firms as the control group, the DD estimator is always positive and significant and varies between 1.34 and 2.73 (1.20 and 5.76) percentage points. The magnitude of the DD coefficient seems to be more sensitive to the choice of the base year in the matching procedure when using Belgian firms as the control group. We find similar results as in Table 6 with respect to our control variables. Larger firms appear to have higher equity ratios and firms with tax loss carryforwards appear to have smaller equity ratios. Firms belonging to a multinational group have significantly higher equity ratios in half of our specifications and equity ratios are lower in years with higher inflation rates.
Next, we perform a placebo analysis (Imbens 2004) to provide additional support for the parallel trend hypothesis. In the placebo analysis, we only consider the four pre-reform years (1996–1999) and use equation (1) to estimate the effect of a nonexisting treatment, in this case in the year 1998. Thus, Reform takes the value 1 for observations from the years 1998 and 1999 and 0 otherwise. Since we analyze a nonexisting treatment, we expect a nonsignificant coefficient for the DD estimator. Results of the placebo analysis are presented in Table 9.
Placebo Analysis, 1996–2000.
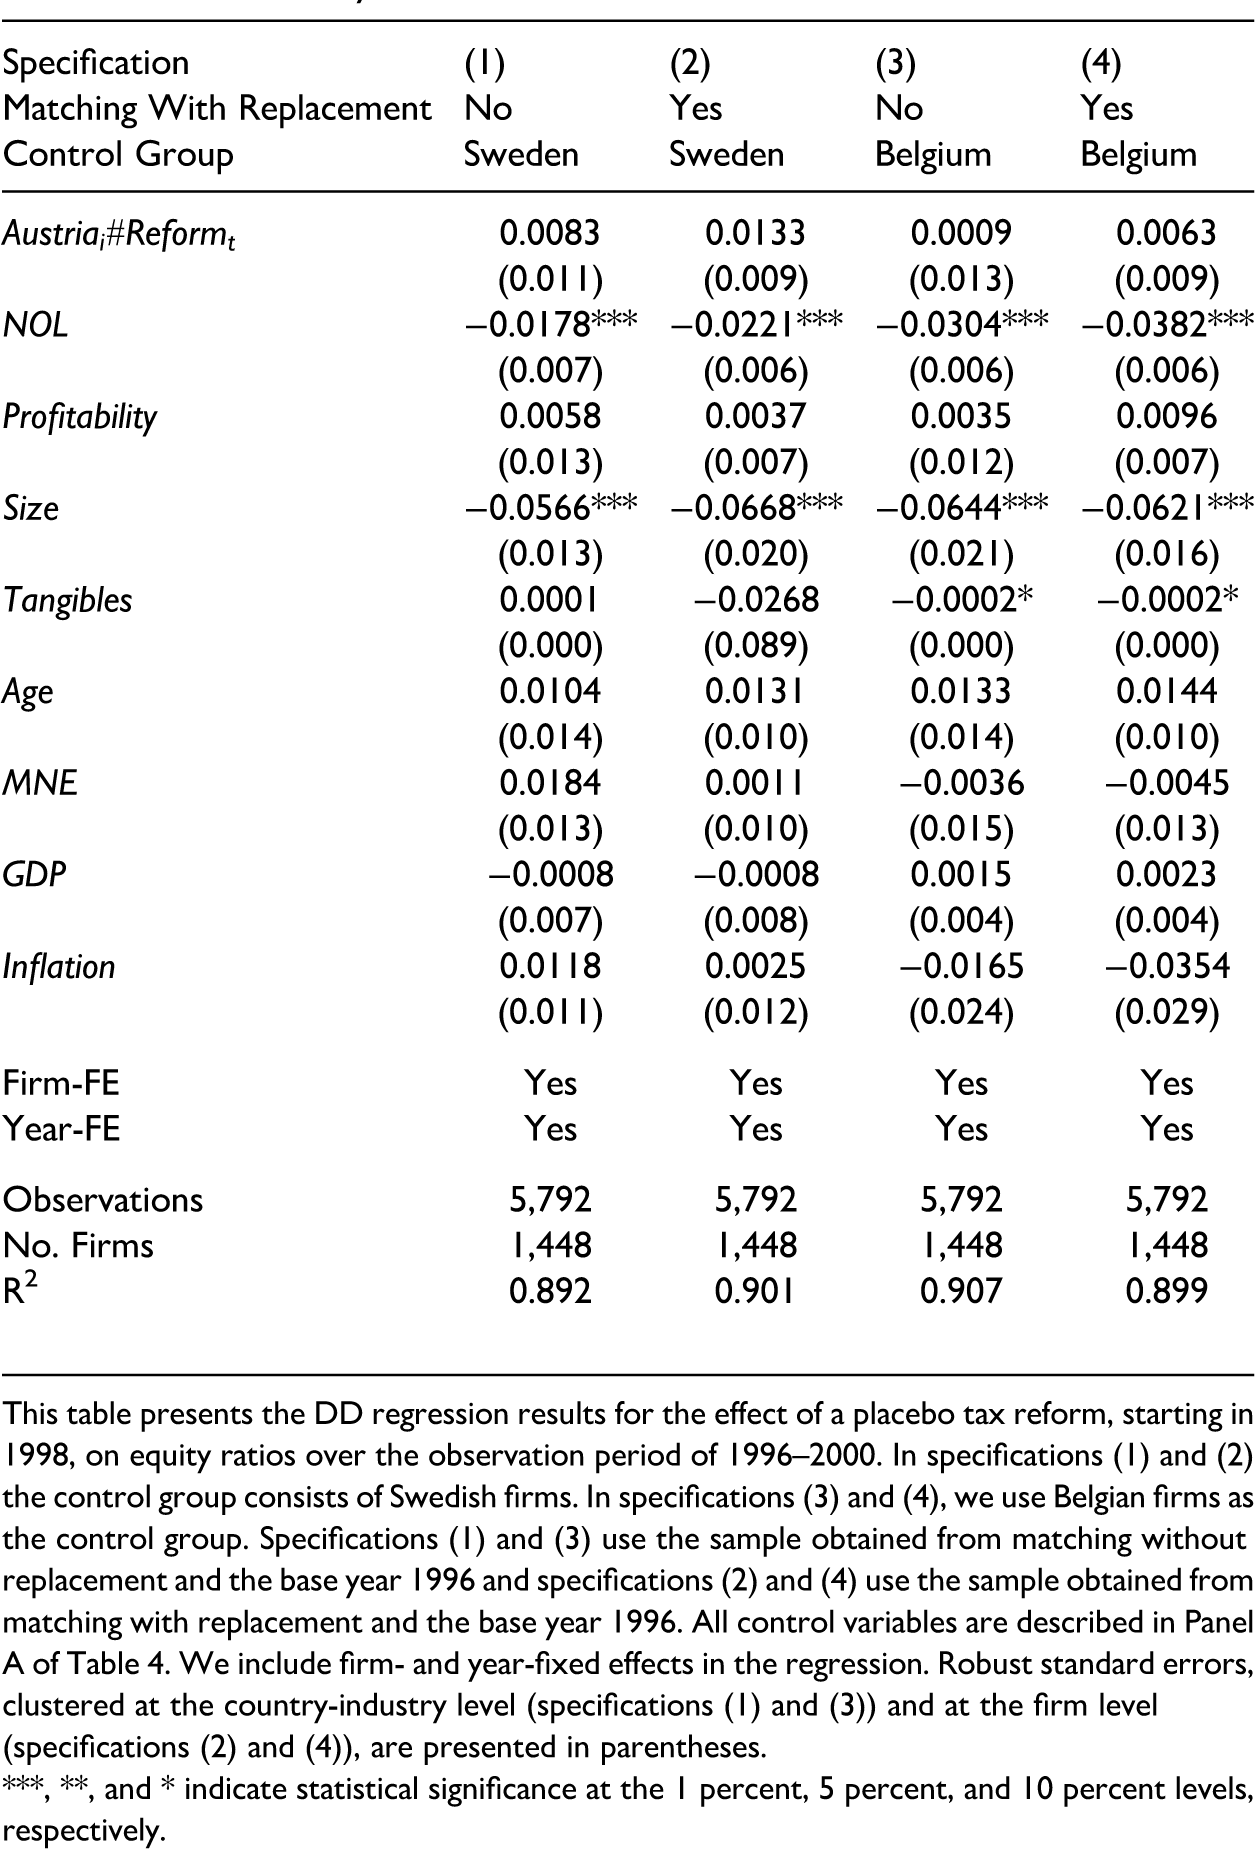
This table presents the DD regression results for the effect of a placebo tax reform, starting in 1998, on equity ratios over the observation period of 1996–2000. In specifications (1) and (2) the control group consists of Swedish firms. In specifications (3) and (4), we use Belgian firms as the control group. Specifications (1) and (3) use the sample obtained from matching without replacement and the base year 1996 and specifications (2) and (4) use the sample obtained from matching with replacement and the base year 1996. All control variables are described in Panel A of Table 4. We include firm- and year-fixed effects in the regression. Robust standard errors, clustered at the country-industry level (specifications (1) and (3)) and at the firm level (specifications (2) and (4)), are presented in parentheses. ***, **, and * indicate statistical significance at the 1 percent, 5 percent, and 10 percent levels, respectively.
As expected, we cannot find a significant coefficient for the DD estimator in any of the four specifications in Table 9. This is further support for the parallel trend assumption in our main analysis.
Lastly, we provide results of additional cross-sectional tests based upon various sample splits. The first set of sample splits addresses the effect of further firm-specific heterogeneity on the use of the ACE tax system. An important detail of the Austrian ACE tax system was that it was only applied to the increase in equity and not total equity. The fact that the amount of the annual increase and not the amount of equity as such was subject to a tax allowance was intended to incentivize firms to retain (more) profits. However, accumulating additional equity is harder for firms that have already had high levels of equity over the past years (Bogner et al., 1999; Bogner 2002; Panteghini et al., 2012). As a robustness test, we split our sample into quartiles according to their average total equity (in 1,000 euro) over the years prior to the reform (1996–1999). We alternatively split our sample into quartiles according to their average equity ratio over the years prior to the reform (1996–1999), since equity is likely related to firm size. We then separately test equation (1) for all quartiles and present the results in Panel A of Table 10.
Additional Cross-Sectional Analysis, 1996–2003.
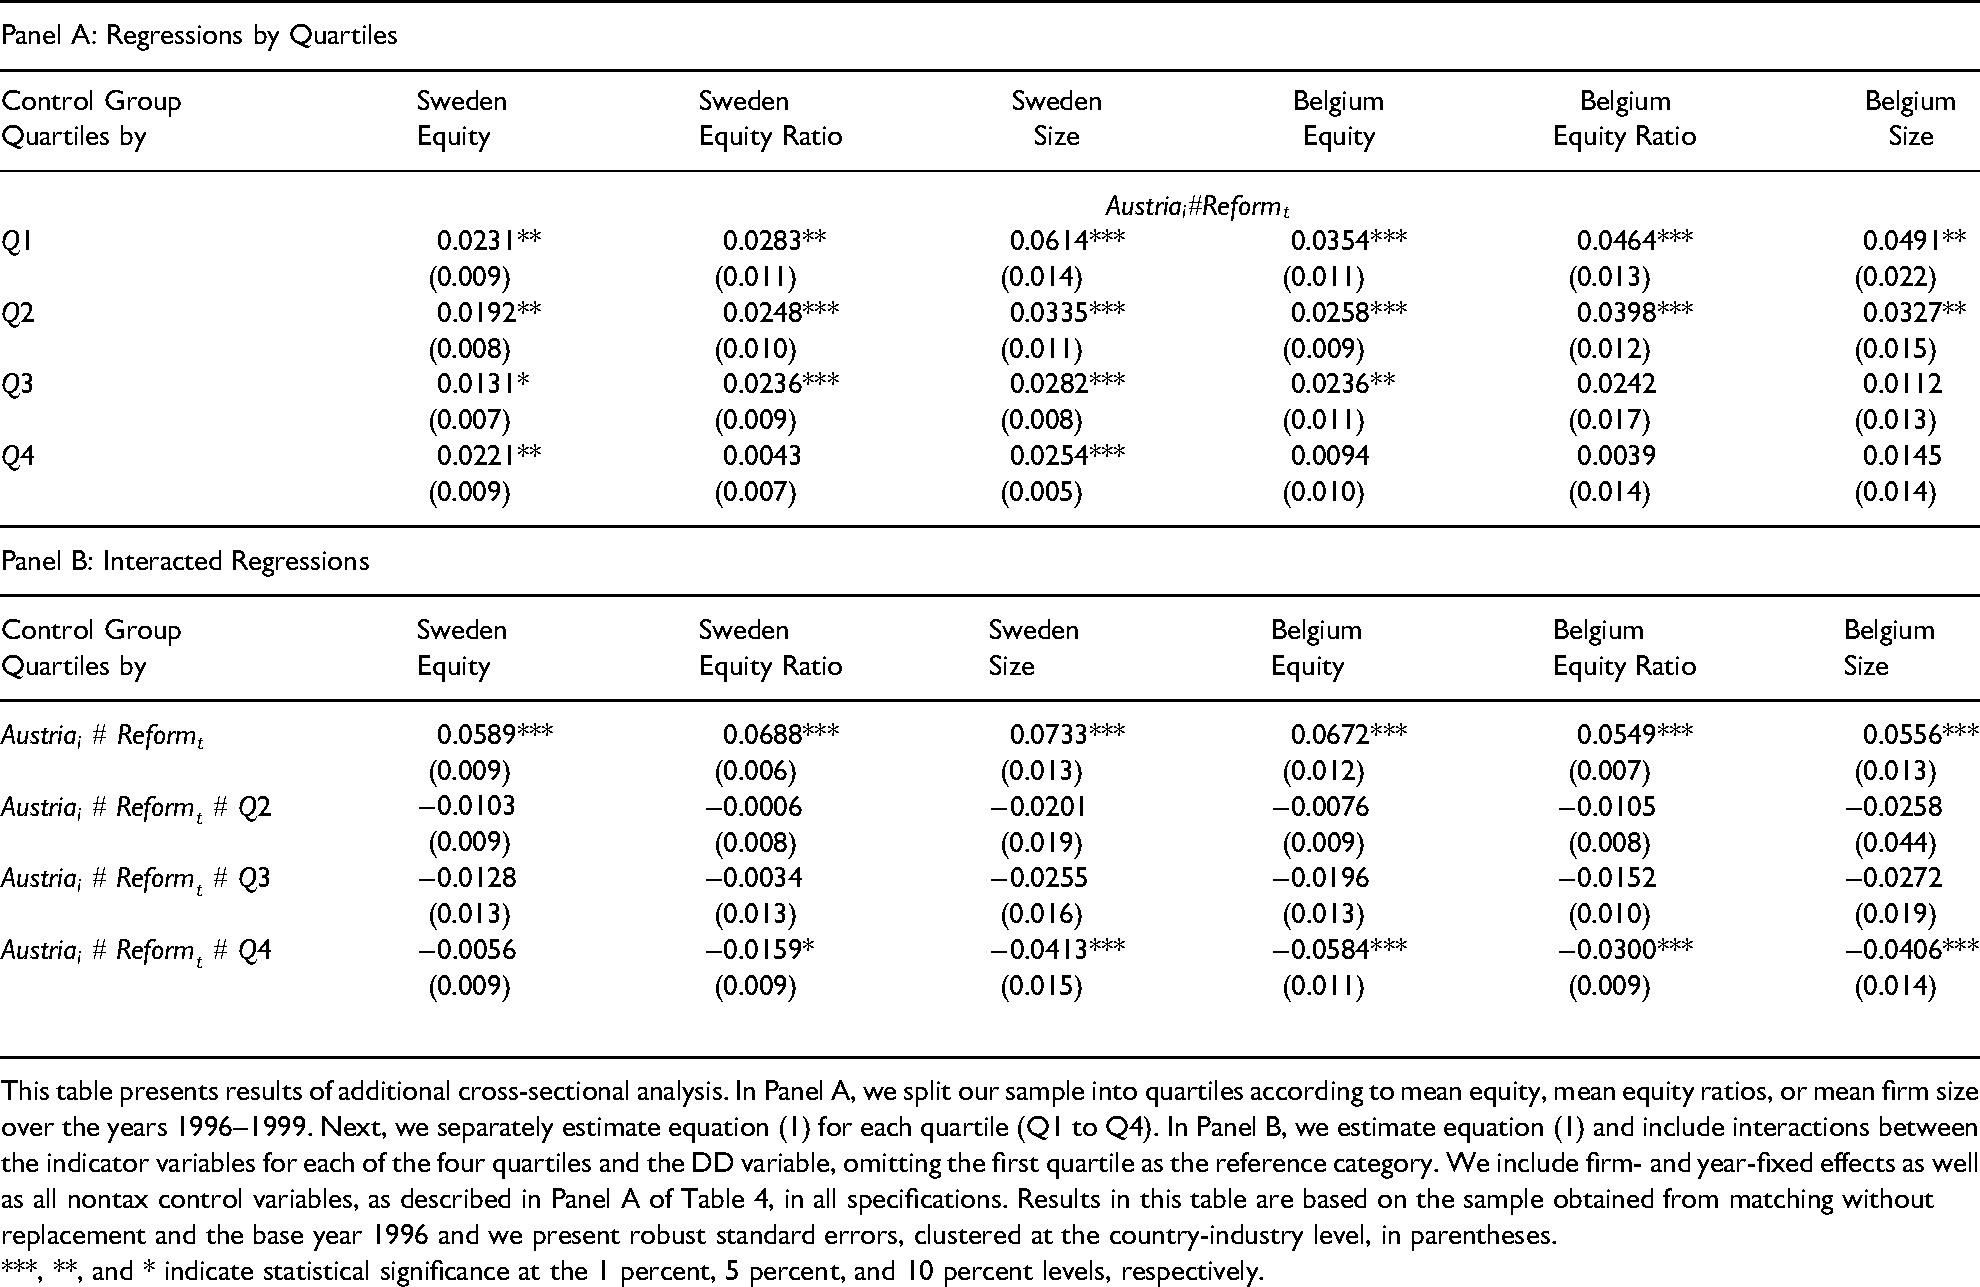
This table presents results of additional cross-sectional analysis. In Panel A, we split our sample into quartiles according to mean equity, mean equity ratios, or mean firm size over the years 1996–1999. Next, we separately estimate equation (1) for each quartile (Q1 to Q4). In Panel B, we estimate equation (1) and include interactions between the indicator variables for each of the four quartiles and the DD variable, omitting the first quartile as the reference category. We include firm- and year-fixed effects as well as all nontax control variables, as described in Panel A of Table 4, in all specifications. Results in this table are based on the sample obtained from matching without replacement and the base year 1996 and we present robust standard errors, clustered at the country-industry level, in parentheses. ***, **, and * indicate statistical significance at the 1 percent, 5 percent, and 10 percent levels, respectively.
We find significant positive DD coefficients for all (the first three) quartiles if we split the sample into quartiles based on average pre-reform equity and use Sweden (Belgium) as the control group. Also, we find significant positive coefficients for the DD coefficient for the first three (two) quartiles of equity ratios when using Sweden (Belgium) as the control group. In addition, the effect is strongest for firms with the lowest level of pre-reform equity and equity ratios. To test whether the effect differs significantly across quartiles, we use the whole sample, estimate equation (1), and include interactions between indicator variables for the four quartiles of equity (equity ratios) and the DD estimator. Our results, presented in Panel B of Table 10, show significantly lower equity ratios for Austrian firms with the highest pre-reform equity in three out of four specifications. Thus, we find some evidence that a firm's ability to accumulate additional equity is significantly influenced by pre-reform equity values.
Our results in Table 6 show that firm size has a significant effect on equity ratios. To examine whether smaller firms show a significantly different reaction to the introduction of the Austrian ACE tax system than larger firms, we split our sample into quartiles according to the average amount of total assets over the years prior to the reform (1996–1999) and separately test equation (1) for all quartiles. Our results in Panel A of Table 10 show significant positive DD coefficients for all quartiles if we use Sweden as the control group, and for the first two quartiles if we use Belgium as the control group. Also, the size of the DD coefficient decreases with firm size. We find the highest post-reform increase in equity ratios for the smallest firms in our sample, amounting to approximately 4.91 to 6.14 percentage points. For the largest firms in the sample, the increase amounts to only 1.45 to 2.54 percentage points. To test whether this is a significant reduction, we again estimate equation (1) for the whole sample and interactions between indicator variables for the four quartiles and the DD estimator. We present the results in Panel B of Table 10. The significantly negative coefficient on the interaction term for the fourth quartile indicates that the Austrian ACE tax system appears to have been able to mitigate the risks of indebtedness, especially for small- and medium-sized firms.
The second set of sample splits tests whether firm-specific heterogeneity moderates the effect of past dividend levels on the use of the ACE tax system. We base these tests on the DDD analysis from Table 7 and add two sources of firm-specific heterogeneity to the regression analysis. Grullon et al., (2002) and Michaely and Roberts (2012) find that private (smaller) firms and firms with dispersed ownership are less able to constrain dividend payout. To test whether firm-specific heterogeneity moderates the effect of past dividend payout levels on the use of the ACE tax system in Austria, we split our sample according to quartiles of firm size and, alternatively, based on the existence of a majority owner. We then re-estimate the DDD model from Table 7 for the different subsamples and present the results in Table 11.
Effect of Firm-Specific Heterogeneity on Ability to Constrain Dividend Payments, 1996–2003.
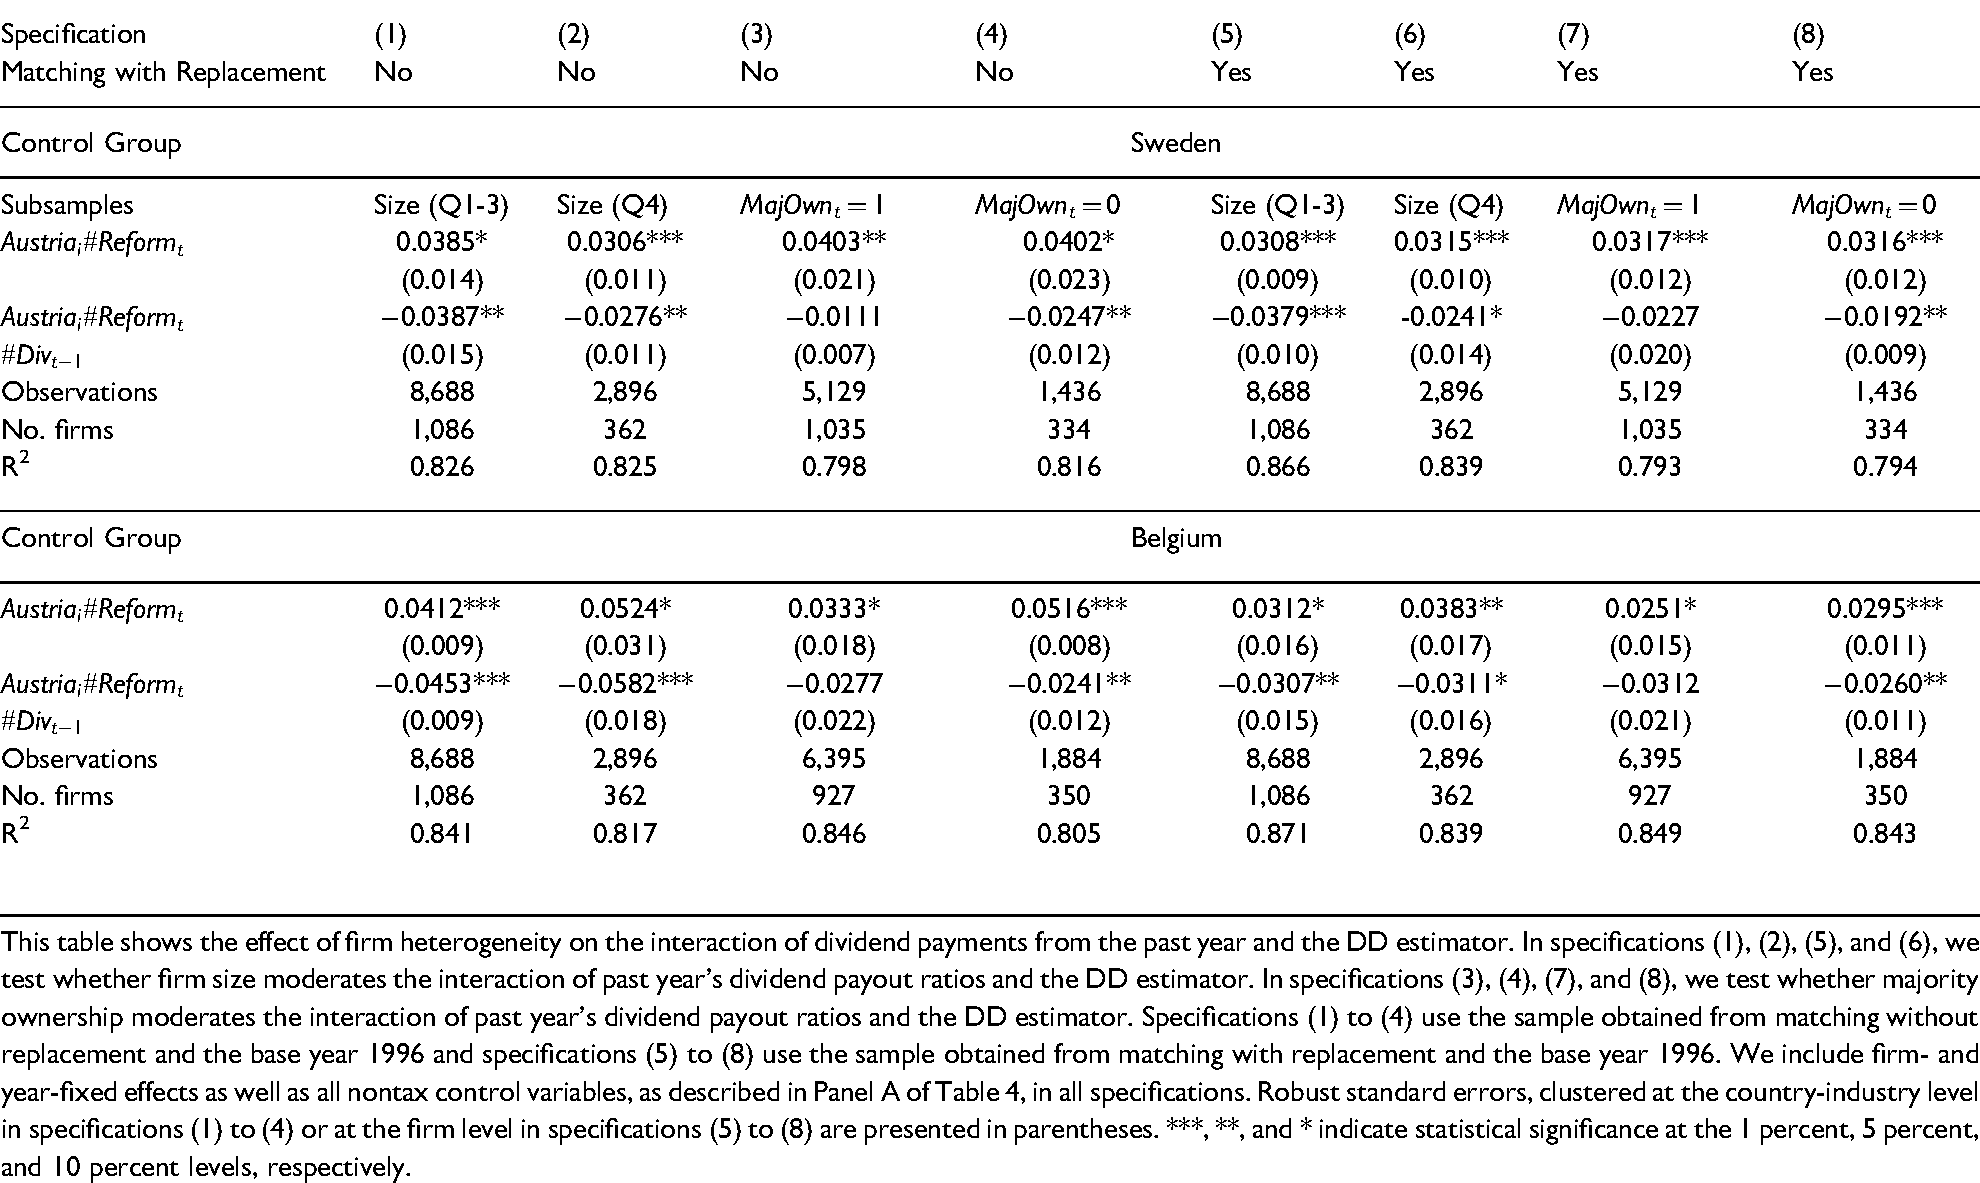
This table shows the effect of firm heterogeneity on the interaction of dividend payments from the past year and the DD estimator. In specifications (1), (2), (5), and (6), we test whether firm size moderates the interaction of past year’s dividend payout ratios and the DD estimator. In specifications (3), (4), (7), and (8), we test whether majority ownership moderates the interaction of past year's dividend payout ratios and the DD estimator. Specifications (1) to (4) use the sample obtained from matching without replacement and the base year 1996 and specifications (5) to (8) use the sample obtained from matching with replacement and the base year 1996. We include firm- and year-fixed effects as well as all nontax control variables, as described in Panel A of Table 4, in all specifications. Robust standard errors, clustered at the country-industry level in specifications (1) to (4) or at the firm level in specifications (5) to (8) are presented in parentheses. ***, **, and * indicate statistical significance at the 1 percent, 5 percent, and 10 percent levels, respectively.
With respect to firm size, results in Table 10 have shown that largest firms (i.e., in the fourth quartile) show a significantly smaller reaction to the ACE tax system. We, therefore, split our sample into two subsamples: one for the firms of the first three quartiles of total assets and one for the firms in the fourth quartile of total assets, based on average pre-reform total assets. Among nondividend-paying firms, we find a significant increase in equity ratios of 3.06 to 3.85 percentage points for Austrian firms after the ACE tax reform. The effect is similar in economic terms for both subsamples of firm size. In addition, we find a significantly lower reaction to the ACE tax reform of dividend-paying firms from Austria that is also similar in economic terms for both subsamples of firm size. We thus cannot conclude that firm size moderates the effect of past dividend payout levels on the usage of the ACE. We do, however, find a moderating effect if we consider firm-specific ownership. We find a significantly negative DDD estimator in specifications (4) and (8) in Table 11. This indicates that the ability to not maintain past levels of dividend payout has a significant negative effect on the usage of the ACE in firms without a majority owner. In contrast, the DDD estimator is not significant in specifications (3) and (7) in Table 11. Firms with a majority owner significantly increase their equity ratios after the ACE tax reform, irrespective of high or low levels of past dividend payouts.
Conclusion
We provide the first empirical analysis of the Austrian ACE tax system that was applied during the early 2000s. Compared to other ACE tax systems, that is, those currently in effect in Belgium or Italy, the Austrian ACE tax system provided for a very limited reduction in the tax advantage of debt. Austria applied a so-called soft ACE tax system, as only the annual increase of equity and not the total amount of equity was subject to the notional interest deduction. The tax benefit of the Austrian ACE variant was further diminished as the notional interest on the equity increase was not fully tax deductible, but rather taxed at a lower than the regular rate. For every 1 euro increase in equity, the tax benefit amounted to 0.441 to 0.558 cents. Therefore, to benefit from the ACE tax system Austrian companies had to increase their equity substantially, predominately via retained earnings.
Although it provided only for a limited notional interest deduction, we identify a positive effect of the Austrian ACE tax system on the equity ratios of Austrian firms. The results from a DD regression analysis document that the increase in equity ratios among Austrian firms is indeed attributable to the introduction of the ACE tax system and not related to a mere time trend. On average, Austrian firms increase their equity ratios by approximately 1.36 to 2.30 percentage points after the introduction of the ACE tax system compared to firms in Sweden of Belgium.
Further cross-sectional tests show several sources of the heterogeneous response of Austrian firms to the new ACE tax system. First, firms with high levels of past dividends appear to refrain from using the ACE tax system as this would constrain their dividend payments. This effect holds irrespective of firm size but is moderated by firm-specific ownership. If a firm has a majority owner, the increase in equity ratios is not significantly affected by levels of past dividends. Additionally, we identify a muting effect of ownership on capital structure choice. We find a significant increase in equity ratios after the introduction of the ACE tax system only for Austrian firms with a majority owner, but not for widely held firms. Lastly, we find that firms with lower levels of pre-reform equity, lower levels of pre-reform equity ratios, and smaller firms have a larger increase in equity ratios after the introduction of the ACE tax system.
While the Austrian ACE tax system was not a full, traditional ACE tax system and thus did not promote full financing neutrality, its aim was to increase companies’ equity to mitigate the risks of indebtedness. Compared to the findings of prior research focusing on the traditional Belgian or Italian ACE system, the effects of the Austrian ACE tax system are smaller. However, we still find evidence that, despite its limited allowance, the Austrian ACE tax system was able to incentivize the accumulation of additional equity. Nevertheless, there are some limitations to our results. First, since our sample is based on AMADEUS data, it mainly includes larger firms. Even if data on the actual use of the ACE show a higher propensity for its use among larger firms, we can only draw limited conclusions on its effect for very small firms in the overall population. Second, there is a close link between the ability to constrain dividend payments and the usage of the ACE. In our sample of nonlisted firms, we cannot observe actual levels of past dividend payments, but only use a proxy variable based on changes in past levels of equity. Although we carefully tried to overcome endogeneity concerns in our model specifications, our variable of past levels of dividend payout remains a proxy and should ideally be reassessed in further studies of listed firms. Third, as with all empirical tax and accounting research that uses archival data, we can only observe the ramifications of a managerial decision and use these observations to draw inferences regarding the reasons and motives for the decision, but we cannot directly observe the influential factors of managerial decision making.
Footnotes
Declaration of Conflicting Interests
The author(s) declared no potential conflicts of interest with respect to the research, authorship, and/or publication of this article.
Funding
The author(s) received no financial support for the research, authorship, and/or publication of this article