



Abstract
Key Points
Dancers are expected to maintain visual consistency of performance, even after exertion, which can hide underlying biomechanical changes.
This study found that exertion leads to subtle kinematic changes but signifiant alterations in ankle torque.
Altered ankle stiffness during landing may be a factor in understanding how overuse injuries develop, even during normal dance expectations.
Introduction
The art of dance imposes unique artistic requirements for movement alongside athletic demands. Sports athletes complete tasks with the outcome in mind, while dancers must perform with specialized movement patterns throughout the completion of the performance. While a volleyball player is tasked with jumping to gain elevation to reach the ball, a classical ballet dancer has specific movement requirements even in a basic jump. A double-limb sauté requires full lower limb elongation including hip extension, full knee extension, and maximum ankle, foot, and toe plantarflexion. 1 These requirements constrain a dancer’s ability to modify kinematics to accommodate individual needs or changing circumstances, including prolonged exertion.
Prior work on the effect of fatigue on runners has consistently shown reductions in both vertical leg stiffness and ankle torsional stiffness.2-4 The effects of fatigue among dancers have been examined with limited or unclear results. One study showed evidence of less stiff landings of the leg and another demonstrated an increase in hip stiffness but a decrease in knee stiffness.5,6 Changes in energy distribution have been observed with fatigue in sports athletes and dancers, with power generation shifting from distal to proximal.5,7,8 However, many fatigue protocols are not dance-specific which could affect practical application of results. 6 In practice, dancers regularly exert themselves by performing choreography but do not reach a fully fatigued state. While some changes in mechanics have been shown in athletes and dancers after reaching complete fatigue, are there changes that occur throughout a period of performance for a dancer before they reach that state?
One of the more basic dance-specific movements is a double-limb sauté, a bilateral, symmetrical jump that can be performed in series as a repeated hop. Hopping can be biomechanically assessed for the consistency of both kinematic and kinetic parameters. Assessing the kinematic factors alongside hopping frequency enables us to quantify some aspects of the visual performance valued in dance performance.9,10 Kinetic adjustments, however, may be less easy to observe. Because hopping is an ankle-driven task, 11 adjustments in ankle torsional stiffness may provide insights into mechanical strategies utilized to complete a continuous task throughout exertion. These hidden adjustments may contribute to overuse injuries in this population.
Because kinematics are a consequence of forces, kinetics are essential for understanding and interpreting movement strategies. Joint torsional stiffness, a dynamic variable that combines kinematics and kinetics, has been used to explain bouncing movements, such as running and jumping. This dynamic variable can be manipulated to increase torsional stiffness by decreasing joint excursion while maintaining joint moment, or by maintaining joint excursion while increasing joint moment. The same relationship is true when describing the linear aspect of stiffness during a bouncing task. Lower extremity leg stiffness and torsional stiffness adapt to different environments and conditions. The leg adapts to a faster rate of hopping by increasing leg stiffness and ankle torsional stiffness. Likewise, when landing on a more compliant surface, the leg increases stiffness. These changes in kinetics have been associated with injury in different populations.6,12,13
High rates of injuries, especially overuse injuries, may reflect the rigorous demands and repetitive nature of dance. Professional ballet dancers perform 100 to 200 jumps per ballet class. 14 The prevalence of lower extremity injury in dancers is exceptionally high, ranging from 64% to 91% of all reported injuries in ballet dancers.15,16 Foot and ankle injuries comprise 14% to 57% and knee injuries comprise 6% to 22% of dance injuries.16,17 In addition to injuries commonly seen in sports athletes, dancers experience unique conditions like flexor hallucis longus (FHL) tendinopathy, colloquially known as “dancer’s tendinopathy” because of its prevalence in this population.18,19 The differences seen in dancers indicate the presence of specific physical demands that differ from other athletes, thus limiting the application of current sports literature to dancers. Given the frequency of jump-landing tasks in dance and the high rate of lower extremity injuries, it is essential to study dance jumps as they are executed in performance and after dance-specific exertion to better understand possible contributions to overuse injury.
The primary aim of this study is to explore whether healthy dancers retain the lower extremity kinematics in the sagittal plane under the condition of performing common dance choreography. This would serve as a quantifiable representation of some elements of dance-specific performance expectations of the lower extremity. If the kinematics are retained, what are the mechanisms behind this phenomenon? Specifically, we will use a single dynamic variable, joint torsional stiffness, that concurrently captures kinematics via displacement and kinetics via moment to determine modifications at the ankle following a period of exertion during jump landings.
Materials and Methods
Participants
Dancers were recruited to participate with the requirements of dancing in an audition-based collegiate dance program or employment as a dance instructor within the past year. They were also required to have at least 10 years of formal dance training. The type of training was not specified. Exclusion criteria included current injuries that limited their ability to jump. Fourteen female dancers between 18 and 30 years old volunteered to participate. Before the study, participants were provided with written informed consent per the University of Southern California Institutional Review Board (HS-18-00537). Dance training history and demographic data were also obtained.
Procedures of Data Acquisition and Raw Data Processing
To mimic the demands of a typical dance performance, a 1-minute and 20 second piece of dance choreography was created to encompass a variety of Western-style dance-specific high-intensity movements. The choreography was set to a song that was 95 beats per minute (bpm) and started with 16 sautés in second position (Figure 1) followed by combinations of small jumps (eg, single leg sautés and pas de chat), larger jumps (eg, grand jeté and tour jeté) as well as simple turns. A video of this choreography was emailed to the subjects so they could learn this dance sequence before data collection. A link to this training video can be found here: https://youtu.be/8AzL5NGCbbM. The subjects received the video between 3 days to 3 weeks depending on subject and laboratory availability. The dancers were given an opportunity to review the choreography with the data collection team in the lab and all dancers reported and demonstrated competence of the choreography prior to data collection. On the day of data collection, the dancers completed a self-led warm up for at least 10 minutes before performing a familiarization trial and then rested for 5 minutes. Dancers performed the dance sequence and jump series barefoot, a condition all dancers were comfortable and familiar with.

Dancers performed sautés in ballet second position with each foot on one force plate with arms in ballet fifth position. (a) A photo image of a dancer in flight with motion capture markers. (b) Body positions achieved throughout the completion of one sauté. A single jump is defined from initial contact (IC) from one jump to the initial contact of the following jump and includes ground contact and flight phases. The arrows identified as X, Y, Z indicate the coordinate system for the ground reaction force components in vertical (Z), antero-posterior (X) and medio-lateral (Y). The arrows in the second skeleton image indicate the ground reaction force vectors for each limb.
Data was collected for the 16 dance-specific bilateral consecutive hops (sautés) in ballet second position. Each foot was placed on a separate rectangular force plate (Advanced Mechanical Technology, Inc., Watertown, MA, OR6-6-1) (Figure 1). The data was sampled at 1500 Hz and filtered at 50 Hz with a dual-pass fourth-order Butterworth filter in Visual 3D software (C-Motion Inc.). The jumps were performed to a song with a beat of 95 bpm for consistency. The data collection was an alternating sequence of 16 sautés followed by 1 minute of choreography repeated until the dancers completed four series of sautés and three rounds of choreography (Figure 2). This study analyzes the first series of jumps, referred to as “before exertion” (BE), and the fourth series of jumps, referred to as “after exertion” (AE) which were performed immediately after 4 minutes of continuous dancing. Lower extremity kinetics and kinematics were quantified for the sautés using an 11-camera 3-D motion capture system (Qualisys, Gothenburg, Sweden; 250 Hz) with a sampling rate of 250 Hz and filtered at 12 Hz with a dual-pass fourth-order Butterworth filter in Visual 3D software (C-Motion Inc.). We used a 9-segment marker set with 6-degrees of freedom. The model segments were defined by placing reflective markers at the pelvis, bilateral thighs, shanks, feet, and toes with markers at the L5-S1 intervertebral space as well as bilateral iliac crests, anterior superior iliac spines, greater trochanters, medial and lateral femoral epicondyles, medial and lateral malleoli, first and fifth metatarsal heads, and distal phalanx of the hallux. The 3-dimensional segments were tracked using reflective markers on rigid plates placed on the lateral surface of each segment. For measures of exertion, the dancers wore a heart rate monitor (Polar Electro Oy, Kempele, Finland). They were asked to rate their perceived exertion (RPE) after each jump series while continuing to dance using the Modified Borg Rating of Perceived Exertion Scale.20,21 The RPE scale is an 11-point grading scale with 0 indicating no exertion and 10 indicating maximal exertion. Blood pressure was taken before the start of the data collection and immediately after completion of the fourth jump series.

Data collection order of the dance-specific jump series interspersed with 1 minute of choreography. The heart rate of each subject was collected using a wearable heart rate monitor and recorded following completion of each round of the 16 sautés. The subjects reported their rate of perceived exertion (RPE) after each set of sautés. Blood pressure was recorded before and after the dance sequence.
Data Analysis and Statistical Analyses
Performance measures
The generalized equation for age-predicted heart rate maximum (208 − 0.7·Age) was used to determine maximum heart rate. 22 The middle 10 sautés for each 16-jump series were chosen to account for alterations in performance in adjusting between the jumps and choreography at the beginning and end of each series. A jump cycle was demarcated using the time points of initial ground contact for two consecutive ground contact phases (ie, jump 4 was defined using initial ground contact for jumps 4 and 5). The time point of initial ground contact corresponded to the first data frame where the ground reaction force reached or exceeded 20 N. The average jump rate during jump series 1 (BE) and 4 (AE) was calculated. Jump rate was calculated as the inverse of the jump cycle time in units of beats per minute.
Kinematics
Kinematic analysis of the sautés was performed for the ground contact period for the middle 10 sautés of each jump series. The movement was divided into absorption and generation phases, delineated by the lowest vertical position of the L5 marker during ground contact (Figure 1). The sagittal plane initial contact angles for the ankle and sagittal plane joint excursion for the ankle, knee, and hip joints were calculated. Joint excursions during the absorption phase for the ankle, knee, and hip were calculated as the total change in joint angle in the sagittal plane. As this task is bilateral and symmetrical, only the participant’s preferred stance limb was analyzed. 23 A participant’s preferred stance limb was determined by the participant’s subjective report of preferred stance leg during a single limb dance-specific turn (pirouette).
Kinetics
Joint torsional stiffness was conceptually defined as [∆ joint moment/∆ joint angle] given a specific duration of interest within a task. When graphed, this is represented as a curvilinear line or a loop (Figure 3). The slope of the line represents the value with a steeper line indicating greater torsional stiffness. The ankle torque normalized to body weight of the entire ground contact phase for the middle 10 sautés for each jump series was graphed with the sagittal plane ankle moment on the y-axis and ankle angle on the x-axis (Figure 4a). The torque was normalized to body weight to aid in the comparison across individuals. The beginning and ending of ground contact appeared as curvilinear sections with a middle segment connecting the two into a loop, indicating a transition period dividing the ground contact. Because of this, we separated the ground contact for kinetic analysis into three phases: landing, transition, and takeoff and we analyzed the landing phase in more detail. The end of the landing phase occurred between 30% and 40% of ground contact, and, due to the natural variations in individual jumps, we analyzed each jump individually. The landing phase was determined to end when the slope of the line began to decrease, indicating a change in torsional stiffness as expected with the transition phase. This determination was made using visual inspection along with the R2 value of the linear fit function where a higher value indicates a stronger linear association. In addition, in looking at the landing phase, there were two distinct slopes for each jump. Because we are examining kinetic shifts in performance after exertion and to avoid falsely homogenizing the torsional stiffness at the ankle, we divided the landing phase into two equal subphases: early and late, each accounting for 50% of the landing phase (Figure 4b). Ankle torsional stiffness throughout each of the two phases for each individual jump were determined by calculating the slope of a regression line through the data points. Initially, we examined the data individually due to the small sample size; however, the findings lent themselves to further statistical analysis.

A representative dancer’s ankle displacement (a, b), torque (c, d), and torsional stiffness (e, f) during two series of ten sauté jumps before exertion (BE) and after exertion (AE), during ground contact. A positive ankle angle indicates dorsiflexion while a negative ankle angle indicates plantarflexion. A negative ankle moment indicates an external ankle dorsiflexion moment. The four upper panels (a, b, c, d) show kinematic and kinetic variables throughout ground contact. The two lower panels (e, f), show graphs of ankle moment as a function of ankle displacement.
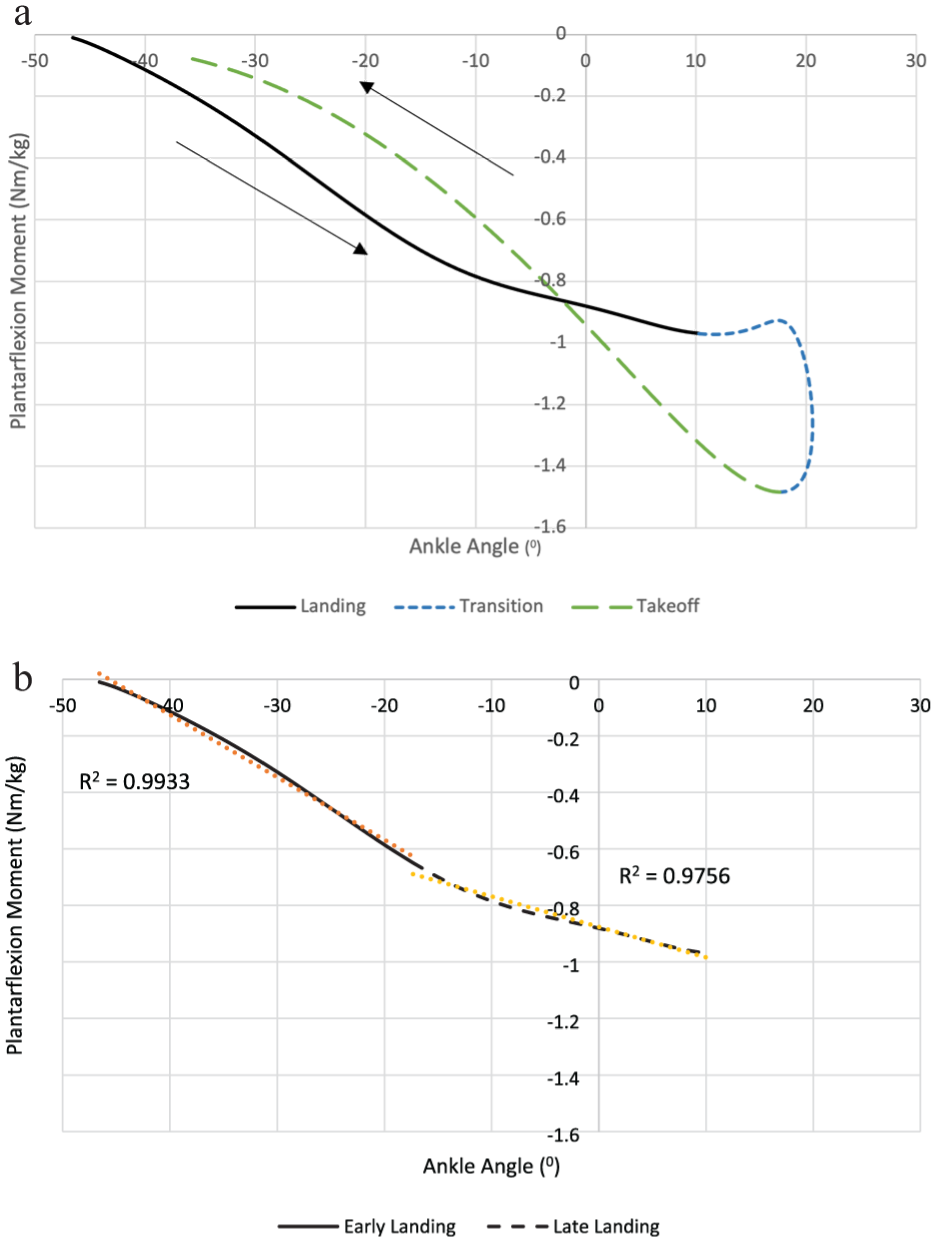
Ankle torsional stiffness. (a) A single jump ground contact phase of a representative dancer. The phases of landing, transition, and takeoff are depicted. The arrows denote the chronology of the phases on the graph. (b) Depiction of subphases of landing, namely early landing and late landing for a representative dancer. The slopes of the curves (R2) demonstrate the difference in ankle torsional stiffness for the two subphases.
Statistics
All demographic and dance history variables were screened for normality with the Shapiro-Wilk test, followed by analysis with descriptive statistics. All variables are reported as mean, range, and standard deviation. Heart rate, RPE, jump rate, joint excursion, and joint angles at the first series of jumps before exertion (BE) and at the last series of jumps after exertion (AE) were examined with Hedges’ g effect sizes to determine the importance of the mean. The Hedges’ g and 95% CI of Hedges’ g were calculated. We used an estimation method for statistical inference instead of null hypothesis testing (using P values) to provide more information about the effects’ size and avoid drawing misleading conclusions, as Hedges’ g and Cohen’s d can be interpreted similarly. Cohen suggested that d = 0.2 be considered a ‘small’ effect size, 0.5 represents a ‘medium’ effect size and 0.8 a ‘large’ effect size. A multilevel mixed-effects linear regression model was performed on series 1 sautés (BE) and series 4 sautés (AE) for ankle torsional stiffness.
Results
Demographics
The 14 subjects were all female dancers, with an average age of 22.4 ± 3.2 and a range of 18 to 29. See Table 1 for more details on demographics. The subjects reported a mix of dance training including contemporary and classical styles indicating a familiarity with the type of choreography used for data collection.
Demographics of Subjects.

Performance Measures
Exertion
Exertion level was assessed by measuring changes in heart rate and RPE. Heart rate significantly increased from BE (125.1 ± 16.4 bpm) to AE (186.4 ± 11.0 bpm) with a large effect size of −4.12 with 95% CI [−5.99, −2.71] (Figure 5a). Mean age-predicted heart rate max was 192 ± 2.3 bpm. The mean percent of age-predicted heart rate maximum was 65.1 ± 8.8% BE and 96.9 ± 5.5% AE. Blood pressure response was within normal limits before (106.2 ± 12.7/61.7 ± 10.7 mmHg) and after (104.2 ± 10.7/69.3 ± 8.4 mmHg) performance of the four-jump series and three rounds of choreography. There was a significant increase in RPE from BE (2.3 ± 1.1 points) to AE (7.9 ± 1.1 points) with a large effect size of −4.69 with 95% CI [−6.80, −2.97] (Figure 5b), indicating a greater experience of exertion.
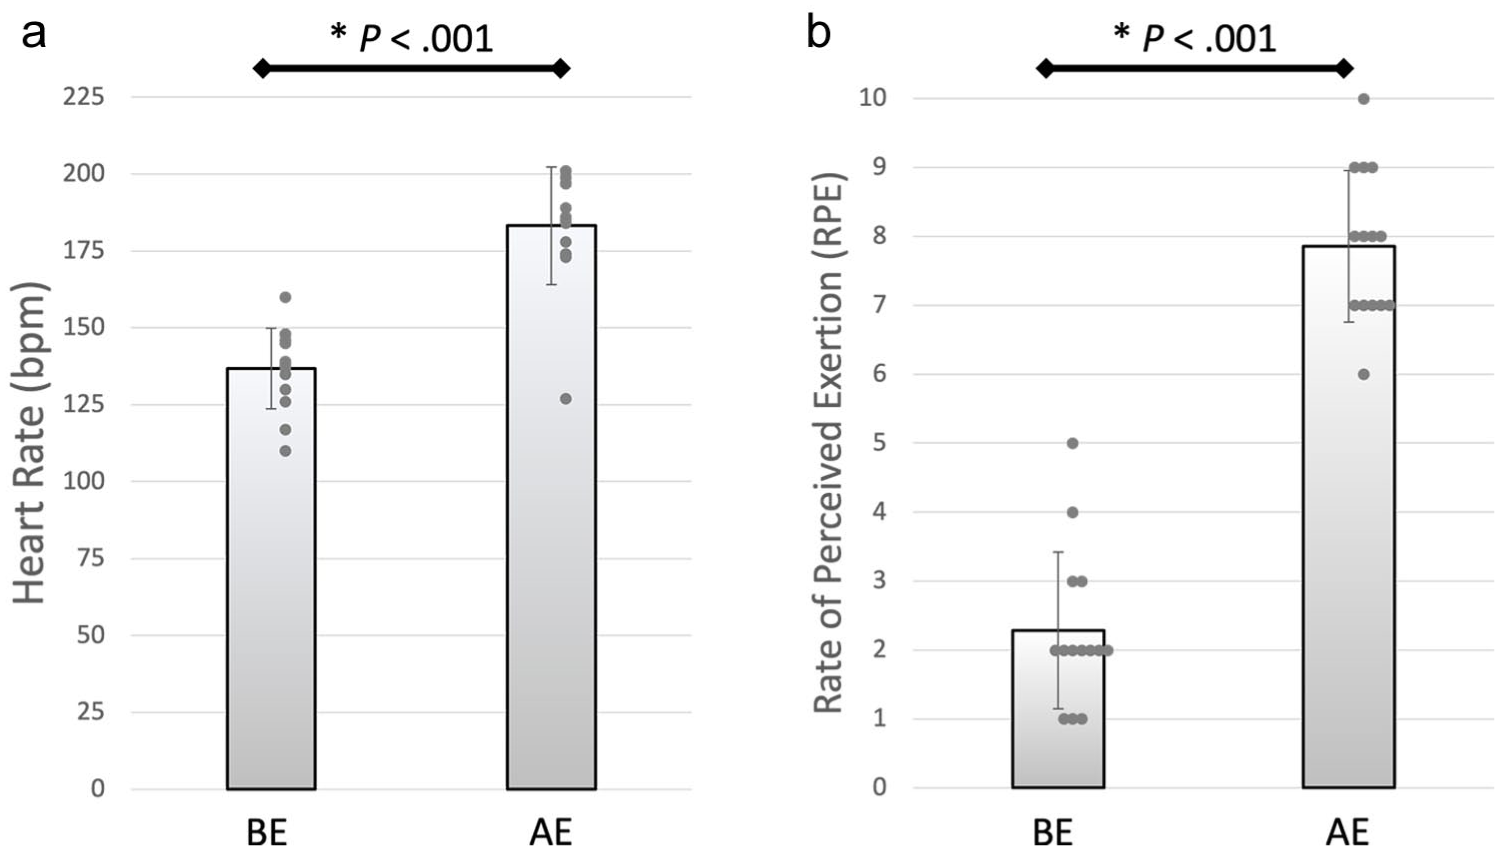
Heart rate and perceived exertion. (a) Mean heart rate (bpm) of all subjects for BE (125.1 ± 16.4) and AE (186.4 ± 11.0) conditions. (b) Mean rating of perceived exertion on the Modified Borg Rating of Perceived Exertion scale for BE (2.3 ± 1.1) and AE (7.9 ± 1.1) conditions.
Kinematics
Ankle angle at initial contact showed a small decrease (2.13°) in plantarflexion AE with a small effect size of −0.34 (from −35.3° ± 6.7 BE to −33.18° ± 7.4 AE). There was no statistically significant difference in ankle excursion in the sagittal plane in the energy absorption phase (63.2° ± 5.1 BE to 62.8° ± 4.7 AE). The knee excursion during the absorption phase was analyzed using the Wilcoxon Signed Rank Test because the data from the first jump series was not normally distributed. There was a statistically significant difference (P = .001), with the difference being 3.3° greater knee flexion after exertion (52.1° ± 4.1 BE to 55.5° ± 4.1 AE). Hip joint excursion in the sagittal plane showed a mean increase of 3.6° in hip flexion after exertion with a large effect size of −0.84 (20.0° ± 3.8 BE to 23.6° ± 4.2 AE). The jump rate remained consistent before and after exertion with a negligible effect size of −0.045 (96.0 bpm ± 2.8 BE to 96.1 bpm ± 1.0 AE) (Table 2).
Kinematics and Performance Measures: Mean Sagittal Plane Angles Before Exertion (BE) and After Exertion (AE), and Hopping Rate.
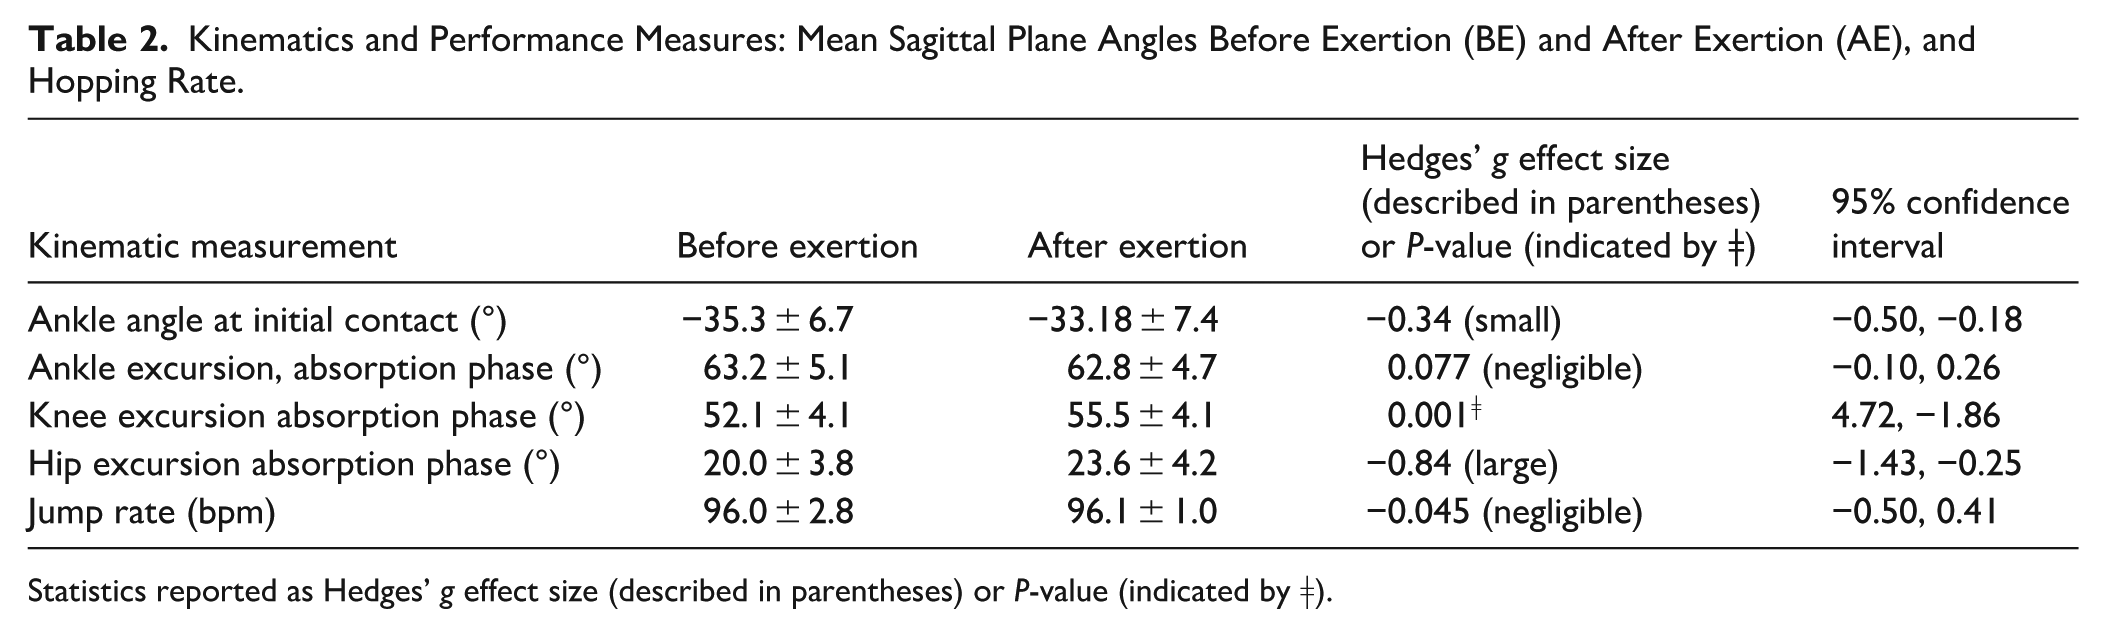
Statistics reported as Hedges’ g effect size (described in parentheses) or P-value (indicated by ǂ).
Kinetics
There was a difference in ankle torsional stiffness within the jump series BE and within the jump series AE. The ankle displacement, torque, and stiffness are all demonstrated for a representative dancer in Figure 3. The ankle stiffness of late landing was less than that of early landing BE (−0.003 deg/Nm, P = .007), while the stiffness of late landing was greater than that of early landing AE (0.004 deg/Nm, P = .001). There was also a shift between the two conditions of exertion where early landing and late landing both demonstrated greater torsional stiffness of the ankle AE compared to BE (early landing 0.01 deg/Nm, P < .0001; late landing 0.01 deg/Nm, P < .0001). This is demonstrated for a representative jump in a single dancer in Figure 6.

The ankle torsional stiffness indicated by slope (R2) for a representative dancer before and after exertion for a jump’s early and late landing phases.
For the ankle, (+) indicates dorsiflexion and (−) indicates plantarflexion. For the knee, (+) indicates flexion and (−) indicates extension. The confidence interval crossing 0 indicates that there is not a significant difference, as the null hypothesis (zero) is a reasonable possibility. The knee excursion was analyzed using the Wilcoxon Signed Rank Test because the data from the first jump series was not normally distributed and, therefore, not appropriate for analysis using Hedges’ g.
Discussion
The primary purpose of this study was to investigate quantifiable visually observable components of performance during prolonged continuous dance choreography that mimics the experience of a dance performance. We chose to analyze the lower extremity kinematics of dance-specific jumps (sautés). Our findings confirm that the dancers retained lower extremity sagittal plane kinematics as evidenced by comparable joint excursion in the sagittal plane. They also retained jump rate. To gain further insight into joint dynamics, we pursued combining ankle joint kinematics with ankle joint moment into a single dynamic variable, namely, joint torsional stiffness. It is torsional stiffness that revealed dynamic adjustments at the ankle, indicative of increased mechanical demand with exertion.
Dancers maintained some qualities considered important for consistent performance. There was a negligible effect size for jump rate, indicating the dancers remained “on beat” or performed the jumps at a consistent rate. The effect size for ankle excursion was negligible, and the confidence interval crossed 0, indicating that there is a possibility that the exertion-induced condition had no effect. Lower extremity sagittal plane joint excursion showed statistically significant differences at the knee and a large effect size at the hip, but the differences were small in value (<4°). These small-magnitude kinematic differences in joint angles may not be meaningful to a dancer from a performance or visually observable perspective. There are significant limitations to observational movement analysis when determining joint position. In a study comparing 2D and 3D video analysis of athletic tasks, poor consistency was observed between observers when examining a static 2D image, with an average deviation of 18° for knee flexion angles. 24 A systematic review of 2D video gait analysis found significant variation in the reliability of kinematics. 25 We also acknowledge the presence of subjectivity in observing dance from both professional adjudicators and non-expert observers that is still being investigated.26,27 This understanding of visual perception of differences in joint angles supports the finding that dancers retained at least some components of the visually observable elements of performance of the lower extremities after a period of dance.
In the statement of the purpose, we asked “if the kinematics are retained after exertion, what are the mechanisms behind this phenomenon?” Hence, the secondary aim of the study was to examine the kinetic modifications that occur after a period of exertion. Analysis of ankle torsional stiffness revealed a shift following a period of dance. After exertion, both early and late landings increased ankle torsional stiffness, with late landing being stiffer than early landing (Figure 6). This shows a difference in landing strategy after exertion. Landing stiffness has been shown to increase tendon strain, potentially contributing to overuse injuries.13,28 This stiffness seen at the ankle could increase strain on the ankle’s contractile tissues, and may be a contributor to Achilles or other plantarflexor tendon overuse injuries. These kinetic changes may also be a normal adaptation to dancing in an exerted state to optimize efficiency while performing. These concepts will need further investigation.
There was no expectation for the dancers in this study to reach a state of “complete fatigue,” but instead, we planned to mimic the experience of a dance class or performance by inducing a familiar level of exertion. One study on ballet performance intensity found that female ballet dancers performed at an exercise intensity of “hard” (undergoing hard work, for example, fast jog, run, multiple jumps and lifts) for 7.7+6.8 seconds per minute and “very hard” (undergoing very hard work, for example, run pace, static holds above shoulder height, multiple high jumps landing on one leg) for 2.1+2.9 seconds per minute. 29 The dance choreography designed for our study included movements classified as “hard” and “very hard” to simulate a typical dance performance. The 4 minutes of dance choreography used in our study was a reasonable expectation for dancers and, because the exertion was induced through familiar dance movement tasks rather than common athletic sport-specific tasks like running or biking, this experimental construct simulates a typical experience for dancers.
Our subjects demonstrated an increase in cardiovascular and experiential exertion. The heart rates of the subjects elevated to levels near the age-predicted maximum heart rate, similar to other studies. While dancers have been shown to experience intermittent training levels during both class and performance with a majority of time spent under 70% HR max, some faster dance pieces like “allegro” have been shown to increase the heart rate to 94% of maximum, as seen in this study.30-33 There was also an experience of increased psychological exertion as the reported rate of perceived exertion increased significantly from the pre-exertion state to the last series of jumps (Figure 5). This was similar to studies analyzing exertion during class or performance. 34 These findings indicate that our protocol induced an increased level of cardiovascular and psychological exertion at which the dancers could continue to perform since none of the subjects needed to stop the protocol before completion.
This study has some limitations. All subjects were female, making these findings less applicable to male or nonbinary dancers. We did not specify what style of dance training the subjects had, which may impact the performance of the prescribed choreography and classical dance style sautés. However, each dancer reported and demonstrated the ability to perform the assigned 1 minute of choreography as well as the sauté jumps. This study was meant to simulate a typical dance sequence in a performance or class, but we collected the data in a biomechanical laboratory setting and with motion capture markers. This may have altered the dancers’ comfort and, with it, their performance. Dancers are often used to performing in new situations and with different costumes, so these effects may not greatly impact the findings. The dancers were also aware that the fourth series of jumps was their last. This may have altered their performance and implicit choices affecting kinetics regarding energy conservation,
Future research should continue to investigate the non-visually observable changes that dancers experience after a period of sub-maximal exertion. Instead of analyzing changes after a period of full fatigue, this assesses the changes in a situation similar to a typical dance class or performance. Previous research has shown that, after exertion, the energy contribution from the lower extremity joints shifts from the ankle and knee proximally to the hip.5,6,8 We also see a trend toward a “softer landing” shown with a decreased peak ground reaction force or decreased leg stiffness.3,5,6,35 Considering this study, there may also be shifts of joint torsional stiffness proximally to the knee and hip, which would be worthy of further investigation. Because increased mechanical stiffness has been shown as a possible risk factor for overuse injuries, this study may offer insights into dance-specific injury of the lower extremity.12,13,28 However, as we have not looked directly at injury in this study it is unclear if the shift seen in ankle torsional stiffness would contribute to injury or if it is a normal adaptation to increased exertion.
Conclusion
Dancers are expected to maintain a visually consistent performance with their movements while physically exerting themselves during dance class, rehearsal, and performance. This focus on visual consistency may mask biomechanical adjustments during their work, contributing to overuse injuries. Dance relies on a visual assessment of performance. However, a dancer can complete movements with different kinetic approaches but appear the same on visual assessment, especially with consistent kinematics. This study demonstrated that dancers show small shifts in lower extremity kinematics while significantly altering the ankle kinetics after exertion. Increasing the torsional stiffness of the ankle with landing may offer insights into the mechanism of overuse injury even throughout a typical expectation of dance performance.
Footnotes

Ethical Considerations
Approval was received from the University of Southern California Institutional Review Board (HS-18-00537).
Consent to Participate
Participants were provided with written informed consent to participate.
Consent for Publication
Informed consent for publication was provided by the participants.
Funding
The authors received no financial support for the research, authorship, and/or publication of this article.
Declaration of Conflicting Interests
The authors declared no potential conflicts of interest with respect to the research, authorship, and/or publication of this article.
Data Availability Statement
The data that support the findings of this study are available from the corresponding author upon reasonable request.*