
Abstract
Key Points
Sole stiffness of pointe shoes showed a weak negative correlation with usage time, with some long‑used shoes remaining stiffer than short‑used ones.
Mechanical stiffness testing revealed that usage duration did not consistently predict reductions in pointe shoe sole stiffness.
Differences in sole stiffness altered vGRF patterns during landing, particularly around ball‑of‑foot and heel contact phases.
Introduction
Ballet is widely recognized as an exceptional form of performing art, and ballet dancers are often required to execute highly demanding physical maneuvers, such as jumping, landing, and maintaining a quiet stance.1,2 The ballet dancers wear pointe shoes to support these unique movements and protect their feet from the mechanical loading associated with these movements (Figure 1). The pointe shoe is the only piece of equipment that exists between their feet and the ground. It not only enhances the aesthetics of the leg-foot posture but also maintains the foot’s rigidity, which aids in retaining a stable toe position. 3 The structure of the modern pointe shoe is simple, and it comprises the toe box (Figure 1A), outer sole (Figure 1B), the shank, the vamp, and the collar. These structural components are traditionally constructed from layers of cardboard, paper, glue, satin, and leather, while some contemporary models (e.g., Gaynor Minden) employ thermoplastic polymers in combination with satin and leather.
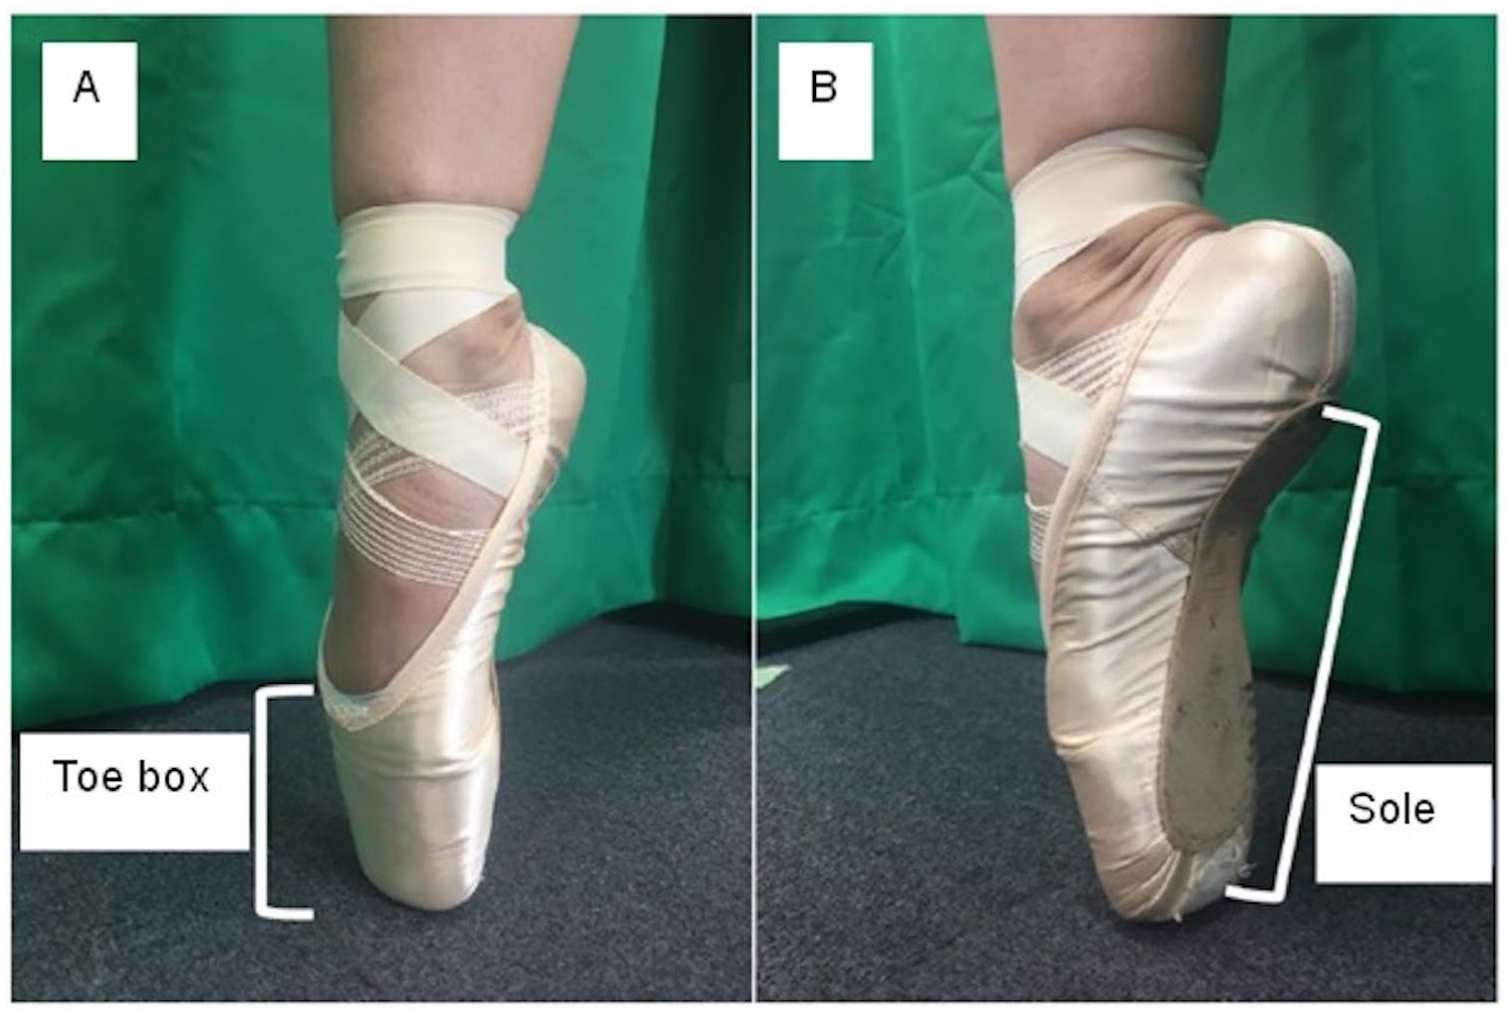
Structure of pointe shoe. Main structure of modern pointe shoe comprises toe box (A) and sole (B).
A previous study reported the effects of pointe shoe stiffness on ballet performance, categorizing pointe shoes by their usage time. 4 The shoe stiffness describes the resistance of a shoe structure to being bent and stretched under the action of external forces, and it is assumed to decrease due to shoe fatigue. However, the stiffness of pointe shoes was not quantified in this previous study, 4 and it is possible that the usage time might not necessarily reflect the stiffness reduction of pointe shoes in all cases. Accurately quantifying the stiffness of pointe shoes is crucial. However, to the best of the author’s knowledge, to date no studies have examined the impact of pointe shoe stiffness on ballet performance using precise measurements of shoe stiffness.
To evaluate the mechanical contribution of the pointe shoe within the context of ballet movements, it is important to investigate the dancer’s response to foot-floor mechanical interactions during jump landings. This focus is pertinent, considering that jumping and landing maneuvers are frequently executed in ballet. 1 Ground reaction force (GRF) is particularly relevant, as they reflect the magnitude and timing of impact experienced by the dancer.5-7 However, GRF alterations are not inherently beneficial or detrimental; their implications depend on both performance requirements and injury risk. For example, Walter et al 8 demonstrated that landings performed in pointe shoes produced significantly lower GRF compared to flat shoes, suggesting that pointe shoes may reduce impact during ballet movements. Conversely, McPherson et al 6 found that while worn pointe shoes did not significantly alter peak GRF, they induced greater mid-foot flexion and ankle plantarflexion, kinematic changes that may increase injury risk despite unchanged GRF magnitude. 9 A recent scoping review further highlighted that the majority of studies on pointe shoes (86%) have assessed biomechanical outcomes using force plates, 7 underscoring the centrality of GRFs in this research field. Moreover, landing is a movement that can manifest the effects of varying stiffness in pointe shoes, which mediate between the ballet dancer’s feet and the floor. Taken together, these findings emphasize the necessity of interpreting GRF changes within a broader biomechanical and clinical context, as footwear-induced modifications may simultaneously mitigate impact yet contribute to altered mechanics that affect performance and injury risk.
Although landing patterns can be characterized using different GRF waveforms, previous research mainly relied on discrete values such as peak value, time to peak, and/or center of pressure length derived from vertical GRF (vGRF) data, drawing comparisons among artificially divided groups.3,4,9 Such values fail to capture the temporal features of vGRF and cannot adequately represent the effects of differences in shoe stiffness.
The purposes of this study were to quantify the stiffness of the sole of pointe shoes and to investigate its effect on vGRF during single-legged landings by ballet dancers. The first hypothesis was that shoe stiffness negatively correlates with their usage time. The second hypothesis was that variations in pointe shoe stiffness would alter the shape of the vGRF waveform during single-legged landings, with differences expected between harder and softer shoes. 4
Materials and Methods
Participants
The study included 11 female ballet dancers, each with a minimum of 10 years of ballet experience (age: 27.8 ± 3.2 years, height: 158.4 ± 4.9 cm, body mass: 47.0 ± 5.4 kg, ballet experience: 22.8 ± 3.2 years). Participants with a history of severe lower extremity injuries, such as an anterior cruciate ligament rupture, were excluded. Additionally, those who had sustained light to moderate lower extremity injuries, such as an ankle sprain, within 6 months leading up to the experiment, were also excluded. This study was approved by Osaka University Hospital [No. 20029]. All participants were informed about the purpose of this study, and written informed consent was obtained before the commencement of the experiments.
Measurement of Pointe Shoe Properties
Each participant provided two pairs of the same model pointe shoes for stiffness measurement. All shoes had been initially broken in through each dancer’s usual preparation process before testing; no brand-new shoes were used in this study. One pair had been used for less than 10 hours (h) (short usage time), while the other, having been used for over 10 h (long usage time), was deemed ready for replacement by the user. These usage durations were determined based on participants’ self-reported cumulative wearing time and their subjective judgment of shoe condition. These shoes included three models—Bloch, Grishko, and Sylvia.
The stiffness of each shoe was quantified by a sole bending test using a material testing apparatus (Autograph AG-IS, Shimadzu, Kyoto, Japan). Based on the measured stiffness values, the shoes were further classified into two categories, hard shoes and soft shoes, for subsequent analysis. A custom-made metal jig featuring a 60 mm beam span facilitated a three-point cyclic bending test. The indenter, attached to the upper arm of the apparatus, had a cylindrical shape with a radius of 5 mm, while the fulcrum had a half-cylinder shape with a radius of 2.5 mm (Figure 2A). The loading point was at the sole’s narrowest width, which was individually identified for each shoe by measuring the percentage of its location from the toe to the heel. The mean value across all shoes corresponded to approximately 65% of the total sole length (Figure 2B and C). The speed of the indenter remained consistent at 60 mm/min throughout all tests.
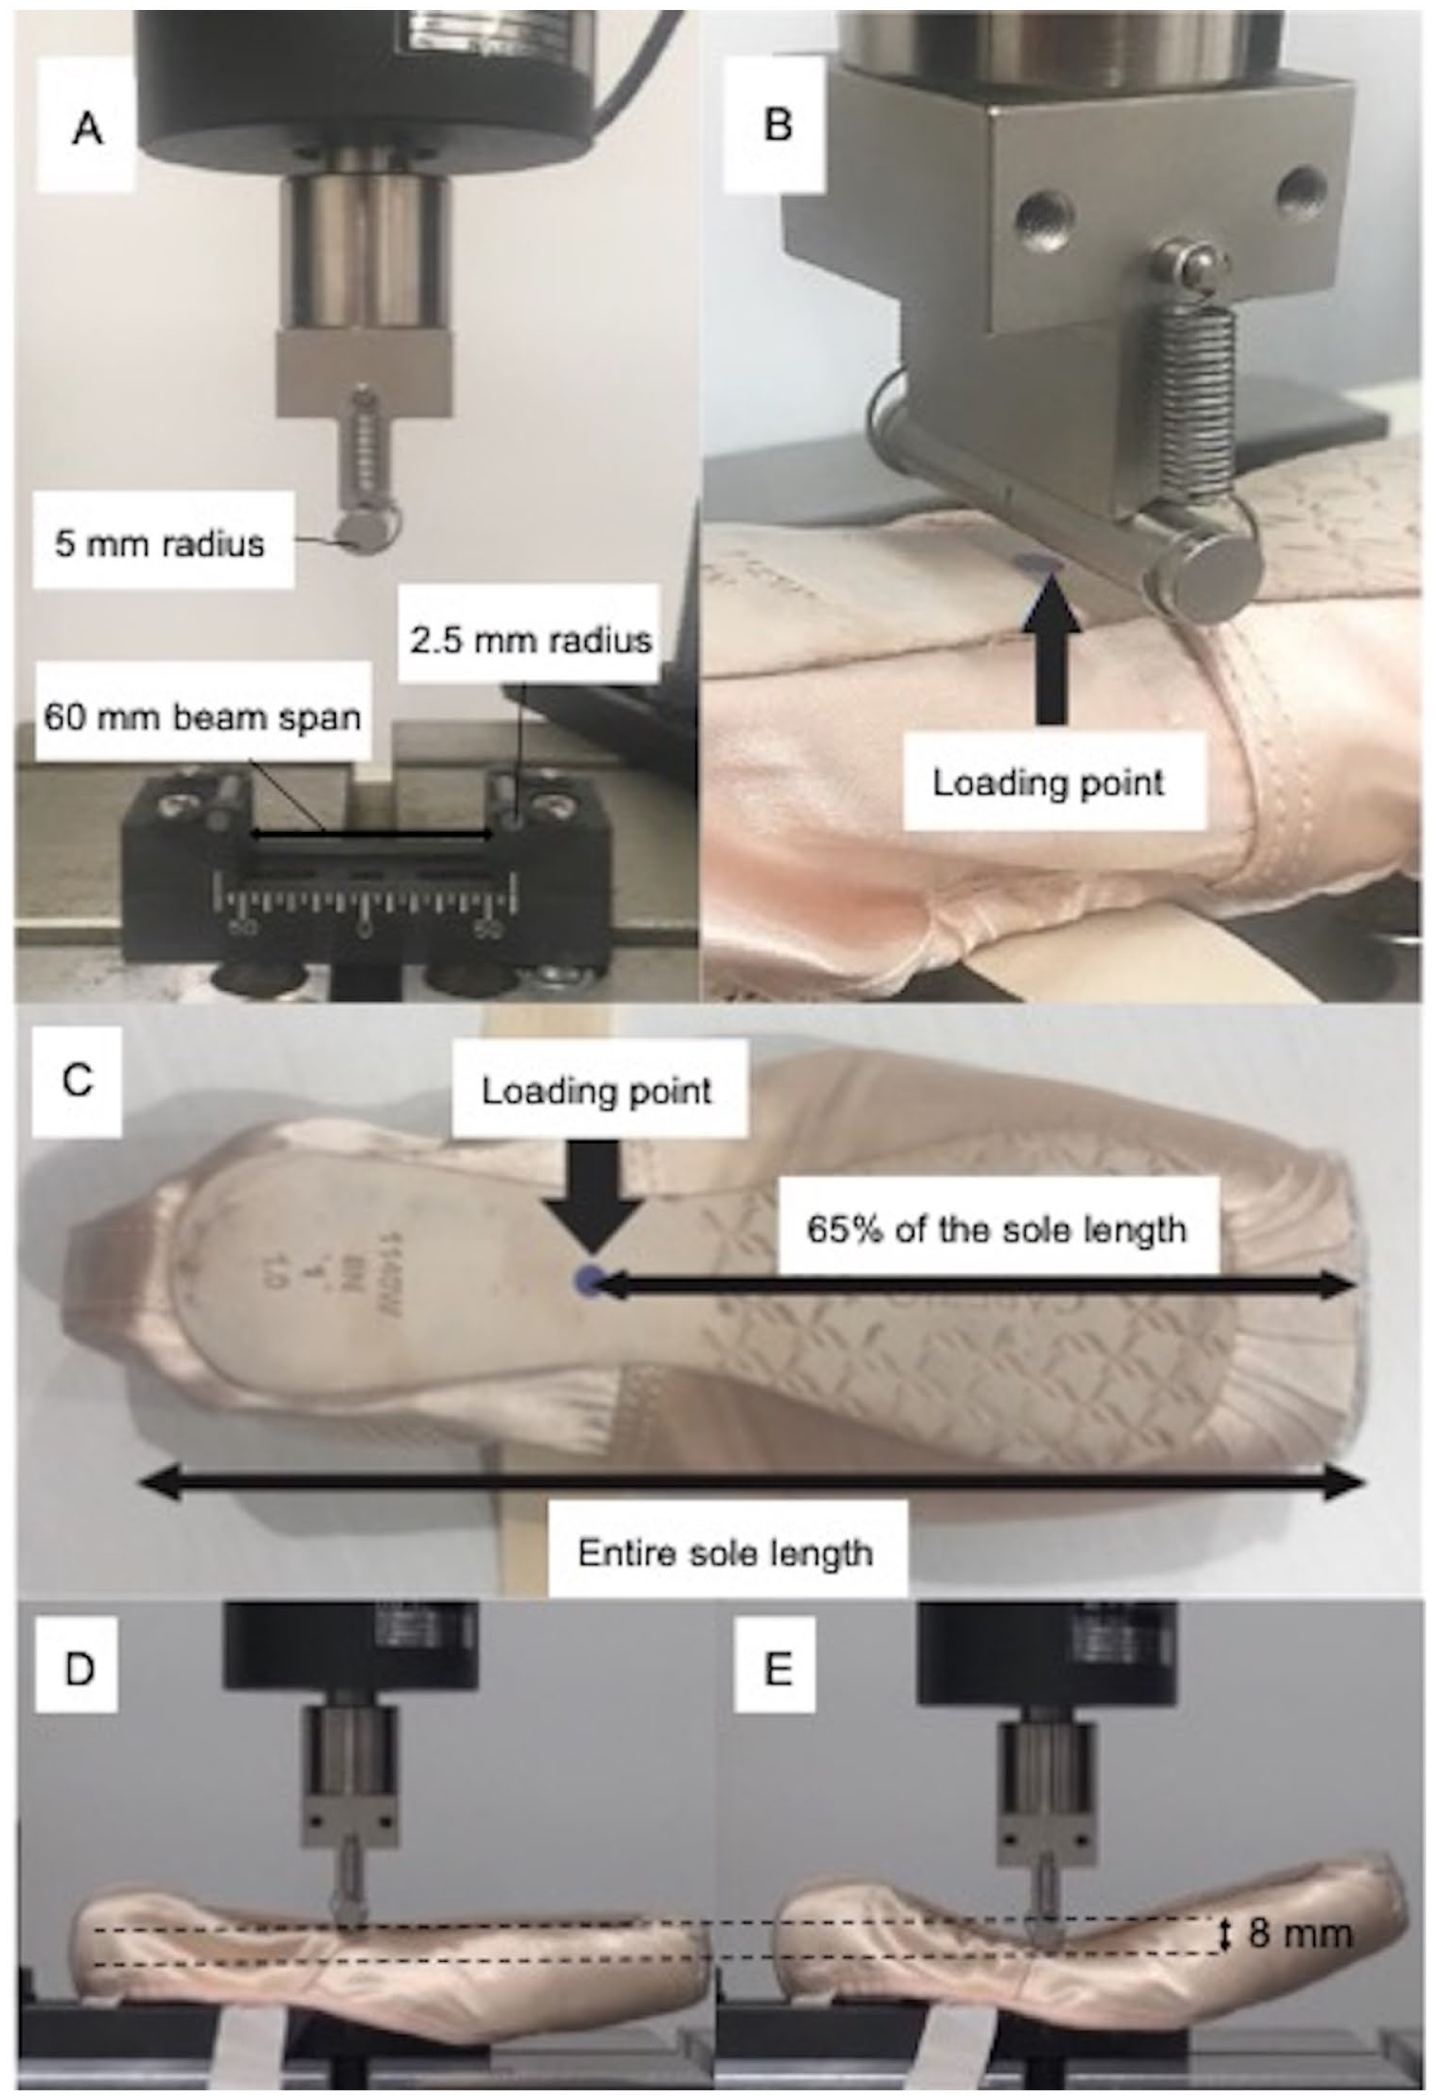
Setup for the sole bending test; (A) custom-made jig; (B) adjusted position of pointe shoe; (C) loading point; (D) scene of sole bending test with the preload of 3 N as initial position; (E) main loading where the indenter descends to 8-mm depth.
An initial compressive load of 3 N was applied as preload (Figure 2D). This preload position of shoe sole which slightly flexed from its no-load position was defined as the reference configuration. This slightly flexed position was considered the initial position for the main loading test. In the main test, the indenter was vertically pressed to a depth of 8 mm from the initial position (Figure 2E). Following this, the indenter reverted to the initial position, thus completing one cycle. This force application cycle was repeated 20 times, and a load-displacement curve was obtained.
Calculation of Sole Stiffness
The shoe sole stiffness was determined by tangent modulus (N/mm) using the following equation:
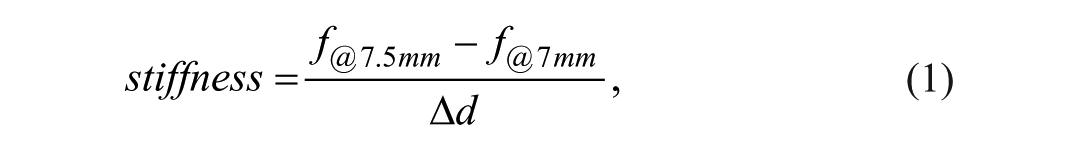
where
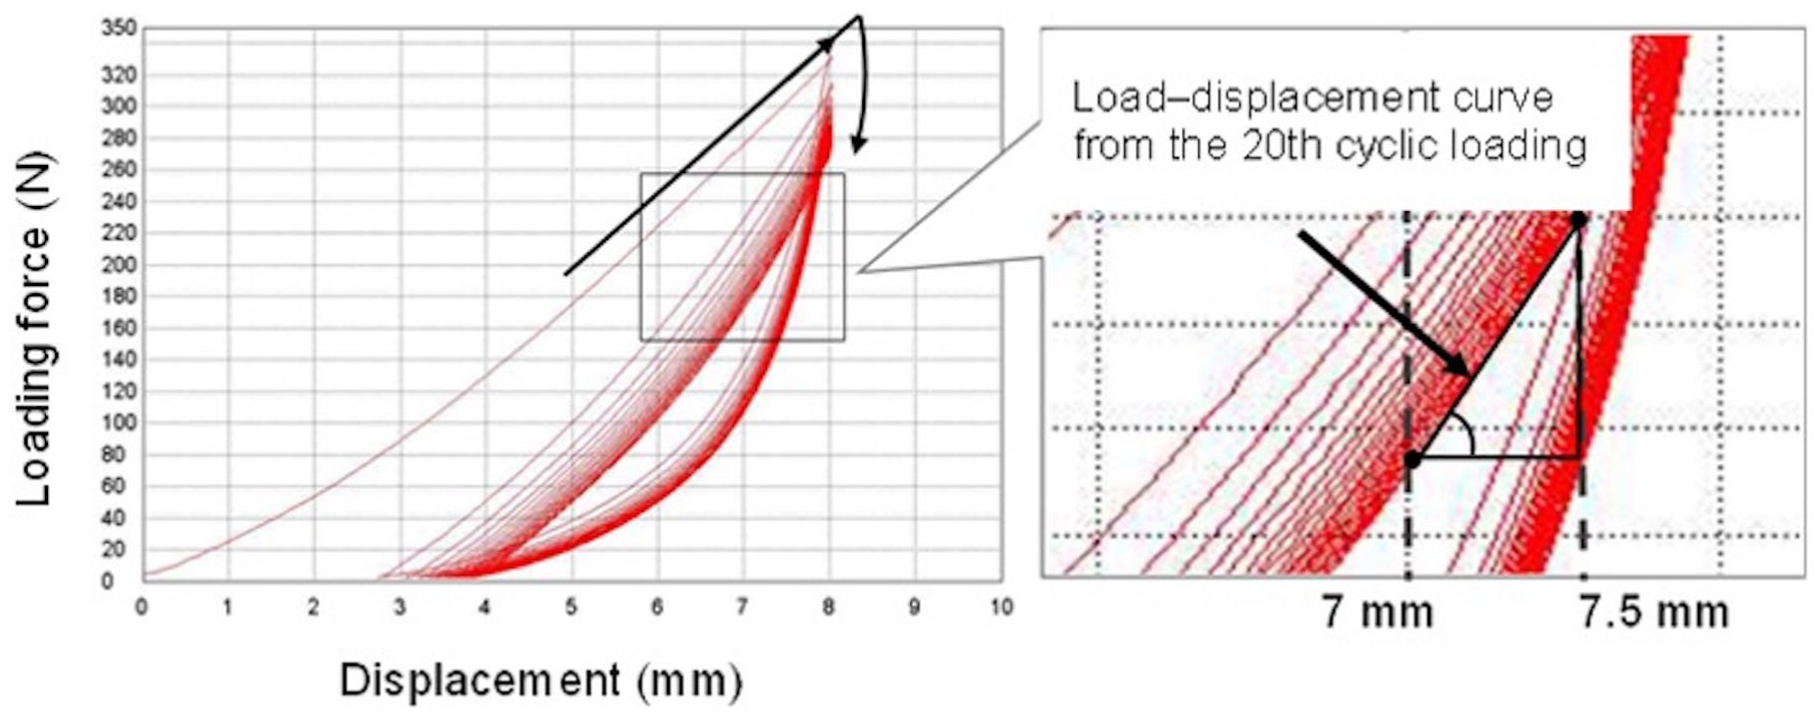
Load–displacement curves obtained from the sole bending test, and definition of stiffness representing sole properties.
Single-Leg Drop-Jump Landing Measurement
After the measurement of pointe shoe stiffness, the single-leg drop-jump landing measurement was conducted. Participants wore a leotard, black shorts, and pointe shoes. Prior to the main experiments, each participant underwent a 20 min warm-up following their individual routines. Single-leg drop-landings were performed from a 20 cm high box onto a force plate (BP600400, Advanced Mechanical Technology, Inc., Watertown, MA, USA, Figure 4). The procedure was guided by a custom-made audio guidance program. Initially, participants stood with both feet on the 20 cm high box. At the commencement of a 5 to 0 countdown, they shifted to standing on one leg (Figure 4A). Upon hearing “jump” from the program, they jumped forward off the box, landing on the center of the force plate with their standing leg (Figure 4B). After landing, they were required to maintain a static single-leg stand for at least 5 seconds (s). Throughout the landing task, participants were required to keep their arms folded across their chests. Trials where the folded arms were uncrossed, the landing foot shifted from its initial position, or the non-standing foot touched the force plate were deemed unsuccessful, and participants retried the task.
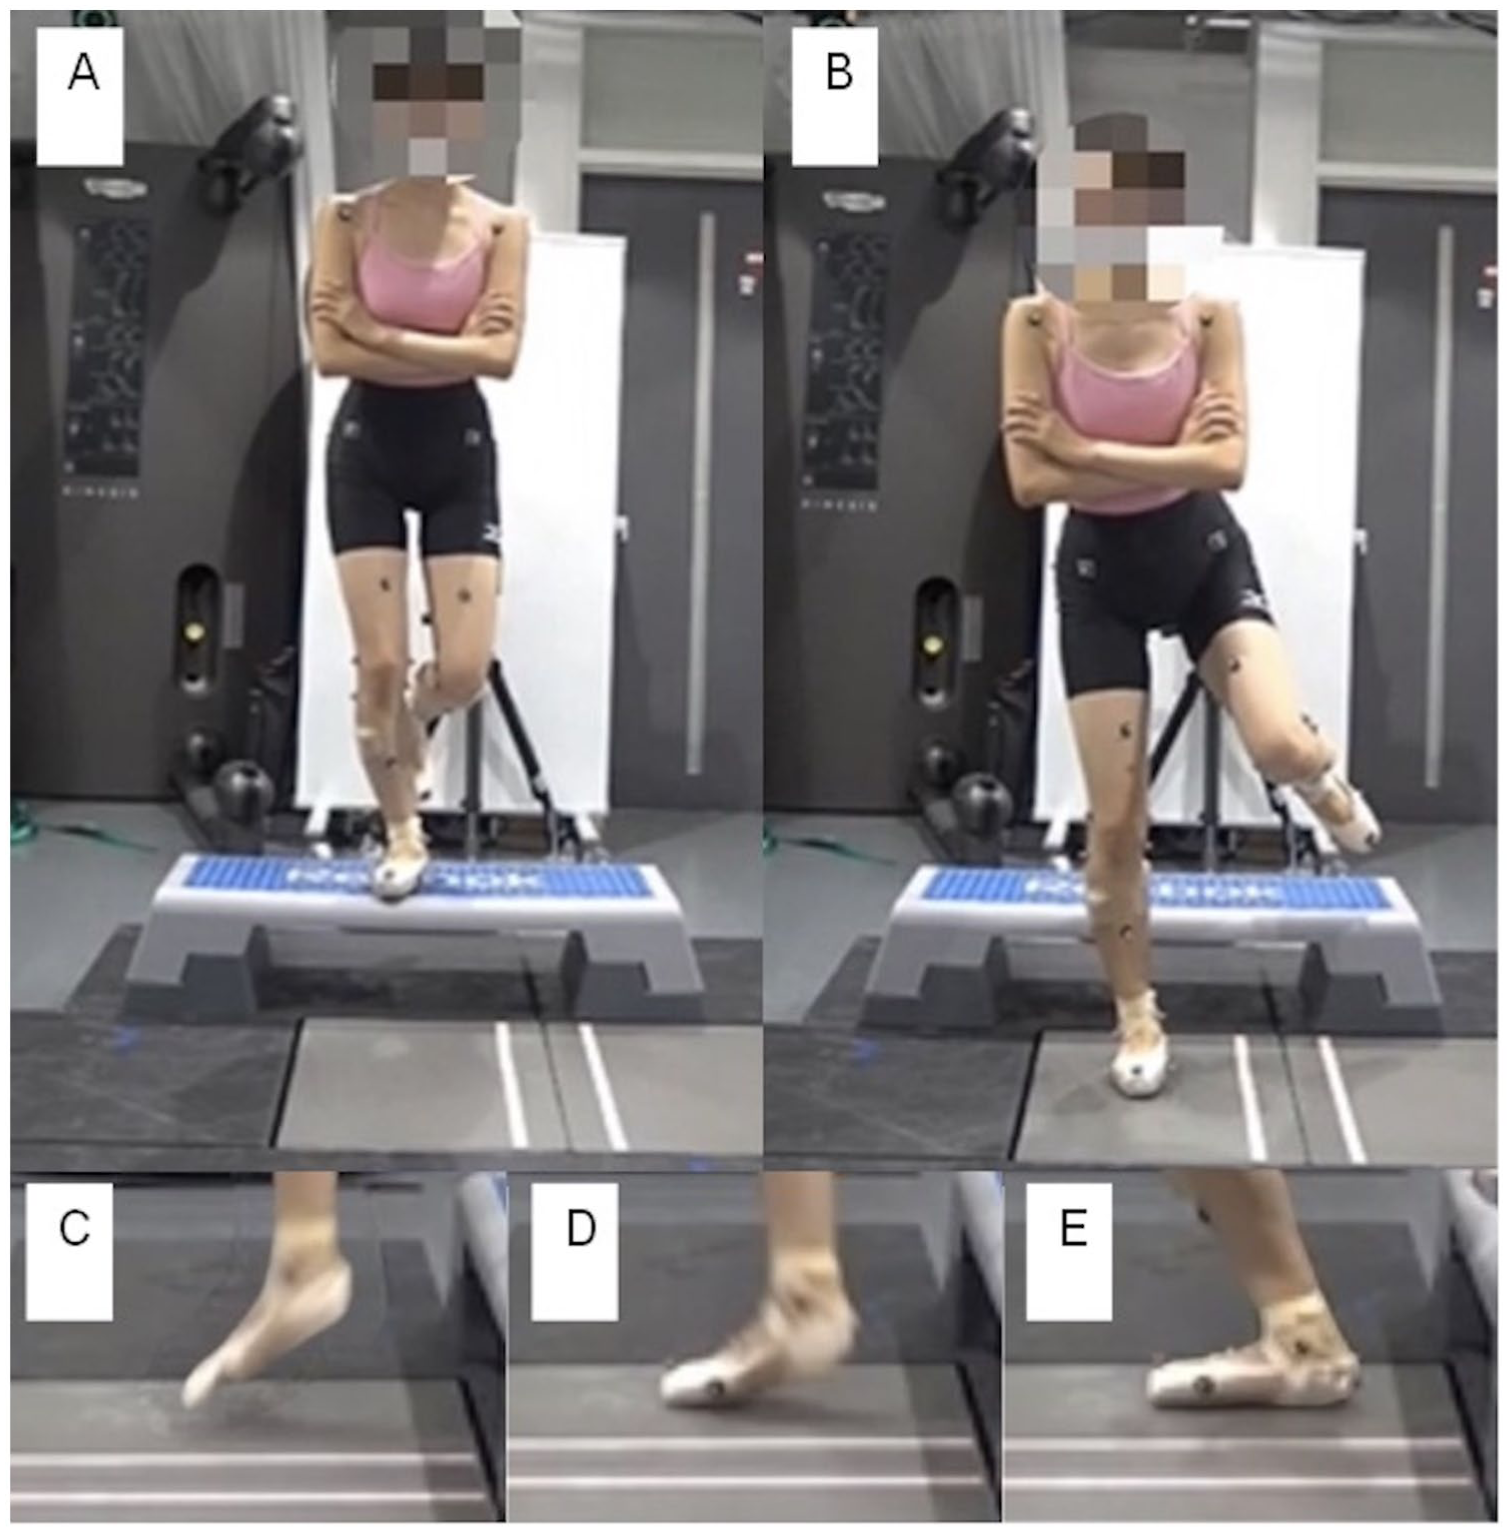
Horizontal and sagittal view of single-leg drop-jump landing. Participants initiated by standing on one leg (A) and then stepped off a 20 cm high box onto a force plate (B). Foot makes sequential contact with ground: first at the toes (C), followed by metatarsophalangeal joint (D), and finally the heel (E).
The task was repeated until 10 successful trials were achieved for each shoe condition. The entire procedure was then repeated for the opposite leg and in different shoe conditions (resulting in 20 trials in total per leg, including 10 in the soft shoe condition and 10 in the hard shoe condition). The order of legs and shoe conditions was randomized across different participants. To minimize the effects of fatigue, a 10-minute break was allowed between shoe changes. The GRF data were recorded at a sampling frequency of 1800 Hz using the motion capture control software (Motive Body 2.2.0 Final, NaturalPoint Inc., USA).
Data Analysis
Principal component analysis for vGRF during single-leg drop-jump landing
In this study, principal component analysis (PCA), which is a method for summarizing multidimensional data matrices by using vectors in the direction of the largest variance, was employed.10,11 This method provides a reduced set of uncorrelated variables with minimal information loss, allowing for distinguishing between vGRF wave patterns across different shoe stiffness groups. Then, the loading vectors of selected discriminant components are visualized to explain the time periods where vGRF patterns differ across different shoe stiffness groups.
This study utilized PCA to identify the areas within the data space that predominantly reflect the vGRF waveform variations, which are attributable to differences in shoe stiffness. The vGRF waveform during landing may be affected by both shoe stiffness and each dancer’s unique motor strategy. However, the focus of our study was only the impact of shoe stiffness on the vGRF waveform. Therefore, to suppress the effects of individual motor strategies in the PCA, we executed PCA for each leg separately.
For preprocessing, the vGRF data were smoothed using a second-order Butterworth digital low-pass zero-lag filter, with an optimal cut-off frequency of 51 to 113 Hz. The residual analysis determined the cut-off frequency for this smoothing process. 12 The candidate frequencies were applied, the root mean square error (RMSE) between the filtered and original signals was calculated, and the RMSE curve was smoothed using cubic interpolation. A linear fit to the high-frequency portion of the curve defined the asymptotic baseline, and the cutoff frequency was chosen where the RMSE approached this baseline. The smoothed vGRF signals, spanning from the initial foot contact (IC) to peak vGRF, were time-normalized to 101 points (0%-100%).
The time of IC was identified when the vGRF first exceeded 10 N. A 20 × 101 data matrix
If differences in shoe stiffness led to distinct data distributions within the vGRF data space, trials from each shoe condition (10 soft vs 10 hard shoe trials) would exhibit noticeable variations along the principal axes of the larger PCs. To condense the information, we selected the top k-th PCs, which accounted for over 95% of the data variance, for the subsequent soft-shoe classification process. The k value was different for each leg. Refer to Supplemental Appendix A for the mathematical details of the PCA. Offline data analysis was conducted utilizing custom-made scripts written in Python 3.9.6, operating on the PyCharm Professional IDE (Version 2021.2, JetBrains, Czech).
Statistical Analysis
Sole stiffness
The stiffness values, quantified by the sole bending test described in Section “Measurement of Pointe Shoe Properties,” were compared between shoes with short and long usage durations. The Shapiro-Wilk test indicated that the stiffness of the long-usage shoes did not follow a normal distribution. Consequently, the Wilcoxon signed-rank exact test was employed (P < .05). In addition, Spearman’s rank correlation coefficient was calculated to evaluate the relationship between stiffness and usage time (P < .05).
Classification of PCs by sole stiffness
By using the top k-th PCs derived from the PCA of vGRF data, we conducted a linear discriminant analysis (LDA). The objective of the LDA was to identify the optimal combination of PCs that can distinguish between the two shoe conditions. The LDA is a classification technique that identifies the (n − 1) dimensional hyperplane best positioned to segregate distinct categories within an n-dimensional data space. In this study, authors initially created a two-dimensional data space using two given PCs (e.g., PC1 and PC2). Subsequently, the LDA was integrated to identify a linear line (a one-dimensional hyperplane) that most accurately separated data from the soft shoe condition (n = 10) and hard shoe condition (n = 10). The classification accuracy was quantified using the discrimination ratio, which was determined as the percentage of misclassified data. The LDA was repeatedly performed for all
Results
Sole Stiffness
Among the 22 pairs of pointe shoes, the average stiffness for shoes with short usage was significantly greater than that of shoes with long usage: 39.1 [25.4] N/mm and 26.1 [14.1] N/mm, respectively (P < .01). However, for two out of the twenty-two pairs of shoes, this trend was reversed (2L and 3L, Figure 5). There was a weak, yet significant, correlation between sole stiffness and usage time
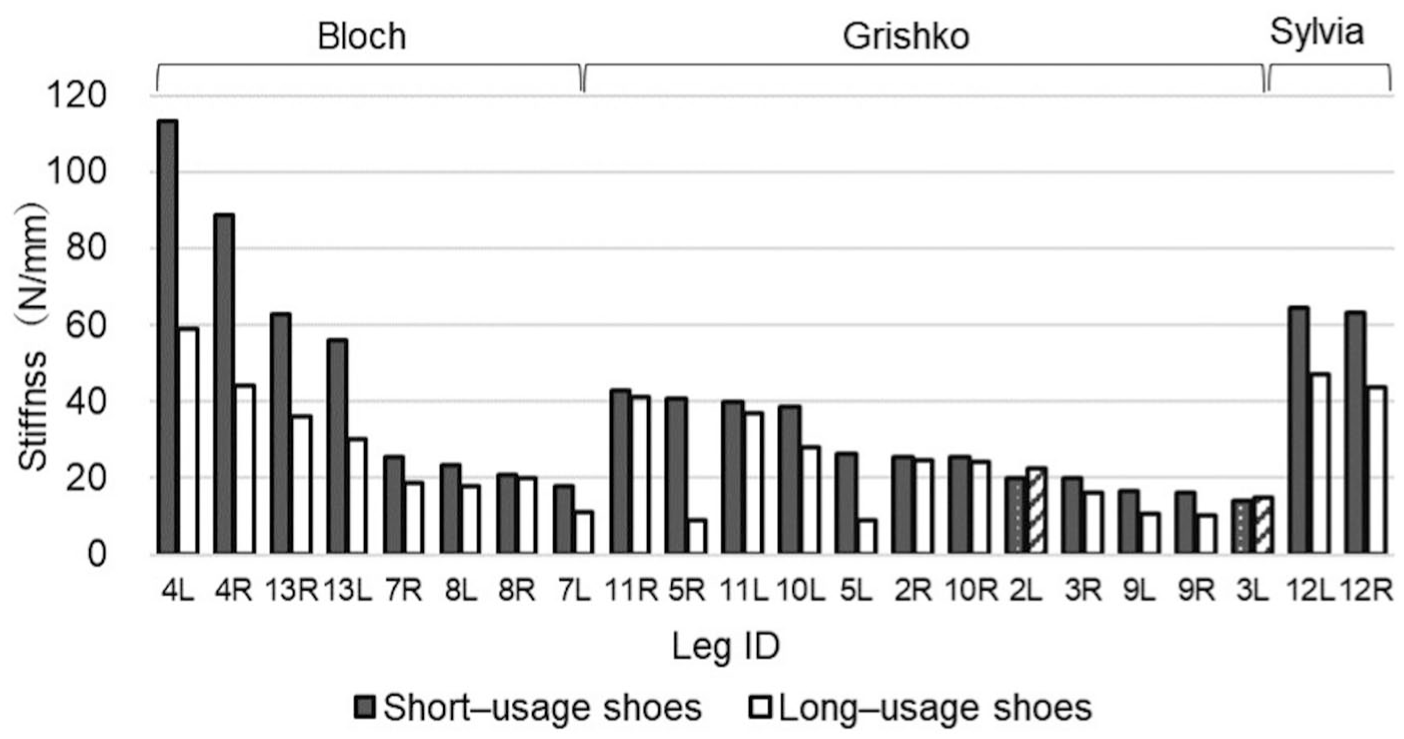
Stiffness of each shoe. Solid and open bars represent stiffness of pointe shoes with short and long usage times, respectively. Hatched bars indicate shoes with longer usage times that possess greater stiffness than red dotted bars representing shoes with short usage.
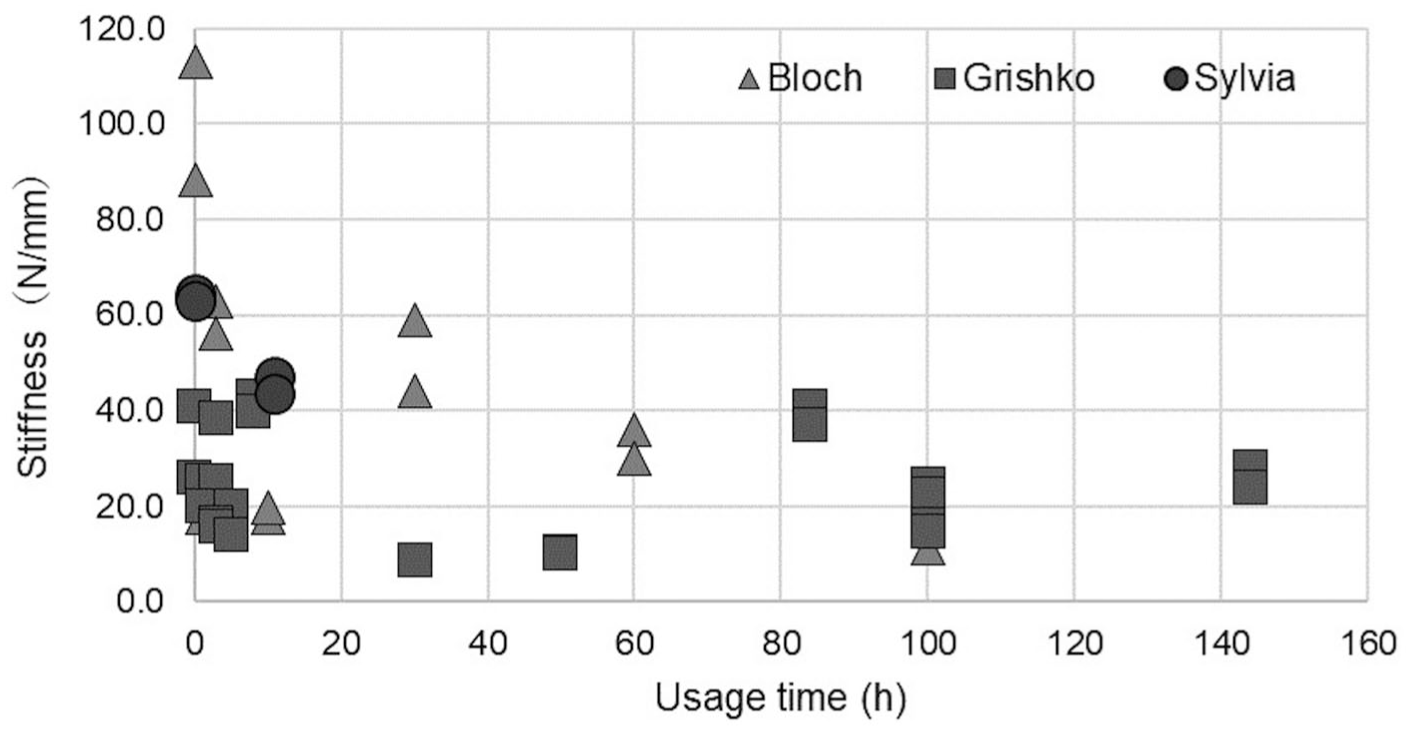
Scatterplot depicting relationship between usage time and stiffness of each shoe.
Loading Vectors Representing Key Time Points for Soft and Hard Shoe Classification
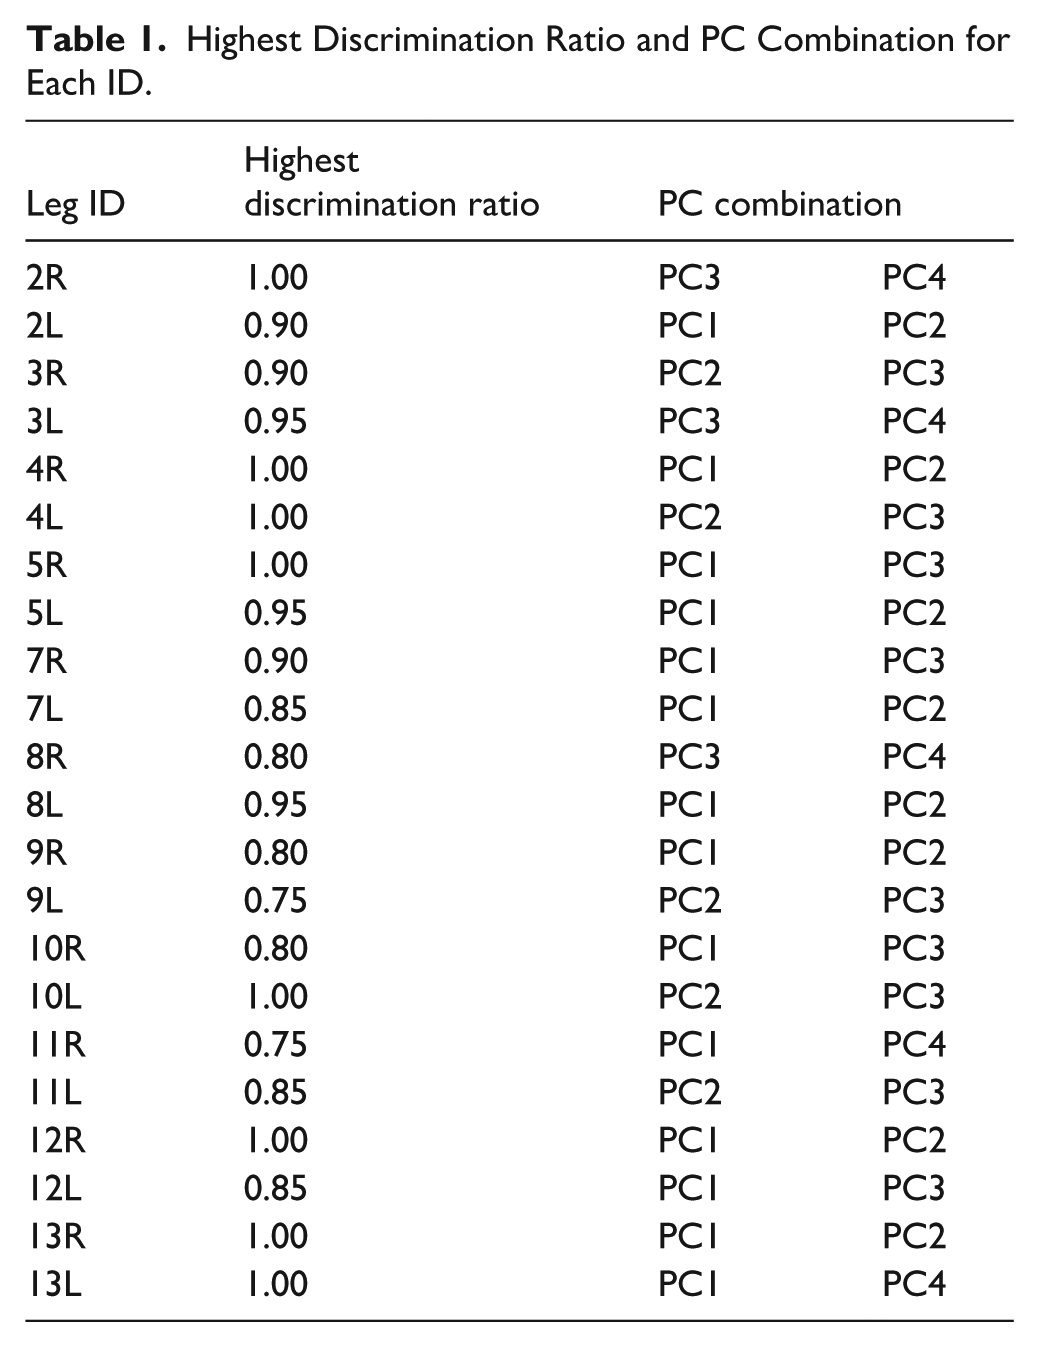
The magnitudes of the loading vectors for the PCs selected by LDA were assessed. Kindly refer to Supplemental Appendix B for the PC combinations that achieved the highest discrimination ratio, as determined using LDA. For example, the data for the soft and hard shoe conditions (10 trials each) from participant 13L were perfectly separated in the two-dimensional data space formed by the optimal combination of PC1 and PC4, resulting in a discrimination ratio of 1.0. In contrast, the data from participant 9L were not as clearly separated, resulting in a discrimination ratio of 0.75. The loading vector elements of selected PCs increased 25% and 100% time period (Figure 7). This result suggests that the vGRF waveform during these specific time periods is significantly affected by differences in shoe stiffness (Table 1).
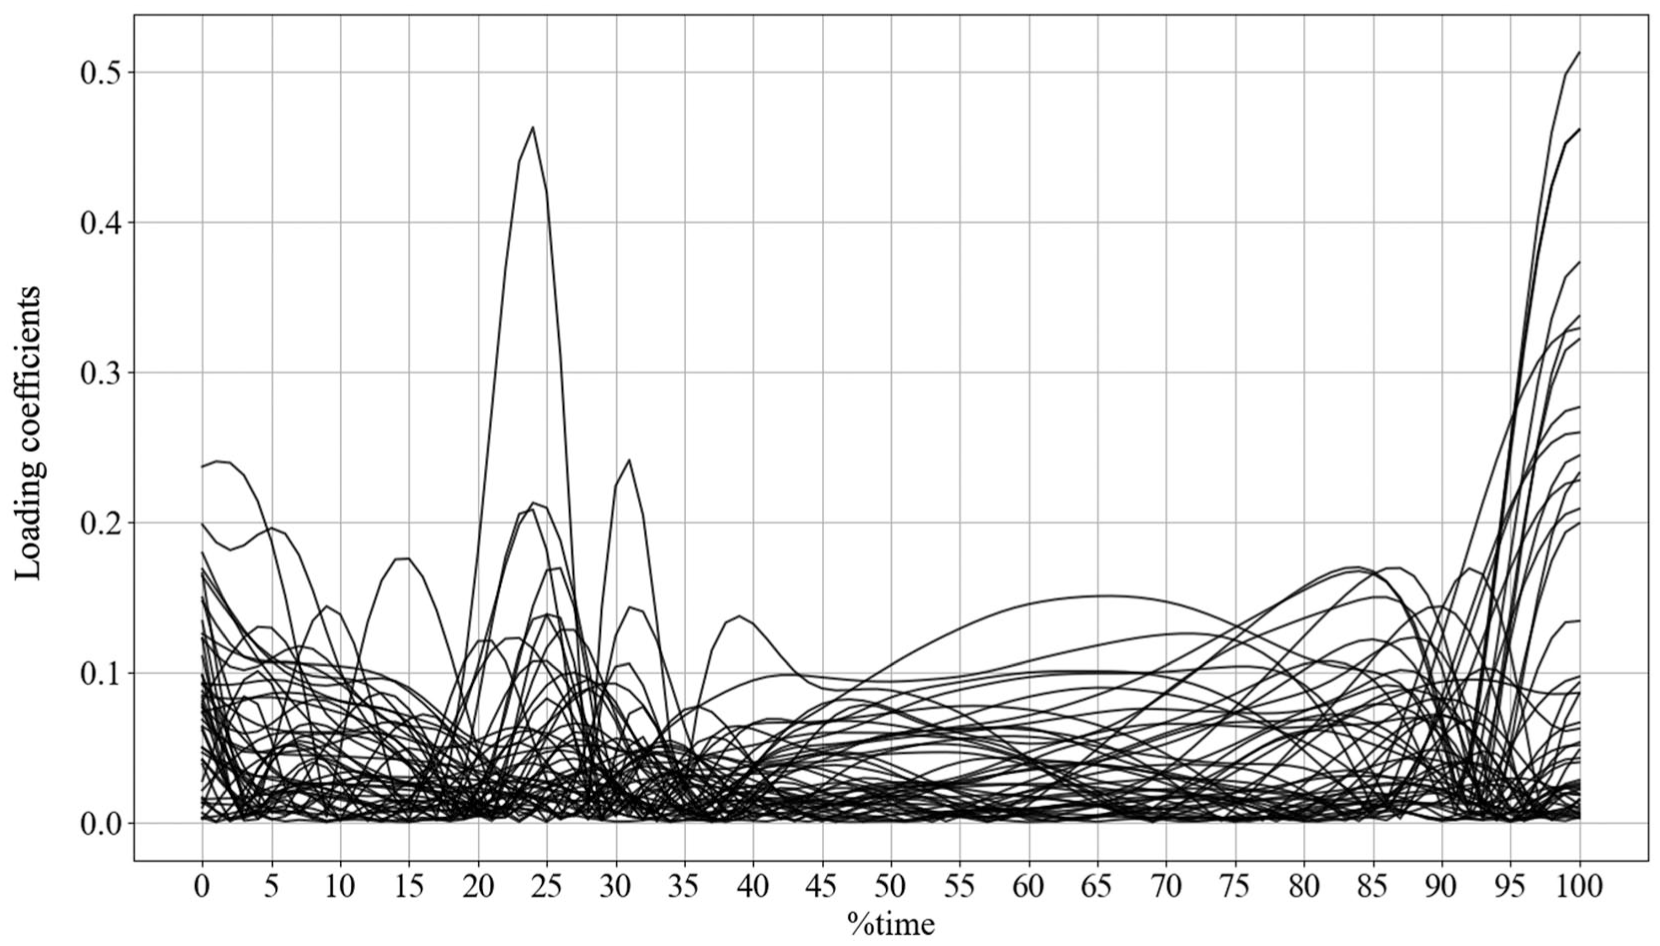
Absolute values of loading vectors of selected PCs from all participants.
Highest Discrimination Ratio and PC Combination for Each ID.
Discussion
The purposes of this study were to quantify the stiffness of the sole of pointe shoes and to investigate its effect on vGRF during single-legged landings by ballet dancers. The first hypothesis was that shoe stiffness negatively correlates with their usage time. Based on the results from the sole bending test, shoes with a shorter usage time were generally stiffer than those used for a longer time (Figures 6). This finding aligns with prior studies suggesting that pointe shoes tend to lose their stiffness as the duration of their use extends.4,9 In addition, some shoes exhibited reversals of stiffness patterns between short and long usage durations (Figure 5), in which a shoe used for a shorter duration was less stiff than its corresponding shoe used for a longer duration. Therefore, the observed weak correlation coefficient and the existence of reversal stiffness patterns indicate that classifying shoe stiffness based solely on usage duration, as done in previous studies, 4 might not be an accurate approach. (These discrepancies may arise from inter-individual differences in usage patterns, shoe models, or material variability, suggesting that shoe stiffness classification requires direct mechanical assessment rather than inference from usage duration alone.)
The second hypothesis was that variations in pointe shoe stiffness would alter the shape of the vGRF waveform during single-legged landings, with differences expected between harder and softer shoes. It was observed that the two-dimensional data space, defined by the chosen combination of PCs through LDA, distinctly separated the data for soft and hard shoe conditions. This suggests that the vGRF waveform during landing differs based on shoe condition. Notably, the loading vector elements of the selected PCs peaked around the 25% and 100% time periods (Figure 7), implying that the vGRF during these periods was affected by variations in sole stiffness. Concerning the vGRF during landing, a first peak represents the landing moment of the ball of the foot, preceding the maximal value observed at heel contact. 13 Similarly, in this study, the 25% time period corresponds to the landing of the ball of the foot, whereas the 100% time period marks the timing of heel contact.
One of the novel points in this study was the quantification of the sole stiffness of pointe shoes to classify the shoe conditions. The focus on sole stiffness arises because it is structured to align with the plantar arch and bears the load during the foot-grounding phase of landing. During this phase, different parts of the foot contact the ground sequentially: first, the toes, followed by the metatarsophalangeal joint, and finally, the heel (Figure 4C-E). If the sole corresponding to the plantar arch is softer, the ground contact is expected to be more gradual. In contrast, a stiffer sole might lead to more rapid successive contacts. Furthermore, prior studies have shown that typical thin layers of flat shoes rather than pointe shoes can reduce the vGRF, aiding in shock absorption.8,14 This may be primarily attributed to the fact that the different stiffness of shoes could alter the foot-floor mechanical interactions.
The findings of this study have practical implications for ballet dancers. Given that the variation in sole stiffness directly affects landing impact, particularly at the time the ball of the foot and heel contact points (Figure 7), dancers should consider shoe stiffness as it may influence not only performance but also injury risk including painful sesamoiditis of the sesamoids of the first metatarsal,15-17 hallux valgus, bunions, hallux rigidus, 18 and lower extremity injuries.19-22 Professional dancers, on average, execute over 200 jumps during a lesson, with approximately half of these jumps involving single-leg landings. 1 The compression stress fracture of sesamoiditis, common among ballet dancers, is considered to arise from the cumulative effects of repeated landings. 16 Moreover, the differences in peak vGRF at the moment of heel contact can also signify shifts in the risk factors for lower extremity injuries. Numerous studies have explored the connection between peak GRF and injuries.19-22 Increased vGRF and decreased knee angular stiffness during the landing phase in asymptomatic pre-professional dance students might indicate external factors that increase the dancers’ vulnerability to chronic overuse injuries, such as patellar tendinopathy.19,23-25 In contrast, a decrease in vGRF during double-legged drop jump landings has been linked to an increased risk of developing patellofemoral pain in military cohorts. 22 The patellofemoral pain syndrome, included in patellar tendinopathy or anterior knee pain, is one of the most prevalent overuse injuries in ballet, especially among female dancers. 26
Our study suggests that variations in sole stiffness influenced the vGRF wave pattern during single-leg drop-landings, particularly at the moments of ball-of-foot and heel contact, demonstrating that differences in shoe stiffness can alter the landing impact on the foot. While this study did not investigate new shoes or the progressive changes from new to worn shoes, the results highlight the importance of monitoring how shoe stiffness evolves with use. Understanding these changes can help dancers and instructors recognize when shoes may no longer provide sufficient support and may inform manufacturers in designing pointe shoes that retain functional stiffness for longer durations, thereby potentially reducing the risk of lower extremity injuries.
This study has certain limitations. First, the shoe sole stiffness was assessed at a single specific load point (65% of the entire length of the sole). The stiffness value may vary if a different load point were chosen. However, our selected load point is one that undergoes frequent and significant deformation during ballet movements, making it functionally relevant for assessing the impact on the vGRF profile. Additionally, among the various points that were tested, this particular load point yielded the most stable stiffness measurements. Therefore, the conclusions from these stiffness measurements are justifiable.
Second, the participants included only 11 female ballet dancers. Moreover, the number of participants was small and the three shoe models were mixed, making it impossible to compare the characteristics of each model. This is because participants with a minimum of 10 years of ballet experience were included in the study, and the numbers were not intentionally aligned. Although the number of participants was small, the experiment was conducted with skilled ballet dancers, and the stiffness of different shoe models were evaluated with the same test and with the same features. Additionally, only three models of pointe shoes were tested (Figures 5 and 6), limiting the ability to generalize the findings to a broader range of shoe designs. Future research could explore a more diverse selection of shoes to determine how different models affect the vGRF waveform.
It should be noted that the PCA and LDA analyses performed in this study allowed us to identify the time periods during which differences between soft and hard shoes emerged. However, these methods do not provide information on the magnitude of the vGRF differences between conditions. Therefore, while we can indicate when the landing impact is affected by shoe stiffness, the actual increase or decrease in vGRF cannot be inferred from these analyses.
Conclusions
This study quantified the stiffness of pointe shoes and analyzed the impact of sole stiffness on the vertical component of the GRF wave pattern during single-leg drop-landings in female ballet dancers. Sole bending tests indicated that pointe shoes with shorter usage durations generally exhibited greater stiffness compared to those with longer usage. However, some results showed that shoes with longer usage time possessed higher stiffness. Therefore, classifying the shoe stiffness based solely on usage duration is not necessarily appropriate. The PCA results revealed that variations in pointe shoe stiffness influenced the vGRF wave pattern during single-leg drop-landings, particularly around the time of ball-of-foot and heel contacts. This suggests that different sole stiffness levels can alter the landing impact on the foot at these specific moments. It should be noted that PCA and LDA identify time periods of differences rather than the actual magnitude of vGRF changes and therefore do not allow conclusions regarding whether impact is higher or lower between shoe conditions. However, these findings highlight that monitoring changes in shoe stiffness is important for dancers and instructors and may inform manufacturers in designing pointe shoes that retain functional stiffness for longer durations, potentially reducing the risk of lower extremity injuries.
Supplemental Material
sj-docx-1-dmj-10.1177_1089313X251411487 – Supplemental material for Pointe Shoe Stiffness Alters the Vertical Ground Reaction Force During Single-Leg Drop-Landing in Female Ballet Dancers
Supplemental material, sj-docx-1-dmj-10.1177_1089313X251411487 for Pointe Shoe Stiffness Alters the Vertical Ground Reaction Force During Single-Leg Drop-Landing in Female Ballet Dancers by Natsuki Yoshida, Issei Ogasawara, Kaho Umegaki, Satoshi Yamakawa and Ken Nakata in Journal of Dance Medicine & Science
Footnotes
Ethical Considerations
This study received approval from the ethics committee of the Osaka University Hospital (Approval Number: 20029).
Consent to Participate
All participants were informed about the purpose of this study, and written informed consent was obtained before the commencement of the experiments.
Funding
The authors disclosed receipt of the following financial support for the research, authorship, and/or publication of this article: This work was supported by JST SPRING, Grant Number JPMJSP2138.
Declaration of Conflicting Interests
The authors declared no potential conflicts of interest with respect to the research, authorship, and/or publication of this article.
Data Availability Statement
Data will be shared via a public repository following acceptance of this manuscript.
Supplemental Material
Supplemental material for this article is available online.