
Abstract
Do cultural values enhance financial and subjective well-being (SWB)? Taking a multidisciplinary approach, we meta-analytically reviewed the field, found it thinly covered, and focused on individualism. In counter, we collected a broad array of individual-level data, specifically an Internet sample of 8,438 adult respondents. Individual SWB was most strongly associated with cultural values that foster relationships and social capital, which typically accounted for more unique variance in life satisfaction than an individual’s salary. At a national level, we used mean-based meta-analysis to construct a comprehensive cultural and SWB database. Results show some reversals from the individual level, particularly masculinity’s facet of achievement orientation. In all, the happy nation has low power distance and low uncertainty avoidance, but is high in femininity and individualism, and these effects are interrelated but still partially independent from political and economic institutions. In short, culture matters for individual and national well-being.
The American Psychological Association ushered in the millennium with the Decade of Behavior and a call to promote “a healthier nation, a safer nation, a better educated nation, a more prosperous nation and a more democratic nation” (Azar, 2000, p. 10). A decade later, in the Academy of Management Perspectives special issue on international happiness, Blanchflower and Oswald (2011) concluded, “this multidisciplinary research field is, and will remain, one of genuine significance to human society. Almost everyone is interested in happiness” (p. 19). Indeed, variations of subjective well-being (SWB)—assessments along the lines of satisfaction, happiness, or the quality of life—are among the most frequently posed criteria in all the social sciences (Brass, Galaskiewicz, Greve, & Tsai, 2004; Ryan & Deci, 2001). Whereas satisfaction reflects more of a cognitive evaluation of one’s life, the assessment of happiness includes an affective element, drawing more on emotions though still retaining a cognitive component. Combined, satisfaction and happiness is referred to as SWB. Collectively, we as individuals assess and predict SWB for life in general as well as each of its domains, such as family and work. Our obsession is well justified.
Multiple philosophical traditions from both East and West contend that a life well led can be considered an end in itself (Judge & Kammeyer-Mueller, 2011; Oishi, Graham, Kesebir, & Galinha, 2013), and leading a good life should include attending to SWB (Diener & Lucas, 1999). For example, SWB is at the core of economics (especially welfare economics) where it is referred to as utility, a measure of relative satisfaction. Aside from its inherent worth, satisfaction also affects a host of other critical areas (Huppert, 2009). In the workplace alone, job satisfaction influences almost every outcome, including motivation, effort, organizational citizenship behavior, interpersonal relationships, group identification, commitment, and ultimately performance (Erdogan, Bauer, Truxillo, & Mansfield, 2012; Judge, Thoresen, Bono, & Patton, 2001; Mount, Ilies, & Johnson, 2006).
Despite notable progress, we still have an evolving and presently imperfect understanding of what creates SWB. We focus here on one relatively understudied area that can be applied to individuals and nations: culture. Though culture is a complex multilevel construct and dozens of definitions of culture have been offered, it generally refers to shared and relatively stable values (cf. Taras, Rowney, & Steel, 2009). Essentially, culture is to nations what personality is to individuals, though it is not limited to the national level and extends to organizational and individual levels. Stressing its potential relevance, there are several qualitative reviews on the direct, mediating, and moderating effects of culture on SWB (Diener, Oishi, & Lucas, 2003; Spector, 1997), and in a chapter reviewing national differences in SWB, Diener and Suh (2003) conclude that “culture norms appear to be promising candidates for factors that influence SWB beyond wealth” (p. 444).
To advance our understanding of SWB, we take a multilevel approach. Most models differentiate between levels of culture such as individual, group, organizational, and national; layers of culture such as artifacts, practices, and values; and dimensions of cultural values and practices such as power distance or individualism (Hofstede, 1980; House, Hanges, Javidan, Dorfman, & Gupta, 2004; Schwartz, 1994; Trompenaars, 1993). Cross-cultural psychology and management models of culture commonly, though not exclusively, focus on national cultural values (Taras et al., 2009; Taras & Steel, 2009). Although there is no definitive model of culture, the most widely used and enduring, as well as the one repeatedly applied to the topic of well-being, is Hofstede’s (1980) four-dimensional typology: individualism–collectivism, power distance, masculinity, and uncertainty avoidance. Taras et al. (2009) reviewed more than 120 instruments for measuring culture and noted that almost all of them contain one or more of Hofstede’s original cultural dimensions. A brief definition of these four cultural values follows.
Individualism–collectivism, or simply individualism, is the best studied of all cultural dimensions, referring to the degree that people are expected to pursue their own interests over those of the group (Hofstede, 2001). Power distance is the degree to which a person expects and accepts inequality in status and power (Hofstede, 2001). Those higher in power distance believe there should be sharp divides between superiors and subordinates, with power holders entitled to considerable privileges and influence. Uncertainty avoidance has two different expressions. The first is valuing order and consistency over experimentation and innovation; rules and explicit instructions are preferred (House et al., 2004). The second is the degree to which people are made nervous by situations they perceive as unstructured, unclear, or unpredictable (Hofstede, 2001). Like uncertainty avoidance, masculinity–femininity is also multifaceted, reflecting the degree to which masculine values such as assertiveness, toughness, and concern with material success are emphasized versus feminine values such as modesty, caring, harmony, and a focus on improving the quality of life. In addition to these values, House et al. (2004) contend that there is the subdimension of gender egalitarianism or differentiation, reflecting the degree that distinct gender roles are encouraged or enforced (e.g., “Meetings are usually run more effectively when they are chaired by a man”).
Though Hofstede intended his cultural typology to represent national culture, the four dimensions have been successfully applied to individuals and to subcultures (cf. Taras, Kirkman, & Steel, 2010). For example, Erez and Gati’s (2004) multilevel model of culture suggests both top down and bottom up processes allowing for unique properties at each level. Consequently, we conduct and contrast two quantitative lines of research on culture and SWB: one focused on the individual and one at the national level, using meta-analytic data as well as original research to fill in relevant holes and extend the field. At the individual and nation levels of analysis, we establish the relevancy of using cultural values to better understand SWB by also considering any redundancy to other dominant explanations, particularly wealth. We start with the individual level as our baseline, establishing the cultural dimensions assessed. At the national level, we review what findings are expected to be consistent or homologous with individual-level results, what is expected to differ, and why. We analyze how culture affects SWB overall and across different types of cultural values and different facets of SWB. In all, we establish cultural profiles of satisfied individuals and happy nations, emphasizing that these two are not necessarily the same.
Study 1: Individual Level of Analysis
Despite its origin as an individual-level employee attitude survey at IBM, the appropriateness of using Hofstede’s cultural typology at an individual level has often been questioned (Taras et al., 2009). In their review on values and personality, Parks and Guay (2009) argued how both are related and important, but deserve separate study as each affects motivation through different pathways. Later, Taras et al. (2010) meta-analytically demonstrated that cultural values could be meaningfully applied at the individual level. And as both Parks and Guay as well as Taras et al. (2010) noted, compared to personality traits, much less individual-level research has been done with values, with the majority relying on the Hofstede model and then focusing only on individualism. As Taras et al. (2010) concluded, “[individualism] did not have any meaningful predictive power differences compared to the other three values, and its overall predictive power was about average” (p. 23).
Although comparatively less than with personality traits, there is an established line of research exploring values at the individual level (e.g., Oishi, Diener, Suh, & Lucas, 1999). We begin by establishing that culture can be relevant beyond wealth for understanding SWB, focusing on the satisfaction aspect at the individual level. Afterwards, we consider the cultural dimensions of individualism, power distance, uncertainty avoidance, and masculinity in turn.
Wealth and Culture
From an economic perspective, satisfaction should be largely a function of wealth or objective economic status; as our purchasing power increases, so do our choices, which should be exercised in a way that maximizes our happiness. However, multiple meta-analytic reviews report a modest, diminishing correlation between SWB and economic status or income of 0.20 or 0.13 depending on the local economic development (Diener & Biswas-Diener, 2009; Howell & Howell, 2008), which leaves substantial room for further explanation. Individual differences have provided strong prediction of SWB, particularly personality (Steel, Schmidt, & Schultz, 2008). Given the established relationship between personality and values (Parks & Guay, 2009; Roccas, Sagiv, Schwartz, & Knafo, 2002), values should demonstrate somewhat similar findings. Several mechanisms are suggested. First suggest that simply having certain values improves SWB, such as valuing compassion over security (Sagiv & Schwartz, 2000). Second, values often drive behavior (Schwartz, 1994; Verplanken & Holland, 2002), and the outcomes of behavior inherently influence SWB. Third, aside from outcomes, there is the pursuit of value-related goals, of which values can influence how intrinsically satisfying they can be (Oishi et al., 1999). In all, we expect culture to incrementally predict SWB above and beyond wealth.
Individualism
Reflecting the priority of self over group interests, measures of individualism often assess the desire to work alone rather than with others (Maznevski, DiStefano, Gomez, Noorderhaven, & Wu, 2002). Individualism is positively associated with introversion, correlating at −.32 with extraversion (Migliore, 2011). Accordingly, we can borrow from personality research, which shows a dependable negative relationship between introversion and SWB (Steel et al., 2008). A related line of research is the “Belongingness Hypothesis,” which argues that being an accepted member of a group is a fundamental need (Baumeister & Leary, 1995) and individualism inherently creates tension with belongingness’ fulfillment. We predict,
Power Distance
Power distance’s theorized relationship with SWB is mixed. At the individual level, a close analog of power distance may be authoritarianism. Despite the negative interpersonal qualities of the trait, which is likened to a cyclist (i.e., bow up but kick down), there is a positive association between general authoritarianism and SWB (MacInnis, Busseri, Choma, & Hodson, 2013). On the other hand, power distance also parallels the social dominance construct (Ekehammar, Akrami, Gylje, & Zakrisson, 2004) as well as Schwartz’s (1994) cultural value of hierarchy. In accordance with Bilsky and Schwartz’s (1994) theory that extrinsic values are negatively related to SWB, SWB’s relationship with hierarchy was negative but nonsignificant (Haslam, Whelan, & Bastian, 2009). A meta-analysis of psychological well-being and social dominance orientation along with other conservative or right-wing attitudes found the same weakly negative but nonsignificant relationship (Onraet, Van Hiel, & Dhont, 2013). Consequently, we expect the same.
Uncertainty Avoidance
As reviewed, uncertainty avoidance has a rule orientation facet (e.g., “Company rules should not be broken”) but also an anxiety facet (e.g., “Do you feel nervous or tense at work?”). The primary mechanism relating uncertainty avoidance to happiness should be the latter, reflecting stress, anxiety, and neuroticism (Hofstede, 2001; Taras et al., 2009). Neuroticism, in particular, is the personality trait that best predicts SWB at both an individual and national level of analysis (Steel & Ones, 2002; Steel et al., 2008).
As per its close relationship with neuroticism, anxiety is often viewed as a personality facet rather than a cultural value. Consequently, many measures of uncertainty avoidance focus solely on the rule orientation aspect (e.g., Ang, Van Dyne, & Begley, 2003; Dorfman & Howell, 1988; House et al., 2004), perhaps rightly so. Desire for rules and order is essentially a moral value, related to the Kantian or deontological worldview (Timmons, 2007). Deon comes from the Greek meaning duty, and deontological theories are concerned with moral obligations, rather than consequentialist or utilitarianism theories, which are concerned with outcomes. Accordingly, believing in the primacy of rules in determining morality (e.g., “Obey the rules no matter what”) is firmly associated with right-wing attitudes (r = .72) and moderately associated with uncertainty avoidance (r = .37; Morin & Dick, 2015). Indeed, high uncertainty avoidance individuals tend to be conservative, concerned for law and order, and uncomfortable with ambiguity or diversity (cf. Jost, Glaser, Kruglanski, & Sulloway, 2003). Notably, this may help explain why those with a conservative political stance tend to have higher levels of SWB (Napier & Jost, 2008; Onraet, Van Hiel, & Cornelis, 2013), which is intensely debated (Van Hiel et al., 2015). In sum, given that conservatives, with their stronger need for order, are happier and the related trait “Need for Order” correlates positively at .14 with SWB (DeNeve & Cooper, 1998), we predict,
Masculinity
Masculinity can be examined at an overall factor level, and at more precise facets level including (a) achievement orientation (i.e., concerns with success), (b) future orientation (i.e., working hard for success), and (c) gender inegalitarianism (i.e., preference for male rather than female leaders; Taras, Steel, & Kirkman, 2012). For the overall factor, we expect feminine individuals to be happier. To begin with, masculinity is strongly connected to materialism, with some viewing the two constructs as synonymous (Best & Williams, 2001), and materialistic values (e.g., “Money and material things are important”) are problematic for well-being. Though materialistic consumption can increase happiness, the increase is typically temporary. Described as a hedonic treadmill, it creates short-term rises in happiness that quickly dissipate (i.e., hedonic adaptation). For example, Chancellor and Lyubomirsky (2014) review multiple mechanisms, including how shoppers can become addicted to the process of acquiring, moving from one rush to the next. Consequently, the long-term effects of materialism are less encouraging. In some of the seminal work in the consumer behavior area, Belk (1985) found that the relationship between materialism and the level of self-reported happiness is negative, with higher levels of materialism leading to lower levels of happiness. This finding has been replicated in numerous samples across a range of nations (e.g., Dittmar, Bond, Hurst, & Kasser, 2014).
At the facet level, the relationship between masculinity and well-being becomes more mixed and potentially controversial. On one hand, traditional sex role attitudes or gender inegalitarianism has a dependably negative association with SWB (Wong, Ho, Wang, & Miller, 2017). On the other, future orientation has an unambiguously positive relationship with SWB, being associated with impulse control and lack of self-regulatory failure (Steel & Weinhardt, 2017).
Achievement orientation’s relationship to SWB, however, is less certain. From a psychological perspective, achievement orientation is argued to have a positive relationship with SWB as it facilitates “achievement of tasks” (DeNeve & Cooper, 1998, p. 199). Although the meta-analytic relationship is positive (r = .15), it is based on just 590 mostly student respondents dispersed among nine studies, with some results showing a negative relationship (for similar student-based results, see Sagiv & Schwartz, 2000; Sheldon & Schüler, 2011). Using a general population sample, Baumann, Kaschel, and Kuhl (2005) found a stronger negative relationship between achievement orientation and SWB (r = −.19). Also, Tamir et al. (2016) found across eight separate world cultures that the more people identified with self-enhancement values of power and achievement, the more they sought the emotional states of anger and contempt. Graham (2011) and Becchetti and Rossetti (2009) argued from an economic perspective that although achievement orientation can increase salary, it can be detrimental to SWB as it creates rising expectations also referred to as the “happy peasant and frustrated achiever” problem. Becchetti, Trovato, and Londono Bedoya (2011) noted that with wealth comes coordination problems regarding relationships, where those who are actively pursuing success find it harder to arrange time to socialize effectively. Similarly, Pouwels, Siegers, and Vlasblom (2008) noted that although income has a positive benefit on SWB, this can be offset somewhat by the hours required to earn it. Diener, Ng, and Tov (2008) also found evidence against the utility of an extreme work focus, using the economist concept of declining marginal utility to argue for a balance among a mixture of activities (e.g., home, leisure, work). In short, people who choose time over money tend to be happier (Hershfield, Mogilner, & Barnea, 2016). Given the stronger theoretical support from economics and the possibility of weaker results from student samples, we propose the following:
A Framework of Individual Culture and Wealth
Summarizing the bivariate relationships previously explicated, we present Figure 1. Consistent with Diener and Suh’s (2003) contention that culture may predict SWB beyond wealth, all cultural dimensions are depicted with direct pathways to SWB, though masculinity also has an indirect pathway through wealth. We consider uncertainty avoidance at its more precise facet level: anxiety and rule orientation. The rule orientation is depicted in gray as though it was hypothesized to be positive; our later results did not support this conclusion.
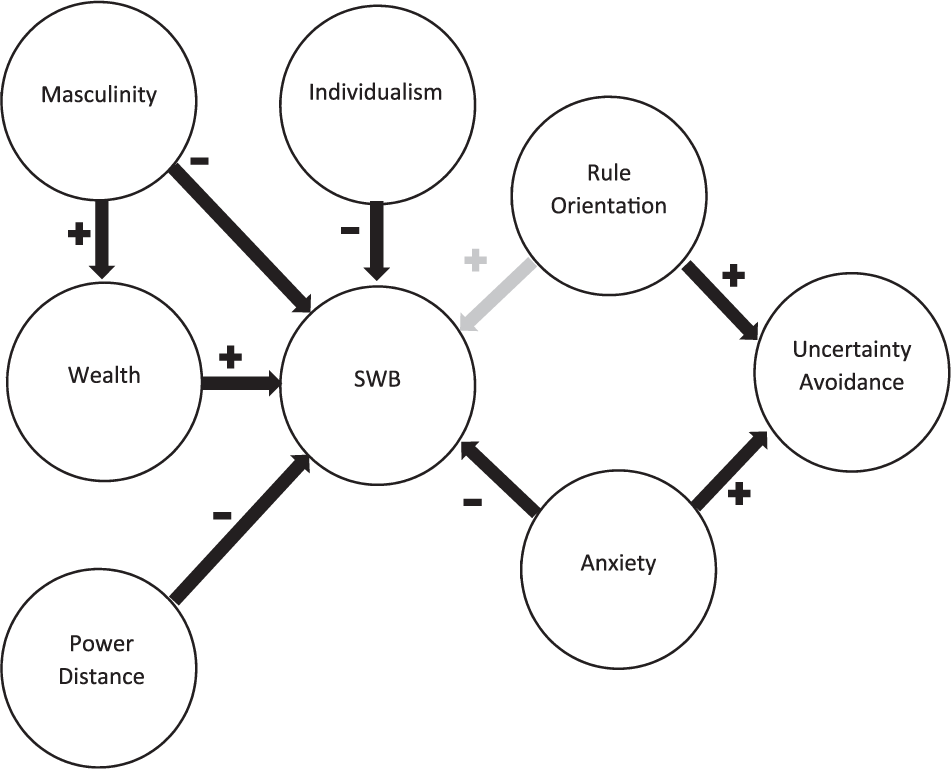
Hypothesized relationships at the individual level among the cultural dimensions, including the uncertainty avoidance facets of rule orientation and anxiety, with wealth and SWB.
Individual-Level Method
Meta-Analytic Literature Search
The literature search is part of a still ongoing meta-analytic research program beginning in 2006 and involved several contributors. In 2006, we initially started with a review of 28 relevant journals for publications containing data suitable for the meta-analysis that appeared after the publication of Hofstede’s “Culture’s Consequences” in 1980 and then proceeded with a search of academic paper depositories, including Google Scholar, EBSCO, PsycINFO, ERIC, ProQuest, and ProQuest Digital Dissertations electronic databases. Third, the reference sections of each article being coded were reviewed for links to publications potentially containing data for the meta-analysis (i.e., an ancestry approach). Fourth, using the “cited by” function of the Web of Science and Google Scholar databases, publications citing articles coded for our meta-analysis were identified and those containing relevant data were included in our data set (i.e., a descendancy approach). Finally, as a part of a larger meta-analytic project, we sent out a call via the Academy of International Business and Academy of Management list servers for studies that utilized Hofstede’s (1980) or similar frameworks to assess effects of culture in various areas, including communication from which we received more than two dozen responses. At present, our meta-analytic database has grown to 604 studies containing codable data on the cultural values of study participants. Of those, 48 contained data on the relationship between culture and SWB, which were included in the present study.
Inclusion criteria
A common challenge in meta-analysis is that the summarized studies rarely utilize identical research design and methodology (Rosenthal & DiMatteo, 2001). Scale length modification (e.g., 1 to 5 modified to 1 to 7), change in the sequence of the survey items, and other minor differences are not likely to lead to a substantial alteration of the construct. However, if the studies are substantively different, aggregation becomes questionable, leading to the so-called “apples and oranges” problem (Sharpe, 1997).
To deal with the issue of commensurability, we relied on content validation where multiple coders determined if instruments were similar by conducting a thorough item analysis. This established meta-analytic methodology has been successfully utilized in earlier meta-analyses (Steel et al., 2008; Steel & Taras, 2010; Taras, Kirkman, & Steel, 2010). To minimize inconsistencies, we attempted to be as conservative as possible when making our inclusion decisions. That is, when in doubt we excluded a measure, opting for omission over errors of commission.
Only studies that defined and operationalized cultural values consistently with the model and methods used by Hofstede (1980) qualified for inclusion. The choice was straightforward for the studies that used various versions of Hofstede’s original Values Survey Module (VSM). Studies that used other instruments to quantify cultural values required a thorough item evaluation and content analysis of individual survey instruments as dimension names are not a reliable indicator of measure consistency (Taras et al., 2010). Upon closer inspection, not all studies that used Hofstede’s terminology qualified for inclusion. For example, inspection of items included in Wagner and Moch’s (1986) individualism–collectivism measure revealed that the instrument was designed to measure attitudes to teamwork, which is related but not identical to the same type of individualism as defined by Hofstede (1980, 2001). Therefore, studies using this instrument for operationalizing culture were excluded from our pool. On the other hand, we found a few instruments that used terminology different from that introduced by Hofstede but evaluated largely overlapping constructs. For example, a review of the items in the measure of independent and interdependent self-construal developed by Singelis (1994) revealed that they were closely related to Hofstede’s definition of the construct of individualism–collectivism (e.g., “Being able to take care of myself is a primary concern for me”; “I will sacrifice my self-interest for the benefit of the group I am in”), and thus included in our meta-analytic sample.
The issue of commensurability was particularly salient for the individualism–collectivism dimension as the terms have been used broadly and inconsistently (Oyserman, Coon, & Kemmelmeier, 2002). Additional controversy surrounding the construct arises from some post-Hofstede research suggesting that individualism and collectivism may not represent the extremes of a single continuous dimension, but are two independent bipolar dimensions (e.g., Gaines et al., 1997; Markus & Kitayama, 1994). We utilized the unidimensional approach used in earlier meta-analyses of Hofstede’s framework (Steel & Taras, 2010; Taras et al., 2010). First, Hofstede’s (1980) original model is based upon individualism–collectivism as a single bipolar dimension. Hofstede’s original instrument provided a single individualism score derived by combining responses to two survey items representing individualistic tendencies and two items representing collectivistic tendencies. Second, 79.2% of the studies in our meta-analytic sample that included separate individualism–collectivism measures reported correlations between satisfaction and individualism that had the opposite sign to the correlations between collectivism and the same facets of satisfaction. That not only strengthens the argument that empirically individualism is the opposite of collectivism, but also shows that it would be redundant to report the results for the effects of individualism and collectivism separately, being mirror images. Therefore, we converted separate scores for individualism and collectivism to a single composite index by taking an average of the sum of the individualism score and the reversed collectivism score.
For SWB, commensurability was less of an issue. We parsed SWB into three domains: life, family, and work. Though happiness and satisfaction are at times considered different dimensions of well-being, with the former having a more emotional slant, they are often treated as equivalent at both an individual and national level (Steel & Ones, 2002; Steel et al., 2008). At an individual level, overall well-being was measured exclusively with the Satisfaction With Life Scale (Diener, Emmons, Larsen, & Griffin, 1985; five items, e.g., “In most ways my life is close to my ideals” or “I am satisfied with my life.”). For simplicity, we refer to combinations of happiness and life satisfaction as just life satisfaction. Marriage or family satisfaction was measured with The Marriage Opinion Survey (Verma, 1989; six items, e.g., “How satisfied are you with your marriage?”) and the Satisfaction With Family and Friends Scale (Benet-Martinez & Karakitapoglu-Aygun, 2003; two items, e.g., “All things considered, how satisfied are you with your family life?). For job or work satisfaction and its facets (e.g., supervisor satisfaction), a wider variety of choices were employed by researchers, with emphasis on The Job Diagnostic Survey (Hackman & Oldham, 1975; 15 items, e.g., “Generally speaking, I am very satisfied with my job.”), The Job Descriptive Index (P. C. Smith, Kendall, & Hulin, 1969; 72 items, e.g., “I am happy with my job.”), and The Job in General Scale (Ironson, Smith, Brannick, Gibson, & Paul, 1989; 42 items, “My job makes me content.”).
Hofstede’s Value Survey Module (VSM) was used to measure cultural values in most of the studies included in the present meta-analysis. However, as previously discussed, studies that relied on instruments commensurable with Hofstede’s approach of defining and measuring the four cultural values were also included in our meta-analysis. Most instruments used four to six items per cultural dimension. Sample items for individualism–collectivism are “How important would it be to you to work with people who cooperate well with one another?”; for power distance, “How important would it be to you to be consulted by your direct superior in his/her decisions?”; for masculinity, “How important would it be to you to have an opportunity for advancement to higher level jobs?”; and for uncertainty avoidance, “How often in your experience, do you feel nervous or tense at work?”
Variables and data coding procedures
Although long–short-term orientation (also known as Confucian dynamism) was later added to the original four Hofstede dimensions (Hofstede & Bond, 1988), this dimension has been less popular in cross-cultural research and not enough data has been generated for meta-analysis. The studies that qualified for inclusion in our meta-analytic sample explored the relationship that the remaining four cultural values had with each other or with a dimension of satisfaction or well-being. The final list identified five facets of satisfaction: satisfaction with work, supervisor, coworkers, family, and overall life satisfaction. Several data points describing the relationship between culture and satisfaction with performance, negotiation process and outcome, and organization strategy and image were coded, but these categories were represented by a single data point each.
In most cases, the relationship between culture and satisfaction variables was reported as a Pearson’s product-moment correlation coefficient. When publications used other measures of association, such as difference d-scores or F-statistics, we converted them to correlation coefficients (Hunter & Schmidt, 2004). In addition to the main effect variables, we also recorded sample sizes and reported reliabilities of the instruments. All papers were coded at least twice, with the majority of the studies independently coded three times. Inconsistencies were resolved by collectively reexamining the source article, at times contacting the authors of the original publications for clarification, until interrater agreement reached 100%.
Statistical Methods
Our strategy was to test our hypotheses through meta-analytic structural equation modeling (MA-SEM), which requires a full correlation matrix, and consequently our focus was on calculating the needed mean effect sizes. In any case, effective explorations of heterogeneity, such as credibility intervals, ideally are based on at least 25 separate effect sizes per relationship (Steel, Kammeyer-Mueller, & Paterson, 2015), a threshold only sporadically exceeded here. We calculated meta-analytic average effect sizes using sample size weighting, as per Hunter and Schmidt (2004). These calculations were conducted with Version 14.0 of the MetaExcel software program (Steel, 2014).
X-Culture Survey Data
As is typical for any review, and as these meta-analytic results have confirmed, there are notable holes in the literature regarding culture and happiness or well-being. When attempting to fill out an entire correlation matrix meta-analytically (i.e., for MA-SEM), there are often specific correlations where there is little or no data. For example, as will be shown, most of the research has been done with job satisfaction and individualism, with little or no attention for most other SWB–cultural combinations. This is unwarranted. As Taras et al. (2010) concluded, “There is no viable reason to believe that individualism is the best predictor of organizational behavior and other outcomes” (p. 432). This is also problematic for conducting meta-analytic regression, which requires a complete matrix.
To address this, we conducted a mega-trial, a term from the medical field used to describe a study that is similar in size and breadth to a meta-analysis on the topic (Gröpel & Steel, 2008). Data collection for the mega-trial was nested within a large epidemiological study to determine the demographic characteristics of procrastinators (Steel & Ferrari, 2013) and how workplace characteristics influence its expression (Nguyen, Steel, & Ferrari, 2013), which should be referred to for further details of administration. As per Nguyen et al., results appeared valid and representative, consistent with similar web-based survey methodology (Gosling, Vazire, Srivastava, & John, 2004).
Sample
Given that student respondents, despite their convenience, are potentially less representative of the broad population and provide weaker results (Steel & Taras, 2010), our sample comprised of all respondents who reported more than 2 years of job experience or who identified themselves as other than students. This generated 8,438 respondents. Rounded to the nearest whole number, average length of employment was slightly under 7 years, 41% were male and 59% female, 98% had finished high school, and 50% had a college degree or higher. Average age was 39; 45% were single, 45% were married, and the remainder were divorced, separated, or widowed. As per Nguyen et al. (2013), jobs ranged from academic dean to yoga instructor. For job status, 5% were unemployed, 10% were presently students (i.e., those with more than 2 years of job experience), 15% were working part-time, 65% were working full-time, and the remaining 5% were retired. If unemployed or students at the time, individuals were instructed to think about their most recent job when responding.
Measures
To further explore SWB, we expanded the dimensions assessed. On the SWB side, we include family satisfaction, overall job satisfaction, and its facets of pay, communication, coworker, and supervisor. On the cultural side, we assessed several facets of the broader cultural dimensions obtained from the X-Culture project, a longitudinal research program assessing cultural values and team performance across 40 countries (Taras et al., 2013). All measures were collected on a 5-point Likert-type measure ranging from “strongly disagree” to “strongly agree,” and scale reliabilities are reported along the diagonal in Table 1. Salary was measured by asking individuals to self-report their personal annual income into one of 10 categories ranging from “$10,000” to “$200,000 plus,” comparable to the nine categories of household income used by the U.S. census. Responses were assigned the median value within the respective category’s range (e.g., $55,000 for the “$50,000 to $60,000” category). Notably, because of the common use of salary’s logarithmic transformation in the economic field, which favors testing multiplicative rather than additive relationships, we compared Salary with Log Salary, finding both effectively equivalent, producing correlations usually within .01 of one another. The ratio of salary’s standard deviation to its mean, a coefficient of variation sometimes used as an indicator of economic inequality, though large, approximately reflects current conditions (van Treeck & Sturn, 2012).
Individual-Level Correlation Matrix Among Cultural Values, Indices of SWB, and Salary Based Upon Both the X-Culture’ Survey Data and Meta-Analytic Averages.
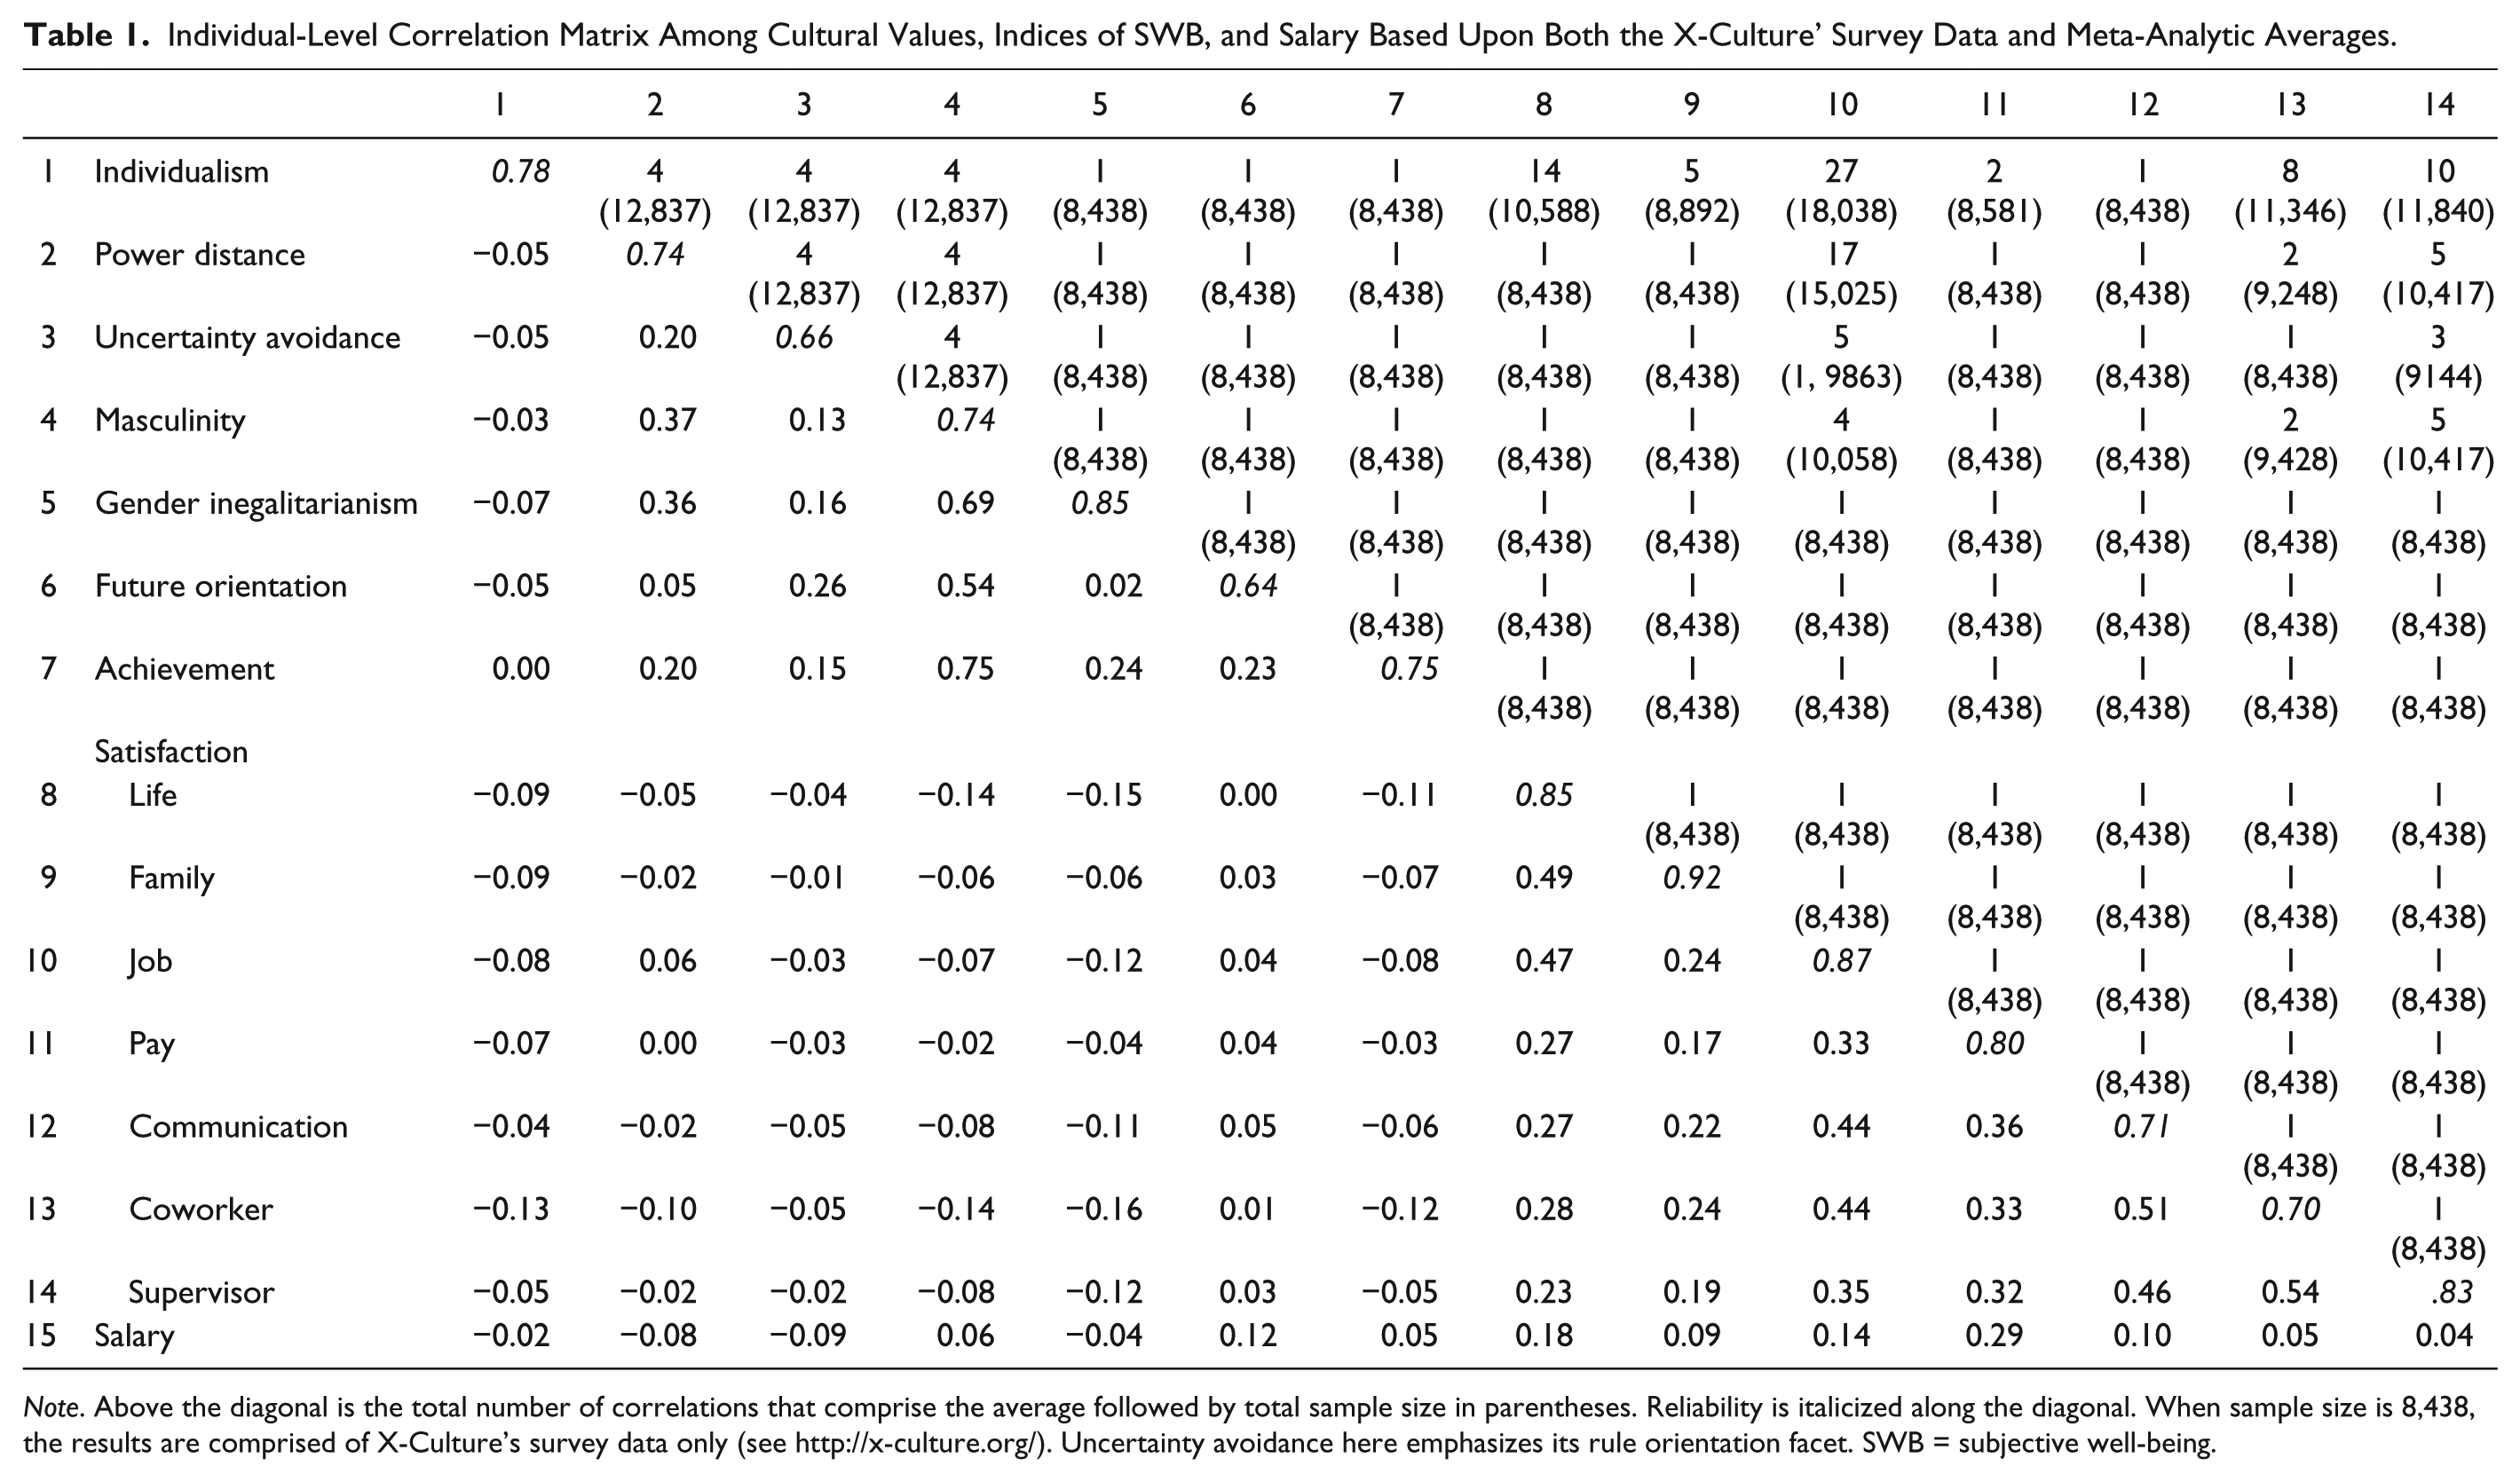
Note. Above the diagonal is the total number of correlations that comprise the average followed by total sample size in parentheses. Reliability is italicized along the diagonal. When sample size is 8,438, the results are comprised of X-Culture’s survey data only (see http://x-culture.org/). Uncertainty avoidance here emphasizes its rule orientation facet. SWB = subjective well-being.
Cultural measures
The X-Culture project uses two individualism–collectivism scales. The first is adapted from Wu’s (2006) measure, focusing on group versus self-interest. One example item is “Group success is more important than individual success.” The other measure is Maznevski et al.’s (2002) Collectivism scale, which focuses on the preference to work with others rather than by oneself. A sample item includes “I enjoy working with others more than working alone.” To create an overall score, the two measures were summated and reverse-scored to be consistent in direction with individualism. Power distance was adapted from Wu (2006). A sample item is “Managers should make most decisions without consulting subordinates.” The rule orientation facet of uncertainty avoidance was measured via an adaptation of Dorfman and Howell’s (1988) and Wu’s (2006) scale. Similar to the GLOBE project’s definition (House et al., 2004), which focuses on preference for clear rules and instructions, a sample item includes “Employees perform better when they follow rules and instructions.”
Masculinity, being a focal point in this study with expected differential effects, was measured at its component level of achievement orientation, future orientation, and gender inegalitarianism, and overall. We measured achievement orientation with four items from the competitiveness scale of Spence and Helmreich’s (1983) Achievement Motivation Scale. A sample item is “Success is the most important thing in life.” Future orientation is consistent with the GLOBE project’s use of the term (House et al., 2004), assessing the importance of future goals over today’s pleasures. An example item is “People should work hard for success in the future.” Gender inegalitarianism was assessed via an adaptation of Dorfman and Howell’s (1988) and Wu’s (2006) measures. A sample item is “It is preferable to have a man in a high level position rather than a woman.” The overall measure of masculinity was constructed by aggregating these three subscales.
Reliability for the cultural value scales are comparable or better than those seen in the original scales. For example, individualism had a reliability of .63 for Dorfman and Howell (1988) and about .66 for Wu (2006), compared with .76 here.
SWB measures
Operationalization at the individual level focused on satisfaction measures. Life satisfaction was assessed by Diener et al.’s (1985) Satisfaction With Life scale. A sample item is “I am satisfied with life.” We measured family satisfaction with Olson’s (2000) Family Assessment Package, supplemented with the commonly used item “All things considered, I’m satisfied with my family life” (e.g., Blanchflower & Oswald, 2005). Our general Job Satisfaction Scale was adapted from Brayfield and Rothe’s (1951) six-item scale. A sample item is “I like my job better than the average person.” All workplace satisfaction facet measures (i.e., pay, communication, supervisor, and coworker satisfaction) were measured by Spector’s (1985) job satisfaction survey instrument.
metaBUS Data
As mentioned, consistent with many measures of uncertainty avoidance, the X-Culture’s scales focus on the rule orientation component rather than the anxiety facet. Consequently, to test anxiety’s relationship with SWB, we draw upon one additional source: metaBUS (Bosco, Steel, Oswald, Uggerslev, & Field, 2015). The metaBUS project is an ongoing effort to archive correlational findings across psychology into a searchable and interactive web-based meta-analytic platform (see www.metaBUS.org). At the time of this authoring, the database contained 778,528 correlational effect sizes from 9,024 articles in 23 applied psychology journals from 1980 to 2015. As per Steel et al. (2008), who found no significant differences between trait and state measures of affect in their SWB meta-analysis, we treated anxiety correlations based on both trait and state equally. The metaBUS database is analyzed using the R Statistics package metafor rma.mv function (version 1.9-8; Viechtbauer, 2010), which addresses sample dependence issues by using multilevel meta-analytic estimates with the nesting factor as sample. Further details on the database construction, taxonomy, and procedures are given in Bosco, Aguinis, Singh, Field, and Pierce (2015). Using the metaBUS data set enabled us to generate a complete meta-analytic matrix. The source articles used are available from the authors upon request and are accessible directly from the metaBUS open scientific platform.
As a validity check, we reviewed whether estimates are indeed in line with available related research. The correlations between life satisfaction and job satisfaction as well as its facets are all approximate meta-analytically derived averages (Bowling, Eschleman, & Wang, 2010), though notably this study increases the field’s sample size considerably (e.g., the previous total meta-analytic sample size for the life and pay satisfaction relationship was 1,578 respondents). Notably, where there was data, we also used metaBUS as another validity check of the intercorrelations among the SWB dimensions and salary. On average, the overlapping matrices from Tables 1 and 3 closely approximate each other, with an average difference of .07 between correlations and an absolute average difference of .09.
Individual-Level Results
Aside from our new survey data, 48 prior studies provided measures of the relationships between cultural values and satisfaction for this meta-analysis. At the individual level, the data set was represented by 112 meta-analytic effect size coefficients, representing a total of 21,028 individuals. On average, the respondents were 30.2 years of age with 14.7 years of education; 60.0% of the respondents were male and 29.1% of them were students. An additional three studies provided the intercorrelations among cultural dimensions (N = 4,399).
Although meta-analytic means tend to stabilize very quickly (Murphy, 2017), meta-analytic variance estimates are unstable with a small number of studies. Taking a Bayesian approach, Steel et al. (2015) found that a “low level of information contained in meta-analytic variance estimates based on a small number of studies” (p. 734) makes them potentially misleading in that they have a much higher probability of giving errant estimates of homogeneity as well as having little power to detect moderator effects. In any case, given our statistical strategy is MA-SEM, we focus on averages, which we provide in Table 1. Correlations are reported below the diagonal, reliabilities along the diagonal, with the number of studies and total sample size (in parentheses) per estimate reported above.
As can be seen, almost all of the data concentrates in individualism and then primarily in job satisfaction. The matrix is “lumpy” in distribution, reflecting that this is largely an underexplored area. Given the lack of and poor distribution of previous studies as well as the size and external validity of our survey data, we draw upon the X-Culture responses for analyses unless otherwise specified.
Wealth and Culture
To explore whether cultural values incrementally predict SWB above salary (Hypothesis 1), we conducted a series of two-stage hierarchical regressions using the X-Culture survey data, which included salary information. For each SWB dimension, we allowed salary to predict first, followed by cultural values. Results are displayed in Table 2. The first column of results demonstrates the relationship between cultural values and salary. Salary, being on a ratio scale and having a meaningful zero value, has both standardized and unstandardized regression weights reported. To compare the relative impact of salary versus cultural values, the final two rows of Table 2 show their respective contribution. Hypothesis 1 is supported for six out of seven SWB indices, with the exception of pay satisfaction where the incremental R2 is less than 1%.
Individual-Level Regression Analyses of Cultural Values on Salary and Indices of SWB Based on X-Culture’s Survey Data (N = 7,707).
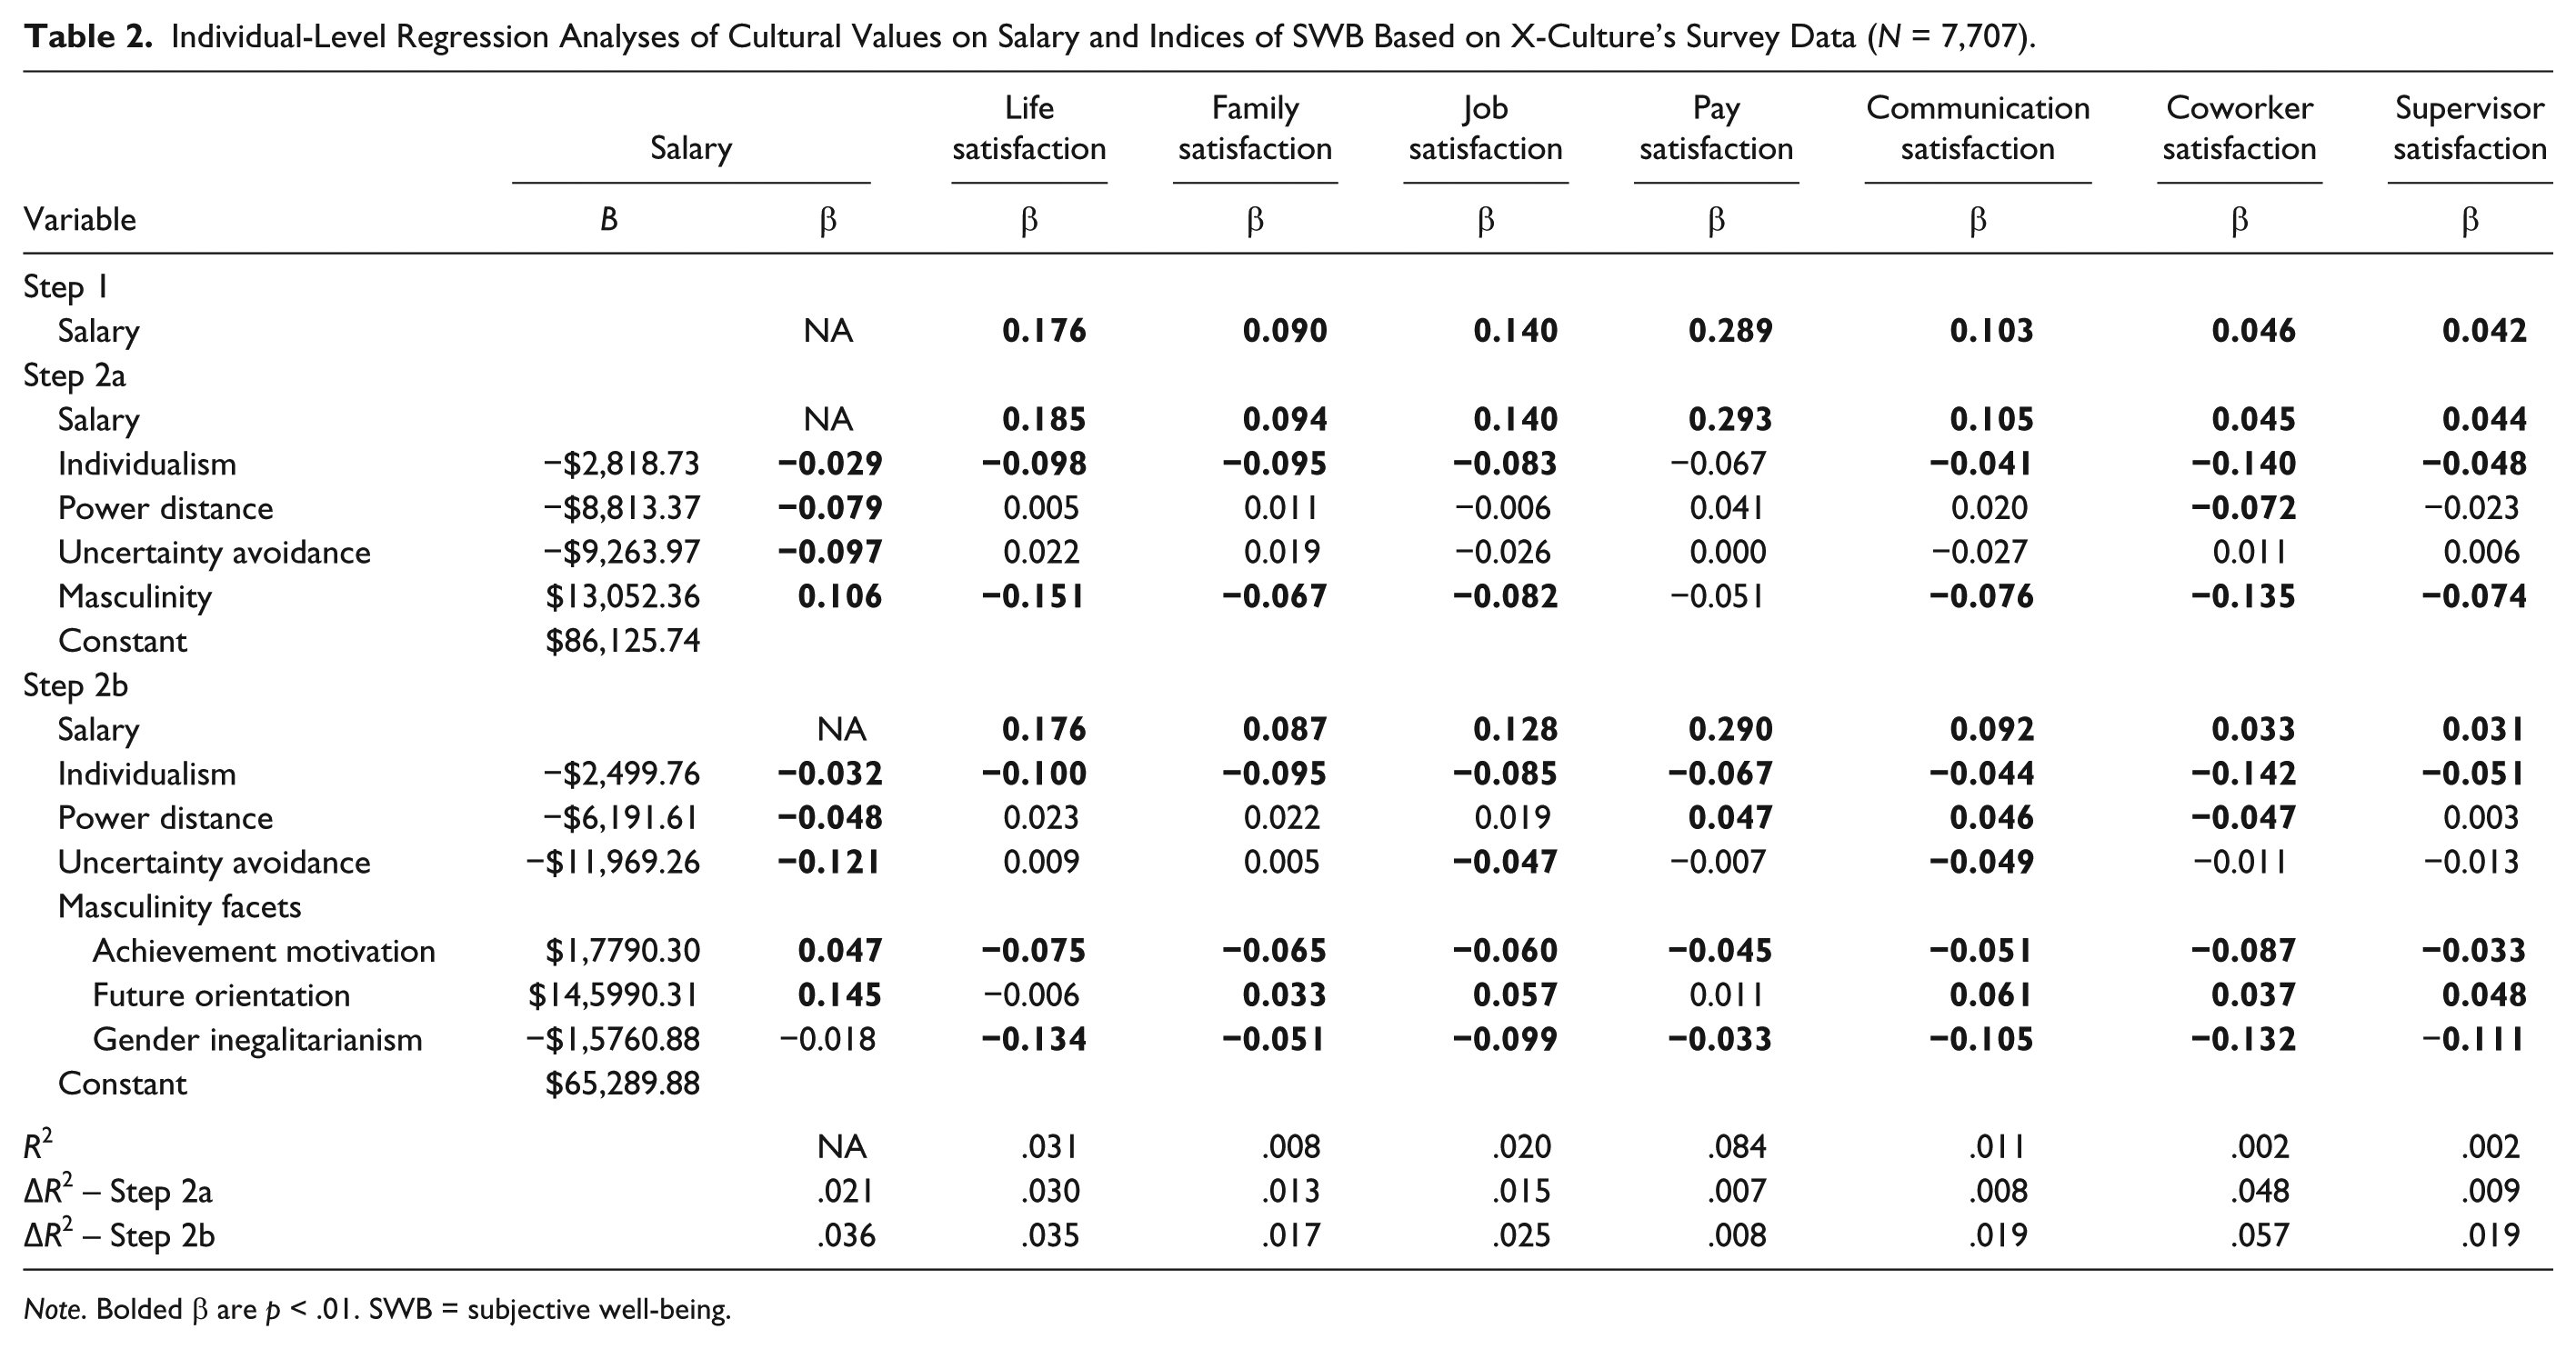
Note. Bolded β are p < .01. SWB = subjective well-being.
Individualism
Individualism was negatively correlated with all aspects of SWB (see Table 1). As one might expect given its introverted aspects, the most negative correlation was with coworker satisfaction (r = −.13). Also, as per Table 2, individualism has a negative relationship with wealth. Notably, even after controlling for wealth, individualism negatively predicts life, family, and job satisfaction. Values associated with individualism and autonomy do not appear to be beneficial in terms of wealth or well-being at the individual level. Hypothesis 2 is supported.
Power Distance
As predicted in Hypothesis 3, power distance indeed has a weak negative relationship to satisfaction, with the exception of job satisfaction. This may reflect person–job fit (Kristof-Brown, Zimmerman, & Johnson, 2005). Because the workplace tends to be hierarchical and situationally strong (Staw & Cohen-Charash, 2005), those accepting high power distance could be demonstrating superior fit in this context. As per Tables 1 and 2, though negatively related to wealth, it predicts SWB above it. Like individualism, power distance does not appear to be beneficial in terms of wealth or well-being at the individual level.
Uncertainty Avoidance
The relationship between uncertainty avoidance and SWB is largely unexplored, with the meta-analytic record relegated to two relationships: job satisfaction and supervisor satisfaction. To address Hypothesis 4, which predicted a negative relationship between anxiety and SWB, we use the metaBUS database. As per Table 3, correlations between the anxiety facet and dimensions of SWB are uniformly negative and, on average, −.18 stronger than the rule orientation dimension, in keeping with predictions. On the other hand, Hypothesis 4 postulated that those who are highly rule oriented should also tend to be happier. Though the anxiety facet was indeed more negatively related to SWB than rule orientation, rule orientation was still uniformly negative, with an average correlation of −.03 across all SWB indices in Table 1. Though rule orientation dilutes anxiety’s negative association with SWB, reducing uncertainty avoidance’s overall association, it does not counteract it. Hypothesis 4 is rejected.
metaBUS Individual-Level Correlation Matrix Among Anxiety, Dimensions of Subjective Well-Being, and Salary.
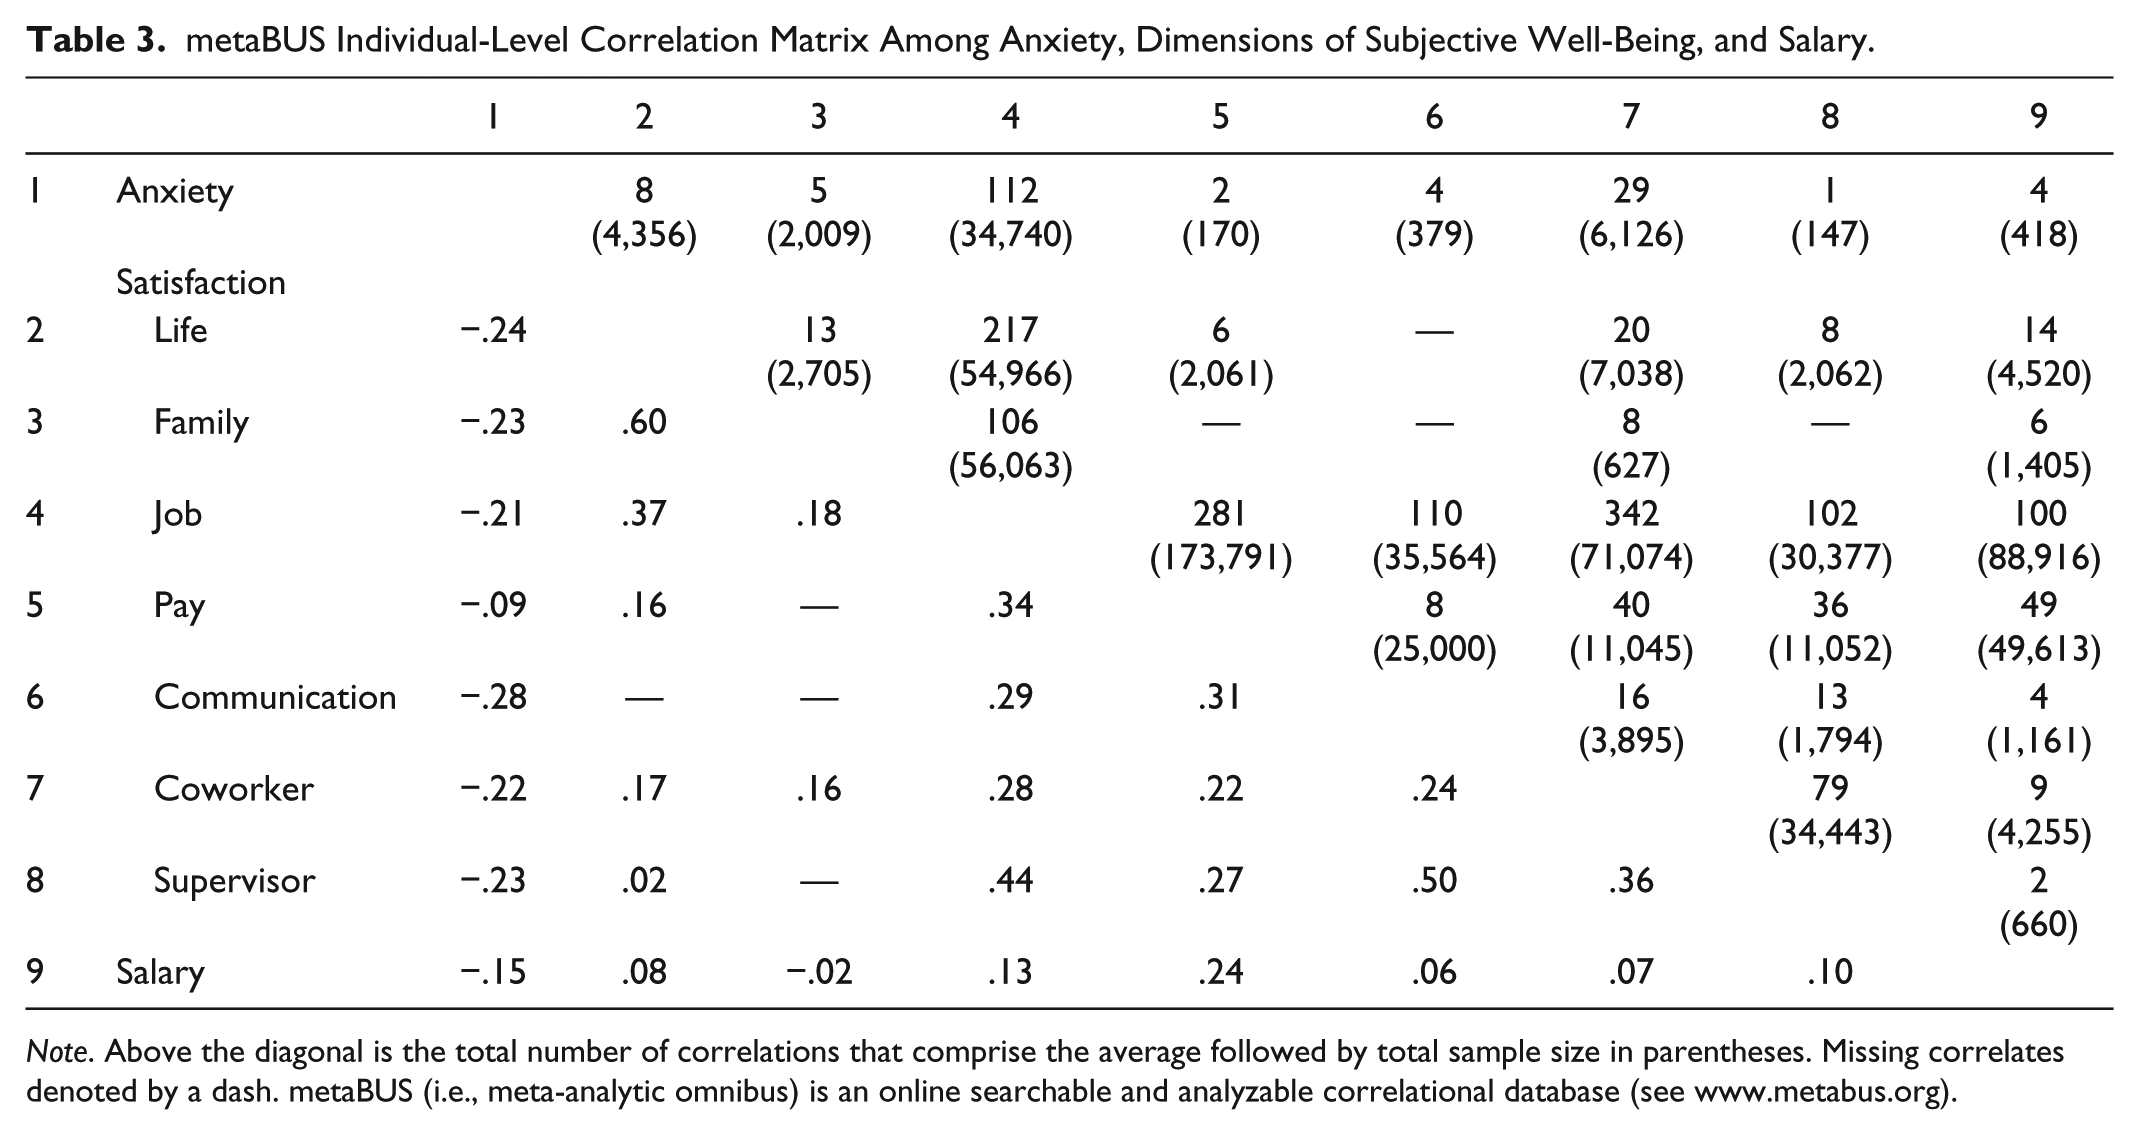
Note. Above the diagonal is the total number of correlations that comprise the average followed by total sample size in parentheses. Missing correlates denoted by a dash. metaBUS (i.e., meta-analytic omnibus) is an online searchable and analyzable correlational database (see www.metabus.org).
Masculinity
To examine Hypothesis 5, which predicted that masculinity, including its achievement orientation facet, would be negatively related to satisfaction, Tables 1 and 2 reveal that masculinity is positively connected to salary, which in turn predicts satisfaction across the board. Despite this positive association with salary, masculinity is negatively related to all forms of satisfaction with the exception of pay. Finding support for Hypothesis 5, we followed this up by focusing on masculinity’s facet of achievement orientation. As per Table 2, achievement was either not associated or negatively associated with satisfaction, which includes pay satisfaction itself. That is, though the facet is associated with higher salary, it is also associated with greater dissatisfaction with that salary.
Given this finding, we conducted an additional analysis. As Van der Meer and Wielers (2013) describe it, “Hours of work or effort is regarded as disutility that needs to be compensated to seduce workers to come to work” (p. 359). Part-time workers should be about as happy as full-time workers, assuming their work status is voluntary, due to their added leisure opportunities. As shown in Table 4, this is approximately correct. Although some disutility can be expected for those seeking full-time work but unable to find it, the SWB differences between full-time and part-time workers can be characterized as extremely small, except for pay satisfaction.
Mean Scores Among Job Status and SWB Indices Based on X-Culture’s Survey Data.
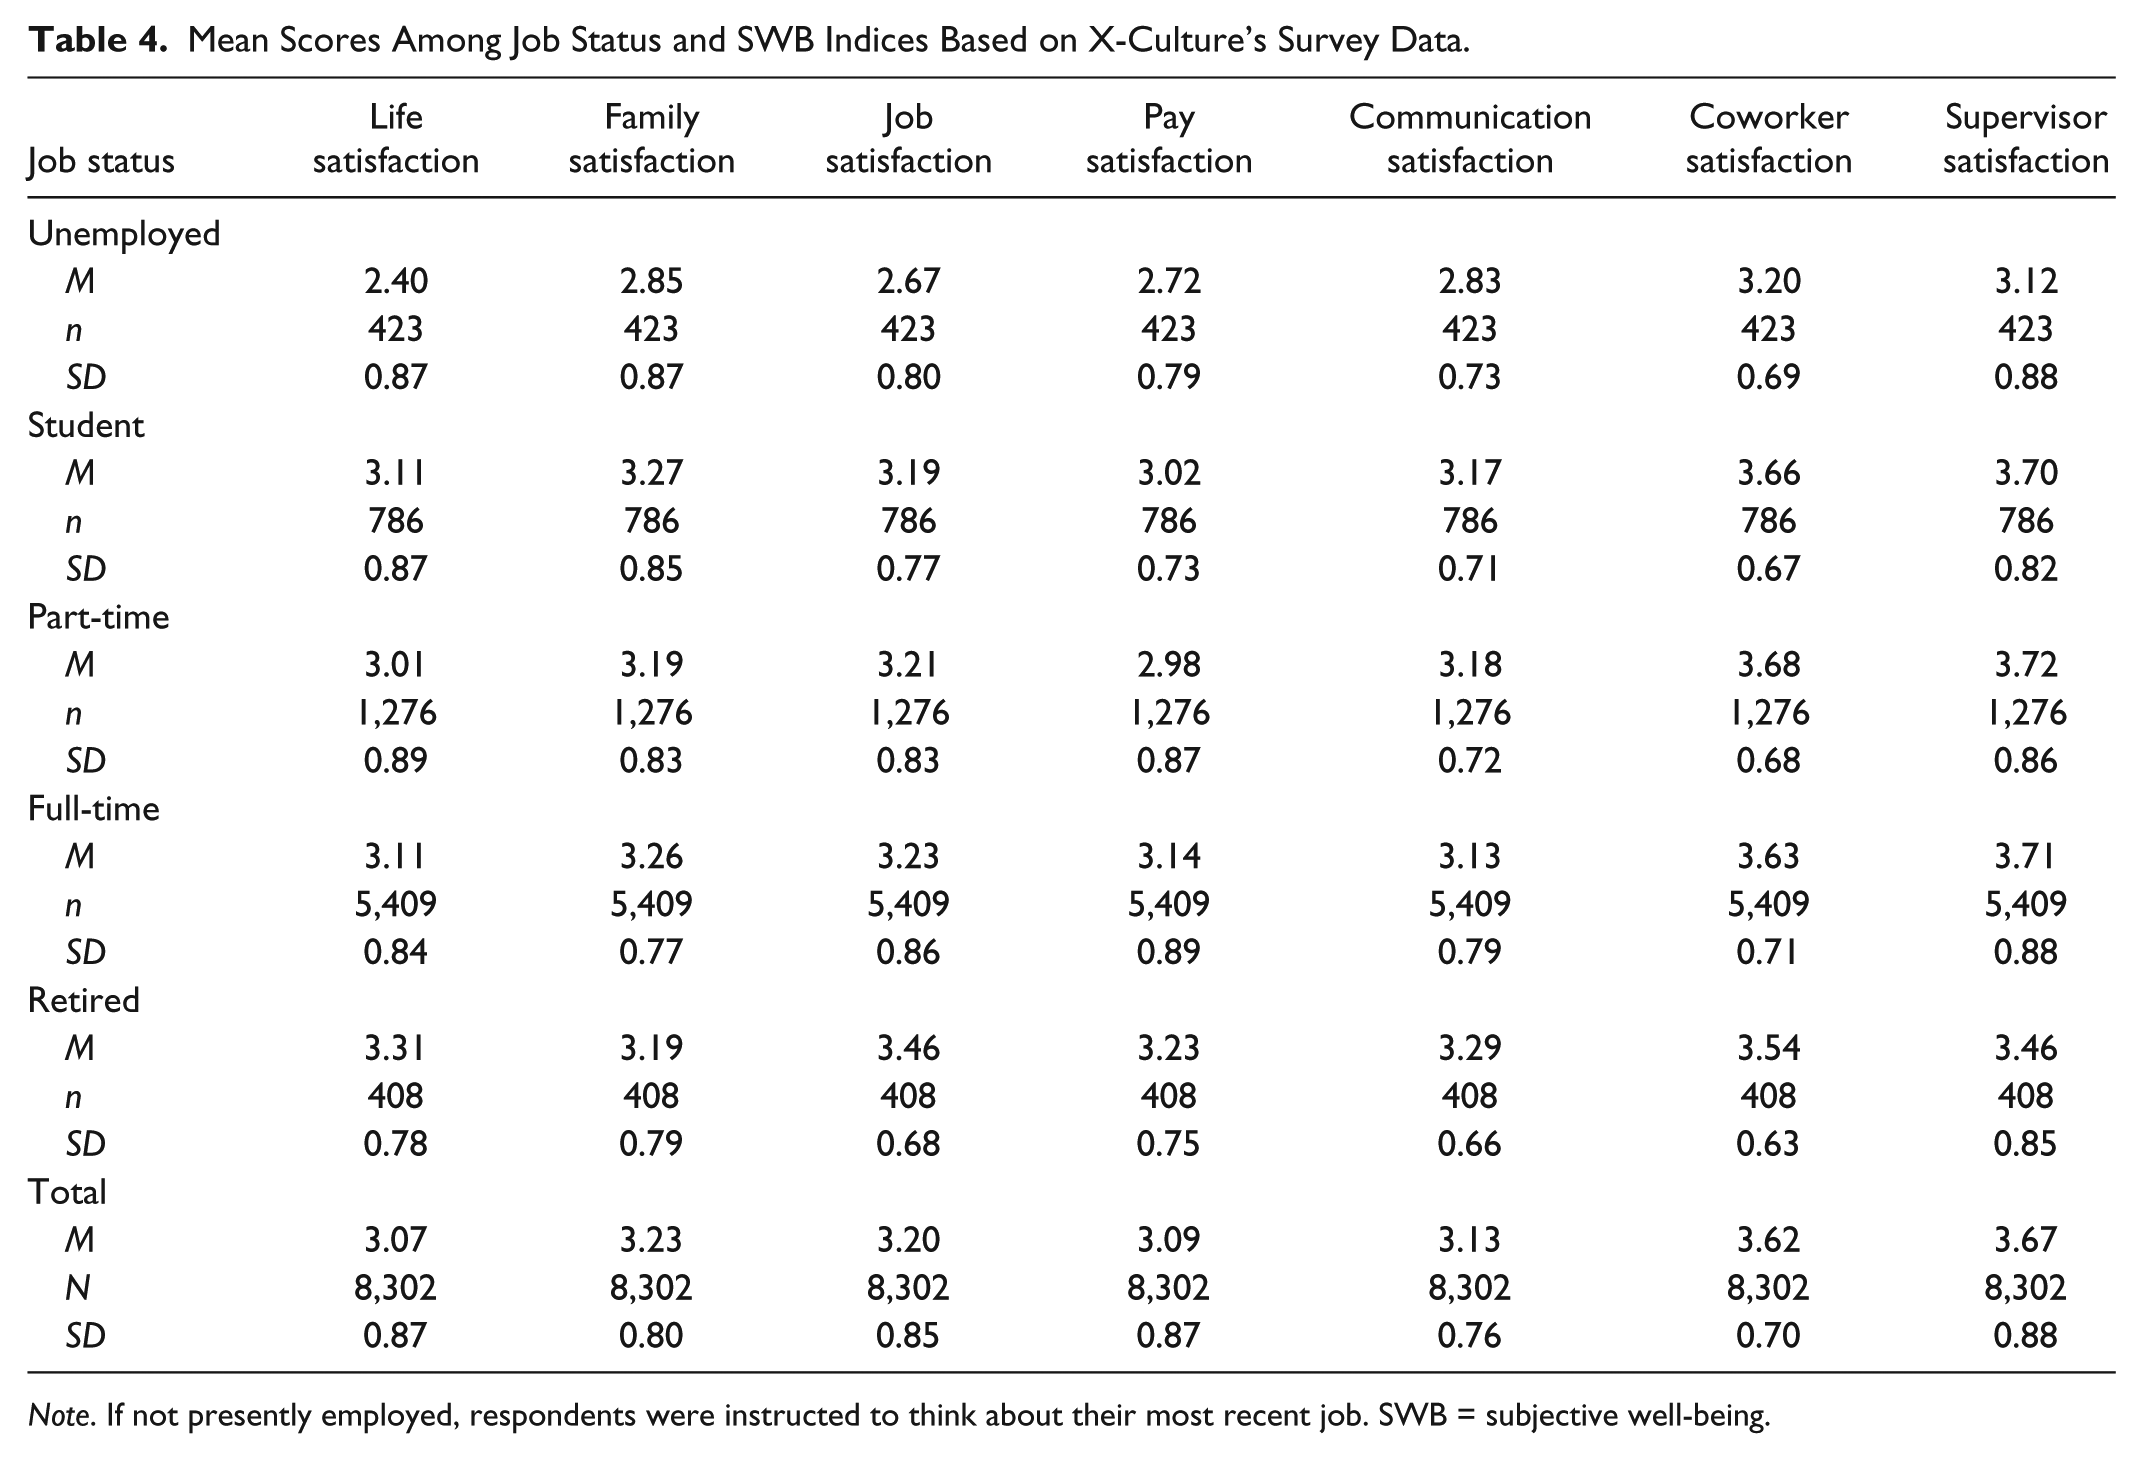
Note. If not presently employed, respondents were instructed to think about their most recent job. SWB = subjective well-being.
Individual-Level Discussion
In terms of explaining variance in individuals’ SWB, researchers have extensively studied a variety of individual-difference factors (Pavot & Diener, 2011; Steel et al., 2008) and environmental factors (Argyle, 2003; Kesebir & Diener, 2008), with wealth being of particular interest. However, as the meta-analytic record confirms, the study of cultural values and satisfaction at the individual level is relatively unexplored, at least with Hofstede’s dimensions.
Though culture is related to wealth, Diener and Suh (2003) asked if culture predicts SWB above it. Salary dependably predicts SWB, especially and unsurprisingly pay satisfaction. The size of these relationships are in line with Howell and Howell’s (2008) and Diener and Biswas-Diener’s (2009) meta-analyses, which together reported an average correlation between SWB and economic status of approximately .17 (compared with the .18 reported here), or Judge, Piccolo, Podsakoff, Shaw, and Rich’s (2010) meta-analysis, which reported an average correlation of .14 between pay and job satisfaction (compared with the .13 found here). However, if the relationship between salary and SWB is of interest, then by influence alone, culture is even more interesting, with it accounting for more variance everywhere but pay satisfaction. In general, cultural values that are associated with socialness or enhanced interpersonal relationships incrementally predicted above salary. Among the stronger findings, lower individualism is associated with a happier life and especially more coworker satisfaction, consistent with recent investigations into social capital (Helliwell, Huang, & Wang, 2014; Lange, 2015).
Consistent with feminine values leading to warm, interpersonal relationships, masculinity’s achievement orientation facet, despite being associated with more pay, is associated with less satisfaction across the board, including less pay satisfaction. In all, achievement orientation’s relationship with salary and satisfaction supports the “happy peasant and frustrated achiever” perspective. Efforts to increase income, such as hours worked, can deprive one of other SWB-enhancing experiences, such as relationship building. As we found, although being unemployed is substantively detrimental to well-being compared with being employed (cf. Helliwell & Huang, 2014), these differences almost disappear when reaching part-time employment.
Future Research Directions
Though we addressed several issues here, we still have an emerging understanding of how values relate to outcomes. Though not the focus of our study, masculinity’s facet of gender inegalitarianism was among the best predictors of reduced satisfaction, supporting its further study (Wong et al., 2017). Similarly, masculinity’s future orientation facet (i.e., preparing for tomorrow today) deserves fresh attention. More than achievement orientation, the future orientation facet appears to explain most of masculinity’s connection to wealth. In fact, future orientation appears to be among the best trait predictors we have of salary so far. A one standard deviation decrease in future orientation was associated with a decrease in salary of approximately $9,000, placing it between agreeableness (Judge, Livingston, & Hurst, 2012) and procrastination (Nguyen et al., 2013), which respectively decrease salary by approximately $7,300 and $10,700 for each standard deviation increase.
Also, we hypothesized that the rule orientation facet would help counteract the anxiety aspect of uncertainty avoidance, helping to explain why those who identify themselves as conservative (which tend to be higher on uncertainty avoidance) still tend to be happier overall. Although rule orientation’s weak correlation with SWB dilutes anxiety’s stronger association, both are negative and our hypothesis here was not supported. Looking elsewhere for enlightenment, Napier and Jost (2008) argue conservatives are happier partly because “inequality takes a greater psychological toll on liberals than on conservatives, apparently because liberals lack ideological rationalizations that would help them frame inequality in a positive (or at least neutral) light” (p. 571). Does this explanation suffice? To more thoroughly investigate this and other alternatives, we need to examine a more complete palette of cultural values, such as the 26 popular facets of culture reported by Taras et al. (2009). If all these values could be closely examined, a more definitive understanding should emerge. For example, two values may be associated and often seen together but have opposing effects. Last, there is the direction of causality issue, which correlational research cannot definitively resolve. Though values are somewhat more malleable than personality traits (Parks & Guay, 2009), both are largely stable individual differences, meaning that the causal process should go from values to behaviors to outcomes, such as life satisfaction (Schwartz, 1994; Verplanken & Holland, 2002). Still, this does not preclude more complicated reciprocal relationships, where a happy life is more conducive to developing specific values or where happiness is a cause of wealth itself (e.g., Zelenski, Murphy, & Jenkins, 2008).
Study 2: National Level
Concern for the well-being of individuals has naturally expanded into concern for the well-being of groups, particularly nations. Though there is a long and contentious history of using subjective social indicators to inform public policy (Allin & Hand, 2014; Noll, 2013), Diener’s (2000) formal proposal of a national well-being index was particularly well received, with several measures of Gross National Happiness (GNH) proposed or now in existence (Delhey & Kroll, 2013; Oishi & Schimmack, 2010; Tideman, 2011). GNH attempts to address measurement deficits in the Gross Domestic Product (GDP), an economic indicator of material wealth that assesses the buying and selling of products and services. For example, Frey (2008) reviews that increases in illness, disasters, and pollution (“regrettables”) can perversely increase GDP, as we purchase services to address these setbacks. On the other hand, leisure time, maintaining a household, or community volunteerism does not increase GDP as money does not change hands. GDP as an indicator of societal success also assumes that we are uniformly rational in our decision-making. This position belies a well-established body of self-regulatory limitations and cognitive biases, including procrastination, where we irrationally put actions off despite expecting to be worse off (Steel & Weinhardt, 2017). The impact of procrastination alone ranges from the financial, where we put off saving for retirement or dealing with debt, to the medical, where we put off adopting healthier lifestyle changes or investigating the initial symptoms of escalating conditions.
Despite the limitations of GDP, consideration of the GNH was once controversial as neo-classical economists contend that directly measuring happiness (i.e., cardinal utility) is not just difficult, which it can be, but impossible and/or unnecessary. However, as Frey and Stutzer (2002) conclude, advances in measurement and validation has “helped to make the new idea of measuring utility palatable” (p. 21). Consequently, economic factions have arisen that are receptive to GNH, including behavioral economics and real-world or “post-autistic” economics, in that they describe the neo-classical “mind-blindness” position here as “autistic” (Fullbrook, 2007). Its present level of acceptance is such that it is being used to inform legal policy (Huang, 2010) and several prominent economists are editors of the “World Happiness Report” (Helliwell, Layard, & Sachs, 2013), which reviews and advocates for direct measure of well-being as part of the “dashboard” that gauges societal health and informs public policy. Similarly, Diener (2013) reports, “In 2013, the Organization of Economic Cooperation, which provides guidance to countries on the collection of national statistics, provided nations with guidelines for national accounts of SWB” (p. 665). Based on this acceptance and emerging national databases, the extensive research into well-being conducted at an individual level is now being replicated at a national level, where both environmental and group characteristics are being explored (e.g., Diener, Diener, & Diener, 1995; Diener & Seligman, 2009; Steel & Ones, 2002).
Although a number of earlier studies have explored the relationship between culture and satisfaction (e.g., Diener & Diener, 1995; Judge, Parker, Colbert, Heller, & Ilies, 2001; T. W. H. Ng, Sorensen, & Yim, 2009), the results have often been inconsistent and, at times, conflicting. In this national-level systematic review, similar to our individual-level analysis, we reexamined the issue of culture and well-being not only by summarizing the meta-analytic data but with new data as well, that is three novel databases, one for culture and two for SWB. This multivariate data set enables us to establish the combined relationship among cultural dimensions and allows us considerable freedom to revisit previous hypotheses, including whether culture’s relationship with SWB varies among life domains. As the national data sets are segmented by decade, we can also determine whether the results sustain over several time periods. As Taras et al. (2012) concluded, “The criterion validity of Hofstede’s scores tends to deteriorate over time” (p. 337). Data from earlier decades does not necessarily reflect a country’s cultural values from subsequent decades, with indices temporally matched tending to have higher correlations than those mismatched.
We replicate and extend the individual-level analyses conducted with wealth, SWB, and culture. As before, we start by confirming the relevance of culture though this time at the national level, where it is argued to be epiphenomenal not only to wealth but also to political institutions. We end by considering the degree of homology or isomorphism between individual and national levels of analysis.
Culture, Wealth, and Governance
Governance is a broad concept regarding how power is used for a country’s development and includes concepts of “control of corruption, rule of law, government effectiveness, rule quality, political stability, and voice and accountability” (Langbein & Knack, 2010, p. 350). Acemoglu and Robinson (2012), arguing from their own respective disciplines, contend that governance effectiveness and national prosperity is exclusively due to political and economic institutions acting reciprocally, creating either a virtuous or vicious circle. Essentially, they are espousing Political Process Theory, where “Political and economic structures of society are viewed as determining, while culture is treated as separate from structure and secondary in importance” (Armstrong & Bernstein, 2008, p. 75). Certainly, some skepticism of culture is warranted; Hofstede (2001) himself wrote regarding “hard variables,” specifically mentioning GDP per capita, if they can “predict a country variable better, cultural indexes are redundant” (p. 68). On the other hand, the explanatory power of GDP itself can be questioned. For example, the Easterlin Paradox refers to the debated relationship between national economic wealth or growth and happiness, with arguments ranging from absent, short-term, or indirect (Easterlin, 2013) to positive but with diminishing returns (Stevenson & Wolfers, 2008).
As reviewed by Kara and Peterson (2012), Functional Theory and Neo-Institutional Theory indicate that culture and institutions are intimately and also reciprocally linked, representing a pathway through which each are influenced as well as formed by each other (e.g., Inglehart & Welzel, 2010; Voigt & Park, 2008). Often studied under the term of “informal institutions,” others have shown that culture is important to the development of a wide variety of national-level financial systems (Dutta & Mukherjee, 2012; Zheng, El Ghoul, Guedhami, & Kwok, 2012), with Zhao, Shen, and Collier (2014) showing that national culture has a direct impact on the adoption of e-government practices (i.e., use of information technology in service delivery). Consequently, Licht, Goldschmidt, and Schwartz (2007) in their own study of culture and governance argue, somewhat presciently, that many institutional reforms will fail or be extremely slow to take root in countries that lack a complementary cultural base, with culture this time creating “vicious circles of underdevelopment” (p. 682). Consistent with Diener and Suh’s (2003) position, we maintain that though economic and political institutes are tightly linked to culture, culture should be modeled separately and has the potential for unique influence.
Individualism, Wealth, and SWB
Despite the weak, negative connection at the individual level, individualism is expected to be strong and positive at the national level. To begin with, the relationship between individualism and extraversion appears to reverse at the national level. Although preference for solitary work indicated introversion at the individual level, at the national level individualism has a strong, positive relationship (r = .64) with extraversion (Hofstede & McCrae, 2004). The relationship between national extraversion and SWB is dependably positive (Steel & Ones, 2002).
Furthermore, Steel and Taras (2010) make the case that national-level individualism is largely caused by national wealth and Hofstede (2001) describes the connection between individualism and wealth as “really remarkable” (p. 251), noting that wealth increases freedom by allowing people to “do their own thing” (p. 253). Recent research also shows that as developing countries such as India and China become wealthier and freer, they also experience a shift toward individualist values (Shah, 2009). Given the tight connection between individualism, wealth, and freedom, we would expect individualistic countries to be happier because richer and freer countries are happier (Diener et al., 1995). As Diener and Diener (1995) review, there are a variety of pathways by which wealth can increase happiness, primarily through what goods and services we can purchase. Wealth allows us to pursue options that better satisfy our needs and desires. Again, the economic critique would be that individualism is simply an epiphenomenon, an outcome of wealth that fails to independently account for any increase in happiness. This is plausible, but as Diener and Diener note, “National income substantially predicts individual SWB beyond the effects of individual income, again suggesting that additional variables such as human rights and equality might increase positive experience in wealthier nations” (p. 132). One of these “additional variables,” Diener and Diener suggest, is individualism.
There have been several attempts to disentangle the relationships that individualism, wealth, and freedom have with happiness. At a national level, Inglehart, Foa, Peterson, and Welzel (2008) report “a growing sense of free choice from 1981 to 2007 seems to be the core reason why SWB has risen” (p. 274). Minkov (2009) found that “the main predictor of the cognitive facet (life satisfaction) is a perception of life control, followed by wealth” (p. 152). Similarly, Fischer and Boer (2011) reported that “increasing wealth in a society may influence wellbeing but primarily through allowing citizens to experience greater autonomy and freedom in their daily life” (p. 177). Notably, they also found that individualism was a better predictor of well-being than wealth, largely because it better enables increased autonomy.
Aside from direct effects, Inglehart and Welzel (2005) suggest that individualism has both mediating and moderating properties with wealth (i.e., mediates between wealth and political change). Fischer and Boer (2011) tested several models using national indices of negative SWB (e.g., burnout, anxiety), finding most support for the moderating effect, that individualism expresses itself interactively with wealth. That is, happiness is improved by having both the financial means and the social license to make use of the choices it enables. In short, though wealth may theoretically provide you with more options, without individualistic values, your social obligations can prevent you from freely pursuing them.
Power Distance, Wealth, and Governance
High power distance is not a desirable quality. Power distance is related to the Gini (Taras et al., 2012), an economic measure of inequality developed by the Italian sociologist Corrado Gini. The correlates or indirect effects that economic inequality can have on happiness are numerous (Oishi & Kesebir, 2015; Wilkinson & Pickett, 2009), but particularly relevant is its deleterious relationship to societal levels of mental and physical health (Ryan & Deci, 2001). Just as power distance is at an individual level, economic inequality is associated with less national wealth, not more (e.g., Benabou, 1996; Burtless & Jencks, 2003). Though there are many possible reasons for wealth concentration (Keister, 2014), this can include economic “rent seeking,” where privilege protects and perpetuates itself by preventing effective competition that is “almost always at the expense of the middle and lower classes” (Phillips, 2003, p. 476). Consequently, extremes of inequality are associated with impaired health, education, social relations, and politics (Neckerman & Torche, 2007). Although related, power distance is a broader construct than economic equality. It includes equality of opportunity and equality before the law (i.e., “rule of law” instead of “rule by law”). To the extent that it covers equal access to services that improve the worth of human capital, notably education (Thurow, 1999), lower power distance should lead to greater wealth.
Oishi, Kesebir, and Diener (2011) highlight two mechanisms through which power distance can lower SWB. First, inequality promotes feelings of injustice or envy, studied under the term social comparisons (cf. Festinger, 1954). For example, Easterlin (2001) thought that social comparisons may eventually make wealth effects on happiness a zero-sum situation, where we end up back in the same place “because both income and aspirations rise, with roughly offsetting effects on well-being” (p. 473). A complete negation is likely an overstatement, but “the ‘preference shift’ through higher individual income is found to ‘destroy’ 60–80 percent of the expected welfare effect of an increase in income” (Frey, 2008, p. 40) and “it is clear that they [concerns with position] are also the source of a great deal of misery in the world” (Frank, 1999, p. 121). Those high in power distance should receive less hedonic benefit from their wealth. Second, inequality can erode trust and belongingness, key components of a satisfied life (e.g., Baumeister & Leary, 1995). Empirically, Steel and Ones (2002) reviewed the strong negative relationship between trust and national happiness, noting that distrust is related to defensiveness or suspicion of others. As Putnam (2000) stressed in his seminal book Bowling Alone, distrust erodes social capital and feelings of community.
In addition, power distance is argued to be causally related to governance. Per Inglehart and Welzel’s (2010) human development sequence, the emergence of self-expression values (e.g., defiance to authority) leads to the rise of democratic institutions. In this case, desire for equality should lead to activism and protest which in turn has the potential for political reform (Cohen & Valencia, 2008; Polletta, 2008; Taylor, Kimport, Van Dyke, & Andersen, 2009). For example, Acemoglu and Robinson (2012) discuss how political change is assisted by political protest, such as Prime Minister Earl Grey’s step toward universal suffrage during Britain’s 1831 election. On the other hand, nations more accepting of hierarchy are less likely to question authority, and the subsequent reduced transparency leads to more opportunity for favoritism and corruption (Husted, 1999). Consistent with this, high power distance is strongly associated with the lack of political freedom (Taras et al., 2012). We predict,
Uncertainty Avoidance, SWB, and Governance
Uncertainty avoidance has the clearest connection to SWB of all the cultural dimensions, with Hofstede (2001) describing low well-being as one of the defining characteristics of high uncertainty avoidance cultures. Related to the personality trait neuroticism (Hofstede & McCrae, 2004), Steel and Ones (2002) reviewed why the relationship should be stronger at a national level, highlighting emotional contagion (where bad moods are infectious). For similar analyses using U.S. states, see Rentfrow, Mellander, and Florida (2009).
In addition, countries higher in uncertainty avoidance tend to be more politically corrupt, with both Terror Management Theory and System Justification Theory suggesting a reciprocal relationship (Greenberg, Solomon, & Pyszczynski, 1997; Steel & Taras, 2010; Van den Bos, 2009). Jost, Kay, and Thorisdottir (2009) explored system justification theory to explain why the underprivileged and the oppressed not only tolerate underlying political and social systems, but “defend and justify disparities of income and other resources as fair, legitimate, necessary and inevitable” (p. 8). They reasoned that those higher in uncertainty avoidance tend to look for clarity and rules, taking comfort in the certainty of the status quo. As Rehnquist (2000) concluded, they trade liberty for security, though perhaps end up with neither.
Janoff-Bulman (2009) as well as Storm and Wilson (2009) discussed how this response is meant to be adaptive. Liberal and conservative value systems are both responses filling separate socioecological niches. A liberal focus is approach based, focusing on social justice, maximizing a group’s welfare (especially the well-being of others). A conservative focus is avoidance based, focusing on protecting the group from threats, maintaining order, and heightened uncertainty avoidance. From this perspective, the observed strong association between threats and right-wing attitudes would partly be a consequence of uncertainty avoidance, a value system arising from the assessment of a dangerous world. In situations of threat, emphasis on authoritarianism, unquestioned loyalty, and hierarchy may be adaptive, explaining why there is an emphasis of these values, for example, within the military culture (Soeters, Winslow, & Weibull, 2003). This connection between perceived peril and values has been repeatedly observed elsewhere, with Greenberg et al. (1997) concluding in their review of terror management theory that “cultural worldviews ameliorate anxiety by imbuing the universe with order and meaning” (p. 65). Subsequent examples include exposing people to threats or having them ruminate over their mortality increases conservative attitudes (Norris & Inglehart, 2004; Shaffer & Hastings, 2007); those more susceptible to fear tend to be more conservative (Oxley et al., 2008); and the 9/11 terrorist attacks contributed to subsequently shifting American politics toward authoritarianism and conservative values (Hetherington & Suhay, 2011; Huddy & Feldman, 2011).
However, because this relationship can be reciprocal, the causal arrow can reverse as it can be desirable for governments to foster uncertainty avoidance. Fear can make a populace more politically manageable, with special emphasis on the “War on Terror” (Manwell, 2010; Mythen & Walklate, 2006). In H. L. Mencken’s (1949) words, “The whole aim of practical politics is to keep the populace alarmed (and hence clamorous to be led to safety) by menacing it with an endless series of hobgoblins, all of them imaginary” (p. 29). In short, those higher in uncertainty avoidance will tolerate less democratic and more authoritarian political systems and authoritarian political systems consequently benefit from fostering uncertainty avoidance. Accordingly, we predict,
Masculinity, Wealth, and SWB
Masculinity is expected to have direct and indirect effects with SWB. At a national level, masculinity tends to be associated with neuroticism (r = .57) and negatively with agreeableness (r = −.36; Hofstede & McCrae, 2004). Consequently, feminine societies tend to be concerned with establishing and nurturing warm personal relationships, caring for others, and explicitly increasing quality of life. Repeatedly, social capital in terms of group membership, social trust, volunteering, or altruistic leanings are strongly associated with national SWB (Calvo, Zheng, Kumar, Olgiati, & Berkman, 2012; Oishi & Schimmack, 2010; Tov & Diener, 2008), with the strength of the relationship growing over time (Bartolini & Sarracino, 2011). And, even after controlling for GDP per capita and religiosity, masculinity is associated with lower levels of social capital (Kaasa, 2015).
Furthermore, efforts to create rewarding relationships and supportive communities (i.e., social capital) increase the well-being of individuals as well as the group. As Steel and Ones (2002) reviewed, “Group-level affect results from the combination of the group’s affective composition plus the affective context in which the group is behaving” (p. 769). Consequently, being concerned with the quality of life of others is by definition a positive externality, likely manifesting itself at a societal level with a comprehensive social safety net (Arrindell et al., 1996), which in turn is associated with higher levels of SWB (Easterlin, 2013). In this way, countries with an increasingly progressive taxation system tend to be happier because, as Oishi, Schimmack, and Diener (2012) found, their citizens “were more satisfied with public and common goods, such as the quality of education and the availability of health care” (p. 89).
Indirectly, masculinity might have a relationship with SWB through wealth. Considered one of the founding texts in economic sociology, Weber (1904/2001) posited that economic growth was due to the Protestant work ethic, which is conceptually close to masculinity. Specifically, he argues that some countries use child-rearing practices that promote independence, delay of gratification, and competence—qualities that help create citizens with strong achievement orientation. In turn, such high achievers are more likely to become successful entrepreneurs who create new businesses that expand the economy. The most influential proponent of this position is D. C. McClelland (1961), where in his book The Achieving Society he found a correlation of .53 between achievement orientation and subsequent economic growth in his sample of 22 countries. Following in these footsteps, Ferguson (2011) colorfully argues that the prosperity of the West was due to six “downloadable” largely cultural “apps,” such as work ethic, competition, and consumerism/materialism.
On the other hand, historical analysis of Weber’s thesis is widely unsupported, with any connection often attributed to literacy rather than work ethic, and Cantoni (2015), along with his own analysis, noting “innumerable rebuttals” (p. 565). The same can be said for D. C. McClelland (1961). Generally speaking, McClelland’s methodology was so unusual that many explicitly suspected that his choices were made post hoc to create his desired findings (e.g., Lewis, 1991; Schatz, 1965). For example, he used electrical output growth rather than GDP growth as his criterion, a single change among several others that would reduce his findings to nonsignificance. Later attempts at replication are also dismissive (Gilleard, 1989; Lewis, 1991; Mazur & Rosa, 1977), including a particularly comprehensive attempt by Beugelsdijk and Smeets (2008). Similarly, Mishra’s (2011) review of Ferguson’s (2011) book on this topic and its Weberism leanings ranges between skeptical and scathing in tone. On balance, this is potentially a good example of the social dilemma, where values good for the individual is mistakenly generalized to being good for the nation (discussed in detail in the following section “Cultural Isomorphism”).
Similarly in dispute is the relationship that masculinity has with governance. That is, though the technical quality of government colludes with national happiness (Helliwell & Huang, 2008; Ott, 2010), government spending as a percentage of GDP eventually collides, resulting in a negative relationship (Bjørnskov, Dreher, & Fischer, 2007; Knoll & Pitlik, 2014; Oishi et al., 2011). In the short run, Okulicz-Kozaryn, Holmes, and Avery (2014) review Livability Theory, where government expenditures on improving living conditions are observed to increase SWB. In the long run, Davidson, Pacek, and Radcliff (2013) argue this could change. Although finding that efforts to create a “socialistic” economy, as reflected by increased labor market regulation and the decommodification of the work force, was associated with a happier population, they review how extremely feminine cultures are hypothesized to eventually create an overtaxed and less happy welfare society. Indeed, as Hofstede (2001) notes, countries that emphasize protecting the weak and maintaining equality (i.e., low masculinity and power distance) are more likely to limit economic freedom, possibly adversely impact long-term growth, and may introduce excessive regulation that itself reduces SWB (Gehring, 2013). As illustration, consider the Canadian province of Quebec, which has extensive social services and concomitantly high levels of life satisfaction, both substantively higher than the rest of Canada (Barrington-Leigh, 2013). It also has the highest level of per capita debt and highest debt service costs (Speer, 2014), despite already receiving federal transfer or equalization payments approaching 10 billion dollars annually, which calls to question the long-term sustainability of this path (Dubuc, 2014).
Because of this, masculinity’s relationship with SWB may be complex and perhaps moderated by wealth. Arrindell (1998) found that masculinity correlated positively with well-being for poor countries but negatively for rich countries. As he describes it, richer countries can more easily maintain the costs of social services and their advantages to well-being. Balancing services with economic productivity thus becomes a focus. A masculine, production-focused society can generate or protect wealth but when wealthy it is less likely to make investments that increase quality of life (e.g., public parks). On the other hand, a feminine, welfare-focused society can make expenditures that nominally increase collective well-being but also overwhelm its capacity, where entitlements lead to austerity.
Cultural Isomorphism
There is considerable confusion in the cultural field regarding the relationship between individual-level and group or national-level results. The fear of committing either the ecological fallacy or the reverse ecological fallacy, otherwise known as the atomistic or individualistic fallacy, “has almost precluded any attempts at ecological inference, that is bridging levels of analysis in cross-cultural studies” (Steel & Taras, 2010, p. 214). The ecological fallacies, reverse and otherwise, occur only when findings are specific to the level of analysis, which happens sporadically but not consistently. Because relationships among aggregate data tend to be higher than the relationships among corresponding individual data elements (Klein & Kozlowski, 2000), the direction of these relationships is often homologous (Steel & Ones, 2002). Furthermore, as Jargowsky (2004) noted, “Aggregate data may be better than individual data for testing hypotheses, even if those hypotheses are about individual behaviour” (p. 721). Can we expect the same here?
Several chapters of van de Vijver, van Hemert, and Poortinga’s (2008) book Multilevel Analysis of Individuals and Cultures address the issue of homology or isomorphism across levels, with the consensus being that homology is context dependent. Certainly, cultural findings are capable of both, either staying consistent or shifting, as the focus goes from the individual to the nation. On one hand, Veenhoven (2009) concluded that individual and societal values regarding well-being tend to be in harmony. On the other hand, Taras, Steel, and Kirkman (2010) review how value–practice correlations are negative at the national level though positive at the individual. Oishi (2012) reviews this phenomenon, noting there is a large interdisciplinary effort to study this under general terms such as “individual-group discontinuity” (p. 175).
One example of individual–group discontinuity is the social dilemma, where what is good for the individual may not be good for the group. This has public policy implications, where ideological principles inspired by personal success are inappropriately presented as a template for the nation. The classic example of this is the Prisoner’s Dilemma, where two individuals pursuing what is best for themselves end up collectively in the worst of all possible situations. In general, we expect reversals when precisely this occurs, that is when people pursue individual achievement without regard to its impact on the group. There are several other culture-related examples of this. SWB is linked to having a conservative political stance at the individual level and though this may be associated with desirable personality traits at a work or local neighborhood level (Stankov, 2009; Stern, 2013), nations with more liberal policies (e.g., decommodification of the labor market or a larger social safety net) tend to be happier (Flavin, Pacek, & Radcliff, 2014; Okulicz-Kozaryn et al., 2014). Similarly, system justification research indicates that values can provide a buffer against dissatisfaction with the status quo (Jost et al., 2007; Liviatan & Jost, 2011). Essentially, our feelings about inequality are largely determined by the degree of perceived procedural fairness; if societal position is seen as largely based on talent and effort, they become more positive (Alesina, Di Tella, & MacCulloch, 2004), but if the gaps are sufficiently large and persistent to signal systematic disadvantage to the poor, they become more negative Graham & Felton, 2006).
Potentially, the social dilemma can occur with both individualism, which emphasizes self-interest, and with masculinity, which emphasizes competition over cooperation. However, individualism is problematic as being wealthy itself creates individualism at a national level. The strength of this connection is such that it likely obscures any potential reciprocal relationship, where national individualism would reduce national wealth. Masculinity, on the other hand, appears unencumbered by such issues.
Consequently, we expect homology to typically occur in terms of direction, though the strength of the relationship should be much stronger at the national level. One emphasized exception to this trend of isomorphism is masculinity, where the direction of the relationship is expected to reverse at the national level.
A Framework of Culture, Wealth, and Governance
Summarizing these positions, we present Figure 2, with many of the basic bivariate relationships previously explicated. Economic institutions that create wealth and political institutions that prevent corruption are intertwined and should be strongly related (Svensson, 2005), though each has the potential for a separate impact on SWB (Dorn, Fischer, Kirchgässner, & Sousa-Poza, 2007; Pryor, 2009). Masculinity should lead to reduced SWB, but as just mentioned, this relationship may be itself moderated by wealth. Wealth should have direct and indirect effects with SWB, moderated by individualism. Governance should be related to both power distance and uncertainty avoidance, though uncertainty avoidance should incrementally predict SWB above governance given its strong connection to anxiety.
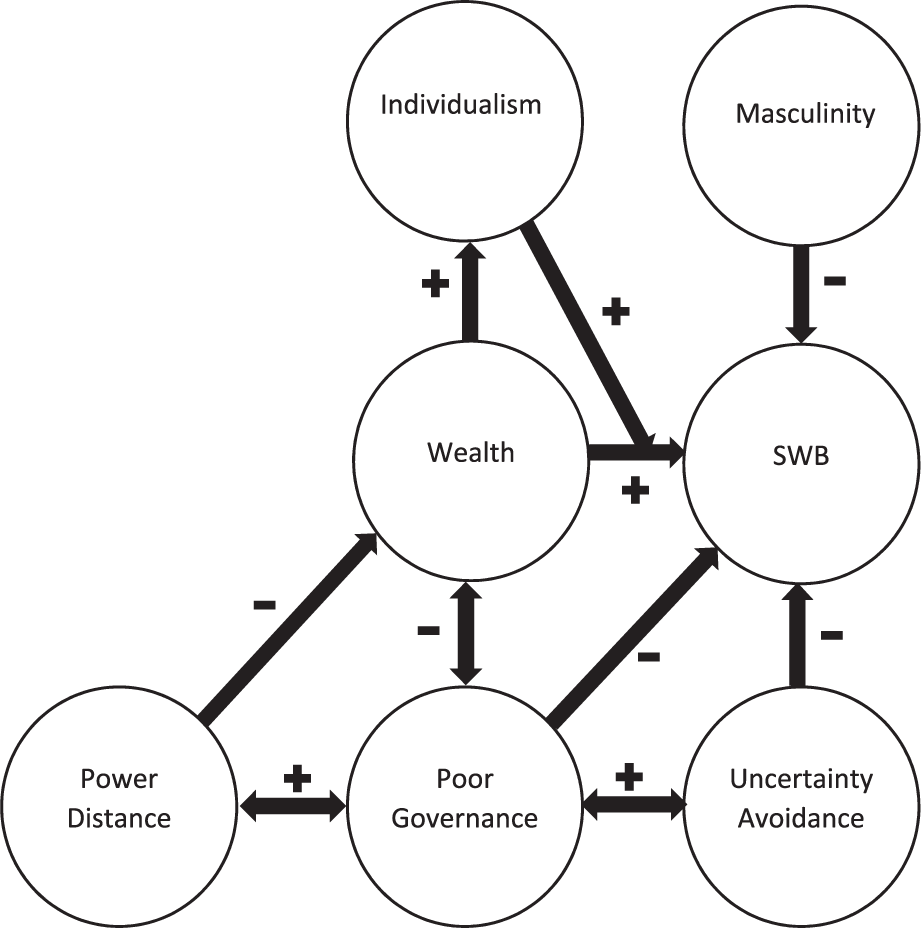
Summary of hypothesized major relationships among national SWB, cultural values, and political and economic institutions.
In short, we expect a happy culture to be lower in power distance, uncertainty avoidance, and corruption while higher in individualism and wealth. Masculinity may be more desirable for poorer countries while femininity might be better suited for richer countries. Whereas the effects of culture may be mediated through political and economic institutions, they should also account for incremental variance.
National-Level Methodology
For the meta-analytic data, we followed the same coding and statistical procedures as for Study 1. At a national level, results were primarily obtained either with a version of Veenhoven’s World Happiness Database (e.g., Veenhoven, 2011) or Michalos’ (1991) survey of college students, which averaged results from both happiness and life satisfaction. Hofstede’s original indices, being openly available, have been correlated with SWB several times (e.g., Basabe, Paez, & Valencia, 2002; Hofstede, 2001) and to maintain independence of data, we included one instance of these analyses. Of note, the available data permitted summary of all five facets in the individual-level analysis but only four in the national-level analysis (i.e., work, supervisor, coworker, and life satisfaction).
Wealth and Governance Indices
Good economic institutions lead to a wealthy nation. As a summary of these economic institutions’ output, we use GDP per capita, relying on data from the World Bank, expressed in terms of purchasing power parity (PPP). PPP puts national currencies into a common metric, the U.S. dollar, in terms of the ability to purchase the same goods and services. Consistent with Study 1’s logarithmic transformation for salary, a logarithmic transformation of per capita GDP did not improve its relationship with SWB. To measure national debt, we used total central government debt as a percentage of GDP, available from the Organization for Economic Cooperation and Development (OECD). For the decades of 1990 and 2000, data were available for 30 of our countries or regions. To measure governmental effectiveness or governance, we used the same corruption indices as Taras et al. (2012), that is Transparency International’s Corruption Perception Index (Ahmad & Aziz, 2001), which is a compendium of other surveys and indices (e.g., The International Country Risk Guide; cf. http://www.transparency.org/research/cpi/overview). These indices typically are based on subject matter experts answering a series of corruption- and governance-related questions (e.g., “Has the government implemented effective anti-corruption initiatives?”). The correlation of our governance/corruption index with overlapping data of Government Effectiveness, as measured by the Worldwide Governance Indicators Project and compiled back to 1996 (Kaufmann, Kraay, & Mastruzzi, 2011), was .96 for the 2000s, which is typical of the high level of convergence among governance indicators (Langbein & Knack, 2010), such as Versteeg and Ginsburg (2017) reporting indices .95 and above for a variety of rule of law indices. Similarly, previous investigation by Licht et al. (2007) shows that each of Hofstede’s cultural dimensions, respectively, produces very similar results whether correlated with indices for governance, corruption, or rule of law.
Culture and National Well-Being Indices
To assess culture and happiness at a national level, we relied on several databases. For culture, Taras et al. (2012) meta-analytically compiled a database, spanning from the 1970s-1980s to the 2000s, updating Hofstede’s cultural indices by drawing on subsequent administrations of Hofstede’s VSM or other surveys that proved to be functionally equivalent. As per Taras et al. (2012), “It is difficult to conceive of better results that indicate equivalence” (p. 3). Taras et al. then validated these indices against a wide range of related indices, such as income inequality with power distance. As they note, “A series of validity checks indicate that our updated cultural scores are more accurate than those offered by Hofstede” (p. 11). To assess the masculinity facet of achievement motivation, we drew upon Mõttus, Allik, and Realo’s (2010) database of conscientiousness national mean scores, where achievement motivation is nested. The correlation between self-reports of achievement motivation and observer reports (McCrae & Terracciano, 2008) is .60, making it the most agreed upon aspect of conscientiousness.
For SWB, we aggregated the 2010 version of Veenhoven’s (2011) World Database of Happiness (WDH). The WDH is an archive for surveys done on SWB at a national level, such as the Gallup polls or Eurobarometer series. As Steel and Ones (2002) summarize, it has been aggregated and subsequently validated several times previously (e.g., Myers & Diener, 1996), with evidence indicating that the results are appropriate for cross-cultural investigations. The WDH sorts the different surveys by a variety of categories, including scale length (e.g., 1 to 5), question type (e.g., “How happy are you?”; “How satisfied are you?”), and sample characteristics (e.g., general vs. student). All the survey results are transformed into a 0 to 10 common metric (Veenhoven, 2009). For further discussion of the WDH, Diener et al. (1995) provide a comprehensive description.
The main issue regarding aggregation is commensurability. There is a natural tension between the size or completeness of the database and the method variance it contains. The more relaxed the inclusion criteria, the larger the database’s size but also the measurement error. On the other hand, aggregating similar measures essentially creates a distinct source design (Kammeyer-Mueller, Steel, & Rubenstein, 2010), which decreases measurement error but at the cost of a smaller database and reduced generalizability. To address this, we needed to eliminate or separate substantively different ways of measuring SWB. To this end, we excluded student populations, who proved to provide significantly different results from the general population (Steel & Ones, 2002), and separated results depending on whether the question posed focused on happiness, satisfaction, or affect. We also aggregated scales that correlated with the database at .70 or higher.
We used linear equating to supplement the already transformed 0 to 10 scales provided in the WDH. To linearly equate the scales, we calculated individual standard deviations and means for the two target scales, derived from a sample of common respondents (Angoff, 1971). In our case, the common respondent was a general population sample assessed by two or more types of scales in a given year. For example, the population of Denmark was assessed by five different types of SWB scales in 2007. To maximize overlap among scales, we proceeded with a “spreading inkblot” strategy of aggregation. We started with untransformed scales as our “seed” scale or gold standard, such as the “11 Step Numeral Happiness” (i.e., 0-10 happiness scales). Survey results missing sample sizes were replaced with the mean average sample size for that scale. Using sample size weighting and averaging, we then aggregated a minimally transformed but highly correlated scale such as “10 Step Numeral Happiness,” which correlates with “11 Step Numeral Happiness” at .90. This provided a larger database and greater overlap to linearly equate more scales. We also aggregated scales that correlated with the database at .70 or higher, resulting in three SWB indices: Happiness, Satisfaction, and Overall SWB.
The happiness index comprised of five happiness scales along with a “Delighted–Terrible” scale that correlated with the overall happiness index at .89. The satisfaction index comprised of six satisfaction scales along with a “Best–Worst” scale that correlated at .75 with the overall satisfaction index. The average correlation of the scales comprising the overall index with the index itself was .98 for happiness and .91 for satisfaction, which reflects agreement among the measures as well as unique Nation–Year combinations assessed by only one scale. An affect scale was not developed as there were not enough instances to provide a meaningful index by decade. Finally, though happiness and satisfaction are at times treated as separate constructs, the results from a Weighted Least Squares (WLS) regression between the two provided a correlation of .71, above our threshold for aggregation. Consequently, we also provide an overall SWB scale comprised of both happiness and satisfaction.
Given the depth of the database, we were able to assess the test–retest reliability of the scale by comparing all nation scores on the overall SWB scale that were from 1 to 10 years apart, correcting for range restriction and weighting by sample size. We only included correlations based upon 5 or more data points. Using WLS regression, we get a predictable decrease in the correlation by degree of separation, starting with a constant of .87 for adjacent years and then decreasing −.01 for each additional year of separation, R2 of .48, F(1, 8) = 7.44, p = .03. This provides a sufficient average test–retest correlation among country scores to justify aggregation across broad timespans. Consequently, we developed indices for SWB, happiness, and satisfaction, matching the countries, regions, and timespans used by Taras et al. (2012) in their cultural value database: 1970s to 1980s, 1990s, and 2000s. As a reliability check, we correlated our overall results with Diener et al.’s (1995) SWB index, based on data from the 1980s and earlier. As expected, the correlation decreased with years of separation. For the 1970s to 1980s, r = .85, for the 1990s, r = .64, and for the 2000s, r = .62. Evaluation of similar national accounts of well-being was reviewed by Diener, Inglehart, and Tay (2013), who found them to be generally valid and useful for directing public policy.
Building on this technique, we assembled an international job satisfaction database by converting results from an extensive series of governmental social surveys. These surveys included British Social Attitudes Surveys, Eurobarometer series, European Quality of Life Surveys, European Social Surveys, European Values Study, Canada’s General Social Surveys and National Graduate Surveys, International Social Survey Program, Japanese General Social Surveys, Polish General Social Survey, Quality of Life Diagnosis in Romania, Scottish Social Attitudes Surveys, Social Change in Canada, General Household Surveys, New Baltic Barometer, and the World Value Surveys. Aggregation was simplified by the general homogeneity in question type. Surveys typically asked, “How satisfied are you with your job?” or minor deviations thereof. All scales were converted to a common metric of 1 to 10, with 1 being least satisfied. We considered Eskildsen, Kristensen, and Antvor’s (2010) proprietary European Employee IndexTM measure of job satisfaction, finding it correlates at .29 with our data set and consequently excluded it.
We also examined the degree that these national-level indices reflected response biases. The effect of these potential biases is uncertain (Tov & Au, 2013). Typically, two self-report measures, such as culture and SWB, will have their relationship inflated by sharing nonsystematic error variance (common method variance), whereas relationships between a self-report and observed measure, such as GDP per capita, would have their relationship artificially decreased (Podsakoff, MacKenzie, & Podsakoff, 2012). This may be a concern as some response style scores, though typically post hoc derived, have been shown to correlate with country-level culture and SWB variables (Johnson, Kulesa, Cho, & Shavitt, 2005; Van Dijk, Datema, Piggen, Welten, & van de Vijver, 2009). To test for the presence of response bias, we used the national acquiescence and extreme response bias measures of P. B. Smith and Fischer (2008), testing them against our SWB, cultural, economic, and political indices for each decade. Of the 60 correlations, only three were significant, all from the 1970s to 1980s decade: power distance, individualism, and notably GDP per capita. These appear to be spurious given that (a) we would expect at least three to be significant by chance (i.e., 1 in 20), (b) these correlations occur during a different decade of when the response biases indices were obtained, and (c) acquiescence correlates strongly with our observed measure of GDP per capita (i.e., r = −.47, based on 28 countries). Possibly, the absence of a substantive response bias in our data set reflects its meta-analytic nature, which averages the effects derived from several surveys. In their review article, Podsakoff et al.’s (2012) first recommendation for reducing method bias is simply to obtain measures from different sources and, given the nonsystematic format and item wording among surveys, sources of error may have effectively cancelled each other out (i.e., error has a mean of zero). Still, other response bias indices may prove to generate more dependable correlations (e.g., He, Van de Vijver, Espinosa, & Mui, 2014). Even if so, interpretation of such a finding is unclear. These aforementioned post hoc derived response bias indices typically have correlations with objective economic and political measures, such as income inequality or democratization, which exceed that seen with self-report measures, including culture or SWB, making interpretation extremely complicated. At the national level, response bias does not unambiguously represent error, something erroneous to be removed or controlled for, but can be a meaningful construct that may indeed reflect other constructs of interest (He et al., 2014). Also, Conway and Lance’s (2010) research indicates that the substantive effect of common method variance is essentially zero as it helps to compensate for measurement error, which tends to have a stronger attenuating effect.
A fully estimated data set, with every country having an estimate for every year of its existence from 1970 to 2010, would have approximately 6,000 data points. The overall SWB has 1,096 data points, each based on an average of 4,894 respondents. The happiness index has 655 data points, based on an average of 4,336 respondents each. The life satisfaction index has 725 data points, each based on an average of 3,385 respondents. The job satisfaction index has 267 data points, with an average of 3,817 respondents for each. A summary of the SWB indices is provided in Table 5.
Meta-Analytically Derived Subjective Well-Being as Well as Happiness, Life, and Job Satisfaction Across Nations.
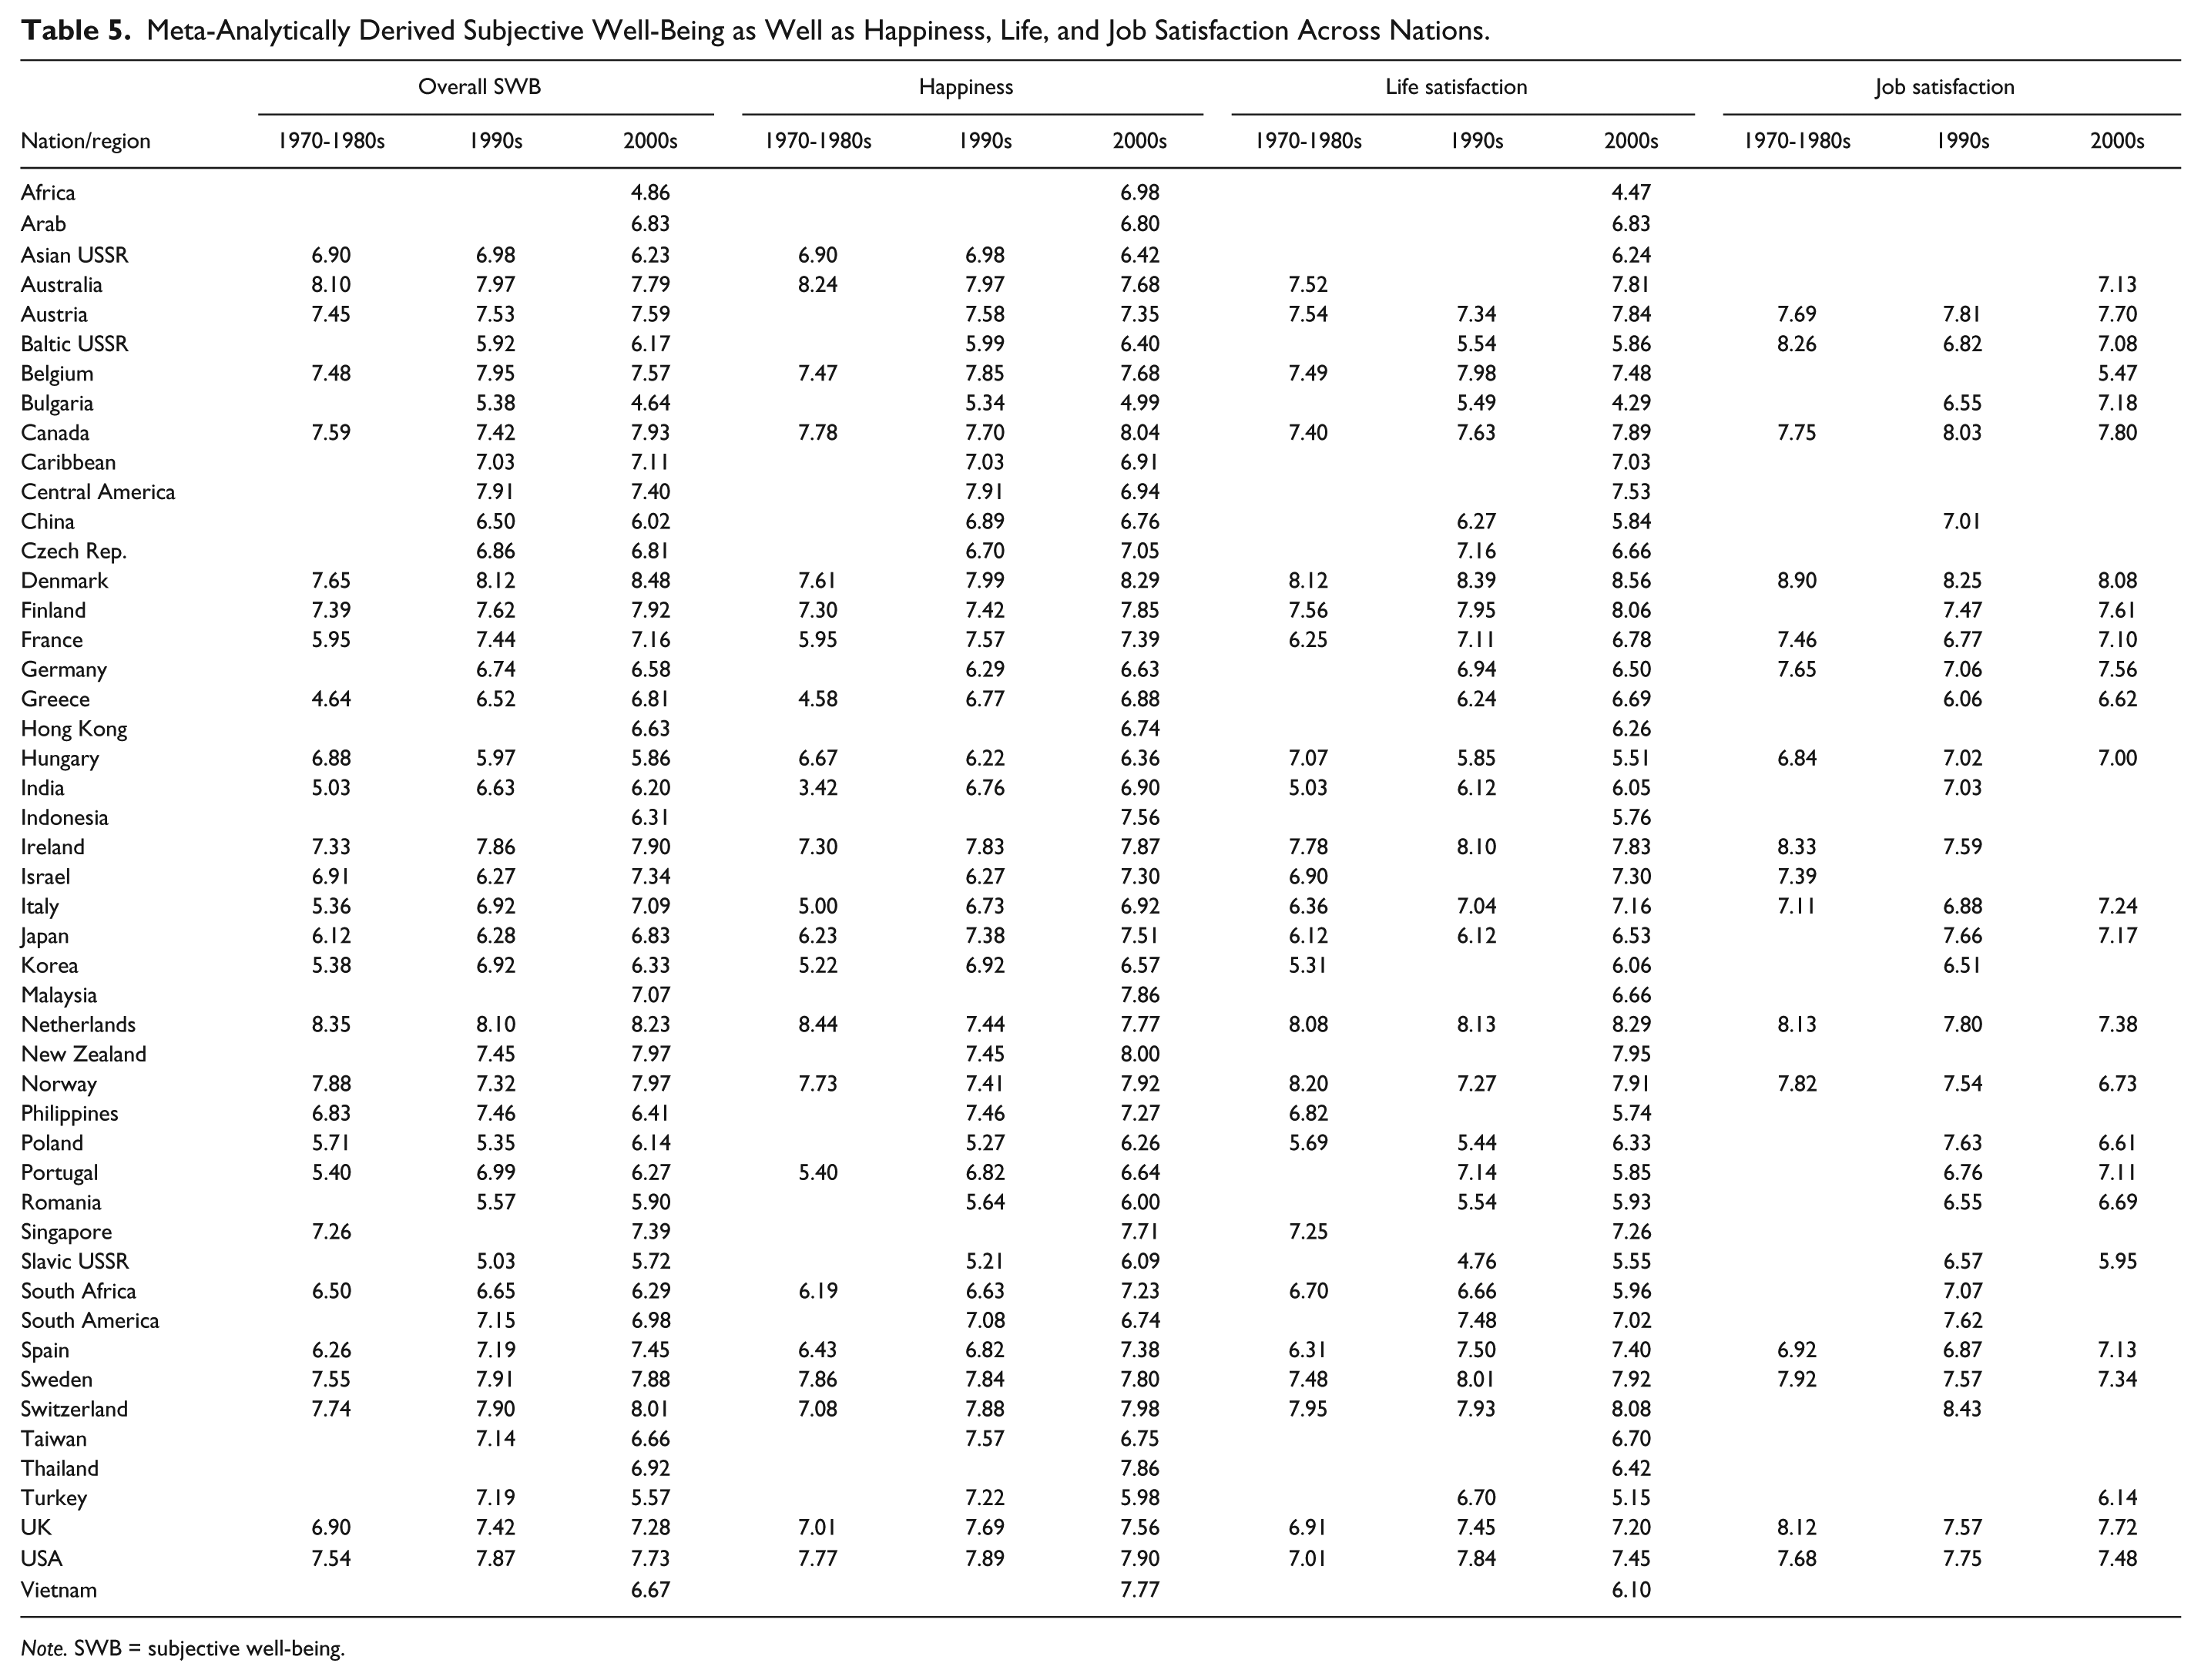
Note. SWB = subjective well-being.
National-Level Results
The national-level data set comprised of 44 meta-analytic effects representing 1,230 original data points. Average sample size, accordingly, was 29 countries per study. Like the individual-level analysis, results centered on the role of individualism comprising 44% of all studies, and on life satisfaction, comprising 42% of all studies. As per Table 6, at the national level of analysis, the overall meta-analytic absolute effect size was 0.38, which is considerably stronger than the absolute effect size of 0.06 observed at the individual level of analysis. As reviewed, this was expected, with correlations typically increasing in strength at larger levels of analysis or aggregation. The strength of the effect varied across facets of the culture and satisfaction constructs. Across cultural dimensions estimated with at least 20 nations, job satisfaction had the strongest correlation, −.53 with uncertainty avoidance, but also the weakest, −.10 with masculinity. The research record for coworker and supervisor satisfaction is extremely sparse, with unexpected negative correlations for coworker and supervisor satisfaction with individualism. This reflects not only the low number of nations in most analyses but also that sample sizes that obtain national SWB and culture averages can be relatively small.
Meta-Analytic Correlations Between National Subjective Well-Being and Cultural Values.
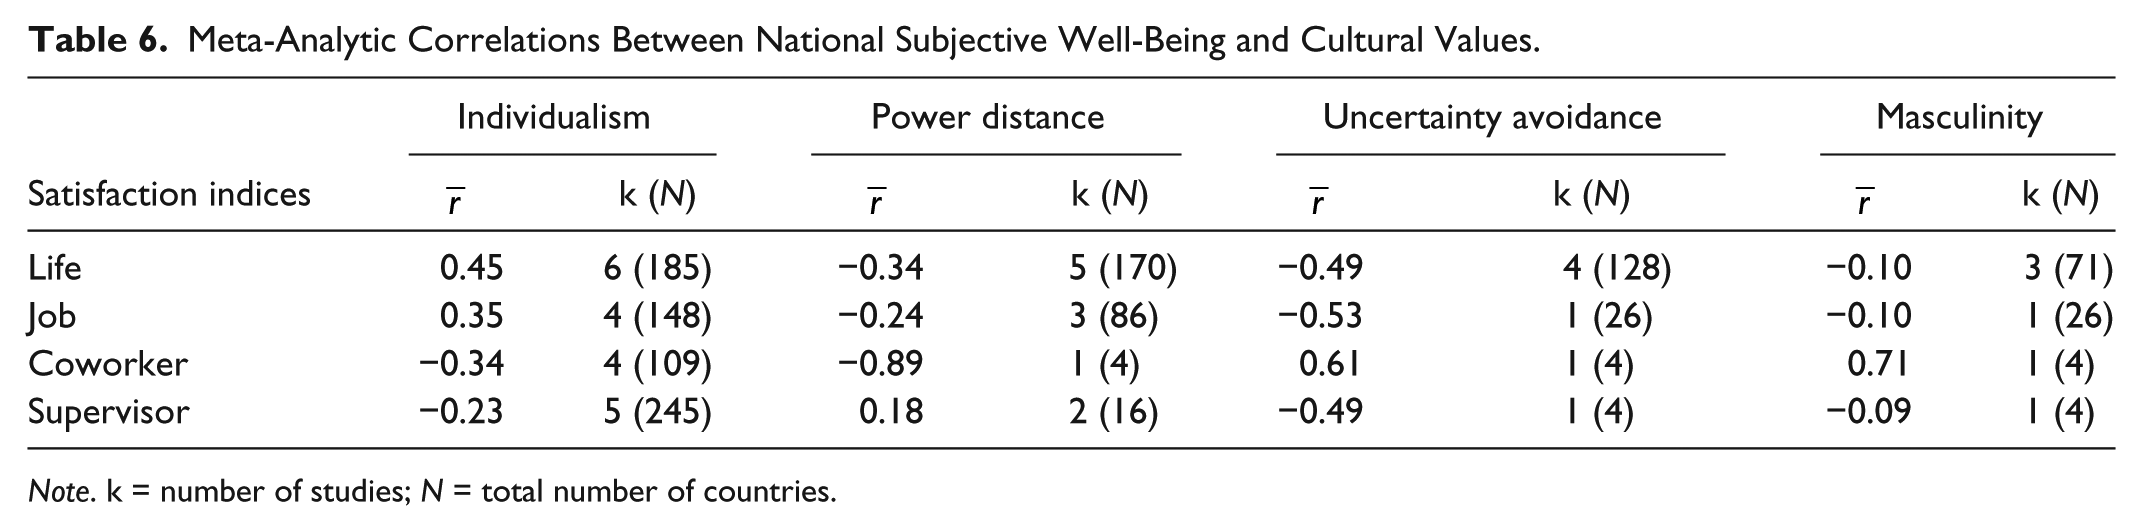
Note. k = number of studies; N = total number of countries.
Addressing these limitations, we move to our meta-analytic mean-level analysis. Being based on much of the raw data that comprised the correlations in Table 6, we did not incorporate these correlations in our estimates (as this would have the same information counted twice). In total, 48 countries or regions had both SWB data and cultural value data, which is much larger than the research done previously between SWB and cultural values and, as Oishi (2012) reviews, this is slightly larger than the average study that correlated GDP per capita and SWB, which usually uses fewer than 45 countries. Table 7 provides the intercorrelations for overall SWB, Happiness, Life Satisfaction, Job Satisfaction, Power Distance, Uncertainty Avoidance, Individualism, Masculinity, GDP per capita, and Governance for three time periods: 1970s to 1980s, 1990s, and 2000s.
Correlations Among National Subjective Well-Being Indices, Cultural Value Indices, GDP Per Capita, and Governance for Three Time Periods.
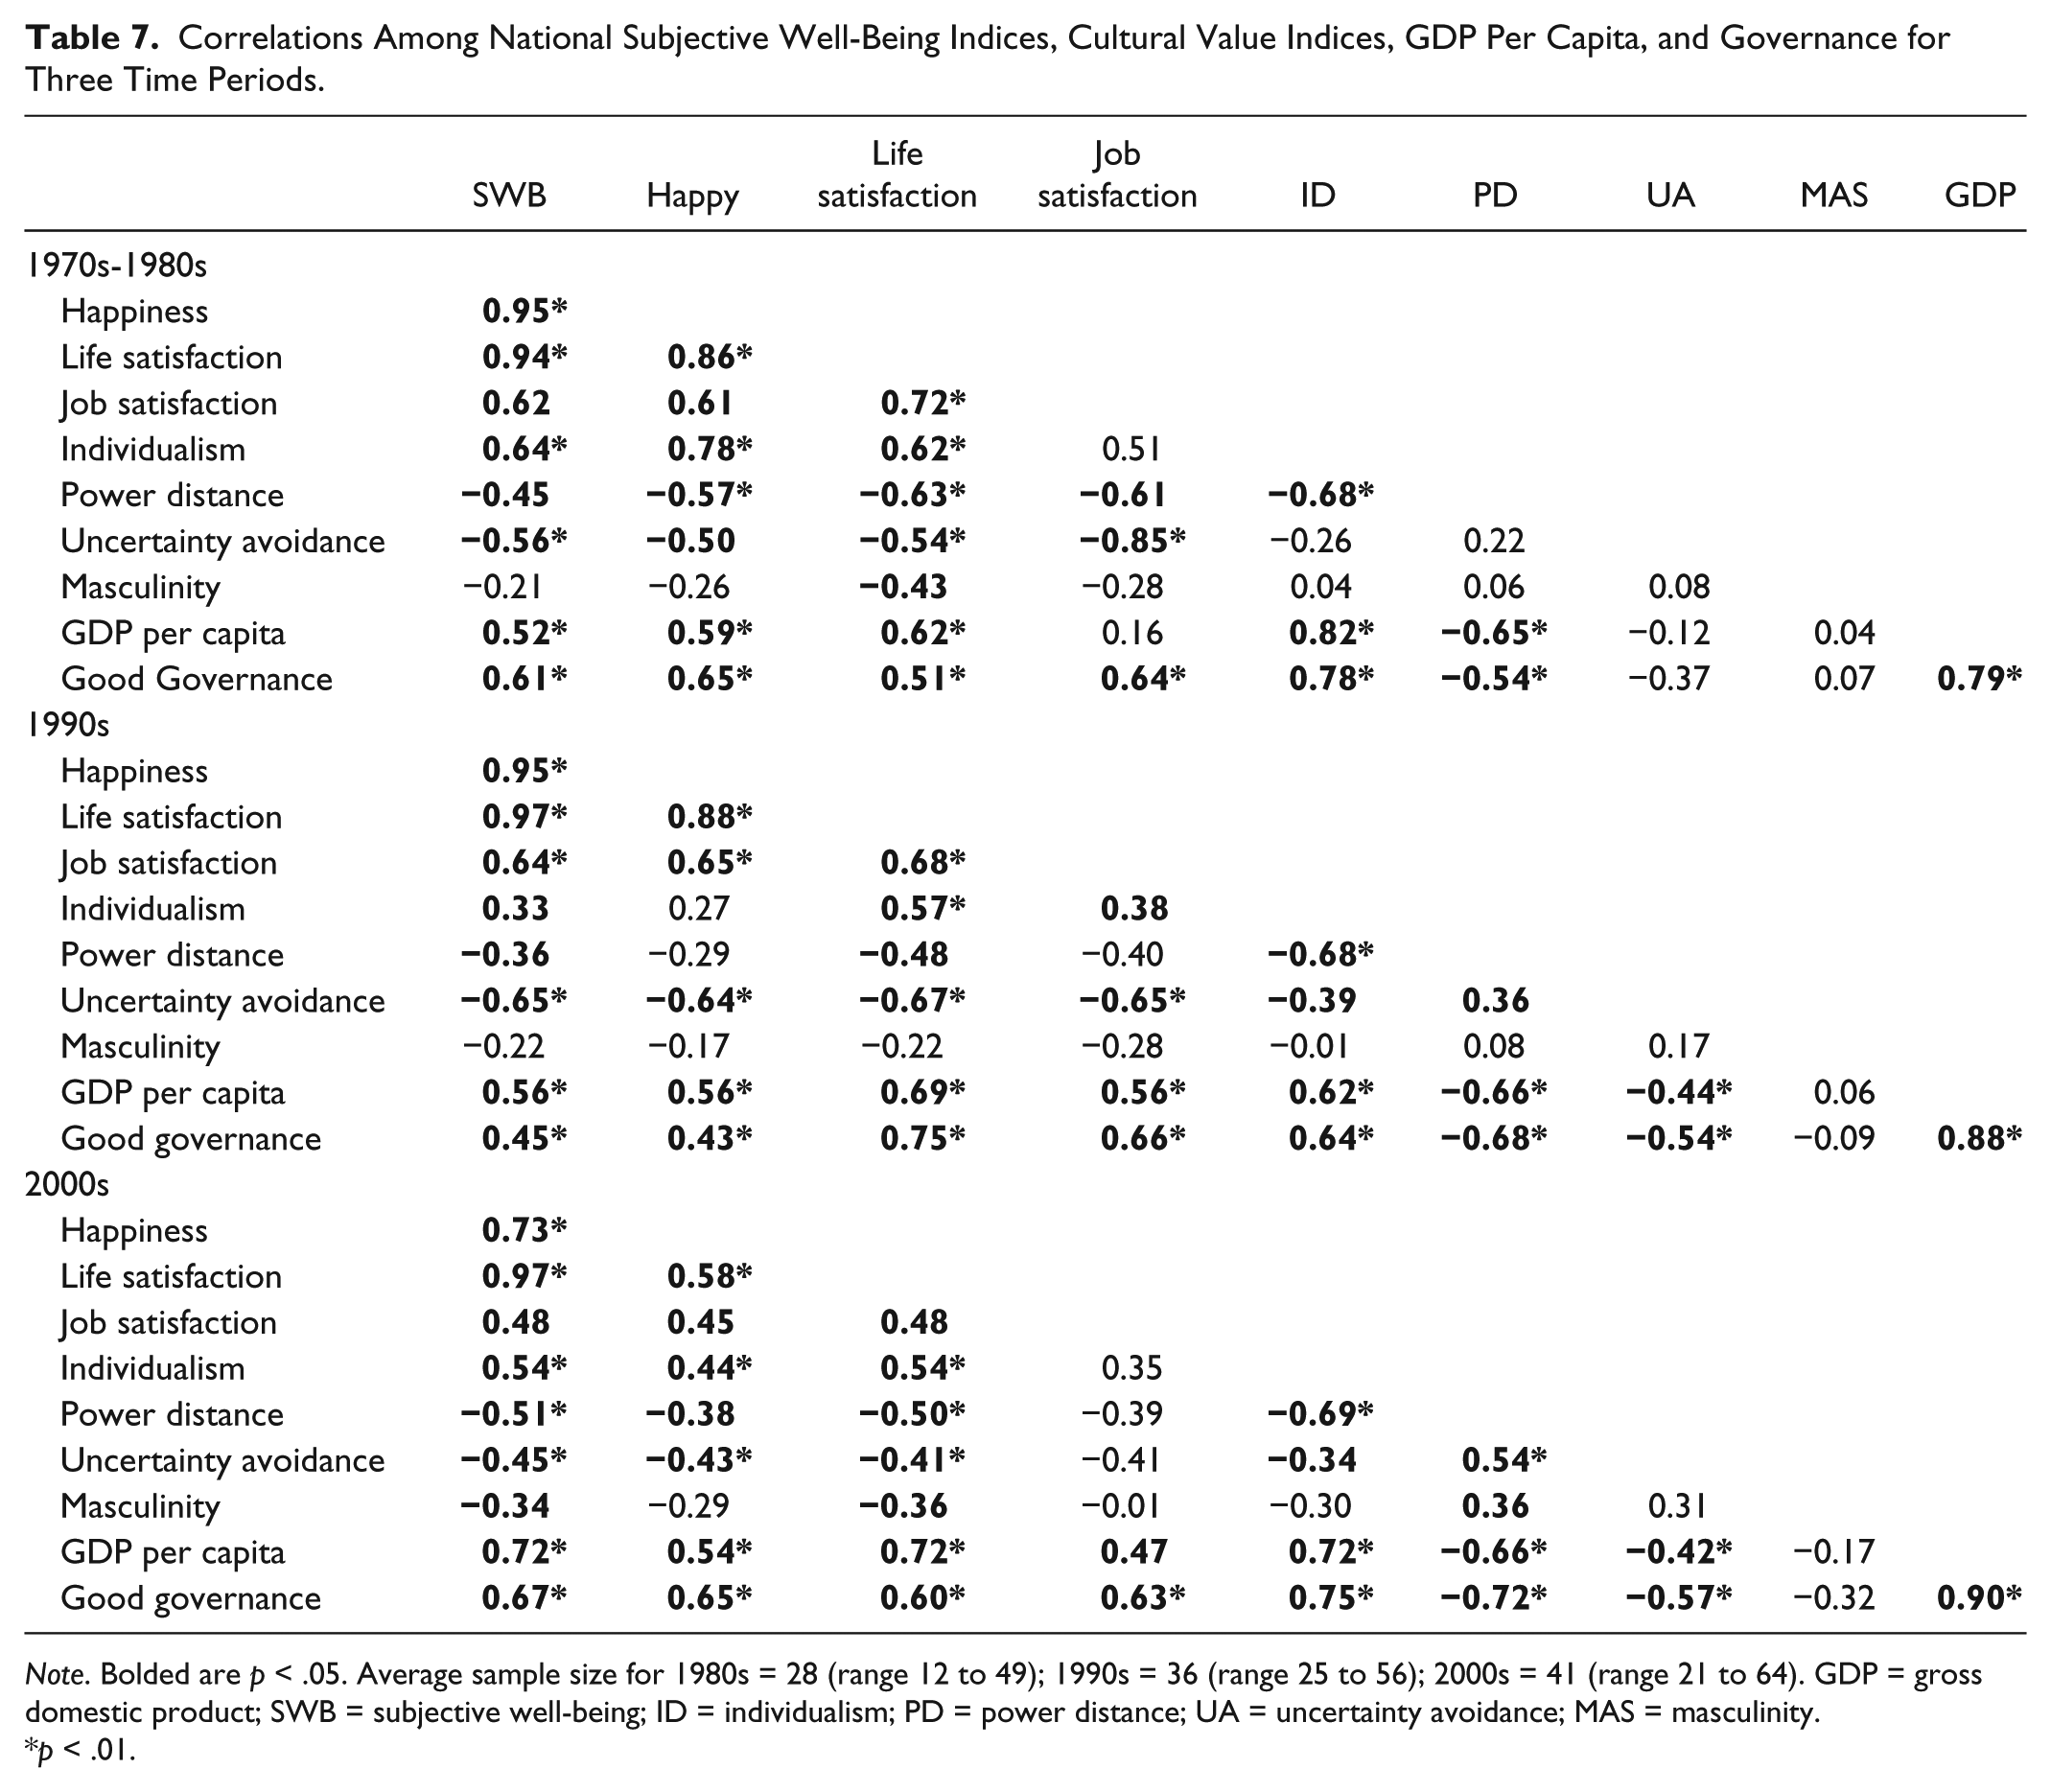
Note. Bolded are p < .05. Average sample size for 1980s = 28 (range 12 to 49); 1990s = 36 (range 25 to 56); 2000s = 41 (range 21 to 64). GDP = gross domestic product; SWB = subjective well-being; ID = individualism; PD = power distance; UA = uncertainty avoidance; MAS = masculinity.
p < .01.
As can be seen, the results are very stable across all three time periods and are aligned though stronger than the previous meta-analytic data. The average absolute correlation between culture and SWB and job satisfaction from Table 6 is .35 and .31 respectively, but from Table 7 it is .44 and .43. Similarly, Oishi (2012) summarizes 19 studies that give an average sample size weighted correlation of .64 between SWB and GDP per capita, comparable to the .60 we obtained here. All aspects of SWB, including job satisfaction, are operating similarly across each cultural dimension and consequently we constrain our analyses primarily to overall SWB. With regard to Figure 2, most of the expected bivariate or direct relationships are largely borne out, the exception being masculinity and wealth, which was nonsignificant though trending negative. The strongest relationships, aside from the intercorrelations among the SWB measures, were typically those where a reciprocal relationship was hypothesized.
Culture, Wealth, and Governance
Hypothesis 6 was that culture would incrementally predict SWB above GDP per capita and governance effectiveness, having direct pathways. To test this, we used multiple regression to confirm that the collective effect of culture on SWB is substantial. Focusing on overall SWB, the 1970s to 1980s period generated an R2 of .57, F(4, 20) = 6.59, p = .001; the 1990s decade generated an R2 of .32, F(4, 14) = 1.68, p = .20; and the 2000s decade generated an R2 of .49, F(4, 21) = 5.03, p = .005. Similar results are obtained with the alternate SWB indices (i.e., happiness, life satisfaction, job satisfaction), with a total of two nonsignificant findings out of the possible 12 (i.e., four SWB indices each examined in three time periods).
To determine if culture incrementally predicted above both GDP and governance, we tested culture as a present indicator and as a leading indicator, that is more causally distal. We did this in two sets of analyses: (a) all sets of indicators during same the time period, and (b) culture alone from the previous time period. If culture is operating partially through institutional change, we would still expect that culture from a previous time period to incrementally predict. For example, social capital has a much stronger relationship with SWB in the medium- and long-term than the short-term (Bartolini & Sarracino, 2011) and, to the extent that masculinity leads to changes in social capital, we would expect similar lagged effects.
Starting with all sets of predictors from the same time period, we found that for the 1970s to 1980s, culture incrementally predicts (ΔR2 = .38), F(4, 15) = 4.47, p = .014, but not for the 1990s (ΔR2 = .16), F(4, 16) = 1.42, p = .273, or the 2000s (ΔR2 = .07), F(4, 16) = 1.23, p = .339. That the mixed time period, 1970s to 1980s, incrementally predicts is significant as we would expect this if culture is indeed causally distal, containing data from two decades. When we lagged culture appropriately, using the data from the previous time period, there was significant incremental variance accounted for above GDP per capita and governance: 1990s (ΔR2 = .39), F(4, 20) = 4.83, p = .007; 2000s (ΔR2 = .15), F(4, 20) = 3.61, p = .023. As a robustness check, we conducted an additional comparison. Along with culture, we examined GDP per capita and governance from the previous time periods as well; this simply replicated or increased the variance accounted for by culture: 1990s (ΔR2 = .51), F(4, 20) = 8.21, p = .001, and 2000s (ΔR2 = .15), F(4, 20) = 2.99, p = .044. Hypothesis 6 is supported.
Individualism, Wealth, and SWB
Hypothesis 7 predicted that individualism and wealth interact to predict SWB. We tested this moderating effect, where being simultaneously both wealthy and individualistic is desirable, using hierarchical regression, adding the interaction term in the second step, with all variables standardized. Though individualism and wealth were closely connected, variance inflation factor indices remain well below the critical threshold of 10, indicating acceptable collinearity. Despite the difficulty in detecting interaction effects in field studies (G. H. McClelland & Judd, 1993), as per Table 8, the interaction effect was extraordinarily strong, accounting for upward of 12% of the variance, except for the 1970s to 1980s (where neither GDP per capita nor individualism separately predicted). As per Table 8, the interaction term was positive whereas individualism’s term becomes negative, suggesting that individualism indeed creates happiness but perhaps only when there is a foundation of wealth. Confirming this, simple slope analysis, using the R’s Moderated Regression Package “Pequod” (Mirisola & Seta, 2016), indicated for the 2000s that when GDP is one standard deviation above the mean, the standardized slope for individualism is 0.568 (p = .006), a sharply positive gradient, but −0.485 (p = .013) when GDP is one standard deviation below. These results are reported in Figure 3, with the 1990s providing the same pattern. Hypothesis 7 was supported.
National Regression Analyses of the Interactive Effects of Individualism and GDP per Capita and Indices of SWB by Decade.
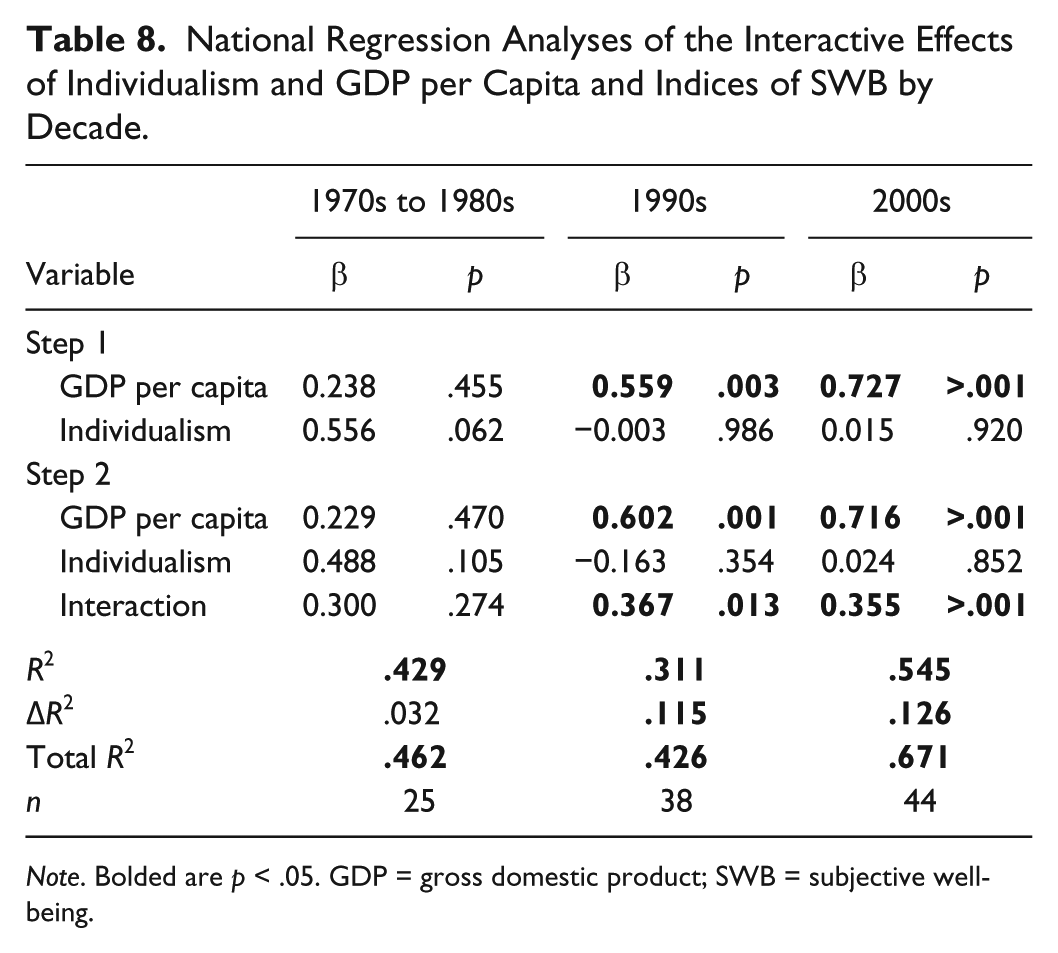
Note. Bolded are p < .05. GDP = gross domestic product; SWB = subjective well-being.
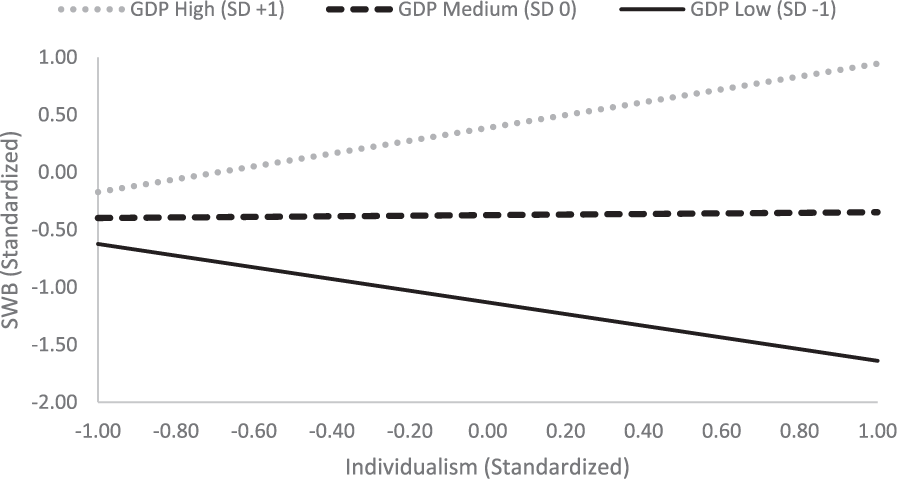
Simple slope analysis of the relationship of national individualism with SWB when GDP is one standard deviation above and below the mean for the 2000s.
Power Distance, Wealth, and Governance
High power distance appears to be an indicator of a nation at risk. As per Hypothesis 8, it was strongly connected with low SWB, less GDP per capita, and reduced governance effectiveness. For example, Figure 4 depicts the relationship between power distance and SWB for the decade 2000-2009. On the top end, we have happy and low power distance countries, like the Netherlands and Norway. At the bottom, we have the less happy and high power distance countries, like China or the Philippines.
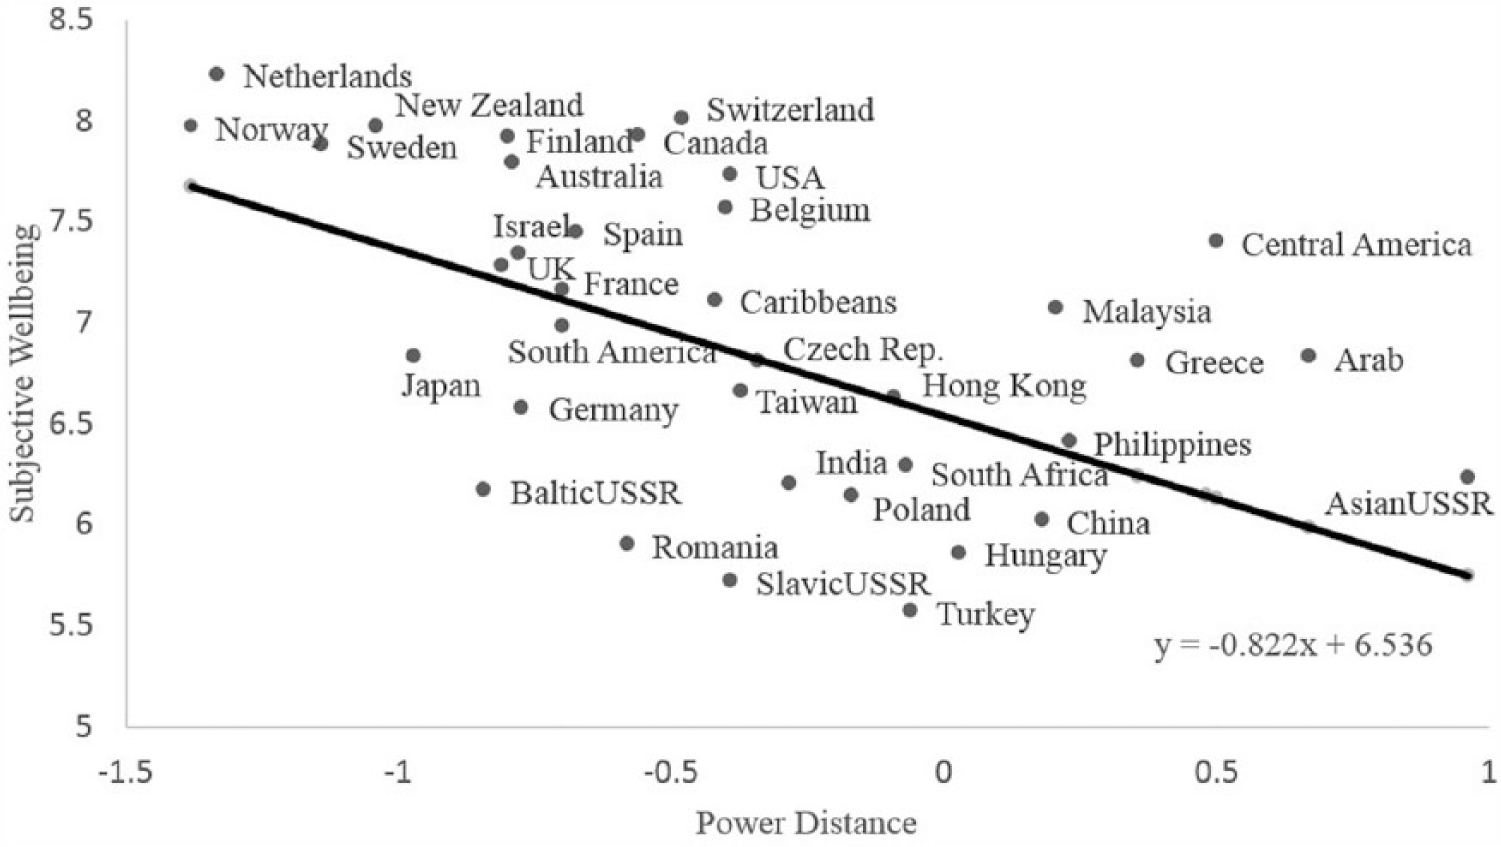
For 38 nations, power distance by subjective well-being for the decade 2000 to 2009 along with the estimated trend line.
Hypothesis 8, as depicted in Figure 2, indicates that power distance’s relationship with SWB should be mediated by a combination of GDP per capita and governance. We tested the expected mediation using bootstrapping methodology (Preacher & Hayes, 2008), specifically Model 6 using 5,000 bootstrapped samples with 95% confidence intervals generated by PROCESS for SPSS 2.16.1 (Hayes, 2013), as depicted in Figure 5. Model 6 allows us to test both governance effectiveness and GDP per capita as mediators simultaneously. There are two major analyses to attend to. First, there is c′, which is whether there remains any direct effects of power distance on SWB after considering indirect effects. Second, are there any significant indirect effects? Model 6 considered three. Indirect Effect 1 was whether governance effectiveness mediates, as per: power distance → governance → SWB. Indirect Effect 2 was whether governance effectiveness and GDP per capita mediate, as per: power distance → governance → GDP per capita → SWB. Indirect Effect 3 was whether GDP per capita mediates, as per: power distance → GDP per capita → SWB. Figure 2, as tested by Figure 5, was supported when the indirect effects are significant, though the ability to detect mediation at a national level is invariably difficult due to sample size constraints.
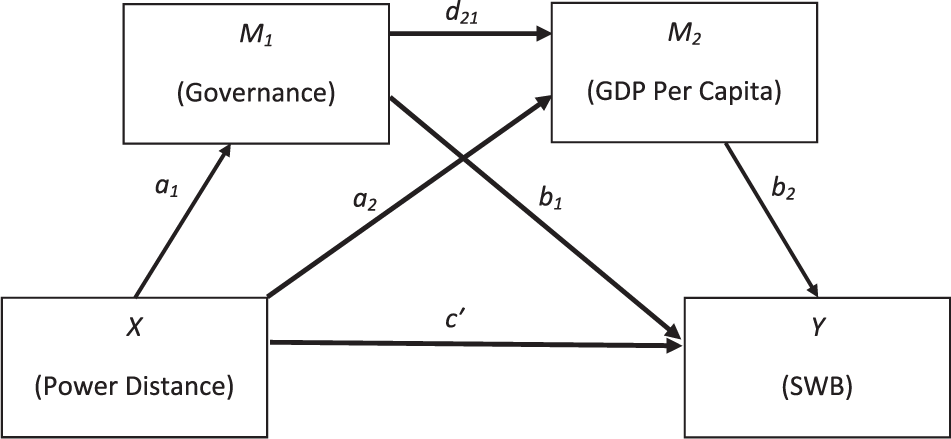
National power distance’s expected mediation with national SWB.
Consistent with the analyses for Hypothesis 6, we used power distance from the previous time period except for the mixed era of the 1970s to 1980s. For the 2000s, the total effect of power distance on SWB was significant (B = −0.89), t(35) = −4.78, p < .001, but there was not a significant direct effect (B = −0.14), t(35) = −0.82, p = .42, indicating full mediation. Of the indirect effects, only Indirect Effect 1 was significant (B = −0.52, Boot SE = 0.192, BootLLCI = −0.994, BootULCI = −0.210). For the 1990s, the total effect of power distance on SWB was significant (B = −0.33), t(30) = −2.58, p = .015, but there was not a significant direct effect (B = −0.07), t(30) = −0.40, p = .69, again indicating full mediation. However, there was insufficient statistical power to test for indirect effects, with the total indirect effect also not significant (B = −0.56, Boot SE = 0.15, BootLLCI = −0.559, BootULCI = 0.046). For the 1970s to 1980s, the total effect of power distance on SWB was significant (B = −0.65), t(23) = −2.76, p = .01, and again there was not a significant direct effect (B = −0.15), t(23) = −0.64, p = .53, indicating full mediation. Although this time the total indirect effect was significant (B = −0.50, Boot SE = 0.24, BootLLCI = −1.117, BootULCI = −0.135), there was insufficient power to determine to which indirect paths this can be attributed. Though the number of countries available for these analyses ranged from 37 to 25, we still found consistent signs of mediation, especially via governance effectiveness. Overall, Hypothesis 8 was supported.
Uncertainty Avoidance, SWB, and Governance
Hypothesis 9 predicted that uncertainty avoidance is negatively associated with SWB, partly mediated by governance. As per Table 7, with the exception of job satisfaction during the 2000s (where r = −.41 failed to reach significance), this was strongly supported. In addition, uncertainty avoidance should be negatively associated with governance effectiveness, as per Figure 2. This was consistently found with one exception again, this time the 1970s to 1980s (where r = −.37 failed to reach significance). Averaging across all time periods, this hypothesis was supported. Hypothesis 9 indicated that uncertainty avoidance should not be just connected to governance effectiveness, but predict SWB above it. This is similar to Hypothesis 6 but focused on a single variable; like our analyses for Hypothesis 6, we treated uncertainty avoidance as a leading indicator and used the scores from the preceding time period where possible. As per Figure 2, as we expected that some of governance effectiveness’ relationship with SWB is expressed through GDP per capita, we controlled for both using hierarchical regression, allowing uncertainty avoidance to enter second. Results were consistent across all time periods: 1970s to 1980s (ΔR2 = .30), F(1, 18) = 13.71, p = .002; 1990s (ΔR2 = .31), F(1, 23) = 14.52, p = .001; and 2000s (ΔR2 = .18), F(1, 26) = 19.84, p < .001. Hypothesis 9 was supported.
Masculinity, Wealth, and SWB
To better parallel the individual-level investigation from our individual-level analyses, we examine masculinity’s relationships using its achievement orientation facet as well. Hypothesis 10 suggested that masculinity should be negatively related to SWB and moderated by wealth. That is, for poorer countries, masculinity might have a more positive relationship. As per Table 7, masculinity had a consistent negative relationship across SWB indices, though not all reaching statistical significance. Regarding achievement orientation specifically, though consistently trending negative, it reached significance only for overall SWB during the 2000s decade (r = −.35, p = .04), when the majority of the personality data were also obtained (Mõttus et al., 2010). Continuing, the focus becomes on whether wealth moderates this relationship.
We started by examining masculinity’s relationship with GDP per capita. Although, as per Table 7, the results were not significant for masculinity, with estimates on both sides of zero, for achievement orientation, the results were clearer; the relationship was consistently negative and significant, between −0.56 to −0.59 (N = 31 to 32). Again, Weber’s (1904/2001), D. C. McClelland’s (1961), and now Ferguson’s (2011) hypothesis regarding achievement motivation and national wealth is rejected. Furthermore, we were not able to detect any interaction effect suggesting that the effect of masculinity is moderated by GDP per capita, contradicting Arrindell’s (1998) earlier finding, nor any curvilinear relationships during any time period.
Cultural Isomorphism
Having completed our core individual- and national-level analyses, our final hypothesis predicted that isomorphism in direction should be typical, except for individualism and masculinity. Comparing Table 1, the individual-level data, with the last set of analyses from Table 7, the most recent and complete national-level data, we found directional isomorphism indeed typical, though with an increase in strength at the national level. For SWB, power distance stayed negative though increasing in strength at the national level (p < .001). Uncertainty avoidance and masculinity did the same (p < .05). Individualism’s relationship did change though, going from weakly negative at the individual level to strongly positive at the national level (p < .0001). The interpretation of this is difficult due to the third variable problem, that is national wealth creates both SWB and individualistic values. It is a clear instance, however, of individual-group discontinuity.
For wealth, we had a similar but not identical constellation of findings. Directional isomorphism continues for power distance and uncertainty avoidance whereas individualism again reverses in direction at the national level, moving from weakly negative to strongly positive. Masculinity, on the other hand, trended negatively with wealth at the national level (p = .18), opposite of its individual-level positive relationship. To examine this more closely, we looked at its core facet, achievement motivation. Here, the relationship was more pronounced, with results becoming consistently and substantively negative at the national level (p < .001). This appears to be a classic example of the social dilemma. Although at an individual level, competition and need for personal achievement are associated with wealth, at the national level, cooperation, trade, and trust are hallmarks of prosperity (Horváth, 2013; Ridley, 2010).
Following up on this finding, we also examined whether feminine countries have higher rates of governmental debt accumulation. Using OECD’s debt as a percentage of GDP indices, we examined Davidson et al.’s (2013) hypothesis that feminine countries are “renting” their happiness by incurring debt. Using data from the 1990s and 2000s, we failed to find support for Davidson et al.’s hypothesis. Although replicating results (e.g., Oishi et al., 2011) that showed increases in debt from the 1990s decade to the 2000s was associated with decreases in SWB (r = .47, N = 30), this increase in debt was positively associated with masculinity from the 1990s (r = .42, N = 23) but not the 2000s (r = .22, N = 23), suggesting not only that feminine countries are more financially prudent but again that culture precedes fiscal policy. Similarly, overall debt was associated with masculinity from the decade before, with 1990s masculinity predicting 2000s debt (r = .45, N = 23), but not with other temporal pairings (e.g., 1990s debt with 1990s masculinity or 1990s debt with 2000s masculinity).
In short, isomorphism happens but not consistently. Out of our four predicted reversals, three occurred, the exception being between masculinity and SWB, which stayed negative at the individual and national levels of analysis. Overall, Hypothesis 11 is supported.
National-Level Discussion
Across 48 countries and three time periods, we investigated the relationships among cultural, well-being, economic, and governance indices. Our different indices of SWB (i.e., Life Satisfaction, Happiness, Job Satisfaction) tended to perform similarly with culture, providing a consistent story. The happy culture tends to be individualistic and wealthy but low in power distance and uncertainty avoidance. Masculinity trended negatively with SWB, reaching significance for life satisfaction in both the 1980s and 2000s. The combined effect of culture was large, with the largest contributors being individualism and uncertainty avoidance. Power distance’s effects were mediated, especially by effective governance indicators. Accordingly, cultural values appear to have both causally proximal and distal properties, operating partly through institutional change. After controlling for economic and political indices, cultural scores from the preceding time period better predict SWB from the subsequent time period.
Overall, these results support functional and neo-institutional theory (Kara & Peterson, 2012) over political process theory (Acemoglu & Robinson, 2012). Although culture, such as power distance, should help to shape what economic and political institutions are formed, as Diener and Diener (1995) hypothesized, culture can incrementally predict beyond these institutions. Similarly, we found that individualism interacts with wealth to predict happiness, likely reflecting autonomy meeting opportunity, where if one has social license to pursue personal fulfillment, it is best to have the means to fulfill. In addition, we found that typically uncertainty avoidance incrementally predicts SWB above both GDP per capita and governance.
In all, Figure 2 was supported. Importantly, though achievement motivation was associated with wealth at the individual level and long thought to be critical at the national level (e.g., D. C. McClelland, 1961; Weber, 1904/2001), these intuitions repeatedly appear to be misplaced. Our results, if anything, indicate national-level masculinity, especially achievement orientation, was associated with less wealth, not more. Masculinity’s primary connection with wealth is that it appears to precede substantive increases in governmental debt. Consistent with masculinity being an example of the social dilemma, the concern for others associated with femininity can extend to concern for the financial status of future selves or subsequent generations.
Future Research Directions
We found that cultural values do predict SWB above key economic and political institutions though related to both. Culture appears to have some causally distal pathways, where changes in culture lead to changes in institutions. Consequently, there can be a lag between when culture is assessed and its effect on SWB. For some cultural dimensions, like individualism, we would expect no lag, with it influencing the hedonic value of wealth in real time. Other cultural dimensions, like power distance, operate primarily through other institutions. The relevance of culture, that there are dependable relationships between values and national indicators of success, is potentially explosive; as Friedman (2011) notes, as it steps on the ideologies of both the right and the left. For example, in an address to the United Nations, President Xi Jinping, who holds the top office in both of China’s military and communist party, made an extended argument that “international values and a liberal order do not really exist” (Saunders, 2015). Unfortunately, political science and economics have largely operated from a political process theory perspective, leaving the role of national culture relatively unexplored and consequently open.
Eventually, we should be able to precisely answer the following two core questions. When does cultural change lead to institutional change and when does lasting institutional change need preceding cultural change? The appropriate lag between cultural change and institutional change is going to be a point of interest, along with potential moderators. For example, the average duration of a party government in parliamentary democracies is relatively short, approximately 600 days (Woldendorp, Keman, & Budge, 2013), indicating that under that political system cultural change can quickly become institutional change. On the other hand, dictatorships tend to be extremely long lasting and multigenerational, with some estimates putting their average duration at over 40 years (Przeworski, Alvarez, Cheibub, & Limongi, 2000). Gaddafi, for instance, was the dictator of Libya for 42 years (i.e., 1969 to 2011). As we proceed in this direction, we should also be better situated to address issues of causality. Though correlational results as obtained here cannot definitively provide causality, changes that happen afterward cannot predetermine those that happen before.
Overall Discussion
As summarized and supported by the Association for Psychological Science’s (APS) president Gallistel (2016), the U.S. Presidential Executive Order 13707 “emphasizes the applicability of psychological sciences to governance” (p. 5) as well as calls for psychology to more fully engage in these issues. In line with this directive, we sought to better understand the connection that culture has to well-being, both financial and subjective, in several large data sets, taking a multidisciplinary approach. We first reviewed the meta-analytic record, finding support but also notable lacunae. Research tended to congregate around the individualism dimension and sporadically examined several facets of SWB. Amending these points of neglect, we conducted a comprehensive survey that measured culture and a broad array of SWB elements. We also assembled and employed several new databases to enable national-level examination of culture and different measures of national success across three time periods, matching data temporally. The overall finding is one of relevance. Culture is closely connected to well-being, but it can be complex and counterintuitive, with relationships shifting from individual to national levels of analysis.
For individuals, cultural values are among the most important trait predictors of salary we have yet uncovered. Essentially, values related to working hard, working well with others, and delaying gratification are all linked to financial success. For example, each standard deviation increase in future orientation is associated with an extra $9,000 in salary. However, when we switch our focus to SWB, we find that results can change. Overall, cultural values have a stronger association than salary with SWB, except sensibly with pay satisfaction. This is primarily due to cultural values, like low individualism, that are associated with social capital or an interpersonal focus. Notably, achievement motivation, which predicted higher salary, also predicted reduced SWB. At the individual level, this provides unique direct support for Easterlin’s (2001) observation, that “subjective well-being varies directly with income and inversely with material aspiration” (p. 481). Alternatively, A. Smith (1759) wrote about this possibility in his Theory of Moral Sentiments, where he argued that the belief of wealth bringing happiness was a useful deception, as despite being false or at best extremely unreliable, it creates productivity and industry (Ashraf, Camerer, & Loewenstein, 2005).
As we moved from the individual level to the national, isomorphism in direction was common despite the size of these associations often increasing. Wealth’s association with SWB shot from 0.18 at the individual level to an average 0.60 using per capita GDP. Culture kept pace and maintained its relative advantage, accounting for over half the variance across the decades and SWB indices (average R2 = .52). Culture and wealth or government effectiveness (corruption) indices were tightly connected (see Figure 2). Notably, there was a significant and strong interaction between individualism and wealth at the national level. Uncertainty avoidance was also important, incrementally predicting above wealth and governance/corruption. As for masculinity, it tended to be negatively related to SWB and predicted debt and its increase.
Consequently, what does a happy culture look like? Hofstede (2001) reviews the causes, correlates, and origins of all four cultural values. Borrowing on his comprehensive work, low power distance is seen more frequently in technological societies with representational government and a good basic educational system. There is a strong middle class and though there should be considerable national wealth, it is also widely distributed. Indeed, high power distance is partially related to economic inequality (Taras et al., 2012). Individualistic countries emphasize personal freedom. Individualism is associated with social mobility, a strong middle class again, smaller families, a well-funded educational system, urbanization, a wealthy economy based on individual interests (e.g., market capitalism), and again the equitable distribution of wealth. On the other hand, low individualism countries typically stress state socialism, a private life invaded by public interests, political power dominated by interest groups (rather than individual voters), and rigid social or occupational classes. For uncertainty avoidance, it is associated with xenophobia, anxiety, need for clarity and structure, emphasis on law and order, and the belief that what is different is dangerous. Low uncertainty avoidance is associated with risk-taking, openness to innovation, tolerance of diversity, comfort with ambiguity, and the belief in one’s ability to influence the world. Finally, we have masculinity, which had a weak association with SWB though trending negatively. Low masculinity or feminine countries believe that the wealthy pay taxes to help the poor, that there should be a comprehensive social safety net, that international conflicts should be resolved peacefully, and that immigrants should be integrated rather than assimilated. Notably, this is also the exact same constellation of cultural values that maximize social capital (Kaasa, 2015) and thought to be optimal for the global work environment (Erez & Gati, 2004).
Theoretical Implications
The role of culture toward creating the good society has long been disputed and continues to be so. L. E. Harrison and Huntington’s (2000) edited book, based on the 1999 Harvard University Symposium, summarizes this debate. On one side, we have economists, who often take it as “axiomatic that appropriate economic policy effectively implemented will produce the same results without reference to culture” (L. E. Harrison, 2000, p. xxiv). On the other side, we have culture and institutions intimately intertwined, such as Etounga-Manguelle’s (2000) consideration of Africa’s plight, “Culture is the mother; institutions are the children” (p. 75). Our results here support the latter of these positions as well as inform it.
Culture and institutions should be reciprocally related
We found strong connections between culture and institutions, with power distance and uncertainty avoidance having the most theoretical and empirical support for a reciprocal relationship. Though as Porter (2000) and Pryor (2005, 2009) review, culture is so tightly coiled with the environment that it is difficult to disentangle the two, some success can be had. From a functional theory perspective of culture, institutions create environments, which would then be best navigated by adopting a particular set of values. Inglehart and Welzel (2005) as well as Lehman, Chiu, and Schaller (2004) draw a similar conclusion from an evolutionary psychology or sociology standpoint, referencing “cultural fitness.” For example, Onraet, Van Assche, Roets, Haesevoets, and Van Hiel (2017) found that conservatives tend to be happier in countries with higher perceived threat levels.
From a neo-institutional perspective, as described by Kara and Peterson (2012), institutions can arise from the desires and values of those with influence. Alternatively, as the historians Durant and Durant (1968) put it, “Society is founded not on the ideals but on the nature of man, and the constitution of man rewrites the constitutions of states” (p. 32). The broader and more deeply adopted cultural values become, the harder it is to obtain a sufficient base to create or maintain institutions incompatible with those values (Licht et al., 2007). For example, colonialism creates highly extractive and hierarchical societies, which are often perpetuated even after independence. Top-down efforts to subsequently create institutional change, such as through foreign aid, tends to be subverted and ineffective (Acemoglu & Robinson, 2012). However, cultural regeneration is more likely to stop when new generations, especially those that include members of the elite, start to adopt egalitarian beliefs and seek to express them in terms of institutional change (Inglehart & Welzel, 2010). While this observation has early roots (e.g., de Tocqueville, 1835), it has been replicated many times (Dutta & Mukherjee, 2012; Licht et al., 2007; Zheng et al., 2012), including Mathers and Williamson’s (2011) finding that their cultural index influenced the success of capitalistic institutions and economic prosperity.
Combining these perspectives is what Oishi and Graham (2010) called the socioecological approach, where culture and institutions can see-saw back and forth, creating homeostasis and remarkable stability if institutions capture or become the dominant means of cultural transmission. As Acemoglu and Robinson (2012) note, despite their skepticism regarding the role of culture, autocratic societies highly value and take tight control of media and other ways in which ideas and values can be disseminated. A contemporary case is China, which is continuing a long tradition of using a variety of mechanisms, including education, to propagate cultural values that are more consistent with their political systems (Buckley, 2014; Stockmann & Gallagher, 2011). By restoring or, better yet, maintaining culture as part of the economic–political process, mechanisms of change and stability become paramount, which include “the family, educational systems, political systems, and legislation” (Hofstede, 2001, p. 11). For example, the stories read to children are a potential means of cultural transmission and a legitimate focus of study (Engeser, Rheinberg, & Möller, 2009; Weber, 1904/2001). And as an illustration of both, consider North Korea’s state endorsed children’s book The Butterfly and the Cockerel, which “tells the story of an irascible, bullying rooster (the United States) outwitted by a small, virtuous butterfly (North Korea)” (Fifield, 2015).
Culture and levels of analysis
Our final hypothesis assessed individual-group discontinuity (Oishi, 2012). Cultural values should generally be isomorphic in direction, though increasing in strength at the national level. Power distance and uncertainty avoidance showed this pattern. One notable exception to cultural isomorphism is the social dilemma, where emphasizing individual success can be detrimental to the overall group (Campbell & Sowden, 1985). Consistent with the social dilemma, individualism (which focuses on self-interest) and masculinity (which focuses on competition) have the potential to reverse. Individualism, however, was difficult to interpret due to the third variable problem; both national individualism and SWB are argued to be caused by wealth. Still, it represents a form of individual-group discontinuity, where individualism is associated at the individual level with less wealth, lower SWB, and an introverted personality, while at the national level, it was strongly associated with more wealth, higher SWB, and reflects an extroverted society. This suggests that individualism is best expressed as a broader, social license for independence. In other words, ideally, we live in a country where we have freedom to choose our own path, and then be the type of person who independently chooses to value community.
Masculinity showed mixed isomorphism. For SWB, it was consistent both theoretically and empirically at both an individual and a national level of analysis: negative. The social capital generated by feminity, such as helping or trusting others, predicts happiness. This included achievement orientation, where despite its positive relationship with pay, it predicted decreased satisfaction, including decreased satisfaction with pay itself. This favors the economic explanation (i.e., the happy peasant/frustrated achiever theory) over the psychological; the added work that achievement orientation entails take its toll, with those part-time employed about as happy as those full-time, likely because increased leisure opportunities is a compensating factor.
For wealth, masculinity, particularly its facet of achievement motivation, appears to be a classic example of the social dilemma. Where it was positively related to wealth at the individual level, at the national level it was negative. And aside from the strong negative correlation with GDP per capita itself, masculinity predicted increases in governmental debt. Despite several proponents arguing that achievement orientation remains isomorphic at both individual and national levels of analysis (e.g., Ferguson, 2011; D. C. McClelland, 1961; Weber, 1904/2001), it is increasingly hard to maintain that masculinity is a characteristic of a successful nation, either in terms of financial prosperity, government effectiveness, or happiness. Though masculinity is connected with financial success at the individual level, it appears that generalizing this expectation to nations is among our most enduring and widespread instances of the “ecological fallacy,” where relationships fail to replicate across levels of analysis (Ashkanasy, 2011; Taras et al., 2010).
In all, this suggests our personal values can be an undependable guide for preferred societal values. Our capacity to take this perspective, however, is likely limited. Lived experience will often stress the financial benefits of competition over cooperation, despite a solid case can be made for prosperity being the result of cooperative trade, trust, and reciprocal altruism (Horváth, 2013; Ridley, 2010).
Uncertainty avoidance and SWB
Most societies appear to have greater levels of uncertainty avoidance than their environment warrants. Steven Pinker, for example, reviewing the historical decline of violence, concludes “we are in the most peaceful time of our species’ existence” (Rochester, 2010, p. 341). Still, levels of anxiety, which is the central component of uncertainty avoidance, have been steadily rising, particularly in the United States. As Twenge (2000) notes, “The average American child in the 1980s reported more anxiety than child psychiatric patients in the 1950s” (p. 1007). Several researchers have argued that this is not an accident, that there is a manufactured “Culture of Fear” (Füredi, 2006).
As mentioned, this partly reflects the politicization of fear. Aside from the inherent level of uncertainty, high or low, there are political advantages toward manipulating it. It also reflects market forces as losses loom larger than gains—fear is a useful frame to gain media attention or expand a viewing audience (Glassner, 2009). In short, there is a firm psychological basis to the journalistic adage “if it bleeds, it leads.” The constant media reinforcement of vivid but rare dangers creates what Kahneman (2011) terms an availability cascade, which “inevitably leads to gross exaggeration of minor threats” (p. 144). As a result, we get irrationally heightened uncertainty avoidance, where people fear dying, for example, less than they fear dying of a terrorist attack (i.e., a subset of dying). This becomes particularly pernicious when rarity results in the media becoming the primary source of information on the matter. In the absence of disconfirming personal experience (i.e., the contact effect), those having the least contact with minority or immigrant groups are among the most likely to fear them (Pettigrew & Tropp, 2013).
The politics and commercialization of fear are potentially two pathways where a society artificially becomes more fearful and less happy. Having this knowledge, however, does not tell us what to do with it. For example, if the media is indeed creating a culture of fear to expand their viewing audience (e.g., vastly overstating the extent of Ebola concerns in the United States; Evans, 2014), should we regulate what is broadcast to increase national well-being? Though there may be incentives in societies for making people less happy, as we later discuss in the limitations, this should not necessarily result in intervention.
Limitations and Directions for Future Research
Spanning multiple data sets, individual and national levels of analysis, four decades, and 48 countries or regions, this present study is among the most comprehensive attempts to quantitatively assess the relationship between culture and SWB. Still, a number of questions remain unanswered. First, there is the standard issue of measurement, which is almost always an area of contention regardless of the topic. This extends to our measure of GDP per capita, with some recommending GNI (Gross National Income) per capita as a better measure of wealth (Delhey & Kroll, 2013), to debates on the best measure of governance (Voigt, 2013), though previous cultural investigation has largely found them as interchangeable (Inglehart & Welzel, 2010). We focus on the newly developed SWB and cultural indices.
Regarding the aggregation of Veenhoven’s WDH, this is presently the most extensive effort to make a comprehensive international assessment of SWB. However, the underlying surveys it is based on do contain measurement errors. As Diener and Seligman (2009) argue, “Current measurement of well-being is haphazard, with different studies assessing different concepts in different ways” (p. 202). This may have acted to our benefit though, where the meta-analytic aggregation of multiple methodologies reduced the issue of acquiescence. Also, to some extent, this concern is ameliorated by Veenhoven’s effort to place all the scales on a common 0 to 10 metric as well as our own efforts to mathematically equate different scales. Still, refinements to the process are being made and the database is continuously being expanded (Kalmijn, Arends, & Veenhoven, 2011). Given the increased interest and measurement in national well-being over the last decade (Delhey & Kroll, 2013), future aggregations of the WDH could improve our measurement base, such as increasing the number of overlapping points, which facilitates linear equating.
We also used Hofstede’s framework to conceptualize culture. Although the model has been among the most popular and has been validated in numerous subsequent studies, it is not without limitations (Blodgett, Bakir, & Rose, 2008; McSweeney, 2013). Most research has been done with individualism, often more than all other values combined. Rectifying this favoritism should be fruitful (Taras et al., 2010). Also, our national-level data is meta-analytically aggregated from scores of cultural scales, of which the scales we used for our individual-level analyses are a subset. While this does broaden the assessment domain at the national level, it injects a degree of measurement variance, diminishing how well individual and national-level data can be compared. For uncertainty avoidance, where we thought this was a concern, we employed metaBUS data to compensate for the absence of the anxiety facet at the individual level. Ideally, we would have both individual level and national level fully nested, allowing for hierarchical linear modeling. Though we cannot retroactively create such a data set, the World Value Survey continues to be conducted on a regular basis and it can be configured to provide analogs for at least one of Hofstede’s dimensions (Minkov & Hofstede, 2012).
As an additional measurement issue, most of our work was at the overall dimension level, with possible differential effects at the facet or subdimension level, particularly for uncertainty avoidance which has aspects tapping into both anxiety and need for structure and rules. Similar, different relationship between SWB and facets have been found at the personality level, suggesting a better understanding of the underlying processes available with a more detailed examination (Albuquerque, de Lima, Matos, & Figueiredo, 2012; Quevedo & Abella, 2011; Steel et al., 2008). Furthermore, with its focus on the cultural values identified by Hofstede, our analysis did not include other values that may be equally relevant. Other popular models of culture may also be useful for explaining the effects of culture on satisfaction, such as Ralston et al.’s (2011) update of the Schwartz Value Survey (Schwartz, 1994) or the GLOBE project (House et al., 2004). Ye, Ng, and Lian (2015) have made some inroads with the latter of these two and though not examining GDP per capita or governance, they did find similar results for power distance and individualism though opposite for uncertainty avoidance (which notably focused on the rule compliance rather than the anxiety facet of the construct). Taras et al. (2009) provide an extensive list of other cultural values worthy of study and consumerism or materialism, argued as beneficial by Ferguson (2011), is worth reexamination; others argue that materialism is actually associated with overspending and excessive debt, leading to economic collapse (Garðarsdóttir & Dittmar, 2012). Inglehart and Welzel (2005) make an extended case that successful nations shift into a postmaterialistic mindset, similar to Maslow’s need-pyramid perspective, with countries that exemplify materialism are actually at the very bottom of the socioeconomic ladder. Also, W. Ng and Diener (2014) conducted an extensive Hierarchical Linear Modeling study on SWB using Gallup World Poll data, finding that while postmaterialist needs (i.e., respect, autonomy, social support) increase in importance for wealthier countries, materialism is consistently negatively related with SWB. Finally, Ahuvia (2002) makes a theoretical argument that those connecting consumption with SWB at a national level are doing so erroneously, confusing the construct with individualism.
In particular, Moral Foundations Theory (MFT) should be examined (Graham, Haidt, & Nosek, 2009). Given that moral values overlap with cultural values (Sverdlik, Roccas, & Sagiv, 2012), it is unsurprising that MFT’s typology of values overlaps with Hofstede’s model (e.g., power distance and MFT’s authority dimension or femininity and MFT’s caring dimension), but it also extends it (e.g., MFT’s sanctity dimension), is similarly related to political ideology, and can be examined at a national level (Graham, Meindl, & Beall, 2012). Unfortunately, only Hofstede’s framework has the longevity and popularity to generate the substantial body of empirical literature needed for a well-estimated meta-analysis. As the other models gain acceptance and grow a foundational body of work, we may be able to address this gap and use these alternative frameworks to revisit the research questions addressed in the present study.
Related to morality, as a topic of study is the role of religion and the accompanied cultural values and practices it promotes. Although we did not support Ferguson’s (2011) backing of the Protestant work ethic hypothesis, he did take a broader perspective that religions matter in general, from Confucianism to Islam to Catholicism, and that other religious-related cultural elements play an important role, such as the development of prosocial traits of trust and honesty. The exact effect of religion is in dispute, with findings indicating both a positive (Inglehart et al., 2008) and negative (Oishi & Schimmack, 2010) association with SWB, possibly hinging on whether the religion is hierarchical in nature (Kaasa, 2015). In the same way that political perspectives can be adaptive, depending on the environment, there is a body of scholars who argue the same for religious values (e.g., Norenzayan et al., 2016; Sosis, 2009; Wilson, 2005). For example, K. Lee and Ashton (2012) credit religion for dissolving in the United States the otherwise dependably negative relationship between conservatism and honesty-humility. As Purzycki and Sosis (2009) conclude, religious behaviors can enhance long-term relationships and trust, which in turn “sustains communities and promotes social coordination and cooperative behavior” (p. 253-254). Through its development of cultural values, religion can potentially be a partner in forming political and economic institutions (Chandan, 2013; Fukuyama, 1995; Laver, 2010).
In addition to the cultural effects of religion, we would also want to take a closer look at the relationship between values and practices in general. At the individual level, values typically precede actions, providing the motivation to enact them (Verplanken & Holland, 2002). However, as Taras, Steel & Kirkman (2010) review, consistent with the reciprocal aspects of our model, the relationship at a national level can be more complex, with “recent research showing that the relationship between values and practices can be a two-way street, and that values can be a consequence of practices rather than a cause” (p. 1334). To better translate this research into public policy, we need to have a better idea of whether values cause or are caused by practices, particularly government and political institutions (e.g., Inglehart & Welzel, 2005; Pryor, 2005; Voigt & Park, 2008), a notably understudied topic at a quantitative level (Steel & Taras, 2010). For example, determinants of the speed and success at which immigrants acculturate to their host country, essentially person–nation fit, is almost completely neglected at a value level (Taras et al., 2013), despite person–organization fit having a well-developed and deep history (Kristof-Brown et al., 2005). With regular migration crises, such as with Syria at the time of this writing (Yazgan, Utku, & Sirkeci, 2015), this alone justifies closer examination of the topic.
We should also seek to establish optimal levels of culture and supporting institutional environments. Partly, this reflects the problem of value-pluralism, where moral values can be individually good but still in conflict with one another. One classic manifestation involves power distance and individualism as both appear to benefit from wealth and its equitable distribution. Though wealth and equality tend to be positively related, at some extreme point, efforts to more evenly enable prosperity throughout a society (e.g., through assisting entrepreneurial activities, enabling the acquisition of skills, or limiting any negative rent seeking practices of plutocrats) will stop creating wealth and start destroying it. Similarly, individualistic countries emphasize market capitalism and freedom of choice but, as the conservative icon Friedrich Hayek adeptly argues, equality before the law and equality of opportunity necessarily result in material inequality, that is the rich and the poor (Hayek & Hamowy, 2011). There must be some optimal level or broad band of equality or inequality, with excessive equality happening at extreme forms of socialism (e.g., the former USSR or Mao Tse-Tung’s China). Despite this caution, we presently do not precisely know when this occurs as it fails to manifest within our database of countries, as per Figure 4, which does not yet indicate any downward effect that suggests we have yet reached excess.
Finally, we can question to what degree happiness should be an indicator for a good life. Baumeister, Vohs, Aaker, and Garbinsky (2013) argue that a happy life is not necessarily a meaningful one, and Henriques, Kleinman, and Asselin (2014) propose a four-factor model of well-being comprised of objective and subjective elements. This position replicates at a national level, with Kroll and Delhey (2013) arguing for a similar array of indicators. There is considerable debate regarding what weights each indicator should be given (Eckersley, 2009; De Prycker, 2010; Tov & Diener, 2007), particularly regarding the role of freedom in a desirable society. Famously, Isaiah Berlin (1969) warned against an extremely feminine society described as a “nanny” state, where efforts to ensure our well-being impinge upon our liberty. If this is acceptable, the question becomes how far we can extend this principle. Sometimes we favor benevolent paternalism, such as helmet laws, and other times we favor freedom, such as the rejection of New York City’s giant-soda ban (Fairchild, 2013; Huang, 2010). This complicates matters. First is simply practical, that there is the strong possibility of ephemeral or unintended consequences (Judge & Kammeyer-Mueller, 2011), with those aforementioned helmet laws reducing fatalities mainly by getting people to ride bicycles less. Second, because freedom can be valued for itself, aside from its benefits or costs, there is no single notion of the good society (e.g., hedonic versus eudaimonia; McMahan & Estes, 2011). Some nations and people will value liberty more than happiness or wealth, such as Heath (2002) noting that “When given a choice between liberty and efficiency, Americans consistently choose liberty, even when it makes life more difficult for them” (p. 7) or Savani and Rattan (2012) concluding that “the culturally valued concept of choice contributes to the maintenance of wealth inequality” (p. 1). Returning to Isaiah Berlin (1990), he himself later came to understanding this tradeoff explicitly:
liberty—without some modicum of which there is no choice and therefore no possibility of remaining human as we understand the word—may have to be curtailed to make way for social welfare, to feed the hungry, to clothe the naked, to shelter the homeless, to leave room for the liberty of others, to allow justice or fairness to be exercised. (p. 12)
Consequently, as this research field progresses and we develop a better understanding of the interplay among culture and institutions as well as their outcomes of wealth and happiness, it still doesn’t definitively provide us with what we should do with this knowledge.
Conclusion
Originating during the French Revolution and the fight for democracy, the tripartite motto of France, “Liberté, égalité, fraternité,” appears to be well chosen. To the extent that liberty represents the freedom associated with individualism, equality refers to low power distance, and fraternity (despite the gender reversal) represents the concern for others associated with low masculinity, France’s slogan champions cultural values associated with the happy nation. If the motto could be expanded to include “low uncertainty avoidance”—or perhaps “faible anxiété”—the parallelism with cultural values and the use of consonance would be complete. The extent that other nations will also adopt these values as ideals is not entirely clear. Consistent with the research into well-being indicators (Diener & Seligman, 2009), cultural values are inherently value-laden, making them politically controversial (e.g., Altemeyer, 1988; Federico, Hunt, & Ergun, 2009; Jost et al., 2003; Oishi et al., 2011; Okulicz-Kozaryn et al., 2014).
The happy culture does not equally represent both sides of the political spectrum, and thus requires a balance among competing forces. This position is probably best summarized by Murray Rothbard (1965) who, in the first editorial of the libertarian journal Left and Right, concluded that neither political party had a monopoly on wisdom. More recently, the political philosopher Jason Brennan (2012) argues educated and informed voters, those who vote well, tend to support public policy that spans the political spectrum. Still, exactly how to achieve “this best balance” or optimize the factors that create the happy culture depends in part on each nation’s particular state of affairs and will continue to be debated. We hope here to add clarity to the debate and to help shape the discourse more productively.
Footnotes
Declaration of Conflicting Interests
The author(s) declared no potential conflicts of interest with respect to the research, authorship, and/or publication of this article.
Funding
The author(s) received no financial support for the research, authorship, and/or publication of this article.