



Abstract
Research suggests that the longer firearms remain in circulation following their first known use in a crime, the more likely they are to be used in multiple offenses. However, little is known about how repeat-use firearms journey in time and space from one crime to another. This study uses spatially and temporally referenced crime data from Houston, Texas, to address four questions: 1) How far do repeat-use firearms travel between crime incidents? 2) How many days elapse before the same firearm is used again in another crime? 3) Is there a relationship between time and distance for repeat-use firearms? 4) What factors are associated with the distance and time between repeat-use firearm incidents? Results from spatial analysis indicate that the median straight-line distance between matched gun crime cases is 4.33 mi, with a median traveling time of 59 days. Results show a significant relationship between time and distance for repeat-use firearms, even after accounting for initial offense type, including homicide, assault, deadly conduct, robbery, and criminal mischief. Exploratory findings reveal that guns journey faster from one crime to another in more densely populated neighborhoods and when the initial offense is robbery, and that guns first used in robberies tend to travel greater distances between crimes relative to other offense types. Overall, these findings suggest that repeat criminal gun use occurs within a relatively short time frame, that firearms move only short distances between incidents, and that both offense type and local population context are associated with the spatiotemporal movement of repeat-use firearms.
Introduction
The U.S. has long been regarded as the most “homicidal society” in the Western industrial world (Beeghley, 2003, p. ix). While numerous factors contribute to this reality (see Messner & Rosenfeld, 2012; Roth, 2009), pervasive gun culture and the prevalence of gun-related crime stand out as key features behind the nation’s relatively high homicide rates (Bellesiles, 2000; Hepburn & Hemenway, 2004). Between 2006 and 2023, firearms were involved in a substantial share of violent incidents, serving as the weapon of choice in roughly 70% of all U.S. homicides during that period (Statistica, 2025). Given the threat that gun violence poses to public safety and health, scholars have devoted considerable attention to understanding and mitigating its occurrence.
Much of the existing literature focuses on how socio-demographic, structural, and environmental factors shape the likelihood and distribution of gun-related crime (e.g., Dong et al., 2024; Kravitz-Wirtz et al., 2022; Larsen et al., 2017; Levine et al., 2021; MacDonald et al., 2022; Papachristos et al., 2012; Thomas et al., 2022; Xu & Griffiths, 2017), producing an impressive body of knowledge that has informed crime prevention efforts (e.g., Braga et al., 2022; Jiao, 2023; Koper & Mayo-Wilson, 2006). However, this strong emphasis on “gun crime” has led to a relative lack of understanding about “crime guns” themselves, with the literature inadvertently “ignoring the possibility that one crime gun could be involved in multiple gun crimes” (Scott et al., 2023, p. 1). In this vein, research has begun to explore the “time in crime” of firearms—the period during which guns are used in criminal activity (Dierenfeldt et al., 2024)—particularly focusing on the factors that contribute to a gun’s repeated use in multiple offenses (Scott et al., 2023). To further advance this line of inquiry, Dierenfeldt et al. (2024, p. 738) call for research that delves into the “life course” of crime guns, urging scholars to examine the “temporal and spatial aspects of [their] movement between their initial use [and] their use in subsequent offenses.”
The current study leverages spatial and temporal-referenced crime data from Houston, Texas, to answer this call. To that end, we evaluate four interrelated research questions: (1) How far do repeat-use firearms travel between crime incidents? (2) How many days elapse before the same firearm is used again in another crime? (3) Is there a relationship between time and distance for repeat-use firearms? (4) What factors are associated with the distance and time between repeat-use firearm incidents? By answering these questions, this study offers a novel assessment of how guns journey through time and space from one crime to another. Tracking the spatial and temporal dimensions of the repeated use of crime guns can deepen our understanding of gun crime and be crucial for informing law enforcement strategies, enhancing crime prevention efforts, and shaping broader policy discussions on gun violence and homicide in the U.S.
Literature Review
One of the most salient findings in the extant literature demonstrates that gun violence, much like crime in general, tends to cluster within a small number of places (Braga et al., 2010; Dong et al., 2024; Hipple et al., 2020; Koper et al., 2015; MacDonald et al., 2022). This means that relatively few locations account for a substantial share of gun assaults rather than being uniformly distributed across a more expansive area. Research by Koper et al. (2015), for instance, revealed that roughly 8% of street segments were responsible for a staggering 64% of shootings in Minneapolis from 1990 to 2014. Hipple et al. (2020) showed that around 15% of block groups in cities like Detroit, St. Louis, and Milwaukee accounted for 50% of all lethal and non-lethal shootings between 2014 and 2015. Likewise, MacDonald et al. (2022), studying the upsurge in shootings during the COVID-19 pandemic, found that 10% of census block groups accounted for 44%, 57%, and 74% of all shootings in the cities of Philadelphia, Los Angeles, and New York, respectively.
This spatial concentration of gun violence in American cities is in part driven by the phenomenon of near-repeat gun assaults. These assaults point to a pattern whereby an initial shooting at a particular location can give rise to subsequent shootings that occur close in both space and time. As such, a victimized location and its immediate surroundings face an increased risk of repeated victimization (see Ratcliffe & Rengert, 2008; Wells et al., 2012). While the precise mechanisms driving near-repeat shootings have not been sufficiently studied, the communities and crime literature, including Anderson’s (2000) “Code of the Street,” suggests these patterns may emerge in socially isolated urban settings where structural disadvantages give way to cultural adaptations that promote violence and toughness to protect against perceived slights or disrespect. Commitment to this code, according to Kubrin and Weitzer’s (2003) findings, is a primary predictor of retaliatory homicide, evidencing why an initial shooting often precipitates a subsequent one, especially in locations that attract illegal activities.
Prior research also links opportunity-based and socioeconomic environmental risk factors to shooting hot spots. For example, locations that distribute alcohol, such as liquor stores and nightclubs, are at elevated risk of experiencing gun violence (Morrison et al., 2017; Xu & Griffiths, 2017; see Boggess et al., 2025 for opposing conclusions), likely due in part to the incendiary role of alcohol in aggressive behavior and gun crime (Branas et al., 2016). Studies also show that areas with greater levels of economic disadvantage, a higher proportion of minority residents, gang activity, co-offending networks, and a larger youth population are significantly more likely to be exposed to gun assaults (Kravitz-Wirtz et al., 2022; Larsen et al., 2017; Levine et al., 2021; MacDonald et al., 2022; Papachristos et al., 2012, 2024; Thomas et al., 2022). Similarly, environmental factors related to physical decay, such as vacant lots and residential foreclosures, have been found to generate or attract gun-related crimes (e.g., Xu & Griffiths, 2017).
Crime Guns
In addition to offering valuable insight into patterns of gun violence, the literature has also looked into the dynamics surrounding the firearms that are used in these crimes. For instance, scholars have determined that despite the overwhelming majority of guns in the U.S. originating via the legal firearm market (Braga, 2017), most gun crimes are perpetrated with firearms that were illegally acquired (Braga et al., 2012; Braga & Cook, 2016; Kennedy et al., 1996). Individuals with arrest records frequently report that illegally obtaining a firearm is both quick and easy. Decker et al. (1997) found that about 20% of surveyed arrestees suggested they could locate and obtain a gun within a day, and over one-third said they could do so within a week.
Indeed, with seemingly few barriers impeding access, illegal firearms can be acquired through a variety of sources, ranging from family and friend networks to street sources such as drug dealers, fences, and illicit gun brokers (Braga et al., 2021; Collins et al., 2017; Cook, Parker, & Pollack, 2015; Cook, Harris et al., 2015; Hureau & Braga, 2018; Kennedy et al., 1996). Once in circulation, crime guns are likely to change hands frequently and be illegally used or possessed by multiple individuals before they are discarded or seized by police. The exchange of crime guns is, in part, driven by the fact that those who illegally possess firearms are often embedded in networks (Gill & Fox, 2022) of similarly situated individuals (e.g., gangs), which facilitates the relatively effortless transfer of guns from one individual to another (Cook et al., 2007). In this way, crime guns may remain in circulation for considerably extended periods (Cook et al., 2007; Cook, Parker, & Pollack, 2015; Cook, Harris, et al., 2015; Goldsmith et al., 2022; Scott et al., 2023), raising important questions about the life course of such weapons.
The Life Course of Crime Guns
A growing body of research has explored a gun’s “time to crime,” which refers to the amount of time that passes between a firearm’s initial sale at retail and its recovery by police from a crime (Brandl & Stroshine, 2011; Pierce et al., 2004). The Bureau of Alcohol, Tobacco, Firearms, and Explosives (ATF), using firearms trace data, considers 3 years to be a fast time to crime (Kennedy et al., 1996). Along with providing key information regarding inter and intra-state gun trafficking, research in this area has also established that new firearms are more often used in crime than old firearms, semiautomatics are preferred over non-semiautomatics, and higher power handgun calibers, such as the 9 mm and the 0.380 dominate the crime gun market (Braga et al., 2021; Cook & Braga, 2001; Hureau & Braga, 2018; Kennedy et al., 1996; Pierce et al., 2004; Wintemute et al., 2005).
Recently, Dierenfeldt et al. (2024) partitioned the life course of crime guns to explore a gun’s “time in crime,” referring to the period between a firearm’s first known use in a criminal offense and its subsequent recovery by police. Drawing on National Integrated Ballistic Information Network (NIBIN) lead logs provided by the Chattanooga Police Department, Dierenfeldt et al. (2024) revealed that the average crime gun remains in circulation for 158.54 days. They also found that neighborhood disadvantage and gang involvement during the initial offense are significantly associated with a longer time in crime. Notably, Scott et al. (2023), using the same data as Dierenfeldt et al. (2024), found a positive and statistically significant relationship between a gun’s time in crime and its likelihood of being used in multiple offenses.
The Current Study
Overall, the existing literature indicates that gun assaults are spatially concentrated and typically involve a relatively small group of offenders who depend on illegally obtained firearms—guns that often remain in circulation for extended periods and are likely repeatedly used in multiple crime incidents. However, despite these valuable insights, fundamental questions remain unanswered. In particular, little is known about the time that elapses and the distance traveled between a firearm’s initial known use in a criminal offense and its subsequent use in other offenses. While prior research has explored factors that influence a gun’s time in crime (e.g., Dierenfeldt et al., 2024) and repeated use (e.g., Scott et al., 2023), the present study contributes to the literature by examining the gun’s spatial-temporal journey from one crime to the next. Gaining a more robust understanding of how firearms circulate and reappear across criminal events can have critical implications for law enforcement strategies and crime prevention efforts. As such, the current study aims to address the following research questions:
Criminal investigators working gun crime cases in the U.S. often turn to information produced by local (and regional and state) crime labs as part of NIBIN. According to Huff et al. (2024), NIBIN is a national database containing computerized images of cartridge cases and fired bullets collected from crime scenes and illegally possessed guns. In short, NIBIN is a large database of evidence from guns that were used in crimes. NIBIN can be used to generate leads, which are potential, but unconfirmed, matches between two or more pieces of evidence in the database. (p. 4).
NIBIN produces two types of information relevant for investigators: confirmed hits and leads. Confirmed hits are high probability matches that are subsequently visually confirmed by a firearms examiner and denoted as a NIBIN hit. Prior to about 2015, confirmed hits were the primary output of NIBIN comparisons (King et al., 2013). NIBIN leads, which have largely replaced confirmed hits in terms of utility, involve a more expedited review of high-probability matches by a NIBIN technician. Both hits and leads may help an investigator link two gun crimes that were previously not known to be associated by the process of learning that a common gun was used in both crimes. As described below, the current study uses an ancillary data source of NIBIN hits in Houston, Texas, to evaluate our research questions.
By population, Houston is the largest city in Texas and ranks among the top 15 largest cities in America. Since the early 2000s, Houston has had some of the highest rates of gun violence across large Texas municipalities. Among US cities with populations exceeding 1 million, Houston ranks fourth in gun homicide victimization. In 2024, the city had a gun homicide rate of 11.7 per 100,000 residents, following behind Philadelphia (14.2), Dallas (14.4), and Chicago (14.9; Everytown Research, 2025). Against this backdrop, Houston, Texas, offers an ideal site to investigate the spatiotemporal patterns of criminal gun use.
Data and Methods
We leverage a unique data set compiled by the firearms section, located within the Houston Police Department’s (HPD) forensic Crime Laboratory. 1 The data consist of 1,158 internal paper reports produced by the HPD firearms section when a NIBIN hit was confirmed between March 2000 and early April 2012. 2 Each paper report lists a NIBIN hit (linking the same gun to two different crimes), and the dates and street addresses of both offenses. The reports were produced when HPD’s lab confirmed the NIBIN hit, and the paper reports served as an adjunct to the standard NIBIN data system, which did not record addresses. The 1,158 paper hit reports are not a comprehensive set of all gun crimes in Houston, nor of all repeat gun crimes in Houston. The paper hit reports we use only encompass NIBIN hits confirmed by the HPD lab, but they do include some cases that occurred outside of Houston. Thus, our data exclude hits confirmed by other agencies, such as the Harris County Institute of Forensic Sciences. Obviously, a gun crime in which a gun was used only once, or in which a gun was used multiple times but the evidence eluded police collection or entry into NIBIN, is not included in the paper files. Finally, during this time, the firearms section processed all firearms evidence (e.g., firearms and ballistics evidence) and input all available evidence into NIBIN (Stein, 2011).
The structure of the HPD hits data differs slightly from the standard manner in which NIBIN hits are reported. ATF defines a hit as linking two or more crimes involving the same firearm. The HPD hit reports, however, link two crimes (A and B), and only two crimes involving the same gun. Thus, a situation in which the same gun was used at three crimes (A, B, and C) would result in two HPD reports, linking crimes A and B, and crimes A and C. In the analysis below, we are able to denote if a hit-pair is associated with only two crimes (a hit dyad), three crimes (a hit triad), or more. In the end, this slight difference between ATF’s definition and our working definition is minor, but it bears mentioning.
At the time our hit reports were recorded by HPD, the NIBIN database was divided into Regions and partitions (U.S. Department of Justice, Office of the Inspector General, Audit Division, 2005, p. 87). By default, the NIBIN system at HPD searched for possible hits in a Region 2 partition that included Harris, Montgomery, Jefferson, and Fort Bend Counties in Texas. Other partitions in Region 2 or other regions could be searched if an operator selected the particular region (see U.S. Department of Justice, Office of the Inspector General, Audit Division, 2005, pp. 21–22). For years after Hurricane Katrina in 2005, HPD regularly searched against NIBIN sites in New Orleans, as thousands of displaced persons relocated from New Orleans to Houston. And other partitions and regions were searched at the request of an investigator or another lab or law enforcement agency.
We do not know, however, how often the firearms section at HPD opted to search other Regions, or other partitions within Region 2. Thus, it is possible that HPD did not identify hits involving crimes from other Regions. However, we know with certainty that during the time period covered by our data, HPD was automatically searching for possible NIBIN hits within Houston and Harris County, across three other counties proximate to Houston, and for years searching against NIBIN sites near New Orleans.
Data Cleaning, Matching Cases, and Geocoding the Hits
Paper records were manually entered into a spreadsheet (n = 1,158 cases). We first examined duplicate cases based on the incident identification numbers that indicated the two crimes involved in each report. This process revealed 18 duplicate records, leaving 1,140 unique records. Of these, 12 records lacked street address information and were also excluded. In addition, one record matched an incident to itself and was removed. The final dataset consisted of 1,127 records. Each record represents a pair of linked incidents (i.e., a NIBIN hit). Further examination revealed that these linked pairs involved 1,977 unique incidents and were associated with 856 firearms.
Using a network analysis tool (Gephi), we identified firearm records that formed dyadic or triadic linkages across crime incidents, producing a total of 974 hit pairs. Records connected to more than three incidents (n = 153) were excluded from the analysis.
Why did we include only dyad and triad hits? One of our research questions is: “How many days elapse before the same gun is used again in another crime?” To answer this question, the chronological order of the incidents is crucial, particularly for guns involved in three or more crimes. For example, in the dataset, the following pairs are recorded: A–C and B–C. These indicate that crimes A, B, and C are all linked to the same gun (a triad). However, the actual sequence of events is that incident A occurred first, B second, and C last. To accurately calculate the time between consecutive uses of the same firearm, the correct links should be A–B and B–C. Therefore, we restructured the triad records to ensure they reflect the correct temporal order of incidents. In cases where a gun was linked to more than three incidents, determining the correct sequence and restructuring the data becomes substantially more complex and time-consuming. For this reason, we limited the current analysis to dyad and triad hits and ensured that all triads were reformatted to reflect the proper chronological order.
The data were imported into ArcGIS for the initial geocoding of street addresses. At this stage, 93% of Offense A addresses and 89% of Offense B addresses were successfully matched. Many of the unmatched records were due to misspelled street names or missing address suffixes (e.g., Street, Avenue, Drive). To improve the match rate, we conducted a secondary verification using Google Maps. Misspelled street names were searched individually, and in most cases, Google Maps suggested the correct spelling (e.g., “Magnum” corrected to “Mangum”). For addresses missing a suffix, if only one possible street existed, it was assigned accordingly. However, when multiple streets with the same base name but different suffixes existed (e.g., Bellfort Street and Bellfort Avenue), the record was excluded to avoid ambiguity. This second round of address verification improved the geocoding match rate to 97.4%. This rate exceeds the commonly accepted threshold for high-quality geocoded data in spatial analysis (Ratcliffe, 2004a). The final geocoded dataset comprises 949 NIBIN hit pairs, encompassing 1,748 unique incidents and 801 firearms, which constitute the sample for the current analysis.
Analytic Methods
ArcGIS is used for analyzing data to answer the research questions. The geocoded data are projected to the Houston city map using the NAD 1983 State Plane Texas South Central FIPS 40204 Feet Coordinate System. The Euclidean distances between matched gun incidents were calculated to answer the first research question: “How far do repeat-use firearms travel between crime incidents?” Euclidean distance represents the straight-line distance between two points in space, calculated using their geographic coordinates (e.g., x and y values in a projected coordinate system). This measure is appropriate for the current analysis because it provides a standardized, spatially precise estimate of how far a firearm was likely transported between incidents, regardless of road networks or travel routes. Since the goal is to capture the general spatial dispersion of gun reuse rather than the exact path taken, Euclidean distance offers a simple yet effective method to quantify geographic spread between related crimes (Chainey & Ratcliffe, 2013; Groff & La Vigne, 2002).
To further explore spatial patterns, we conducted a neighborhood-level analysis using the City of Houston’s official “super neighborhood” boundaries. Super neighborhoods are geographic areas designated by the city that represent groups of communities with shared physical and social characteristics. There are 88 such areas across Houston, providing meaningful local units for examining whether repeat-use firearm incidents occurred within the same or adjacent neighborhoods.
To address the second research question, “How many days elapse before the same gun is used again in another crime?” we calculated the number of days between the two incidents by subtracting the date of the first offense from the date of the second offense within each matched gun pair. This straightforward time interval measure allows us to capture the temporal pattern of firearm reuse and assess how quickly guns reappear in subsequent criminal incidents.
We used Spearman’s rho correlation test to answer the third research question, “Is there a relationship between time and distance for repeat-use firearms?” Spearman’s rho is a nonparametric measure of rank correlation, making it appropriate for assessing monotonic relationships between time and distance without assuming a linear distribution (Braga et al., 2010; Ratcliffe, 2010). The analysis was conducted by distance and time intervals and stratified by initial offense type to examine potential variation in spatial-temporal patterns across crime categories (Mohler et al., 2011; Weisburd & Green, 1995).
To address research question four, “What factors are associated with the distance and time between repeat-use firearm incidents?” we conducted an exploratory analysis. Because NIBIN records lack information on offenders, victims, detailed incident characteristics, and a valid incident identifier to link with Houston Police Department (HPD) crime data, the explanatory analyses focused on contextual and offense-related factors. Only incidents whose initial offenses occurred within the city boundary of Houston were included; 62 cases outside the city limits were excluded because HPD crime data were unavailable for those areas.
Specifically, we examined whether the type of the initial offense (Homicide, Assault, Robbery, Weapons, Other) and neighborhood-level characteristics of the firearm’s initial offense location were associated with the spatial and temporal separation between linked incidents. Neighborhood variables included population density and local crime density. Population density was measured as the total population per square mile, derived from census tract data. The crime density measure was calculated using HPD crime incidents of weapon offenses and violent crimes (murder, robbery, and aggravated assault) per square mile, representing the spatial concentration of criminal activity in the local environment.
For both outcomes, distance and time were dichotomized at the median (short vs. long) due to the skewness distributions of the two variables, and binary logistic regression models were estimated to assess preliminary associations. These analyses are exploratory and intended to provide contextual insights rather than causal inferences; future work will extend this framework to incorporate additional neighborhood predictors and temporal dynamics.
Results
Results for Research Question 1: How Far Do Repeat-Use Firearms Travel Between Crime Incidents?
The spatial distribution of repeated firearm use in Houston from 2000 to 2012 is illustrated in Figure 1. The frequency distribution of the Euclidean distances between two consecutive incidents involving the same firearm is presented in Figure 2 and summarized in Table 1. The results indicate that the median travel distance was 4.33 mi, while the mean distance was 6.13 mi. The minimum distance was 0 mi, suggesting that in some cases the firearm was used repeatedly at the same location, while the maximum distance of 29.18 mi reflects occasional long-range movements.

Spatial distribution of repeat-use of firearms in Houston, 2000–2012.

Travel distances between two crimes committed with the same firearm.
Travel Distances Between Two Crimes Committed with the Same Firearm.

Overall, repeated firearm uses typically occurred over short distances: about 30% of incidents were within 2 mi of each other, slightly more than 55% within 5 mi, and roughly 78% within 10 mi. Most incidents occurred within Houston, though a small proportion involved locations outside the city—62 initial incidents and 28 subsequent incidents—demonstrating that some firearms were used across different jurisdictions.
Figure 1 shows dense concentrations of linked incidents in central and southeastern Houston, with additional clustering in the western and northeastern areas. The overlapping lines illustrate that firearm reuse largely occurs in high-activity zones, with relatively few connections extending to suburban areas. This pattern reflects both the localized nature of firearm reuse and the jurisdictional scope of HPD data, as the HPD Forensic Crime Laboratory primarily processes evidence from HPD-investigated incidents.
Neighborhood-level patterns in Figure 3 further highlight this localization. Repeat-use firearms were most frequently reused within or between adjacent super neighborhoods on Houston’s Westside, Southeast, and Northeast areas. Specifically, 197 firearms (21.3%) were reused within the same super neighborhood, and 177 firearms (19.2%) in adjacent neighborhoods. In total, 374 firearms (40.6%) were involved in repeat incidents occurring either within the same or neighboring super neighborhoods, indicating that firearm reuse is highly concentrated within geographically proximate areas.

Spatial distribution of firearms traveled within or to adjacent super neighborhood.
Results for Research Question 2: How Many Days Elapse Before the Same Firearm is Used Again in Another Crime?
The time intervals between consecutive crime incidents involving the same firearm are presented in Figure 4 and summarized in Table 2. The analysis shows that the median elapsed time between repeated uses of the same gun was 59 days, which is approximately 8 weeks or about 2 months. The mean of the time interval was substantially higher at 197 days, with a standard deviation of 336 days. The shortest interval was 0 days, indicating same-day reuse, while the longest observed interval was 2,858 days.

Time intervals between two crimes committed with the same firearm.
Time Intervals Between Two Crimes Committed with the Same Firearm.

The distribution of time intervals is highly skewed, with a small number of extreme values pulling the mean upward. Thirteen cases fell beyond four standard deviations from the mean, indicating rare instances in which a firearm remained unused for several years before being used again. Despite these outliers, nearly 27.8% of repeat uses occurred within 2 weeks, and 49.3% occurred within 8 weeks. These findings suggest that while some firearms were reused shortly after the initial incident, more than half were not used again until 2 months or more had passed.
Results for Research Question 3: Is There a Relationship Between Time and Distance for Repeat-Use Firearms?
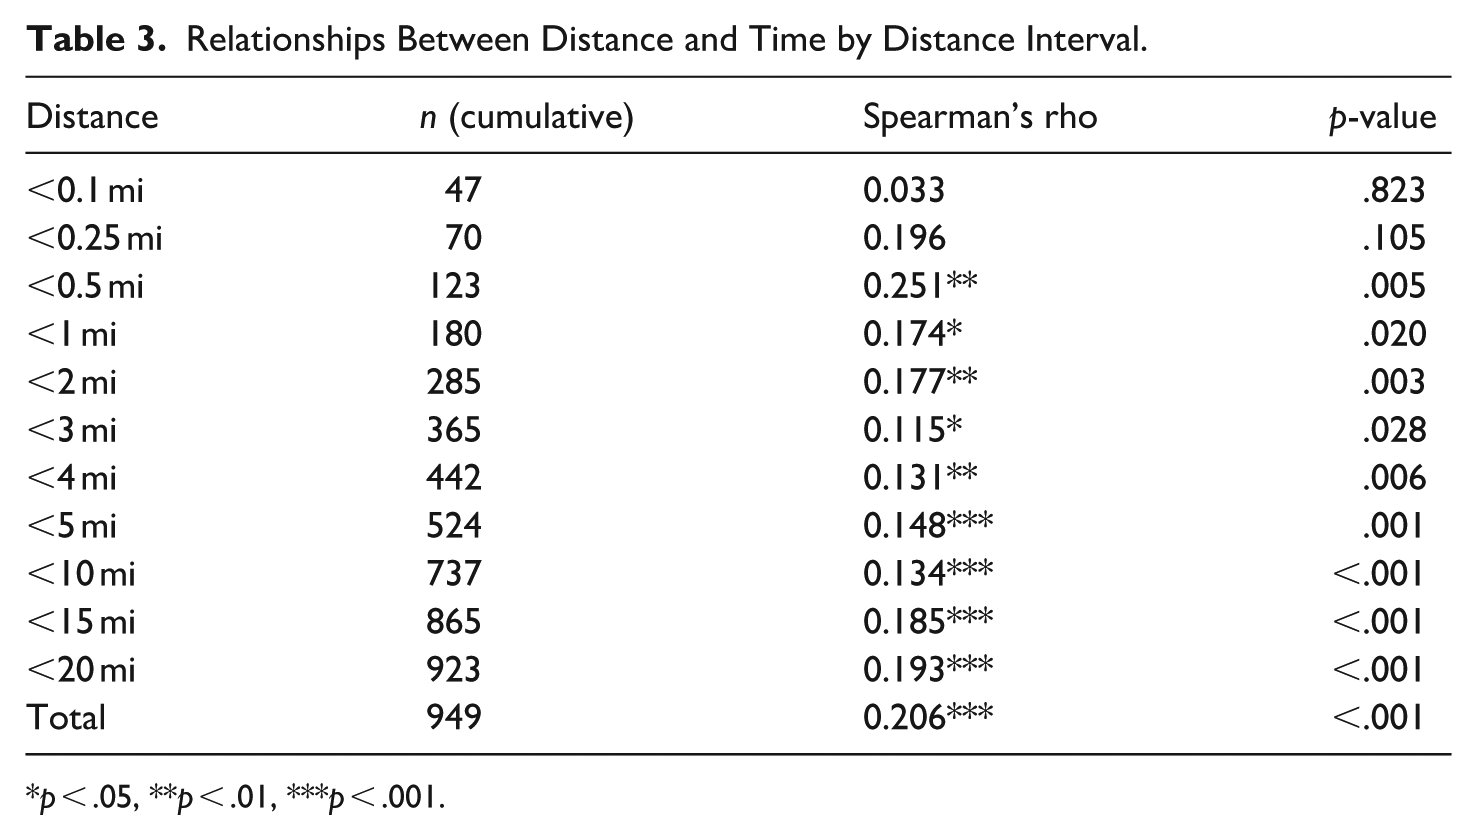
The overall relationship between the time elapsed and distance traveled between two consecutive crimes involving the same firearm was examined using Spearman’s rho correlation. The analysis revealed a statistically significant but weak-to-moderate correlation (Spearman’s rho = .206, p < .001). This indicates that, in general, guns that were reused after a longer period also tended to be used farther away, though the strength of this association is limited.
However, the relationship between time and distance was not consistent across all cases. As shown in Table 3, for the 70 NIBIN hit pairs that involved travel distances of less than 0.25 mi, there was no significant correlation between time elapsed, and distance traveled. In contrast, for all hit pairs involving travel distances beyond 0.25 mi, the relationships between time and distance were statistically significant, although still weak to moderate in strength, with correlation coefficients ranging from .115 to .251.
Relationships Between Distance and Time by Distance Interval.
p < .05, **p < .01, ***p < .001.
The relationship also varied when cases were grouped by time intervals (Table 4). Among the 263 NIBIN hit pairs where the gun was reused within 2 weeks, the correlation between distance and time was weak but statistically significant. However, when the time interval was extended to between 3 and 12 weeks, the correlations were no longer statistically significant. Once the interval exceeded 16 weeks, the correlations became statistically significant again, though the strength of the relationships remained weak.
Relationships Between Distance and Time by Time Interval.

p < .05, **p < .01, ***p < .001.
Further analysis by initial offense type revealed additional variation (Table 5). Of the 947 hit pairs analyzed, 185 were initially linked to homicides, 309 to assaults, 177 to robberies, 95 to deadly conduct, 69 to criminal mischief, and 52 to firearm discharge incidents. The remaining cases involved other types of offenses. The strength of the correlation between distance and time differed by offense type. Specifically, Spearman’s rho was 0.205 for homicides, 0.233 for assaults, 0.161 for robberies, 0.363 for deadly conduct, and 0.240 for criminal mischief. All of these correlations were statistically significant, indicating that although the relationships were generally weak, they were consistent across multiple offense categories.
Relationships Between Distance and Time by Initial Offense Type.

p < .05, **p < .01, ***p < .001.
Results for Research Question 4: What Factors Are Associated With the Distance and Time Between Repeat-Use Firearm Incidents?
The spatial and temporal separation between linked firearm incidents was analyzed using binary logistic regression, with outcomes dichotomized at the median. Table 6 presents the regression results. Firearms involved in robbery incidents traveled significantly longer distances but shorter times between offenses compared with other offense types, while no significant differences were observed for firearms linked to homicide, assault, or weapon offenses relative to the reference category (“Other type of offenses”). Neighborhood characteristics were associated only with temporal separation: higher population density was linked to shorter travel times, whereas local crime density was not significantly related to either outcome. Multicollinearity between population and crime density was minimal (VIFs < 2.5). These exploratory findings suggest that both offense type and local population context may influence the movement patterns of firearms over space and time.
Factors that Influence Distance and Time (n = 886).

p < .01.
Discussion
A growing body of research suggests that information about NIBIN hits or leads, provided in a timely manner, can be invaluable to investigators as they work individual criminal cases (see Huff et al., 2024; King et al., 2017). Until about 2015, however, NIBIN data were rarely used by researchers or police agencies to map or study larger, overall patterns of gun crime in a locale, such as a city or region, which King et al. (2013: 79–85) referred to as strategic uses. This underuse occurred because, prior to 2015, NIBIN information relevant to strategic uses was difficult to extract from the database. Additionally, the addresses of the crimes involved in a NIBIN hit were not recorded (King et al., 2013, p. 85), which precluded the mapping of these hits. 3 Consequently, not much is known about the geographic and temporal nature of the repeated use of the same firearm in criminal activities. This study addresses that empirical gap by leveraging a unique first-of-its-kind ancillary data source of NIBIN hits in Houston, Texas, to explore patterns of repeat criminal gun use.
We used spatial and temporal information on 949 NIBIN hit pairs to answer four research questions: (1) How far do repeat-use firearms travel between crime incidents? (2) How many days elapse before the same firearm is used again in another crime? (3) Is there a relationship between time and distance for repeat-use firearms? (4) What factors are associated with the distance and time between repeat-use firearm incidents? Results show that the median straight-line distance between matched gun crime incidents is 4.33 mi, and the median traveling time is 59 days. Approximately 40% of repeat-use firearms traveled either within the same super neighborhood or to an adjacent super neighborhood, and most matched gun crime incidents occurred within Houston city limits. Results generally demonstrate a significant association between time and distance for repeat-use firearms, with the relationship holding even after accounting for initial offense type, including homicide, assault, robbery, deadly conduct, and criminal mischief. Exploratory findings reveal that guns journey faster from one crime to another in more densely populated neighborhoods and when the initial offense is robbery, and that guns first used in robberies also tend to travel greater distances between crimes relative to other offense types. Taken together, these findings contribute to the literature on the life course of crime guns by suggesting that repeat criminal gun use occurs within a relatively short time frame, that firearms move only short distances between incidents, and that both offense type and local population context are associated with the spatiotemporal patterns of repeat criminal gun use.
Roughly 54% of the repeat-use firearms in our analysis were seized by police, comprising 432 unique weapons. For these seized firearms, we find that the average time between their first known use in a crime and recovery by police was 276 days, which is over 100 days longer than prior research would suggest. For instance, using NIBIN lead logs from the Chattanooga Police Department, Dierenfeldt et al. (2024) and Scott et al. (2023) showed that the average crime gun remained in circulation for approximately 158 to 163 days. This discrepancy between our findings and those of prior research is, however, not surprising given the inherent differences in the samples. Specifically, this study’s sample only includes repeat-use crime guns, whereas prior studies use samples that include guns involved in mostly one and sometimes more than one known offense. Of the 310 and 309 crime guns used in Dierenfeldt et al.’s (2024) and Scott et al.’s (2023) respective analyses, only 101 were identified as being used in multiple crimes before being seized by police, compared to the 432 in our analysis. Against this backdrop, our findings complement the growing body of research on a gun’s time in crime by further indicating that firearms used in multiple crimes are likely to be in circulation for longer periods.
Approximately 20% of firearms in our sample traveled less than a mile before being used again in a crime, with 12.9% traveling less than half a mile and approximately 5% traveling less than 0.1 miles. Meaning, in some cases, the repeated use of the same firearm occurred at the same location or in very close proximity. Likewise, over a quarter (27.8%) of matched gun crime incidents occurred within 2 weeks of each other, 21.4% occurred within a week, and 4.2% occurred within less than a day, which suggests that some crime guns were reused in rapid succession. These spatial and temporal patterns, when considered together, complement prior research by Wells et al. (2012), who uncovered the near-repeat gun assault phenomena in Houston, Texas. Wells et al. (2012) concluded that once a location was victimized by gun assault, there was a 35% chance that a second shooting would take place within 14 days, and within 1 to 400 feet, or one city block, from the original shooting. Our spatiotemporal findings not only demonstrate that the repeated use of the same crime gun can occur within the same general area but also that it can occur within a short time frame, providing some suggestive evidence to support the concept of the near-repeat phenomenon.
To the extent that the repeated use of a crime gun is by the same person, our results also align with prior research on the spatial mobility of offenders as they journey to crime. Drawing on insights from routine activity theory and environmental criminology, Block et al. (2007) highlight the tendency of persons who perpetrate violent crimes to seek targets within (about 2 mi) of spaces most traveled by and familiar to them, known as their “cognitive map”—places near their home, employment, recreational areas, and paths in between. According to Block et al. (2007), these places increase an offender’s odds of successful escape, maximizing efficiency while minimizing travel costs. Therefore, if offenders do not travel far to commit their crimes, it is likely that the firearm they use does not travel far either, as our findings suggest.
Nevertheless, the city of Houston has long faced issues with gangs and gang-related criminal activities ranging from burglary and theft to assault and murder (Brewer et al., 1998; Dawkins & Gibson, 2010; Law, 2024). Gangs are thought to be responsible for a large share of the city’s shootings and violent crimes, with their tentacles stretching into inner city, suburban, and rural environs around Houston (Law, 2024). This gangland context naturally engenders territorial conflicts and the diffusion of gang violence across communities. Because gang leaders will loan or rent out firearms to their members (Cook et al., 2007), crime guns can change hands relatively frequently and be used in multiple offenses (Scott et al., 2023). Therefore, it is more likely than not that some number of NIBIN hit pairs examined in this study are connected to different offenders who have used the same gun in different crime incidents. Insofar as gun reuse is by members of criminally involved groups, the implications of our findings extend beyond the individual offenders’ journey to crime but also speak to the spatial distribution of gang-related activities.
While this study’s findings offer important insights, they must be interpreted in light of the study’s limitations. For example, our analysis was based on NIBIN hit pairs confirmed by the HPD lab and did not include hits confirmed by other agencies, such as the Harris County Institute of Forensic Sciences. The study could not include incidents that did not come to the attention of authorities, and, given logistical constraints, it excluded cases beyond dyad and triad hits. Because of these circumstances, our data most likely underestimates the extent of repeated criminal gun use in Houston and, by extension, might bias our spatiotemporal findings in one way or another. Additionally, our decade-old NIBIN hit-pair sample is limited to a single city in the American South, limiting the study’s generalizability. Rates of gun violence (e.g., gun homicides) in Houston remained relatively stable throughout the mid-to-late 2000s and 2010s. However, the early 2020s have seen a surge in gun assaults in Houston and across the nation (Dougherty, 2021). Future research should extend this study to include other locations and more proximate periods, including the mid-to-late 2010s and early 2020s. Nevertheless, despite these limitations, our study answers the call for “a more robust understanding of [the] temporal and spatial movement of crime guns” (Dierenfeldt et al., 2024, p. 739). Moreover, our results offer valuable insights for both practice and directions for future research.
Regarding practice, Huff et al. (2024) highlight the significance of timely intelligence in enhancing criminal investigations. The authors find that detectives are significantly more likely to report a NIBIN lead as helpful if they receive it shortly after a crime has occurred, and this is especially true in cases involving robbery and homicide, compared to other crimes. The patterns of repeated criminal gun use demonstrated here can inform crime and problem analysis to maximize the utility of NIBIN and the speed of evidence processing. Consistent with the recommendations of Yang et al. (2014, p. 103), our findings emphasize the importance of prioritizing information on “the time and spatial location of each new acquisition and each database entry” when loading evidence and when weighing or scoring potential leads and hits. It may be preferable to search for potential ballistic evidence of crimes that occurred near the crime for which ballistic evidence has recently been added to the database. By filtering searches in NIBIN’s database by the distance of possible matches, starting with the nearest, and by the number of days between crimes, beginning with the shortest, NIBIN hit and lead rates may be improved, enhancing investigations and ultimately improving the clearance rate of gun homicides and other gun-related crimes.
Concerning research, the present study lays a foundation for future scholars to replicate this analysis in other jurisdictions and periods, thereby advancing scholarship on the mobility of repeat-use firearms during their time in crime. Beyond replication, we encourage future studies to extend this analysis by incorporating comprehensive explanations and theoretical tests of the mechanisms underlying the spatiotemporal separation of repeat-use crime guns. Research suggests that gang involvement during the first known use of a crime gun corresponds with significant increases in its time in crime (Dierenfeldt et al., 2024) as well as elevates the odds that the firearm will be used in multiple offenses (Scott et al., 2023). We recommend that future research include in-depth data on salient neighborhood contextual features and incident-level information, such as whether the motive was gang-related. Understanding gang involvement could offer valuable insights into potential differences in the movement of gang-associated guns and non-gang guns, which would be crucial for informing law enforcement strategies and enhancing gun violence prevention efforts.
Footnotes
Acknowledgements
The authors would like to thank the Houston Police Department. This study would not have been possible without their cooperation. This study was presented at the annual meetings of the Homicide Research Working Group and the European Society of Criminology in 2024, as well as the National Research Conference for the Prevention of Firearm-Related Harms in 2025.

Funding
The authors received no financial support for the research, authorship, and/or publication of this article.
Declaration of Conflicting Interests
The authors declared no potential conflicts of interest with respect to the research, authorship, and/or publication of this article.