
Abstract
The advent of human-induced pluripotent stem (hiPS) cell–derived neurons promised to provide better model cells for drug discovery in the context of the central nervous system. This work demonstrates both the upscaling of cellular expansion and the acceleration of neuronal differentiation to accommodate the immense material needs of a high-throughput screening (HTS) approach. Using GRowth factor–driven expansion and INhibition of NotCH (GRINCH) during maturation, the derived cells are here referred to as GRINCH neurons. GRINCH cells displayed neuronal markers, and their functional activity could be demonstrated by electrophysiological recordings. In an application of GRINCH neurons, the brain-derived neurotrophic factor (BDNF)–mediated activation of tropomyosin receptor kinase (TrkB) was investigated as a promising drug target to treat synaptic dysfunctions. To assess the phosphorylation of endogenous TrkB in the GRINCH cells, the highly sensitive amplified luminescent proximity homogeneous assay LISA (AlphaLISA) format was established as a primary screen. A high-throughput reverse transcription (RT)–PCR format was employed as a secondary assay to analyze TrkB-mediated downstream target gene expression. In summary, an optimized differentiation protocol, highly efficient cell upscaling, and advanced assay miniaturization, combined with increased detection sensitivity, pave the way for a new generation of predictive cell-based drug discovery.
Keywords
Introduction
While access to primary human neurons for in vitro drug discovery is obviously rather limited, the development of human-induced pluripotent stem (hiPS) cell technology has enabled differentiation toward human neuronal target cells. However, the rather cumbersome and cost-intensive cell culture requirements and the lengthy differentiation period have so far rendered most existing expansion and differentiation protocols unsuitable for the generation of adequately high cell numbers to support a high-throughput screening (HTS) campaign. 1
Two previous observations may help to overcome these challenges: (1) fibroblast growth factor (FGF2) was found to accelerate the expansion of stem cell–derived neural progenitor (NP) cells,2,3 and (2) the inhibition of Notch signaling was found to expedite the neuronal maturation of various stem cell–derived NP cells.2,4,5 In this described project, a combination of the two above described strategies was applied to NP cells derived from hiPS cells by dual SMAD signaling inhibition. 6 Whereas previous work mostly outlined the use of partially differentiated NPs in HTS campaigns and/or was restricted to smaller compound collections,7–11 this work illustrates how to conduct neuronal differentiation in microplates of the 384-well format covering a large-scale collection of approximately 1 million test compounds.
Applying this technique, the activation of the endogenous brain-derived neurotrophic factor (BDNF)/tropomyosin receptor kinase (TrkB) signaling pathway 12 was investigated in hiPS cell–derived GRowth factor–driven expansion and INhibition of NotCH (GRINCH) neurons. Pharmacological modulation of TrkB holds potential for the treatment of various neurological diseases. In consequence, this work aimed to enable high-throughput testing and pharmacological profiling of drug candidates with regard to TrkB stimulation.
In a conventional HTS assay, TrkB levels would be vigorously overexpressed in a recombinant cell line. In contrast, GRINCH neurons displayed endogenous TrkB at a comparably modest expression level, rendering the HTS conditions more physiological and thereby minimizing the number of false-positive hits. However, a significantly higher assay sensitivity was required to measure the stimulated phosphorylation of endogenous TrkB and to monitor the physiological BDNF-driven signaling pathways. Addressing this challenge, the Amplified Luminescent Proximity Homogeneous Assay LISA (AlphaLISA) technology was employed, which integrates a more sensitive acceptor bead type into the established Alpha format. 13 While the AlphaLISA format is typically used to quantify the amount or modification of a soluble cytoplasmic or secreted protein, the AlphaLISA assay developed here detected the C-terminal phosphorylation (Tyr706) of the solubilized integral membrane protein TrkB.
Another extremely sensitive detection technique is reverse transcription (RT)-PCR. The following technological leaps were applied to adapt this format to high-throughput drug discovery: 1 (1) the LightCycler device carried out RT-PCRs in both the 384- and 1536-well microplate formats, (2) the nonpurified mRNA contained in a cellular lysate was directly employed in the LightCycler as a starting point for a “crude lysate” RT-PCR, and (3) acoustic dispensing of aqueous cellular lysates in submicroliter volumes was used. Combining these innovations, the BDNF-induced transcription of the VGF gene was established as an RT-PCR-traceable marker of TrkB activation.
The procedures for upscaling and accelerating the derivation of neurons from hiPS cells, together with the HTS-compatible AlphaLISA and RT-PCR formats, enabled large-scale HTS for TrkB-modulating agents.
Materials and Methods
Human iPS cell maintenance culture, neural induction, and rosette passaging were carried out as discussed in the supplement.
NP Single-Cell Expansion
After neural induction and rosette passaging, the neural rosettes were dissociated into NP single cells by addition of Accutase solution (cat. A6964, 100 mL, Sigma-Aldrich, St. Louis, MO) for 5 min at 37 °C. The detached cells were transferred into a cell culture tube, and two volumes of 1× Dulbecco’s phosphate-buffered saline (DPBS) were added. The tube was centrifuged at 300g for 5 min. The supernatant was discarded, and the pellet was resuspended in Neuronal Maintenance Medium (NMM; Supplement), supplemented with 20 ng/mL FGF2. Further expansion with daily exchange of medium was carried out using Matrigel-coated T175 Nunclon Delta surface-treated EasYFlasks (cat. 178883, Thermo Fisher Scientific, Waltham, MA) and T-1000 flasks (cat. PFHYS1008, Merck Millipore, Darmstadt, Germany) as described below. NP cells were frozen in NMM supplemented with 20 ng/mL FGF2 and 10% DMSO.
Final Differentiation
For the below-described Alpha and RT-PCR assays, NP cells were suspended at a concentration of 150,000 cells/mL in neural differentiation medium (NDM), consisting of NMM, supplemented with 6.6 µg/mL laminin and 10 µM N-[N-(3,5-difluorophenacetyl)-
For the other formats, namely, immunofluorescence staining (96-well format), whole-cell patch clamp recordings (12 mm cover slips in 24-well format), and next-generation sequencing (NGS; 6-well format), NP cells were seeded at a density of 60,000 cells/cm2 into PLO-laminin precoated culture ware and cultured in NDM. Half of the medium was exchanged every other day. The cells were cultured for the indicated time periods.
RT-PCR from Nonpurified Cellular Lysate
After stimulation with BDNF as described in the supplement, the cells were washed three times with 70 µL/well of 1× DPBS and the supernatant was aspirated, leaving a residual volume of 10 µL/well using a BioTek EL406 Washer Dispenser. Subsequently, the cells were lysed for 5 min at room temperature by adding 10 µL/well of 1× Realtime Ready Cell Lysis Buffer, supplemented with 2× RNase inhibitor (Realtime Ready Cell Lysis Kit, cat. 05943523001, Roche, Basel, Switzerland). Next, 9 µL/well of Realtime Ready Master Mix, composed of 1× Realtime Ready Virus Master Mixture (cat. 05992877001, Roche) and 1× Realtime Ready Catalogue (cat. 05532957001, Roche) or Designer Assay (cat. 05583055001, Roche) solutions (respective assay ID numbers are given in the supplement), was prepared and transferred into a 384-well LightCycler 480 Multiwell plate (cat. 04729749001, Roche). Then 1 µL of the cellular lysate was added into each well, using the Echo 555 Acoustic Dispenser (Labcyte Inc., Sunnyvale, CA). The LightCycler 480 plate was sealed and centrifuged for 4 min at 1500g. Gene expression was measured using a LightCycler 480 instrument. The following RT-PCR program was used: (1) RT: 50 °C, 8 min, 1 cycle; (2) preincubation: 95 °C, 30 s, 1 cycle; (3) amplification: 95 °C, 1 s, followed by 60 °C, 20 s, 45 cycles; and (4) cooling: 40 °C, 30 s, 1 cycle.
Amplified Luminescent Proximity Homogeneous Assay
After stimulation as described in the supplement, the cells were washed three times with 70 µL/well 1× DPBS, and the supernatant was aspirated off to a residual volume of 10 µL/well using a BioTek EL406 Washer Dispenser. Subsequently, the cells were lysed for 5 min at room temperature by addition of 10 µL/well 1× CST lysis buffer (cat. 9803, Cell Signaling Technology), supplemented with 2× protease inhibitor (cat. 11873580001, Roche) and 2× phosphatase inhibitor cocktails 2 and 3 (cat. P5726 and cat. P0044, Sigma-Aldrich).
Next, 5 µL/well of the generated cellular lysate was transferred into the corresponding well of a 384-well small-volume, flat-bottom plate (cat. 784075, Greiner Bio-One) using a CyBi-Well vario 384-Channel Simultaneous Pipettor. Afterward, the Alpha reagents for detection of either TrkB or C-terminally phosphorylated TrkB (as described in the supplement) were employed: 2.5 µL/well of the conjugated AlphaLISA acceptor beads (final concentration: 10 µg/mL), diluted in 1× AlphaLISA assay buffer (cat. AL000F, PerkinElmer, Waltham, MA), was added to the cellular lysate. The microplate was incubated for 45 min at room temperature. Subsequently, 2.5 µL/well of the biotinylated antibody (final concentration: 1 nM, diluted in 1× AlphaLISA assay buffer) was added. The microplate was incubated for 45 min at room temperature. Finally, 2.5 µL/well of AlphaScreen streptavidin-coated donor beads (cat. 6760002B, PerkinElmer; final concentration: 20 µg/mL, diluted in 1× AlphaLISA assay buffer) was added under subdued light conditions. The microplate was incubated for 30 min at room temperature in the dark. The AlphaLISA signal was measured using an Envision Reader (extinction: 680 nm/emission: 615 nm) purchased from PerkinElmer.
Cellular Characterization
NGS, immunofluorescence, and whole-cell patch clamp recordings were carried out as described in the supplement.
Results
HTS Adaptation of NP Cell Expansion
Originally starting with 4 × 10⁶ hiPS cells in one well of a six-well microplate, the first phase of differentiation as described in the supplement provided approximately 2 × 10⁷ NP cells. During the single-cell expansion phase, the number of NP cells increased between days 1 and 11 from 2 × 10⁷ to 6.4 × 10⁹ cells in four passaging steps ( Fig. 1A ). If even larger numbers of NP cells are required, the NP cell single-cell proliferation period may be extended to nine passaging steps without harming the potential of the NP cells for neuronal differentiation (data not shown). The NP cells from this expansion culture were suitable for a freeze–thaw cycle. Consequently, when sufficient numbers of the NP cells had been reached to cover the scope of the planned HTS campaign, the cells were frozen in appropriate aliquots. By this means, the flask-based NP cell culture was decoupled from the microplate-based final neuronal differentiation.
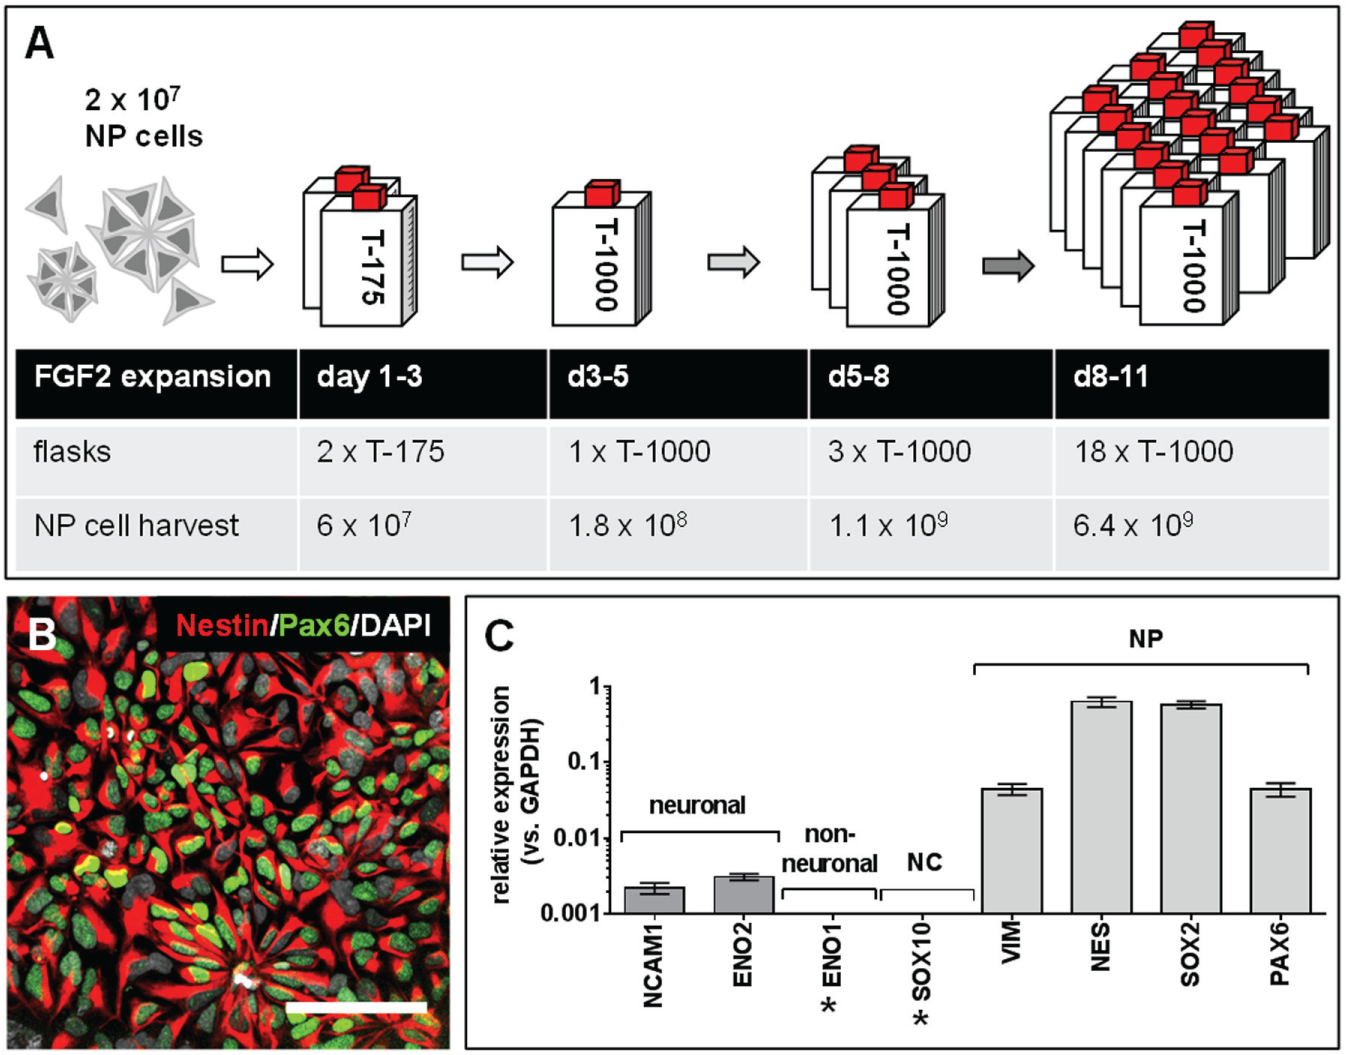
HTS adaptation of NP cell expansion. (
A further feature facilitating the upscale was the change of surface coating from PLO-laminin (as employed in other protocols in the NP cell maintenance culture 14 ) to Matrigel during the FGF2-driven NP cell expansion phase. In this context, the use of Matrigel served two purposes: (1) it shortened the duration of the coating procedure from 3 to 1 h, and (2) the required amount of Matrigel per culture dish area was more economical than the necessary amount of PLO-laminin.
Marker Profile of the NP Cells after the FGF2-Driven Expansion Period
In order to confirm the NP cell character of the cells after the FGF2-driven expansion period, the NP cells were analyzed by immunofluorescence microscopy ( Fig. 1B ) using NP-specific antibodies for nestin and Pax6. The intermediate filament nestin is known to be expressed in dividing precursor cells of the nervous system (NS). In Figure 1B , it was detected with its characteristic cytoplasmic staining in almost all the cells. Pax6 coordinates neurogenesis and proliferation. Practically all the NP cells in Figure 1B were Pax6 positive. In accordance with the literature, Pax6 was mostly observed within the nuclei of the NP cells. Moreover, the expanded NP cells retained their characteristic neural rosette morphology even after multiple passages in the presence of FGF2, similar to NP cells omitting FGF2 in the expansion phase. 14
To further decode the NP cell marker profile, RT-PCR experiments were performed, using primer probe sets for (1) neuronal markers: neural cell adhesion molecule (encoded by NCAM1) and neuron-specific enolase (encoded by ENO2); (2) nonneuronal markers: alpha enolase (encoded by ENO1) and neural crest marker SOX10; and (3) an NP cell marker set 14 including vimentin (encoded by VIM), nestin (encoded by NES), sex-determining region Y-box 2 (encoded by SOX2), and paired box protein 6 (encoded by PAX6), respectively. The highest expression was observed for the NP cell–specific markers ( Fig. 1C ). In contrast, only lower levels of the mature neuronal markers NCAM1, as well as ENO2, were detected, and the nonneural and neural crest markers ENO1 and SOX10 were not detectable.
Enhanced Neuronal Maturation Using Notch Inhibition
For other stem cell–derived NPs, it had previously been established that the inhibition of Notch activity combined with growth factor withdrawal markedly accelerates neuronal differentiation. 5 Likewise, the NP cells described here displayed a significantly enhanced morphological and functional maturation, when besides removing FGF2 from the culture medium, the Notch signaling was inhibited by the addition of DAPT ( Fig. 2 ). Under conditions of FGF2 withdrawal, the DAPT-treated cells ( Fig. 2C , F ) displayed a considerably augmented conversion of NP cells toward a neuronal morphology compared with the NP cells without DAPT administration ( Fig. 2B , E ). This finding was corroborated by the virtual disappearance of the progenitor and cell cycle marker Ki-67 from the DAPT-treated cells (compare with Fig. 2E , F ). In order to identify the optimal time period for the DAPT-driven neuronal differentiation process, the gene expression of the early neuronal marker TUBB3 and the above-described progenitor marker VIM was followed in a kinetic experiment ( Fig. 2G ). Over 2 weeks of DAPT administration, the mRNA level of TUBB3 increased by a factor of approximately 13 in comparison with the NP cell expression level. Conversely, the mRNA level of VIM declined by a factor of approximately 9 in the same time period.
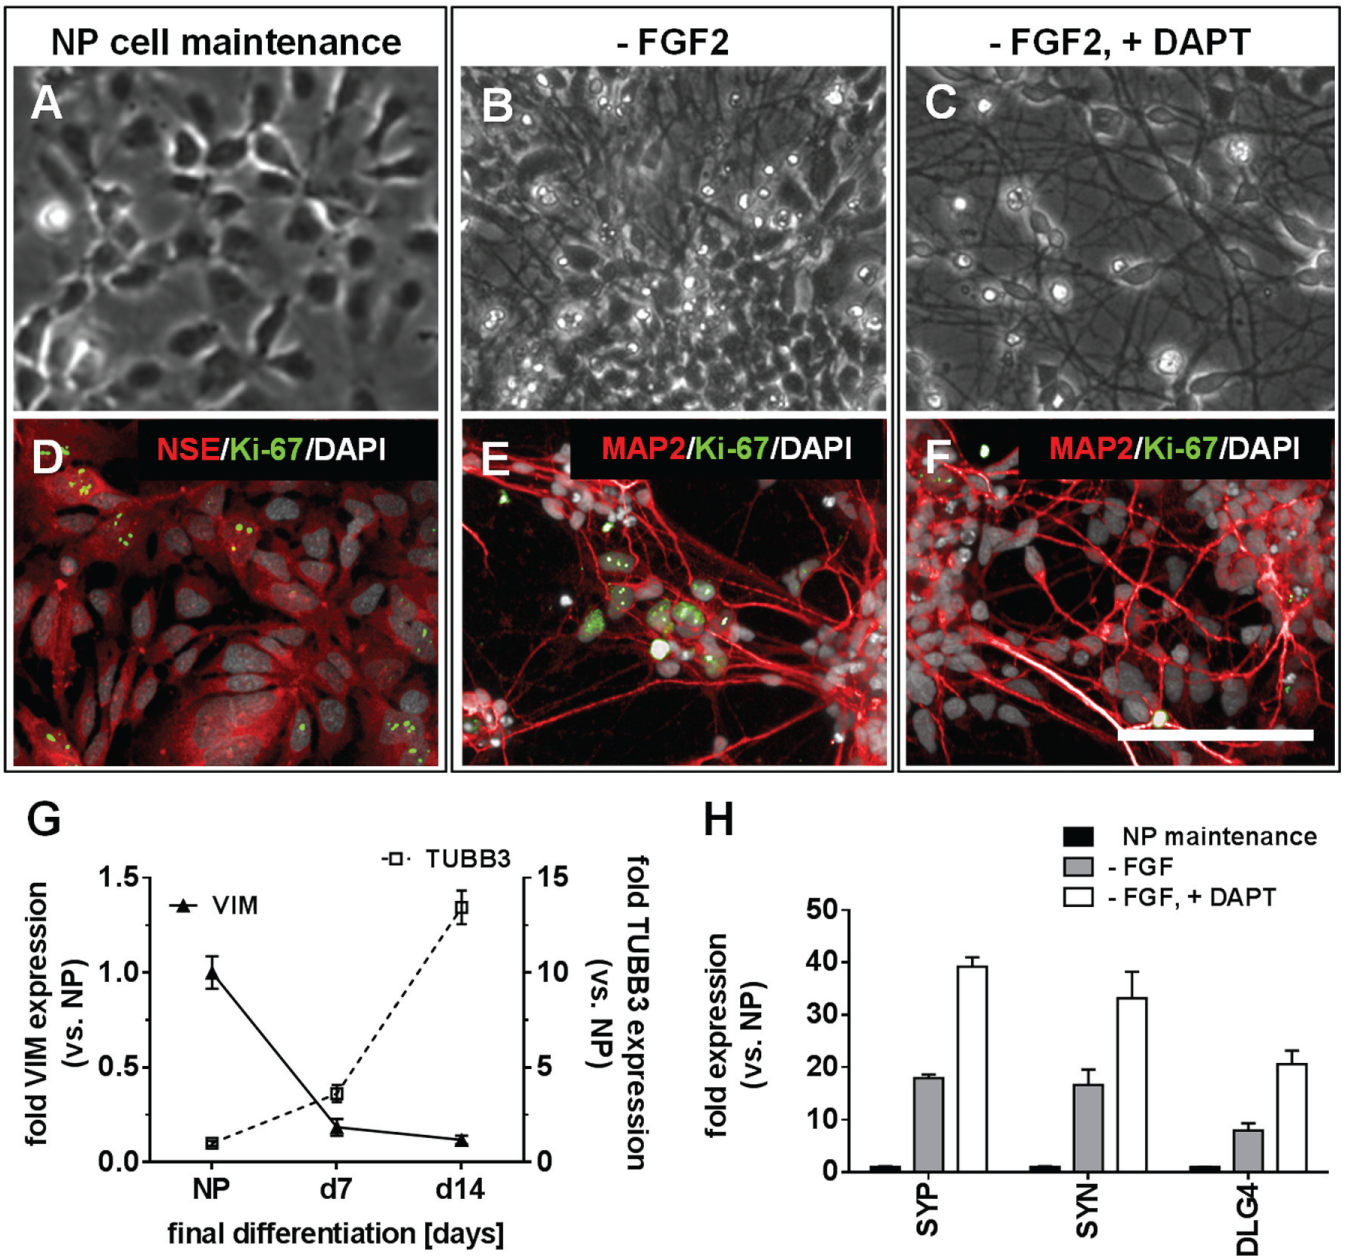
Final differentiation of hiPS cell–derived NP cells. Bright-light and immunofluorescence microscopic images, respectively, of (
The enhancement of the maturation process by DAPT compared with DAPT-free culture was also reflected by the higher transcriptional expression of the mRNAs for presynaptic proteins synaptophysin (encoded by the SYP gene) and synapsin (encoded by the SYN gene), as well as for the postsynaptic density protein 95 (PSD95; encoded by the disks large homolog 4 gene [DLG4]). 14 Thus, 2 weeks of DAPT treatment increased the mRNA levels of SYP, SYN, and DLG4 by factors of 39, 33, and 21, respectively ( Fig. 2H ), whereas FGF2 withdrawal without DAPT treatment produced a markedly less pronounced increase of the same maturation markers by factors of 18, 17, and 8, respectively. In consequence, the DAPT administration not only produced a purer neuronal culture with fewer residual progenitor cells, but also enhanced neuronal differentiation.
The neurons that are in this way derived from FGF2-expanded NP cells in a 2-week DAPT-driven maturation process are below referred to as GRINCH cells.
Comparative Characterization of the Transcriptome
The GRINCH neurons were compared with various human tissues on the level of the transcriptome using NGS-based quantification of mRNA. In a first approach, the overlap was determined between the 1000 highest specifically expressed genes (see Supplement Methods) from each of 27 human tissues
15
and the 1000 highest specifically expressed genes of the GRINCH neurons. The best match of 270 overlapping genes was observed between the transcriptomes of the GRINCH neurons and the human cerebral cortex (
In a second approach (
Expression of Markers for Brain Regional Patterning and Neuronal Subtypes
In order to assess the brain regional patterning and neuronal subtype similarities of the GRINCH neurons in more detail, an RT-PCR-based expression analysis was performed for a series of well-established marker genes: 17 forebrain, midbrain, and hindbrain are the three primary regions of the brain. For the regional patterning analysis ( Fig. 3A ), the relative gene expression levels of two markers each of the forebrain (FOXG1, SIX3), midbrain (LMX1A, EN1), and hindbrain (GBX2, HOXA4) were measured. All six marker genes were expressed, indicating a mixed brain regional patterning of the GRINCH neurons. In a more detailed analysis for subregional cortical markers, the mRNAs encoding the upper-layer proteins BRN2 and CUX1, as well as the deep-layer proteins TBR1 and CTIP2, were detected ( Fig. 3B ). In Figure 3C , the relative gene expression levels of markers for cholinergic (CHAT, SLC18A3), serotonergic (SLC6A4, TPH2), adrenergic (ADRA2B, DBH), dopaminergic (SLC6A3, TH), GABAergic (SLC32A1, GAD2), and glutamatergic (SLC17A7, GRIA1) neuronal subtypes were measured. Apart from the two serotonergic markers, at least one marker for each other neuronal subtype was detectable in the RT-PCR-based expression analysis. This indicates that the GRINCH cells are composed of a mixture of neuronal subtypes. In addition, the GRINCH cells were analyzed for the presence of mRNAs encoding the glial markers GFAP and S100B in comparison with the universal neuronal marker mRNA for TUBB3. The respective RT-PCR data indicate a restricted subpopulation of glia cells among the largely neuronal culture.
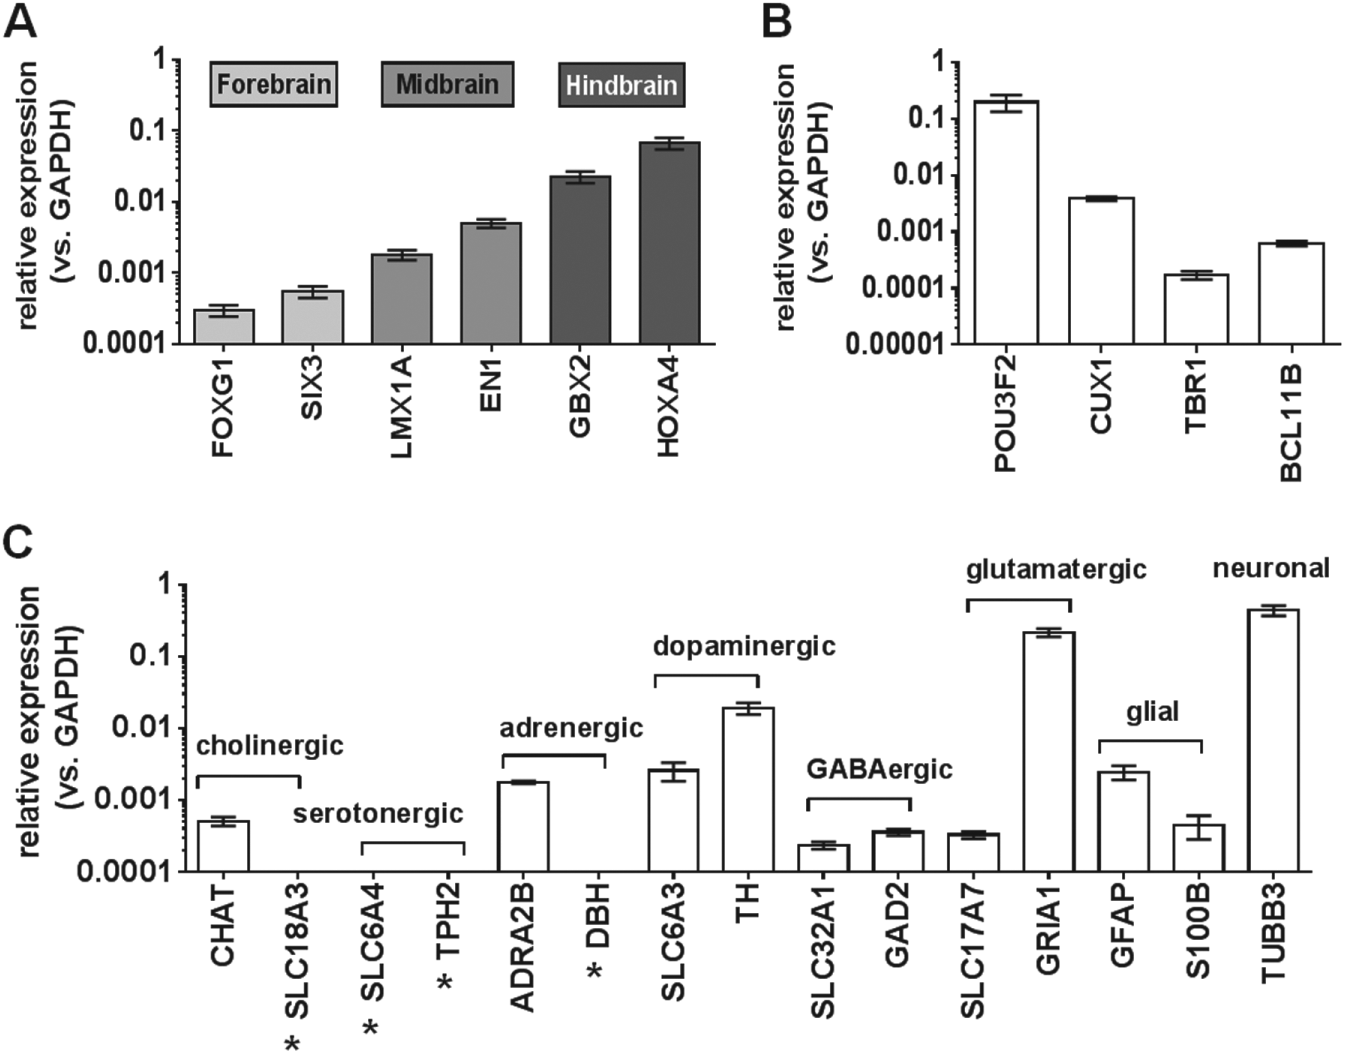
Gene expression analysis of the GRINCH neurons (
Assessment of Neuronal Markers by Immunofluorescence
To assess neuronal marker expression on the protein level, the GRINCH neurons were analyzed by immunofluorescence staining ( Fig. 4A–C ). Beta-3-tubulin (Tuj-1), the TUBB3 encoded marker expressed on neurons but not on glial cells, 14 was found to be expressed on a vast majority of the cells described here, with its typical staining pattern reflecting the microtubular cytoskeleton ( Fig. 4A , C ). A small percentage of morphologically distinct, GFAP-positive nonneuronal cells were detected among the GRINCH cells (data not shown). Also in accordance with literature, 14 the presynaptic synaptophysin (Syp) was observed in both the cell bodies and the cellular processes with a punctate pattern corresponding to individual synapses ( Fig. 4A ). The immune staining for microtubule-associated protein 2 (MAP2; Fig.4B ), known to be connected with the neuronal cytoskeleton of dendrites, displayed the characteristic homogeneous distribution along the cellular protrusions. 14 Along these MAP2-positive dendrites, but also on the cell bodies, an antibody against the above-described PSD95 labeled sites of postsynaptic densities with their typical dotted distribution in the microscopic image 14 ( Fig. 4B ). TrkB is another marker of neuronal maturation, which has been associated with, for instance, the late phase of long-term potentiation. 18 In Figure 4C , TrkB was found on the neurites of essentially all analyzed neurons with its characteristic punctate distribution. 19
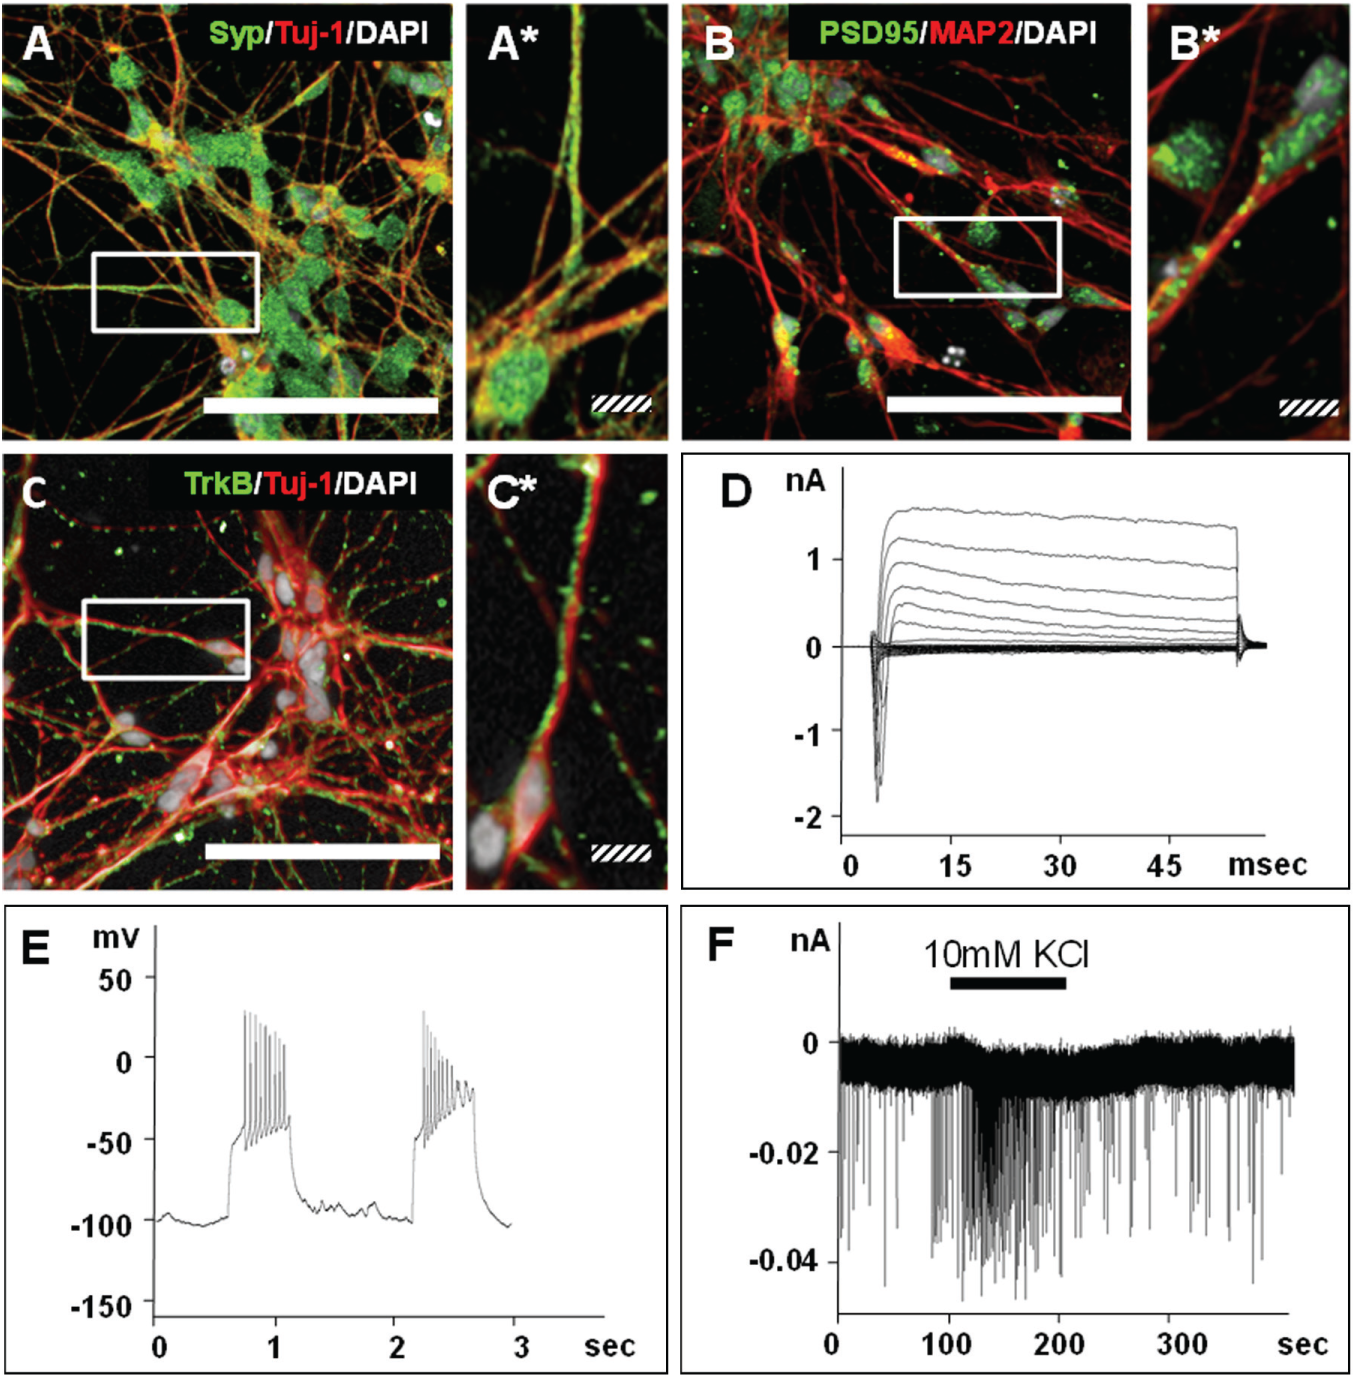
Immunofluorescence analysis and single-cell electrophysiological properties of the GRINCH neurons. The cells were stained with DAPI and antibodies specific for (
Evaluation of Functional Activity by Electrophysiological Recordings
In order to validate whether the GRINCH neurons were functionally active, whole-cell patch clamp recordings from individual cells were employed ( Fig. 4D–F ). Stepwise depolarization from a holding potential of −70 to +20 mV ( Fig. 4D ) initially induced characteristic inward sodium currents with an amplitude of down to almost −2 nA; the subsequent outward potassium currents reached an amplitude of up to approximately 1.5 nA. In response to current injection, the neurons described here fired trains of up to 12 action potentials ( Fig. 4E ). Spontaneous excitatory postsynaptic currents (EPSCs) were recorded at a holding potential of −70 mV, and postsynaptic activity was increased by additional perfusion with 10 mM potassium chloride producing currents with amplitudes of up to approximately 40 pA ( Fig. 4F ). These electrophysiological parameters characterize the 5-week matured GRINCH neurons described here to possess a similar synaptic activity as neurons differentiated over significantly longer time spans from hiPS cells without DAPT stimulation. 14
Automated Long-Term Neuronal Differentiation in Microplates
In order to enable a larger HTS campaign using hiPS cell–derived neuronal model cells, a substantial number of microplates with differentiated neurons must be procured at a regular weekly rate. To this purpose, a semiautomated cell dispense system ( Fig. 5A ), as well as a fully automated system for sterile media exchange on microplates ( Fig. 5B ), was implemented. A microplate preparation scheme, as illustrated in Figure 5C , could be applied. On three sequential days of week 1, a set of 168 microplates/day was loaded with NP cells freshly resuspended in differentiation medium from a frozen stock. During the first week of differentiation, two automated exchanges of culture medium were carried out for each microplate. For the second week of differentiation, the microplates were transferred to a nonintegrated incubator in order to vacate 168 microplate positions in the system-integrated incubator. Following this schedule, 3 × 168 = 504 microplates/week with 2-week differentiated neurons can be provided from weeks 3 to 7. In consequence, this workflow can supply a total of 2520 microplates with GRINCH neurons in the campaign outlined here, thereby enabling the measurement of 968,000 data points in a 7-week HTS process.
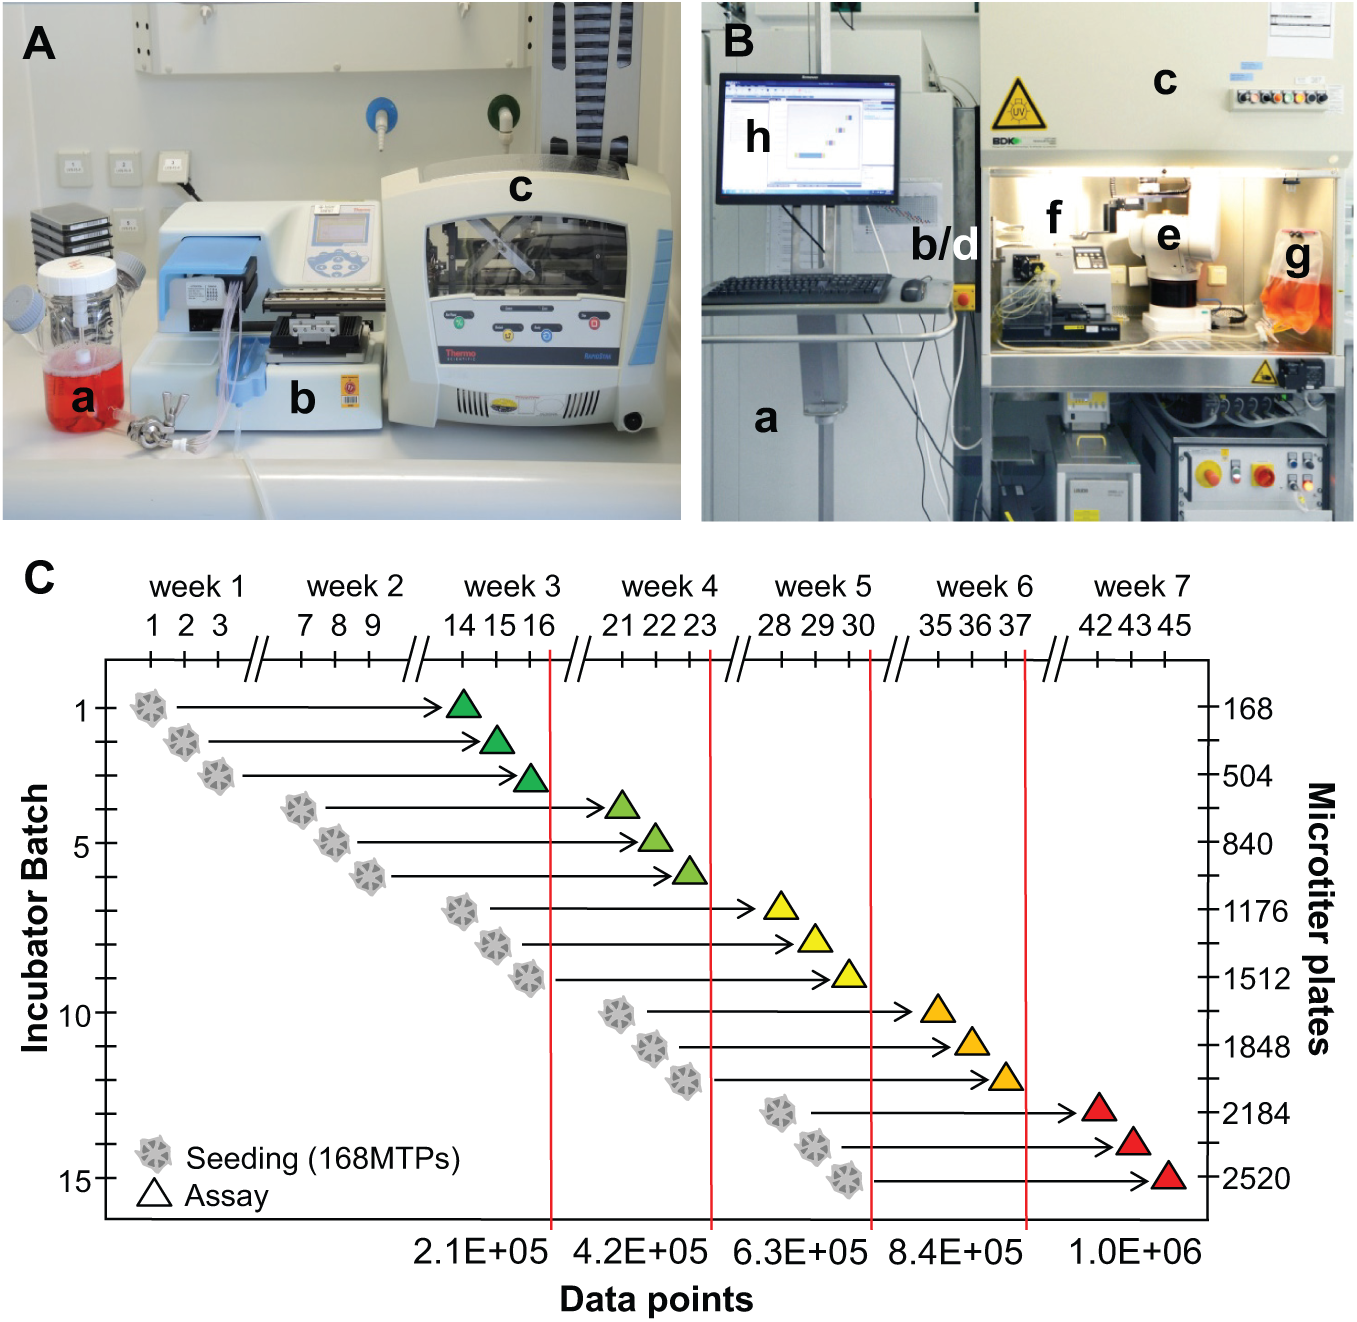
Semiautomated NP cell seeding and automated long-term neuronal differentiation in microplates. (
HTS Measurement of TrkB Activation in GRINCH Neurons Using AlphaLISA
The GRINCH neurons were assessed for their applicability to a target-focused screening campaign. For this purpose, an AlphaLISA format was developed to quantify the protein expression level of the target of interest, TrkB, in a cellular lysate. This AlphaLISA assay was found to isoform-selectively detect TrkB but not TrkA or TrkC (
HTS assay for TrkB activation in AlphaLISA format and automated screening campaign. Using specific AlphaLISA formats, the concentration of (
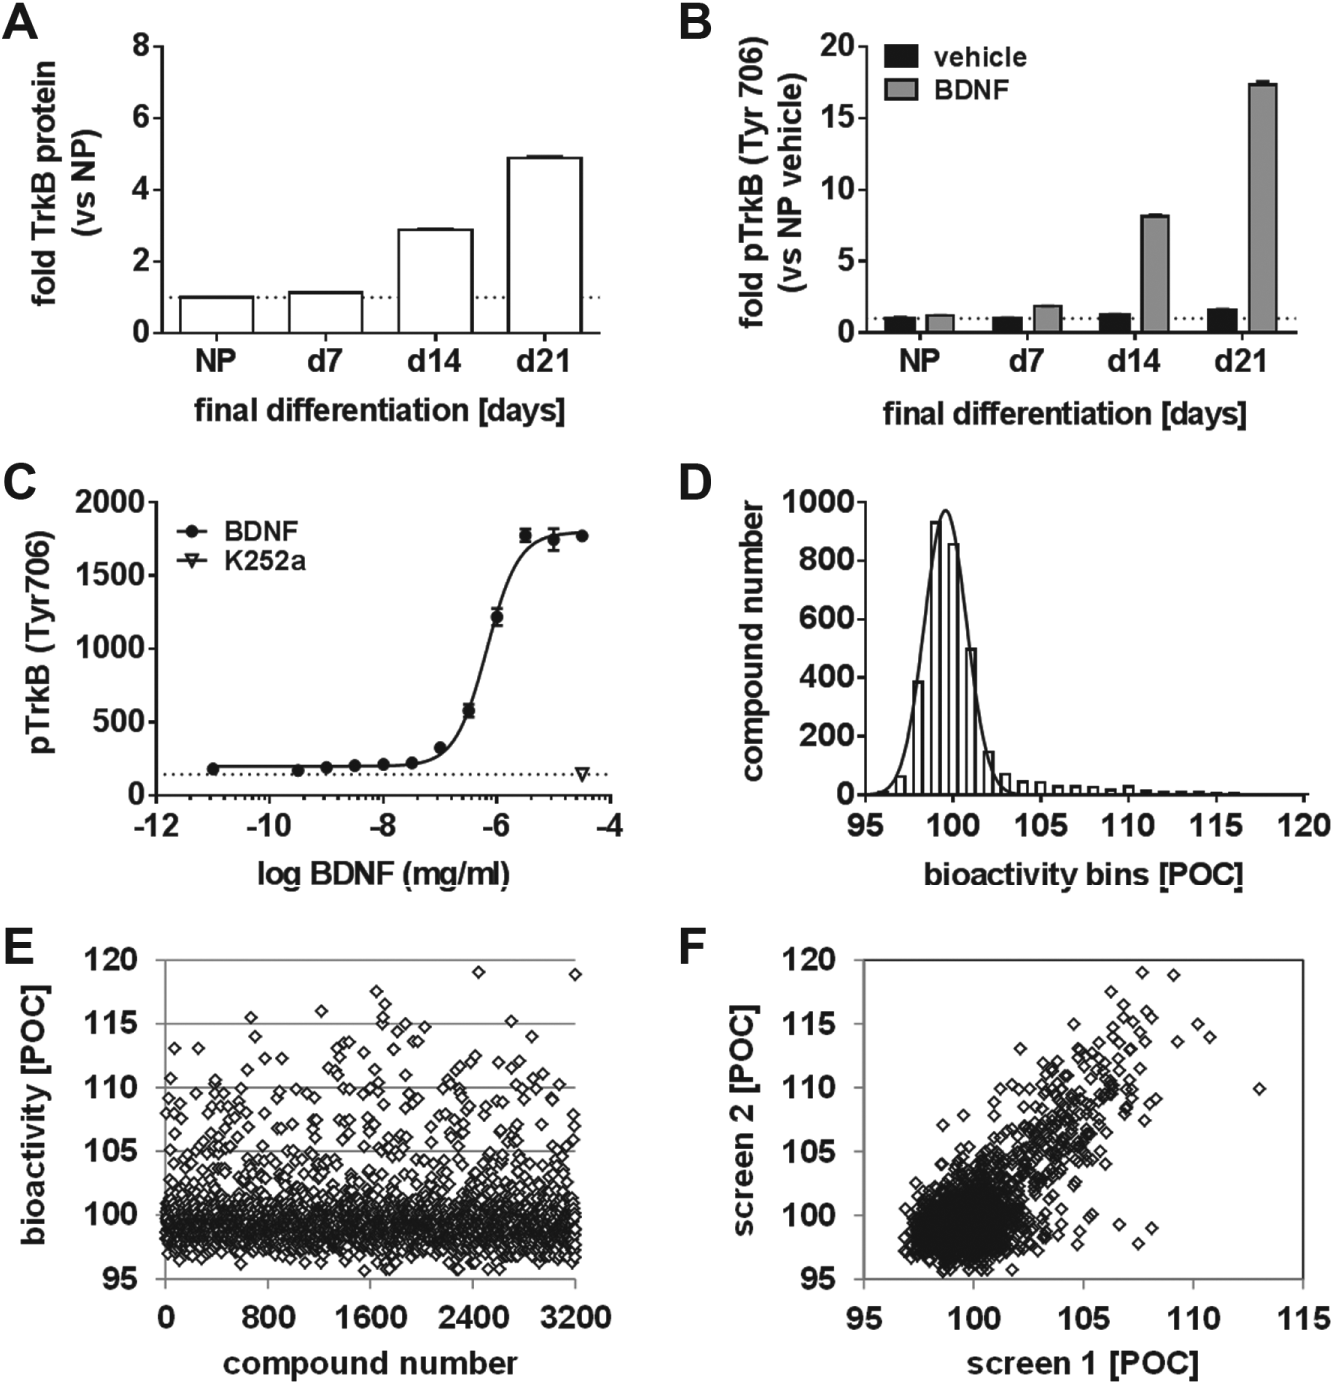
In order to quantify the stimulation of TrkB by its cognate agonistic ligand BDNF, another AlphaLISA format was developed to selectively measure the BDNF-induced phosphorylation of TrkB at Tyr 706 (
However, beyond 14 days of differentiation the adhesion of the differentiating GRINCH neurons to the microplate coating began to decline. In consequence, the automated washing step prior to stimulation of the cells with test compounds detached the 21-day differentiated cells from the microplate bottom. In addition, a 21-day differentiation period would reduce the throughput in an automated campaign. Accordingly, we compromised to a 14-day differentiation period for all automated testing.
To monitor how fast the activated TrkB was dephosphorylated, a time course of the pTrkB AlphaLISA signal after maximal stimulation with BDNF was recorded (
Automated Screening Campaign on Chemical Diversity Set
Approximately 3200 compounds from a chemical diversity set were measured twice in a single-dose (approximately 10 µM), automated screening campaign using the pTrkB Alpha format. The percent of control (POC) value was defined by setting the vehicle control stimulation to 100 POC and the maximal stimulation by BDNF (31.6 ng/mL, 1.1 nM) to 200 POC. The bioactivity of all compounds was rather narrowly distributed around the 100 POC value with a standard deviation of 1.2 POC, as derived from the fitted Gaussian curve ( Fig. 6D ). Approximately 60 of the 3200 compounds tested at 10 µM displayed a bioactivity above or equal to 110 POC in either of the two screening runs ( Fig. 6E ). Despite the moderate effects in the pTrkB Alpha format when compared with BDNF, the Alpha signals were relatively similar in the two replicate screening runs ( Fig. 6F ). However, a counterscreen on nondifferentiated NP cells enabled the identification of the above primary hit compounds as assay technology-related false positives. In consequence, larger compound collections need to be screened in order to identify viable starting points for small-molecule TrkB agonists.
Secondary Profiling of TrkB Modulators in GRINCH Neurons Using RT-PCR
An NGS analysis (data not shown) combined with a literature study indicated four potential transcriptional reporter genes for TrkB activation in the hiPS cell–derived neurons: VGF, EGR1, EGR3, and SCG2. When transferred to the above-described LightCycler-based RT-PCR format using nonpurified mRNA in cellular lysates, two of these reporter genes, VGF and EGR1, provided a sufficient and statistically relevant assay window (
Discussion
The introduction of the hiPS cell technology has opened novel routes to generate a variety of disease-relevant cells as model systems for drug discovery. This is of particular relevance in the pharmaceutical industry, where human primary cells are not available in sufficient numbers like, for instance, in the case of neuronal cells. However, it is still a challenge to generate sufficient numbers of these cells for a large-scale HTS campaign in an affordable cost range and within an acceptable time frame. In order to address these requirements, two strategies were adapted in this work: (1) large-scale expansion at a NP cell stage, and (2) enhanced and accelerated maturation via Notch inhibition generating functional neurons.
In the context of preparing an HTS campaign described here, NP cell expansion provided convincing advantages in comparison with “run-through” neuronal differentiation protocols starting from the hiPS cell level: (1) hiPS cells display a higher probability of spontaneous differentiation toward an unwanted direction. (2) For a run-through neuronal differentiation protocol, the upscaled expansion phase needs to be carried out on the level of the hiPS cells. However, the maintenance culture for hiPS cells is very labor-intensive, for instance, requiring the manual removal of spontaneously differentiating cells under the microscope. In contrast, the last expansion cycles of the NP cells employed here were carried out in five-layered T-1000 flasks. Accordingly, all 6.4 billion NP cells required for a large-scale HTS campaign could be harvested in parallel as a single batch. Avoiding batch-to-batch variability ensured a higher level of uniformity at the start of the intramicroplate differentiation process. In addition, quality control measures such as gene expression profiling only had to be applied to a single batch of NP cells. (3) Conveniently, the NP cells described here could be frozen at the end of the expansion phase in aliquots, and then thawed and directly suspended in differentiation medium to be dispensed into 384-well microplates. By this means, the NP cell expansion phase was decoupled from the compound testing phase of the HTS campaign.
In this work, an improved upscaling of the NP cells was accomplished by the employment of the proliferation stimulator FGF2. This growth factor plays an important role not only for neural precursor cell survival, but also for cell proliferation. 24 Consequently, it has been used to amplify hES cell– and hiPS cell–derived neuronal progenitor cells.2,3 By this means, the above-established protocol achieved an expansion of the NP cells by a factor of 320 within only 11 days. This level of upscaling produced a sufficient number of NP cells to cover a standard large-scale HTS campaign of approximately 1 million single-dose measurements. To further optimize the NP cell expansion process in terms of limited incubator capacity and coating issues, NP cells were expanded in T-1000 flasks coated with Matrigel.
At the end of NP cell expansion, a broad gene and protein expression analysis was performed, confirming the bona fide NP cell character of the GRINCH cells generated here. Furthermore, the presence of characteristic neural rosette structures, and their persistent capability to mature into physiologically relevant neurons by FGF2 withdrawal, together with or without addition of DAPT, confirmed the stability of NP cell characteristics over up to nine passages in the presence of FGF2.
As pointed out above, a second prominent hindrance in applying hiPS cell–derived neurons for HTS purposes is the lengthy neuronal maturation process (e.g., up to 95 days starting from hiPS cells14,25). Borghese et al. 5 pharmacologically blocked Notch signaling by the γ-secretase inhibitor DAPT, which had previously been demonstrated to produce identical effects as Notch loss-of-function mutations. 26 In a combination of growth factor withdrawal and inhibition of Notch signaling, they elegantly shortened the neuronal and synaptic maturation process for their human embryonic stem cell–derived neural stem cells (hESNSCs). Moreover, the parallel pharmacological inactivation of Notch signaling in all NP cells synchronized the time course of neuronal maturation, thereby providing a purer neuronal population. Similar to the effects on the hESNSCs, the administration of DAPT to the NP cells described here during the differentiation process accelerated neuronal maturation, indicated by the increased expression levels of synaptic genes in comparison with cells that had solely been matured via FGF2 withdrawal.
The GRINCH neurons showed several features supporting the notion that they represent pharmacologically predictive model cells for drugs directed toward the NS. Thus, their transcriptome extensively overlaps with NS tissue and sparsely with non-NS tissues. In addition, they displayed a broad assortment of brain regional and neuronal subtype-specific markers rendering them comparable to a “whole-brain” amalgam of various neuronal subtypes. This observation is in agreement with previous findings: despite the partially caudalizing effects of FGF2, 2 a mixture of regional identities was generated from NP cells that had undergone FGF2-driven expansion. 27
Furthermore, it had previously been found that the administration of DAPT to dual-SMAD-induced NP cells biases differentiation toward cortical neurons. 28 In agreement with this observation, the GRINCH neurons also displayed various markers of the upper and deeper cortical layers. Corroborating this view, a conspicuous correlation was found between the transcriptomes of the GRINCH neurons and the human cortex when determining the respective overlaps with a variety of NS and non-NS tissues.
Moreover, the presence of synaptic markers and the functional activity as observed by spontaneous EPSCs and induced action potential firing indicate a certain degree of maturation that renders the neurons suitable for the in vitro investigation of topics such as synaptic plasticity. While synaptic markers were already detectable in immunofluorescence after 2 weeks of DAPT-driven neuronal maturation, the functional activity displayed a marked increase beyond this time point. Accordingly, the above-described patch clamp experiments were carried out after 35 days of FGF2 withdrawal and DAPT administration.
The GRINCH neurons displayed a relatively low expression level of TrkB when compared with a TrkB overexpressing Chinese hamster ovary (CHO) cell line (compare with
The AlphaLISA format is commonly applied to quantify the phosphorylation of cytoplasmic proteins such as ERK or CREB. In the case of integral membrane proteins such as TrkB, the cellular lysis conditions had to be balanced between a sufficiently harsh solubilization of TrkB and sufficiently mild conditions to conserve the epitopes detected by the AlphaLISA antibodies. The EC50 value of 660 pg/mL (24 pM with respect to the homodimer) for BDNF in the pTrkB AlphaLISA format corresponded well with a literature potency of approximately 60 pM for human BDNF to promote survival of mouse hippocampal neuronal cultures. 21
In contrast, an EC50 value of 15 ng/mL (560 pM) for BDNF was found with a CHO cell line overexpressing TrkB in the pTrkB AlphaLISA format. Likewise, the EC50 value for BDNF in an enzyme-linked immunosorbent assay (ELISA) for pTrkB using primary mouse cortical neurons had been observed to be approximately 10-fold lower than in the same assay format employing a recombinant cell line. 29 This suggests that assays based on rather physiological cellular systems may be more sensitive to agonistic potencies with regard to TrkB than the same assays using the heterologous cellular system.
In a technology comparison carried out in primary rat neurons (DIV21), the EC50 value for BDNF of 18 ng/mL (650 pM) in the pTrkB AlphaLISA format matched well with the EC50 value of 12 ng/mL (440 pM) based on Western blot analysis for phosphorylated TrkB (
The above-described crude lysate RT-PCR protocol enabled an HTS workflow without any washing steps. This is of particular importance with respect to cells like the GRINCH neurons that only display a fragile attachment to the microplate coating. Moreover, the simple four-step procedure of stimulation, lysis, acoustic transfer, and RT-PCR required little liquid handling and was ideally suited for high-throughput applications. As opposed to a conventional luciferase-based reporter gene assay in a recombinant cell system, the application of the RT-PCR format to GRINCH neurons monitored the endpoint of a physiological signaling pathway with a disease-relevant reporter transcript integrated into its endogenous transcriptional control elements.
The low-volume acoustic dispenser employed here also lends itself conveniently to the 1536-well format. Transferring 200 nL of cellular lysate, which corresponds to the homogenate from 50 neurons, proved sufficient to drive an RT-PCR with a CP value of 24 for the BDNF-induced VGF transcript (data not shown). With cell numbers derived from hiPS cells still being relatively limited in comparison with classic recombinant cell systems, the transfer toward the 1536-well format will further broaden the applicability of the hiPS technology to HTS.
In this work, the RT-PCR assay was employed as a secondary profiling assay after primary testing in the AlphaLISA assay. However, the ease of miniaturization for the RT-PCR format also points toward its use for primary HTS in future applications. Additionally, RT-PCR may be employed in a multiplexed format, investigating several target-modulated transcription events in parallel RT-PCRs and enabling pharmacological profiling with regard to various signaling pathways. Apart from compound testing, the microplate-based RT-PCR format turned out to be very useful for multiparametric optimization of differentiation protocols.
The protocols for NP cell expansion and automated intramicroplate differentiation described here can be transferred to hiPS cell lines that are derived from diseased donors. For instance, dopaminergic neurons differentiated from hiPS cells that had been derived from patients with a monogenic variant of Parkinson’s disease recapitulated some facets of the disease phenotype in the cellular model: they displayed, for example, an increased proportion of apoptotic cells under conditions of oxidative stress in comparison with neurons differentiated from iPS cells generated from age- and gender-matched healthy control donors. 30 In combination with the above-developed techniques of HTS adaptation, the diseased donor-derived hiPS cell clones open new experimental routes of tremendous potential for early drug discovery, such as large-scale disease modeling.
Footnotes
Acknowledgements
We thank Ulrike Küfner-Mühl, Martin John Valler, Marcel Leist, Robert Ries, Carsten Hecker, Tobias Hildebrand, German Leparc, Stefan Jäger, Natascha Piede, Michael Sulger, Achim Lietz, Lore Florin, and Kristina Vogel.
Supplementary material for this article is available online.
Declaration of Conflicting Interests
The authors declared no potential conflicts of interest with respect to the research, authorship, and/or publication of this article.
Funding
The authors received no financial support for the research, authorship, and/or publication of this article.
References
Supplementary Material
Please find the following supplemental material available below.
For Open Access articles published under a Creative Commons License, all supplemental material carries the same license as the article it is associated with.
For non-Open Access articles published, all supplemental material carries a non-exclusive license, and permission requests for re-use of supplemental material or any part of supplemental material shall be sent directly to the copyright owner as specified in the copyright notice associated with the article.