
Abstract
The clinical and commercial success of covalent drugs has prompted a renewed and more deliberate pursuit of covalent and irreversible mechanisms within drug discovery. A covalent mechanism can produce potent inhibition in a biochemical, cellular, or in vivo setting. In many cases, teams choose to focus on the consequences of the covalent event, defined by an IC50 value. In a biochemical assay, the IC50 may simply reflect the target protein concentration in the assay. What has received less attention is the importance of the rate of covalent modification, defined by kinact/KI. The kinact/KI is a rate constant describing the efficiency of covalent bond formation resulting from the potency (KI) of the first reversible binding event and the maximum potential rate (kinact) of inactivation. In this perspective, it is proposed that the kinact/KI should be employed as a critical parameter to identify covalent inhibitors, interpret structure-activity relationships (SARs), translate activity from biochemical assays to the cell, and more accurately define selectivity. It is also proposed that a physiologically relevant kinact/KI and an (unbound) AUC generated from a pharmacokinetic profile reflecting direct exposure of the inhibitor to the target protein are two critical determinants of in vivo covalent occupancy. A simple equation is presented to define this relationship and improve the interpretation of covalent and irreversible kinetics.
Introduction
Covalent inhibitors are increasingly being considered a viable option in drug discovery. This resurgence has been led, in part, by the success of several drugs designed to treat acute and chronic diseases covering a number of therapeutic areas, including anti-infectives, cancer, gastrointestinal, central nervous system, cardiovascular, and inflammation. 1 Often cited examples of successful drugs include aspirin, penicillin, omeprazole, clopidogrel, and ibrutinib. In 2005, a retrospective look at all marketed drugs in the Food and Drug Administration Orange Book revealed that 35% of enzymes (25/71) are irreversibly inhibited by a drug and 76% (19/25) of those form a covalent bond to the target protein. 2 Many of these pharmaceutical agents have excellent safety records. 3 These drugs are often derived from natural products that form covalent bonds with target proteins.4,5 As a result, covalent bond formation has been a successful and safe strategy used by nature and the pharmaceutical industry to alter disease pharmacology. It might be surprising to learn that acrylamides, the most common reactive functional group included in covalent inhibitors, are present in coffee, cereal, bread, French fries, and potato chips.6–8 While there are efforts to reduce acrylamide levels in these foods, they are clearly not toxic. Why? Similar to pharmaceutical drugs, the difference between safety and toxicity depends on the administered (or consumed) dose. As credited to Paracelsus, the 16th-century founder of toxicology, “the dose makes the poison.”
In response to the increased interest in covalent inhibitors, several reports have presented the risks and rewards of their pursuit.1,3,9,10 The primary risk is the potential for nonspecific reactivity with proteins, DNA, or small molecules (e.g., glutathione), which could produce an acute or delayed toxicological event.11–13 Some of these idiosyncratic events result in an immune response to the covalently modified cellular macromolecule. 14 The discovery of drugs that can be administered at lower doses could decrease the risk of these events.15,16 Despite these potential issues, covalent inhibitors can produce very specific, targeted effects with excellent biochemical and cellular potencies, even in the presence of high concentrations of competing ligand. In addition, they can produce a pharmacodynamic effect that endures beyond what the pharmacokinetic profile would predict. In an effort to identify the proper therapeutic window between a specific and nonspecific effect, reports have provided guidance on how drug discovery groups may best characterize the cellular pharmacology of these inhibitors. 17 Activity-based protein profiling (ABPP) has become a powerful tool to evaluate the covalent inhibition of serine hydrolases, kinases, phosphatases, histone deacetylases, cytochrome P450s, and proteases (aspartyl, metallo, and cysteine).18–25 The irreversibility of covalent bond formation makes it an accessible and powerful tool to interrogate their cellular pharmacology. What has received less attention is the importance of the kinetics or rate of covalent bond formation. For example, the incorporation of kinact/KI during a structure-activity relationship (SAR) campaign is often recommended but infrequently applied. The kinact/KI is a second-order rate constant describing the efficiency of covalent bond formation. In this report, a perspective is presented regarding the risks of an overreliance on IC50 values. A comprehensive understanding of the kinetics of covalent and irreversible inhibition, as defined by kinact/KI, can have a significant impact on how to identify covalent inhibitors, understand SAR, translate their activity to the cell, interpret selectivity, view an optimal pharmacokinetic profile, and estimate in vivo target occupancy.
Kinetic Mechanism of Covalent Inhibition
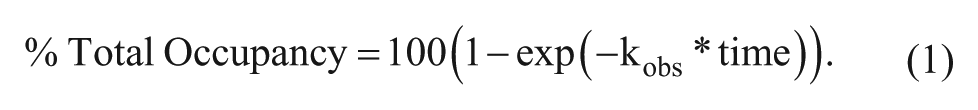
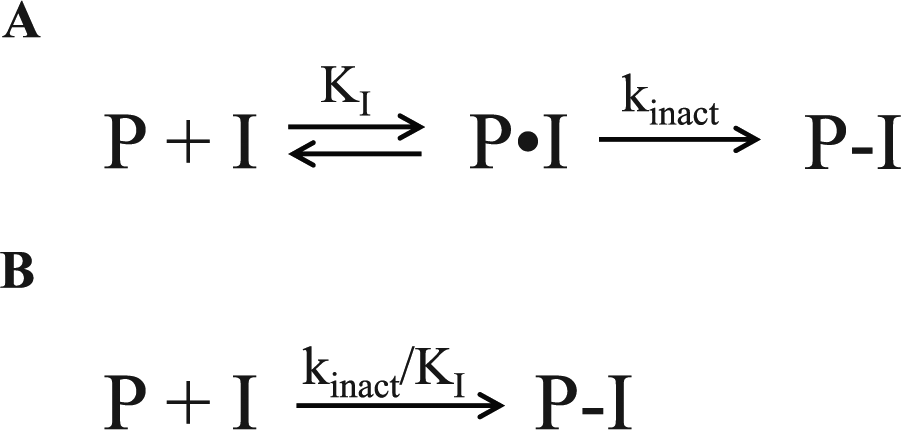
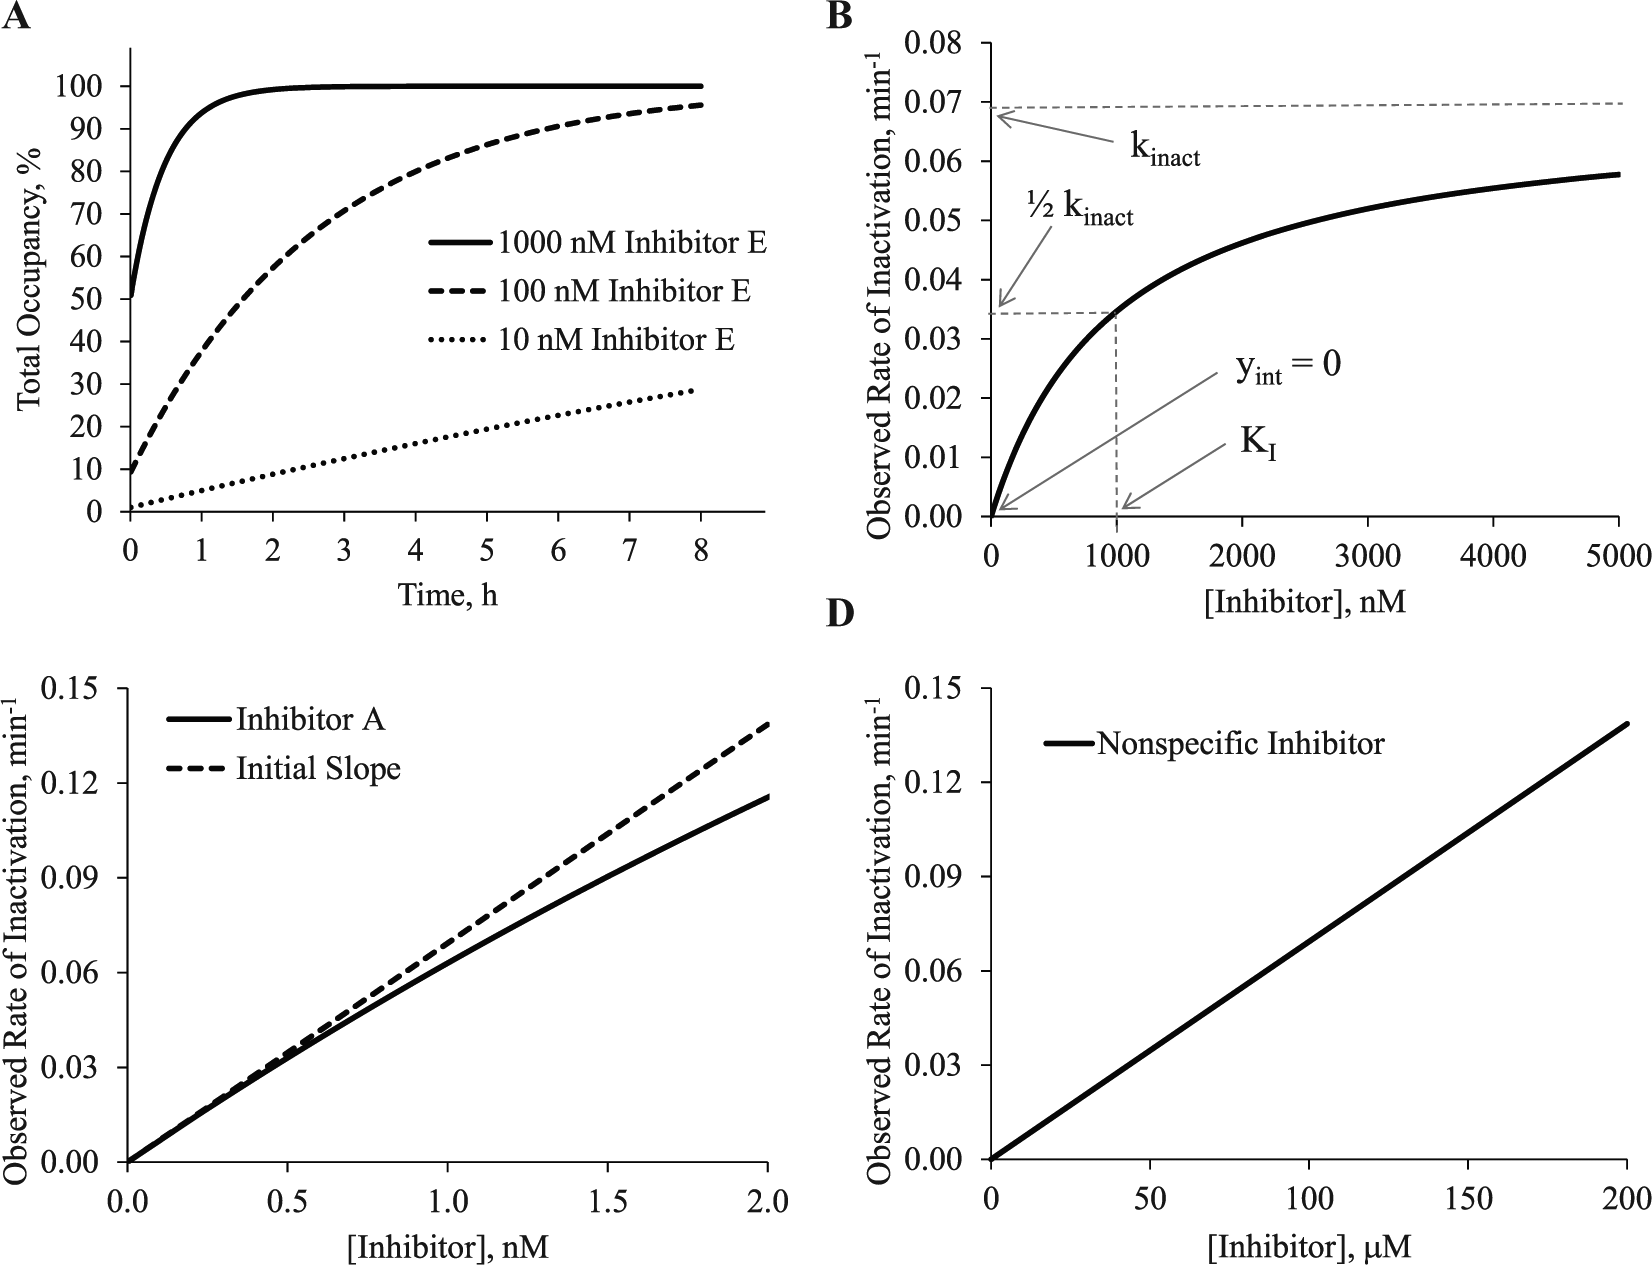
In small-molecule drug discovery, there are two general categories of covalent and irreversible inhibition. The first is a covalent bond resulting from a specific interaction between a small molecule and protein. As illustrated in Figure 1A , this occurs in two steps. First, the inhibitor (I) binds to the target protein (P), and a reversible protein-inhibitor complex (P•I) is formed. The potency of this first step is defined by the binding constant KI. The KI term describes the concentration of inhibitor required for half of the maximum potential rate of covalent bond formation. This should not be confused with Ki describing the dissociation of the P•I complex, which is not affected by covalent bond formation. In the second step, the nucleophile reacts with the electrophile, forming a covalent protein-inhibitor complex (P-I). The rate of the second step will depend on the concentration of P•I. When all the target protein exists with reversibly bound inhibitor (P•I) and no free target protein remains (P), the observed rate of inactivation is the kinact. The kinact is a first-order rate constant describing the maximum potential rate of covalent bond formation. Taken together, the overall rate of covalent bond formation from free, unbound protein (P) to the covalent protein-inhibitor complex (P-I) is defined by the ratio of kinact to KI or kinact/KI. This bimolecular rate constant accounts for both the potency of the first step (KI) and the maximum potential rate of covalent bond formation (kinact). The kinact/KI can be determined in two steps. In a binding assay, the total occupancy is measured over time at different inhibitor concentrations. This is illustrated in Figure 2A at 1000 nM, 100 nM, and 10 nM of inhibitor E from Table 1 with a kinact/KI of 1.2 × 10³ M−1s−1. The observed occupancy over time at each inhibitor concentration is fit to equation (1).
(
(
Modeled In Vitro Potency and In Vivo Covalent Occupancy for Inhibitors with Different Covalent Kinetic Properties.
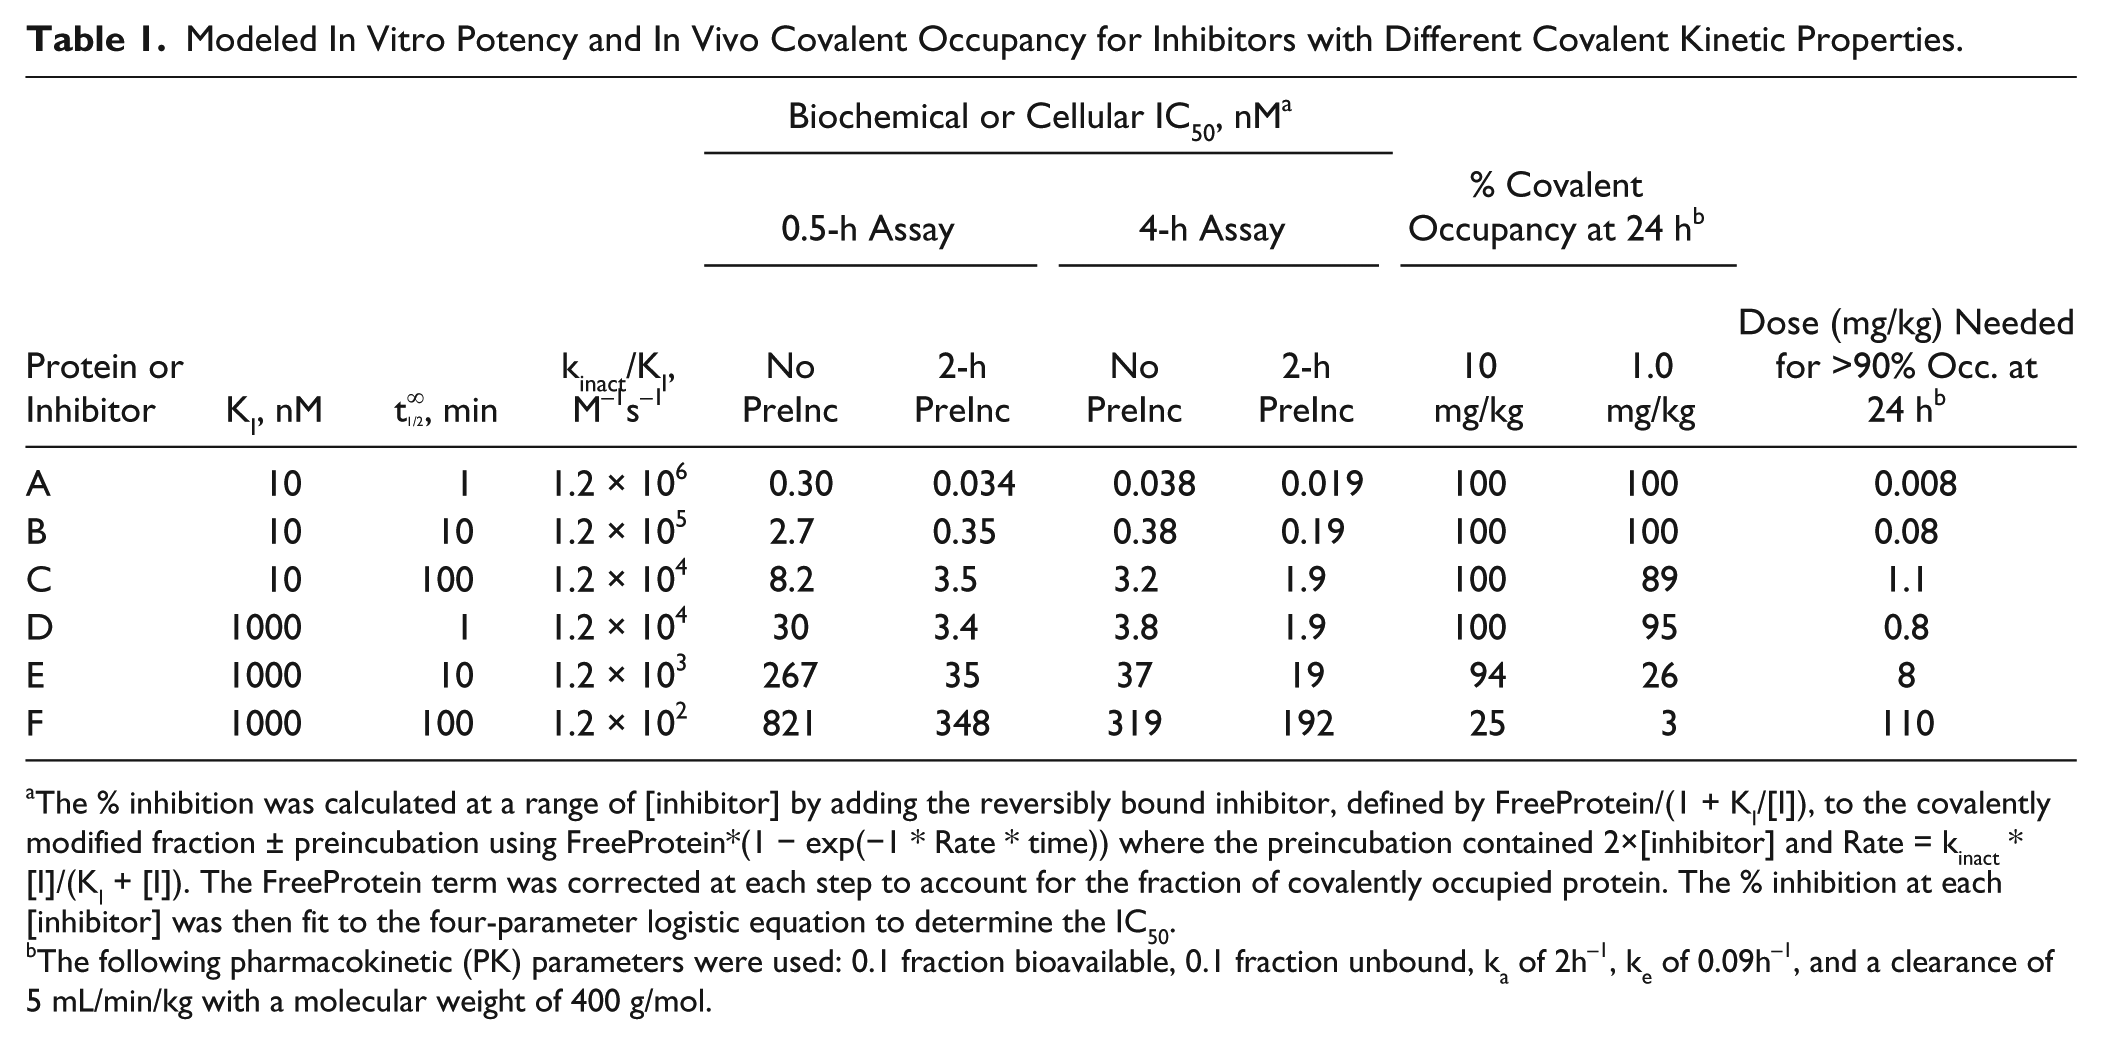
The % inhibition was calculated at a range of [inhibitor] by adding the reversibly bound inhibitor, defined by FreeProtein/(1 + KI/[I]), to the covalently modified fraction ± preincubation using FreeProtein*(1 − exp(−1 * Rate * time)) where the preincubation contained 2×[inhibitor] and Rate = kinact * [I]/(KI + [I]). The FreeProtein term was corrected at each step to account for the fraction of covalently occupied protein. The % inhibition at each [inhibitor] was then fit to the four-parameter logistic equation to determine the IC50.
The following pharmacokinetic (PK) parameters were used: 0.1 fraction bioavailable, 0.1 fraction unbound, ka of 2h−1, ke of 0.09h−1, and a clearance of 5 mL/min/kg with a molecular weight of 400 g/mol.
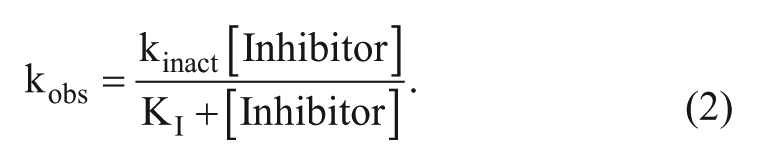
This yields the kobs, an observed first-order rate constant with units of inverse time, at each inhibitor concentration. The kobs values are then fit to equation (2) to determine the kinact and KI.
This is illustrated in
Figure 2B
for inhibitor E. The maximum potential rate of inactivation, kinact, is 0.0693 min−1, which is only observed at inhibitor concentrations well above the KI of 1000 nM. This rate can also be represented as a
The second general category of covalent and irreversible inhibition is a nonspecific reaction between a nucleophile on a cellular macromolecule (e.g., a protein or glutathione) and an inhibitor bearing a reactive electrophile. When the cellular macromolecule is a protein, the efficiency of this reaction can be considered equivalent to the kinact/KI as depicted in Figure 1B . In this case, there is no evidence of a reversible binding event between the protein and electrophilic inhibitor, and this fact elicits the nonspecific description. In practice, it may be more accurate to conclude that the KI is much higher than the top concentration of inhibitor included in the kinetic study. As illustrated in Figure 2D , the relationship between inhibitor concentration and kobs is linear with a slope that is equal to the kinact/KI. A similar plot may be obtained when the cellular macromolecule is a small molecule and there is no potential for a reversible binding event. Estimates range from 0.005 M−1s−1 to 0.34 M−1s−1 for acrylamide toward cysteine, glutathione, or protein sulfhydryl groups.26–28 Despite these small rate constants, many reactions were complete in less than 5 min. 26 Estimates of the second-order rate constant of 26 Michael acceptors for glutathione spanned five orders of magnitude and were as high as 21 M−1s−1. 29 Estimates of nonspecific reactivity can also be made at a fixed concentration of inhibitor, often presented as a half-life (t1/2) of the inhibitor. An evaluation of almost 50 electrophiles that might be considered in drug discovery produced half-lives ranging from a few minutes to >60 min using millimolar concentrations of reactants. 30 However, as illustrated in Figure 2D , these observed rates will change as a function of the inhibitor concentration.
There are two important points to remember when looking at the plots shown in Figure 2 . First, the most efficient specific inhibitor ( Fig. 2C ) can produce a plot very similar to a nonspecific inhibitor ( Fig. 2D ). Both can have nearly identical observed rates of inactivation that reflect a similar reactivity between the nucleophile and electrophile. Both also have KI values greater than the top concentration of inhibitor included in the experiment. They differ in the concentration of inhibitor required to produce the observed rate of inactivation. A specific inhibitor will require far less inhibitor for covalent modification because it has a potent reversible binding component defined by KI. This produces a much higher kinact/KI than a nonspecific inhibitor having a much higher KI and a smaller kinact/KI. This highlights a potential challenge in evaluating covalent fragments. Many of these could appear to be nonspecific in a kinetic study with KI values well above the highest concentration tested. As presented later, it is important to estimate the KI using an alternative method (e.g., biophysical or direct binding). This might differentiate an interesting fragment active from an undesirable, nonspecific active. Second, the y-intercept of the kinact/KI plots in Figure 2B–D should be 0. In some cases, the electrophile can be chemically modified so that the covalent complex (P-I) can revert back to the reversible complex (P•I).31,32 This would give y-intercepts that are >0. Although this is an intriguing type of covalent inhibitor that may allow one to achieve a specific residence time, this perspective will focus on completely irreversible inhibitors.
There are many methods to determine the kinact/KI of an inhibitor. The classical approaches, represented for enzyme activity assays and illustrated earlier for a binding assay, have been well documented.33,34 However, these studies can be time-consuming, and the data analysis requires careful interpretations. 35 Some biochemical assays measuring enzyme activity have nonlinear relationships between the product concentration and the measured signal, which affects how the data should be analyzed. 36 In addition, it can be difficult to accurately estimate the y-intercept in Figure 2B , and inhibitors with a very slow off-rate can be mistaken for an irreversible inhibitor. This might not be an issue for inhibitors like Birb796, with a t1/2 offset of 23 h, which lacks a reactive electrophile. 37 However, the presence of a reactive group is insufficient to assume that the time-dependent inhibition observed ( Fig. 2A ) is due to a covalent event. Time-dependent inhibition can also result from a slow step prior to covalent bond formation. Kinetic studies should be complemented by mass spectrometry to confirm formation of a covalent protein-inhibitor adduct with the expected shift in the mass of the protein.38–43 There have been numerous reports of higher throughput methods to estimate kinact/KI. These include evaluating the IC50 versus time, calculating kobs/[I], or measuring competition with an irreversible probe.44–54 Many of these examples originate from studies of cytochrome P450 enzymes, where the kinact/KI is used to understand the potential for drug-drug interactions in the clinic. These methods can provide higher throughput alternatives, which offer significant improvements over an IC50 measurement.
Identification of Covalent Inhibitors
There are primarily two strategies to identify a covalent inhibitor. They are rationally designed from a reversible scaffold or found in a screening campaign of electrophilic small molecules or fragments. In the first approach, a reversible inhibitor is identified and, if a reactive nucleophile is accessible in the binding pocket, an electrophile is designed into the inhibitor. If the electrophile is suitably positioned relative to the nucleophile, then a covalent bond is formed. Ibrutinib is a good example of a covalent inhibitor rationally designed from a reversible scaffold with an IC50 of 8.2 nM. 55 An optimally positioned acrylamide forms a covalent bond to Cys481 in Bruton’s tyrosine kinase (Btk). This produces an IC50 of 0.72 nM, likely reflecting the concentration of Btk in the assay. Rational design from a reversible scaffold is often the preferred method to identify a covalent inhibitor. When this strategy is executed successfully, the chemical scaffold has been proven to make a productive and irreversible complex with the target protein. However, it can be very challenging to identify high-quality reversible inhibitors. The second approach to identify a covalent inhibitor could result from screening a collection of electrophilic compounds. This has been reported using mass spectrometry and applied to fragment-based drug discovery.56,57 Surprisingly, covalent fragments may be more selective than expected. 58 Once identified, the inhibitor would need to be evaluated in a biochemical format to confirm the covalent event has some functional consequence on the protein’s activity. In addition, relatively little quantitative information may be known about the potency of the first reversible step, and some actives may be nonspecific with no measurable binding event. Additional characterizations are critical to successfully select and advance the most promising starting points. This includes understanding the biochemical activity, the proper triage of nuisance inhibitors, and the incorporation of biophysical studies.
Whether a covalent inhibitor is identified through rational design or in a screen, a biochemical assay is often used to identify inhibitors with covalent binding properties. This can be accomplished by preincubating the putative covalent inhibitor with protein prior to starting the assay. The resulting IC50 can be compared to an assay lacking any preincubation. Those inhibitors showing a shift in IC50 are time dependent. When the time dependence is due to covalent modification, the resulting IC50 depends on the time points selected and the individual kinact and KI terms. This is illustrated in
Table 1
, where the IC50 values of six covalent inhibitors, with kinact/KI values ranging from 1.2 × 10² M−1s−1 to 1.2 × 10⁶ M−1s−1, are presented for different preincubation and assay times in a protein binding assay. The shifts in IC50 range from only ~2- to 10-fold. IC50 estimates in an enzyme activity assay are only slightly higher (up to 1.4- and 2.5-fold) with similar shifts in potency (unpublished observation). The greatest shift occurs when the preincubation time (2 h) exceeds the assay time (0.5 h). In this comparison, there is a relatively large difference in the total time (0.5–2.5 h). When the assay time increases to 4 h and the difference in the total time decreases (4–6 h), the IC50 values ± preincubation become indistinguishable. Therefore, shifts in an IC50 can be very misleading, and the kinetics should be evaluated to determine the potential for irreversible inhibition. In all four assay conditions simulated, the observed IC50 is roughly proportional to the kinact/KI. This is particularly evident at the longer preincubation and assay times. However, these simulated IC50 values do not account for the target protein concentration. The lowest measurable IC50 in a biochemical assay is one-half the target protein concentration and typically ranges from high picomolar to tens of nanomolar. Assuming a biochemical assay uses 10 nM protein, all IC50 values measured for inhibitors A and B are 5 nM, and any apparent shift in IC50 has been eliminated. This creates an issue during SAR because these two inhibitors have a 10-fold difference in kinact (
Perhaps the greatest challenge in using a screening strategy to identify covalent inhibitors is the presence of nuisance inhibitors in many compound libraries. 59 Nuisance inhibitors represent a broad class of problematic mechanisms, including, at present, aggregation-based events, redox-based mechanisms, and Pan Assay Interference Compounds (PAINS). Of great concern is that many of these nuisance inhibitors produce time-dependent inhibition or react with proteins. Aggregation-based inhibitors were characterized, in part, based on their time-dependent inhibition and were initially thought to be covalent inhibitors.60,61 Some compounds can inhibit enzyme activity by oxidizing cysteine residues or altering the redox state of metals or cofactors.62,63 Some of these false-positive redox actives have produced enticing isothermal calorimetry (ITC) results, albeit with poor-quality traces and a KD value that does not correlate to the biochemical potency. 64 PAINS represent a more diverse set of false-positive mechanisms that includes redox cyclers, covalent modifiers, metal complexers, and unstable compounds.65,66 As represented by a set of covalent inhibitors of the p53-HDMX complex, these can appear as attractive starting points that fail only after placed under greater scrutiny in a more in-depth mechanistic evaluation. 67 Some PAINS are light dependent and react with otherwise unreactive amino acids like the main chain of alanine.68,69 Compound stability in buffer can also produce misleading time-dependent behavior. 59 It can be difficult to predict the sensitivity of a target protein to these nonspecific reactive events. While a screening campaign for a thiol protease produced only a small fraction of reactive false positives, most screening actives for a histone acetyltransferase were thiol reactive.70,71 Fortunately, awareness of these nuisance events has dramatically increased along with publications of strategies for their identification and triage.66,72–77 Many of these nuisance inhibitors will appear nonspecific in a kinact/KI study ( Fig. 2D ) and should produce unexpected protein-inhibitor adducts by mass spectrometry.
The growth of biophysical techniques in drug discovery, including surface plasmon resonance (SPR), thermal denaturation assays, and ITC, may greatly benefit the identification and characterization of covalent inhibitors.78–84 While any individual technique can be misleading, the proper combination of biophysical and mechanistic studies can identify tractable scaffolds. In these applications, the reactive nucleophile in the target protein could be mutated to an unreactive amino acid (e.g., cysteine to serine or alanine), and the KD of the first reversible step could be determined. When the compound originates from a screening library, this might provide a strategy to triage nuisance inhibitors and confirm the inhibitor is making a real, productive interaction with the protein. For example, a cysteine to alanine mutant of glucagon-like peptide-1 receptor (GLP-1R) was critical to identify positive allosteric modulators acting through a specific covalent mechanism.
85
This was important given that many of the nonspecific electrophiles identified were not well predicted by computational methods. In addition, a combination of mutational studies and mass spectrometry was used to identify the amino acids responsible for covalent modification of human monoacylglycerol lipase.
38
Unreactive mutants might also be used to determine or confirm the Ki for inhibitors with very high kinact/KI values (
Fig. 2C
). The kinact (or
Kinetic Perspective of SAR
After identification of a mechanistically confirmed specific covalent inhibitor, a drug discovery team can then initiate an optimization campaign to understand the SAR and improve inhibitor binding and covalent bond formation. In the optimization of fatty acid amide hydrolase (FAAH), kynurenine aminotransferase (KAT) II, and epidermal growth factor receptor (EGFR) inhibitors, understanding the kinact/KI was an important factor.89–91 A subset of the human KAT II SAR showed significant changes in the kinact/KI with relatively no change in the IC50. The IC50 values were all nearly identical to the enzyme concentration (30 nM) used in the assay. For EGFR, the kinact/KI results demonstrated that improvements in the KI were critical to achieve optimal biochemical and cellular potency. Improvements in the KI should provide at least two benefits. First, inhibitors with a potent KI may bind more specifically to the target protein and be more selective against a prospective off-target protein. Second, since the rate of inactivation at KI is only one-half the maximum potential rate (kinact), an inhibitor with a lower KI will permit use of a lower drug concentration to rapidly modify the target protein. In addition to understanding on-target events, the kinact/KI is a critical parameter used to understand off-target events. In an evaluation of time-dependent cytochrome P450 3A4 inhibitors, kinact/KI values were a better predictor of drug-drug interactions in the clinic than IC50 studies. 92 The authors suggest IC50 studies should be restricted to preliminary investigations.
Despite examples showing the importance of the kinact/KI, there is still an overreliance on IC50 values to drive the SAR of covalent and irreversible inhibitors. As mentioned earlier, determining a kinact/KI can be more time-consuming and requires a more careful interpretation of the data. However, it is also true that some IC50 measurements provide an estimate of the kinact/KI. In the discovery and SAR of transglutaminase (TG) 2 inhibitors, a good correlation (R
2
= 0.95) between the biochemical IC50 and kinact/KI was observed.
93
In this case, most IC50 values were at least 10-fold higher than the enzyme concentration (20 nM) used in the biochemical assay. When the IC50 values are higher than the enzyme concentration, indicating that not all the protein has been covalently modified, a stronger correlation between the IC50 and kinact/KI is expected. The correlation will improve as the kinact decreases and the impact of the covalent event becomes less significant. The rationale for this observation is represented in
Figure 3
, showing the decrease in IC50 over time for inhibitors C, D, and E (
Table 1
). When time to reach equilibrium for the first reversible P•I complex is rapid, relative to the measurement time, the IC50 at a time approaching 0 is equivalent to the KI, after accounting for the concentration of competing ligand in the assay. At the earliest time points, the IC50 of inhibitors D and E approaches equivalence because they have the same KI. The IC50 will decrease over time as a function of the kinact and KI until there is a direct correlation between IC50 and the kinact/KI. At later time points, the IC50 of inhibitors C and D are equivalent because they have the same kinact/KI. An analysis of the shift in IC50 over time can even produce an estimate of the kinact and KI terms.47,48,50,51 However, at some later time point, the IC50 measured in a biochemical assay will be one-half the target protein concentration in the assay. This is otherwise referred to as a “tight-binding” condition, and the IC50 is always proportional to the target protein concentration. For example, if an assay uses 10 nM protein and a 2-h preincubation, then the IC50 of inhibitors A to D would be 5 nM despite having dramatically different KI and
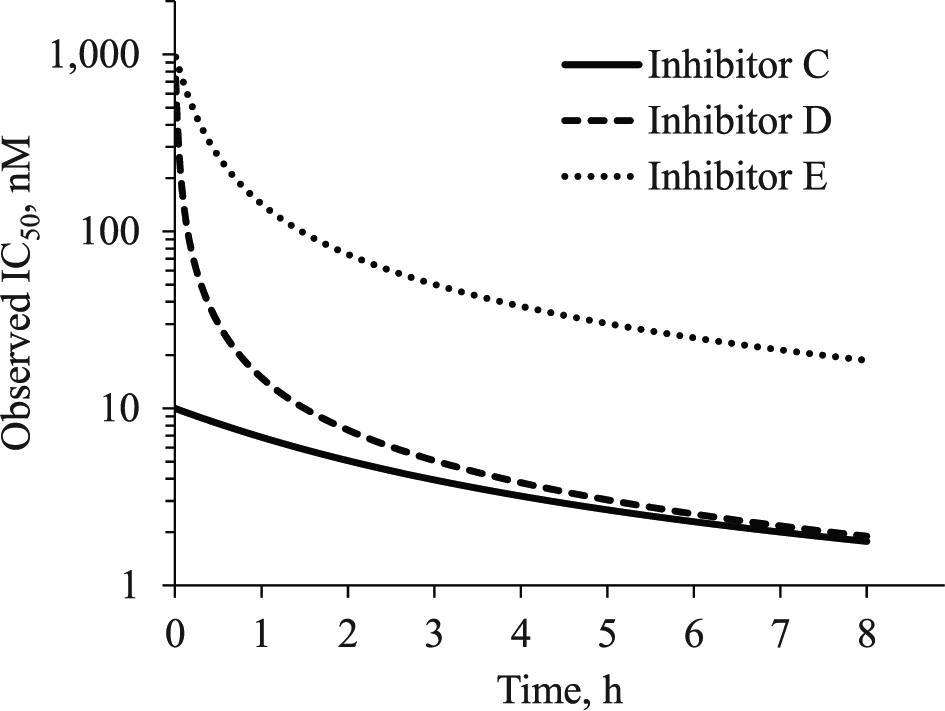
In a biochemical and cellular assay, the IC50 of an irreversible inhibitor will shift from a value that approximates the KI (inhibitors D and E) to a value that correlates with the kinact/KI (inhibitors C and D). The rate of change over time will depend on the relationship between inhibitor concentration and rate of covalent modification defined by its kinact/KI. In a biochemical assay, the lower limit of the IC50 is one-half of the enzyme concentration. In a cellular assay, the lower limit of the observed IC50 may be well below the cellular concentration of target protein.
Perhaps the greatest risk of an overreliance on an IC50 is that it does not inform whether the reactive electrophile selected is optimally positioned in the binding pocket. This is best confirmed by measuring the kinact during SAR. For example, consider the nucleophilic attack of a π (double) bond. Not only must the electrophile be placed at the correct distance from the nucleophile, but there are two optimal angles to consider, defined as the Bürgi-Dunitz and Flippin-Lodge angles.40,94 Collectively, these define the precise relative location of the nucleophile and electrophile in three-dimensional space required for an optimal rate of covalent bond formation. Modification of any part of the inhibitor could reposition the scaffold in the binding pocket, alter these angles and distances, and affect the rate of covalent bond formation. Some of these changes, designed to improve the rate of covalent bond formation, might affect binding to the target protein. As a result, improvements in the kinact could be at the expense of the KI (and vice versa). These trade-offs might be leveraged to design a more selective inhibitor.
Figure 3
and
Table 1
contain two inhibitors (C and D) that have similar IC50 and kinact/KI values. This masks a 100-fold difference in their individual kinact or KI values. Inhibitor C has a longer
The application of kinact/KI during SAR can also directly influence how to define selectivity. For example, consider an inhibitor targeting protein B and selective for protein F. The kinetic constants and simulated IC50 values are shown in
Table 1
. Based on their kinact/KI values, the inhibitor would appear to be 1000-fold selective, resulting from a 100-fold shift in KI and 10-fold shift in
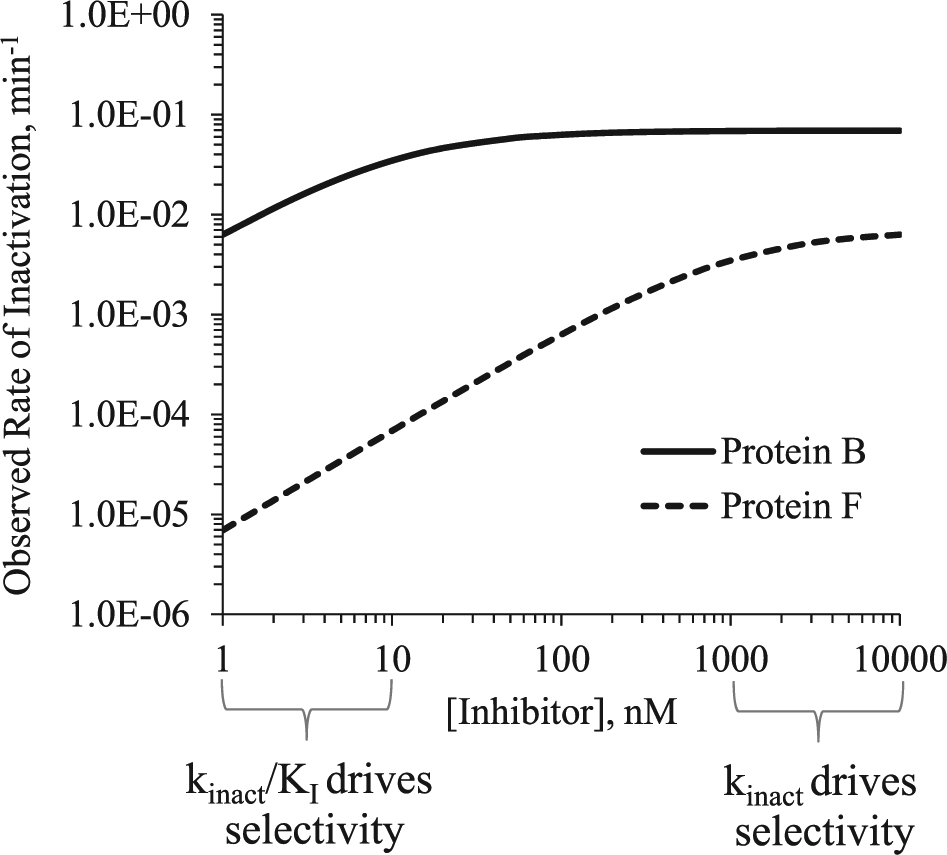
The kinact/KI relationship is illustrated for an inhibitor with an apparent 1000-fold selectivity for protein B over protein F (
Table 1
). The kinact/KI for protein B is 1.2 × 10⁵ M−1s−1 with a KI of 10 nM and a kinact of 0.0693 min−1 (
Translation of Kinetics to the Cell
Perhaps the greatest risk of relying on a biochemical kinact/KI is that they are determined using purified proteins. As presented earlier for EGFR, it is important to understand the correlation between the biochemical kinact/KI and the cell-based potency. 91 In addition, a good correlation between KI, determined from the kinact/KI, and cell death was used to implicate caspase 8 in a cell model of apoptosis. 99 When a good correlation does not exist, the incorrect protein or protein complex may have been selected for the biochemical kinact/KI study. As a result, it is always most appropriate, when possible, to use physiologically relevant proteins and reagents in biochemical assays. 100 When the target protein is an enzyme and the objective is to identify a new chemical scaffold, it is important that the biochemical assay is mechanistically balanced so that all potential forms of the enzyme are present in the kinact/KI study. 100 When the objective of the kinact/KI study is to better understand the cellular activity, more physiologically or disease-relevant conditions should be considered (e.g., high concentrations of ATP for a kinase target). When the reactive nucleophile is cysteine, its oxidation state will also affect the biochemical correlation to cells. In a biochemical assay, mild reducing agents that do not react with the electrophilic inhibitor may be needed to ensure the cysteine remains reduced over time. In a cell-based assay, cysteine can undergo posttranslational modifications that can be important for a wide range of biological functions, including metal binding, structural integrity, nucleophilic and redox catalysis, and other regulatory roles. 101 There are 200 kinases with a cysteine near the ATP pocket, and their activities may be regulated by the oxidation state of the cysteine.102–104 For example, epidermal growth factor (EGF) stimulation of cells leads to oxidation of Cys797 in EGFR and increased tyrosine kinase activity. 105 The same cysteine is targeted by several covalent inhibitors. 106 The additional steric bulk of an oxidized cysteine increases the KI of covalent inhibitors. 91 This might also prevent covalent bond formation in cells. When these oxidation events are in equilibrium with a reducing event, this might only decrease their cellular kinact/KI. The presence of other posttranslational modifications or binding partners in a cell could produce a similar effect and result in a poor correlation to the biochemical kinact/KI. It is important to continue monitoring this correlation throughout an SAR because it may identify an inhibitor whose cellular activity is poorly predicted by the biochemical kinact/KI. Some of these observations could be leveraged to design or identify more physiologically relevant inhibitors. A poor correlation may also indicate that an off-target event is affecting the cellular response.
It has been well established that competition with high concentrations of ligands, substrates, and accessory proteins in a cell will decrease the observed potency of a rapid equilibrium reversible inhibitor. 107 This is an issue for a majority of drugs, as 80% of Food and Drug Administration (FDA)–approved drugs from 2001 to 2004 compete with a substrate or ligand for binding to a target protein. 108 This competition may also result from enzyme inhibition that produces higher transient substrate levels, and irreversible inhibitors can provide a strategy to overcome this competition.109,110 Substrate competition can also have a significant impact on our view of cellular selectivity. This has been reviewed for kinase inhibitors that have large variations in the KM of ATP. 111 The observed biochemical potency and selectivity of an ATP competitive inhibitor will shift in cells as a function of the cellular concentration of ATP and the KM for each kinase. For an irreversible inhibitor, the formation of the first reversible P•I complex will be governed by the same rules. The observed KI measured in a mechanistically balanced biochemical assay will shift to some higher value in cells (appKI) as a function of the concentration of competing ligand relative to its binding constant. When this occurs, the cellular kinact/KI will be proportionally lower than the biochemical kinact/KI. When the target protein is a multisubstrate enzyme, it may also be important to understand both the enzyme reaction mechanism and which form of the enzyme is bound best by inhibitor. This might provide a mechanistic rationalization for a difference between a biochemical and cellular kinact/KI.
The translation of biochemical potency to the cell is also complicated by differences in incubation times and protein resynthesis. For example, the effect of epigenetic inhibitors in cell-based assays can take days to see changes in a mark or gene and perhaps weeks to see a phenotypic response. 112 In these cases, the inhibitor is given a relatively long time to covalently modify the target, and this would lower the observed IC50. This can significantly affect correlations to a biochemical IC50 that may have resulted from a shorter incubation time. Longer cell-based assays also increase the risk of protein resynthesis. In the human A549 adenocarcinoma cell line, roughly 500 of 600 proteins have a rate of degradation <0.1 h−1 (or t1/2 >6.93 h). 113 So while most proteins appear to be very stable, a small yet significant fraction has higher rates of degradation and perhaps resynthesis. Proteins in yeast can be synthesized just in time to meet the demands of the cell cycle. 114 The expression of GFP in K562 cells occurs only 4 h after transfection. 115 Protein resynthesis may also be triggered by a stimulant. Following sugar uptake in Escherichia coli, proteins in the arabinose utilization system are resynthesized in less than 20 min. 116 Covalent modification of the target protein may also affect the protein turnover. 117 For example, the turnover of interleukin-2 inducible T-cell kinase (Itk) in resting primary T cells is approximately 2 h. Following covalent modification of Itk, the related pathway is silenced for more than 24 h to suggest Itk has not yet been resynthesized. Finally, the rate of resynthesis might be affected by the rate of cell proliferation. Inhibitors that alter cell growth might be expected to alter protein resynthesis rates. Taken together, these factors could affect the observed cellular IC50 and kinact/KI of a covalent inhibitor.
In a biochemical setting, the most potent IC50 that can be obtained is simply one-half of the purified, functional target protein added in the assay. The lowest potential concentration of target protein in a cell can be estimated using the volume of the cell. For example, one protein molecule placed in E. coli would have a concentration of 1 nM. 118 This may be ~500-fold lower in larger human HeLa and U2O2 cells. 119 An analysis of the global protein expression profile in Saccharomyces cerevisiae revealed as few as 50 to more than one million individual copies of a protein per cell. 120 This reflects protein concentrations ranging from 1 nM to over 20 µM and correlates well to estimates of 10 nM and higher.118,121 Regardless, IC50 values far below these concentrations can be obtained in cells. The target protein concentration in cells reflects the number of protein molecules in the relatively small volume of a cell. Significantly lower concentrations of inhibitor present in the much larger media volume would often still provide a stoichiometric excess of inhibitor to covalently modify all the target protein. 111 This does not mean that the cellular potency is independent of the target protein concentration or expression levels in cells. For example, the expression of Bcr-Abl protein decreases in cells with short-interfering RNA (siRNA) treatment, and this increases the sensitivity to imatinib. 122 When differences are observed in the potency of an irreversible inhibitor, it may reflect differences in the cellular kinact/KI.
In addition to these issues, compound permeability, choice of cell line, and proximity of the measured response relative to the target protein are important factors to consider. Collectively, these potential issues highlight the importance of demonstrating covalent bond formation in cells and understanding the cellular kinetics. There are several tools available to interrogate this in cells. Measuring the cellular activity of an inhibitor after washing out unbound and reversibly bound inhibitor can be a simple method to demonstrate irreversible behavior. 123 In addition, irreversible fluorescent probes can be useful tools to determine the fraction of unbound target protein in cells. 124 This was used in the clinical development of ibrutinib and may have applications much earlier in drug discovery. While this can be a powerful method to show target engagement in cells, it is important to remember that even minor modifications of a covalent inhibitor or probe can have a dramatic impact on its cellular pharmacology. 125 Therefore, potential probes should be well characterized. Occupancy assays should be complemented by functional cell-based assays to understand the consequence of covalent occupancy. When possible, a more in-depth evaluation of the cellular kinetics can be performed. For regulator of G-protein signaling (RGS) 4, covalent modification in cells was confirmed using a combination of Western blots and mass spectrometry. 126 For Kelch-like ECH-associated protein (Keap) 1, the kinetic rate constants for an irreversible inhibitor were measured against different cysteines on Keap1 in HEK293 cells. 127 More recently, the cellular kinact/KI for a covalent inhibitor (ARS-853) of GDP-bound KRAS(G12C) was determined to be 140 M−1s−1 in H358 cells. This correlated well to the biochemical kinact/KI of 76 M−1s−1. 128 Last, the discovery and characterization of FAAH inhibitors offer a workflow for evaluating the cellular pharmacology and proteomic profile of a covalent inhibitor.129,130 With any of these studies, increasing either inhibitor concentration or incubation time will improve covalent modification of the target protein and identify more specific and nonspecific off-target activities. Each of these events will be driven by a kinact/KI relationship. When armed with that information, what are the most relevant time points and concentrations to test? The cell-based assay conditions may be the most appropriate consideration when that assay is the object of the investigation. For the most advanced inhibitors, it is best to consider the pharmacokinetic profile.
Covalent Kinetic and Pharmacokinetic (CK/PK) Relationship
For a rapidly reversible inhibitor, the observed pharmacodynamic (PD) effect should be directly linked to the observed pharmacokinetic (PK) profile. As a result, the target is inhibited only when the in vivo exposure of the inhibitor to the target protein is higher than its binding constant in that setting, often estimated by a relevant cell-based assay. This ratio drives whether the target will be occupied with inhibitor. As the drug is cleared from the body and the concentration of inhibitor decreases below that binding constant, the target’s functional activity is restored. In contrast, irreversible inhibitors (or inhibitors with a very slow off-rate) have a pharmacodynamic response that extends beyond what the pharmacokinetic profile would predict. Once all the target protein has been covalently modified in vivo, the inhibitor may be cleared from the body and the target protein’s functional activity would only return when new protein is synthesized. This has been referred to as the “ultimate physiological goal” of an inhibitor. 131 In fact, the target protein in vivo would only need to be exposed to a sufficient concentration of inhibitor for a specific time necessary to form the covalent bond. How should the concentration and time required be determined? As illustrated earlier in Figure 2 , the relationship between concentration of inhibitor, time, and rate of covalent bond formation is defined by the kinact/KI relationship, and it provides a useful guide.
Physiologically relevant kinact (or
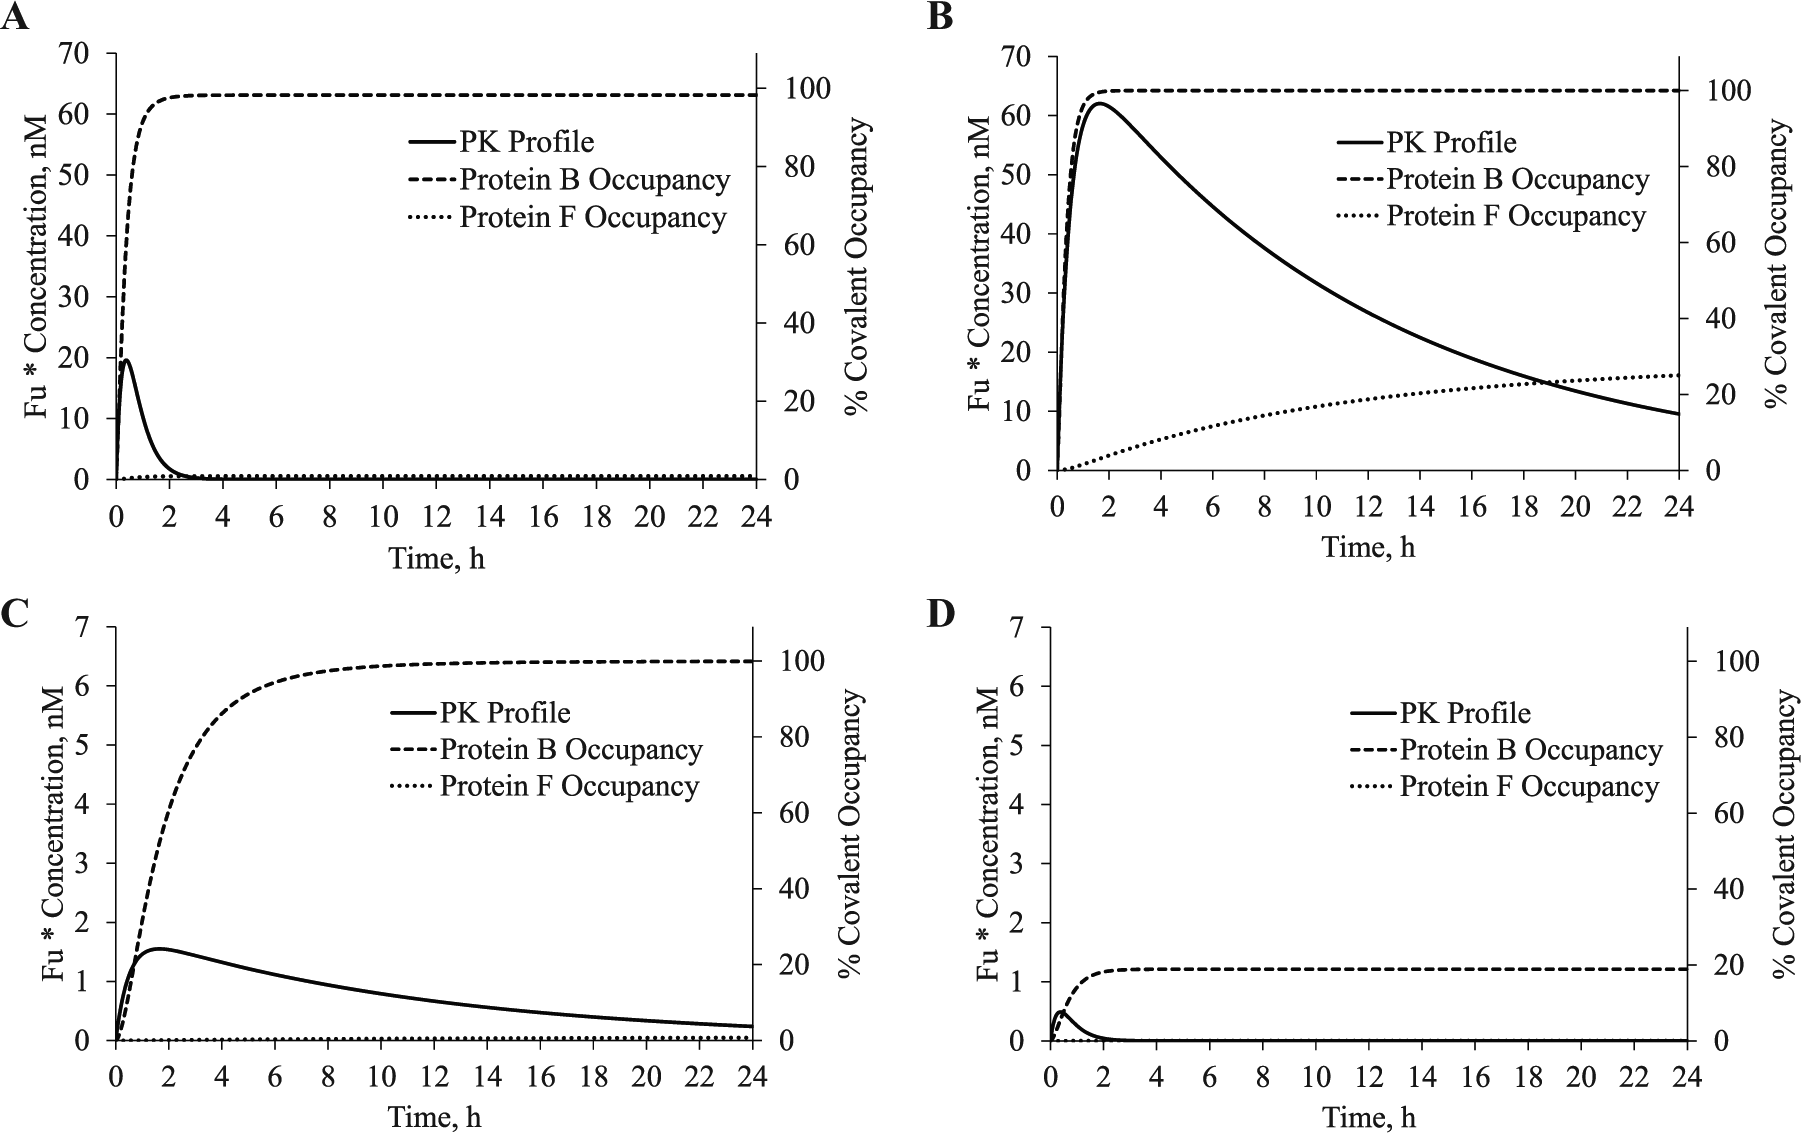
A model of the covalent kinetic (CK) and pharmacokinetic (PK) profiles where the kinact/KI, dose, and clearance were varied. The percent covalent target occupancy of an inhibitor was modeled using the kinact/KI for proteins B and F in
Table 1
. (
In Figure 5B , the same relationship from Figure 5A is modeled except the clearance was reduced to 5 mL/min/kg. As a result, a dose of 10 mg/kg achieves an unbound Cmax of 62 nM and an unbound AUC(0–∞) of 833 nM*h. After 24 h, 10 nM of inhibitor is still present, and the unbound AUC(0–24h) is 722 nM*h. This profile quickly produces 100% covalent occupancy of protein B. The improved exposure over time also results in increased occupancy of the off-target (25.0% occupancy of protein F). This is despite the 1000-fold difference in their kinact/KI. The higher unbound Cmax produced here could decrease the observed selectivity, as illustrated in Figure 4 . This would appear to justify the rationale for advancing covalent inhibitors with a faster clearance. However, in Figure 5C , the dose was lowered 40-fold from 10 mg/kg to 0.25 mg/kg. This produces an unbound Cmax of 1.6 nM, an unbound AUC(0–∞) of 20.8 nM*h, and an unbound AUC(0–24h) of 18.1 nM*h. Interestingly, the modeled covalent occupancy at 24 h was ~100% and ~0% for proteins B and F, respectively. This matches the modeled occupancy in Figure 5A at 10 mg/kg with a more rapid clearance. When the modeled dose in Figure 5A is reduced 40-fold to 0.25 mg/kg in Figure 5D , only 18.9% covalent occupancy of protein B is achieved at 24 h. Therefore, the simulations in Figure 5A , C produce nearly identical covalent occupancies for the on-target (protein B) and off-target (protein F). Despite having different PK profiles, they require very different doses and share a common unbound AUC.
The covalent kinetic and pharmacokinetic profiles modeled in
Figure 5
suggest that the unbound AUC may be the dominant pharmacokinetic parameter. In an effort to rationalize this observation, equation (3) was derived (
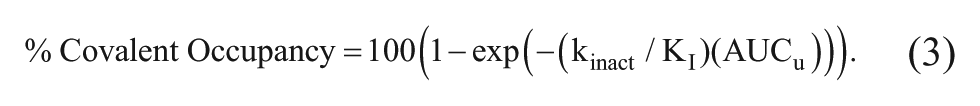
This equation defines a direct relationship between the kinact/KI and the unbound AUC in the estimation of covalent occupancy. In this context, the unbound AUC reflects the area under the curve in a PK plot showing the concentration of drug exposed over time to the target protein. Armed with an understanding of the relationship between dose and unbound AUC, a physiologically relevant kinact/KI can now be used to estimate the dose needed to achieve a specific covalent occupancy. The primary assumption in the derivation of equation (3) is that the concentration of inhibitor is below KI. This assumption essentially excludes any contribution of reversible inhibition (P•I) and the % Covalent Occupancy term reflects only covalent bond formation. As illustrated in Figure 2B and Figure 4 , inhibitor concentrations at and above KI provide little improvement in the observed rate of covalent bond formation and may prevent selective inhibition.
Equation (3) might serve as a useful tool for drug discovery teams to quantify the PK/PD disconnect observed for covalent and irreversible inhibitors. This might be helpful at the earliest stages of drug discovery where trade-offs are consistently made between in vitro inhibition and PK properties. For example, a 10-fold increase in the unbound AUC and any decrease in kinact/KI less than 10-fold would be expected to improve the in vivo covalent occupancy. Likewise, improvements in the kinact/KI at the expense of the unbound AUC might improve in vivo covalent occupancy. However, it is important to consider that equation (3) is an oversimplification of a much more complex system. It does not account for many other important factors, including protein resynthesis rates. As a covalent inhibitor effort matures, the team will need to build a more complete model incorporating all relevant factors. Many excellent examples of this can be found for the time-dependent inhibition of cytochrome P450 enzymes.132–138 In these instances, the kinact, KI, and Ki terms were critical factors used to model drug-drug interactions. In fact, the FDA and European Medicines Agency recommend kinact/KI studies to assess the risk of drug-drug interactions.139,140
The relationship defined by equation (3) was then used to understand the profiles in Figure 5 . Protein B has a kinact/KI of 1.2 × 10⁵ M−1s−1, and equation (3) would predict that an unbound AUC(0–24h) of 6.93 nM*h is needed to achieve 95% occupancy. In the four PK profiles modeled in Figure 5 , the unbound AUC(0–24h) exceeds 6.93 nM*h in the three situations where >95% occupancy was modeled. Only in Figure 5D , where the unbound AUC was 0.52 nM*h, was the modeled occupancy <95%. Using an unbound AUC of 0.52 nM*h and a kinact/KI of 1.2 × 10⁵ M−1s−1 for protein B in equation (3) yields an expected occupancy of 19.4%, which correlates well to 18.9% in the full model. A summary of the PK parameters and occupancies modeled in Figure 5 can be found in Table 2 . As expected, equation (3) overestimates the modeled occupancy as the inhibitor concentration approaches or exceeds the KI. The challenge in applying equation (3) to predict in vivo covalent occupancy is estimating the in vivo kinact/KI. The best estimate may be obtained from a time-dependent evaluation of a relevant cell-based assay.33,34 An estimate might also be obtained from a biochemical kinact/KI after accounting for a shift in KI due to competing ligands in the cell or from a cellular kinact/KI determined using an IC50 shift assay.47,48,50,51,111 In some cases, the in vivo or cellular kinact/KI might be estimated in equation (3) using the unbound AUC or the concentration of inhibitor presented to the cells over time as an approximation of the AUC, respectively. Of course, this requires evidence of covalent bond formation, concentrations of inhibitor below the appKI in cells, and insignificant rates of protein resynthesis. Collectively, equation (3) may facilitate a more direct correlation of covalent inhibition in a biochemical, cellular, and in vivo setting.
Covalent Kinetic and Pharmacokinetic Parameters Modeled in Figure 5 .
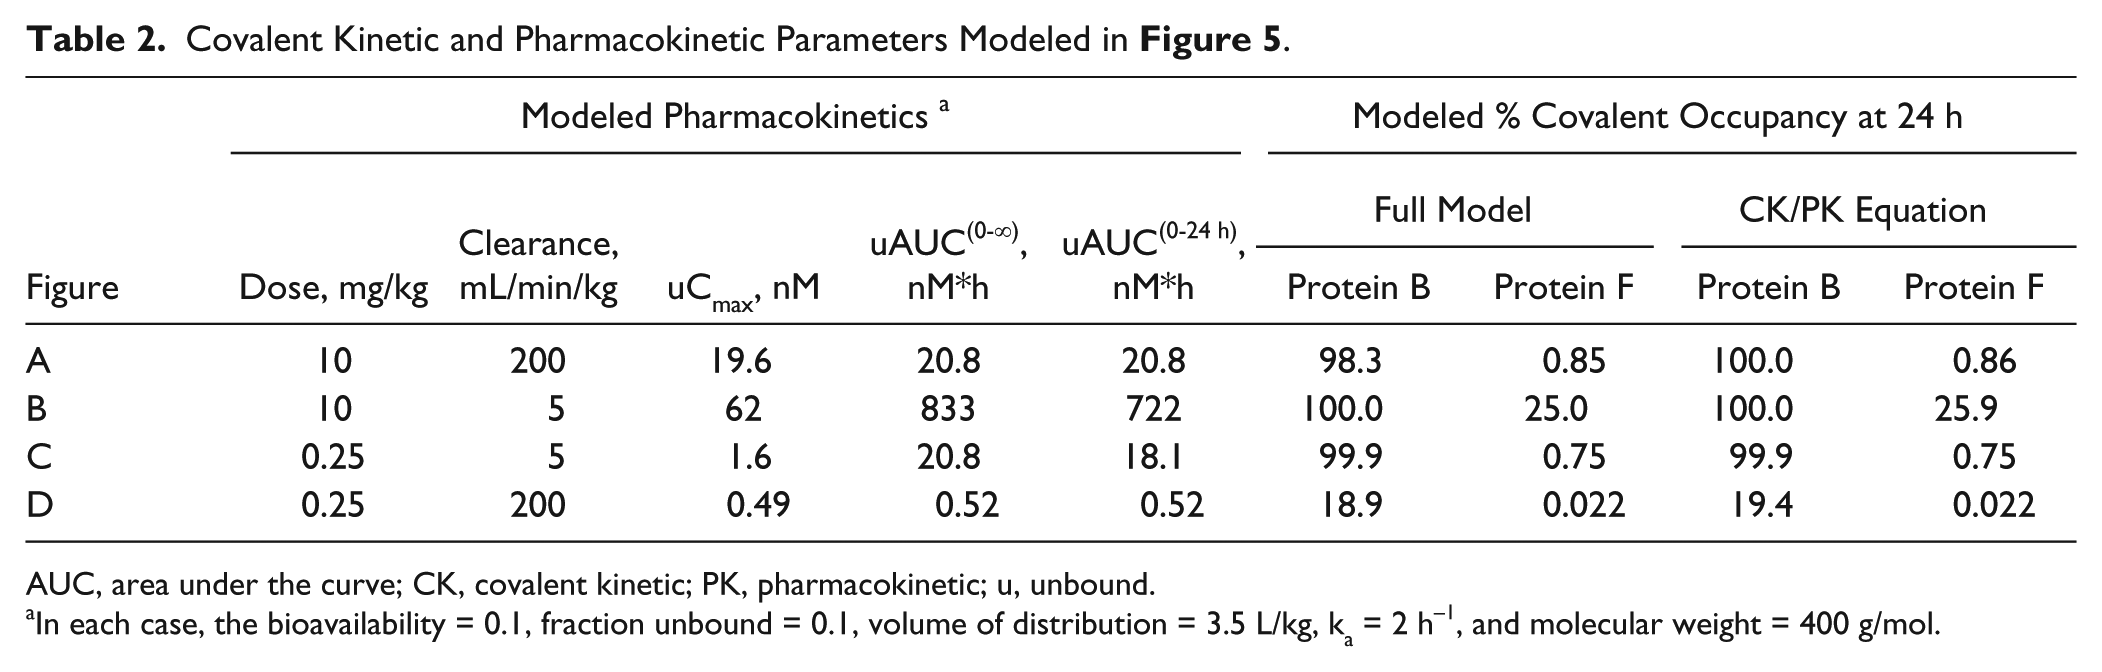
AUC, area under the curve; CK, covalent kinetic; PK, pharmacokinetic; u, unbound.
In each case, the bioavailability = 0.1, fraction unbound = 0.1, volume of distribution = 3.5 L/kg, ka = 2 h−1, and molecular weight = 400 g/mol.
With an understanding now that the kinact/KI is a critical factor to estimate in vivo covalent occupancy, the CK and PK profiles of proteins A to F in
Table 1
were fully modeled in the manner depicted in
Figure 5
. Using the PK profile from
Figure 5B
,
C
, a 10-mg/kg dose is expected to achieve >94% covalent occupancy at 24 h for five (proteins A–E) of the six proteins. Modeling a 1-mg/kg dose would produce >89% occupancy for four (proteins A–D) of the six proteins. In these situations, up to 100-fold selectivity in kinact/KI may not translate to selective in vivo covalent occupancy. Inhibitors showing 1000-fold or higher selectivity may be required. In cases where the PK resembles
Figure 5A
,
D
with a more Cmax-driven AUC, the selectivity becomes a greater concern, as depicted in
Figure 4
. This relationship also illustrates that inhibitors with good PK profiles, yet relatively slow kinact/KI values, would still be predicted to achieve full target occupancy. Inhibitor E in
Table 1
has a relatively poor kinact/KI of 1.2 × 10³ M−1s−1 resulting from a KI of 1000 nM and
In conclusion, the discovery and optimization of a covalent, irreversible inhibitor introduces unique opportunities and risks that teams must balance to deliver a safe and efficacious drug. These inhibitors will produce potent biochemical and cellular activities that will only improve with longer assay times. For a target protein, this is a great benefit and can quickly produce promising in vitro results. For a prospective selectivity protein or macromolecule, this is a problem. In some cases, these selectivity issues may not surface until in vivo studies are performed or, worse yet, in the clinic. While there is a long list of factors that must be considered, the kinetics of covalent bond formation, defined by the kinact/KI, should be a key component of the drug discovery effort. The kinact/KI value defines a relationship between the concentration of drug and the rate of covalent bond formation. That relationship will determine the observed potencies across the biochemical, cellular, and in vivo studies used to identify, optimize, and advance the best and most selective inhibitors. In biochemical and cellular assays, where inhibitors are first identified and the SAR is determined, the individual KI and kinact values are as important as the kinact/KI ratio. Optimization using these measurements will facilitate the identification of a drug that makes a strong, specific interaction and enable the formation of a selective covalent bond to the target protein. For an in vivo study, the optimal CK profile will depend on the desired dose and the PK profile. Inhibitors with relatively weak kinact/KI values could be expected to produce full in vivo covalent occupancy. Teams striving for a low clinical dose should continue improving the kinact/KI. In addition, the (unbound) AUC reflecting drug exposure to the target protein is a critical PK parameter that might be used to estimate in vivo covalent occupancy. Optimization based simply on improving the Cmax may eliminate any apparent selectivity. The relationship between optimal CK and PK profiles is reflected in a simple equation showing a direct relationship between a physiologically relevant kinact/KI, the (unbound) AUC presented directly to the target protein, and covalent occupancy. This might serve as a useful guide for biochemists to provide teams an estimate of in vivo covalent occupancy and selectivity at the earliest stages of drug discovery. The application of this and other recommendations in this perspective might aid in the discovery and development of new drugs with a covalent and irreversible mechanism.
Footnotes
Acknowledgements
I thank John Schindler and my colleagues in ADME, Jeffrey Cramer and Brian Mattioni, and Medicinal Chemistry, Steve Kuklish and Zoran Rankovic, for many helpful conversations and their feedback on this article. I also thank Art Wittwer at Confluence Discovery Technologies for helpful discussions in using DynaFit to confirm the modeling work presented in this article.
Declaration of Conflicting Interests
The author declared no potential conflicts of interest with respect to the research, authorship, and/or publication of this article.
Funding
The author received no financial support for the research, authorship, and/or publication of this article.
References
Supplementary Material
Please find the following supplemental material available below.
For Open Access articles published under a Creative Commons License, all supplemental material carries the same license as the article it is associated with.
For non-Open Access articles published, all supplemental material carries a non-exclusive license, and permission requests for re-use of supplemental material or any part of supplemental material shall be sent directly to the copyright owner as specified in the copyright notice associated with the article.