
Abstract
Pancreatic ductal adenocarcinoma is one of the most lethal tumors since it is usually detected at an advanced stage in which surgery and/or current chemotherapy have limited efficacy. The lack of sensitive and specific markers for diagnosis leads to a dismal prognosis. The purpose of this study is to identify metabolites in serum of pancreatic ductal adenocarcinoma patients that could be used as diagnostic biomarkers of this pathology. We used liquid chromatography–high-resolution mass spectrometry for a nontargeted metabolomics approach with serum samples from 28 individuals, including 16 patients with pancreatic ductal adenocarcinoma and 12 healthy controls. Multivariate statistical analysis, which included principal component analysis and partial least squares, revealed clear separation between the patient and control groups analyzed by liquid chromatography–high-resolution mass spectrometry using a nontargeted metabolomics approach. The metabolic analysis showed significantly lower levels of phospholipids in the serum from patients with pancreatic ductal adenocarcinoma compared with serum from controls. Our results suggest that the liquid chromatography–high-resolution mass spectrometry–based metabolomics approach provides a potent and promising tool for the diagnosis of pancreatic ductal adenocarcinoma patients using the specific metabolites identified as novel biomarkers that could be used for an earlier detection and treatment of these patients.
Keywords
Introduction
Pancreatic ductal adenocarcinoma (PDAC) is a disease characterized by rapid tumor progression and early metastasis. It is considered to be a lethal solid tumor with an overall median survival of 8.6 months and a 9.7% 5-year survival rate. 1 Although the only curative treatment for PDAC is surgical resection, more than 80% of patients with this malignancy have a locally advanced or metastatic tumor that is unresectable at the time of diagnosis. 2 The symptoms most frequently associated with PDAC (weight loss, malaise, fatigue, and pain) are usually unremarkable until the cancer has progressed to an advanced stage. 2
Early detection of PDAC is an important aspect of cancer treatment because early clinical stages (I, II) are easier to cure than later stages (III, IV). Therefore, there is a need for robust, accurate, and noninvasive detection methodology for the early stages of PDAC. 3 Serum protein CA 19-9 is used to monitor existing pancreatic cancer but is not useful in diagnosis because not all patients with PDAC have elevated levels of CA 19-9, and some noncancerous conditions can also produce high levels of CA 19-9. 3 Furthermore, this biomarker is also unable to tell whether a premalignant mucinous cystic lesion has undergone malignant transformation or to distinguish PDAC from tumor-forming lesions caused by benign conditions such as chronic and autoimmune pancreatitis. 4
Metabolomics is an emerging and powerful discipline that provides an accurate and dynamic image of the phenotype of biological systems through the study of endogenous and exogenous metabolites in cells, tissues, and biofluids. In particular, the metabolic fingerprinting, the nontargeted global analysis of tissues and biofluids, strives to fingerprint and semiquantify metabolites and their changes, revealing information about the general metabolic state of the individuals. Metabolomics analysis of human serum is very useful since serum is a rich source of potential biomarkers that are able to reflect the impaired pathways during different disorders. 5
The purpose of this study is to identify metabolites related to PDAC that could be used as biomarkers for the diagnosis of this disease, increasing the life expectancy of PDAC patients (PCPs).
For this goal, serum samples from healthy controls (HCs) and PCPs were collected and analyzed by liquid chromatography coupled to high-resolution mass spectrometry (LC-HRMS) using a nontargeted approach. Untargeted metabolomics aims to analyze metabolites in an unbiased manner, and it has become a popular tool in metabolite biomarker discovery and in the evaluation of metabolic pathway changes associated with disease. Such methods are effective in identifying metabolites that have statistically significant changes among sample cohorts. 6 The HRMS combines the ability to determine masses within 3 ppm with the technology to investigate unknown compounds by a collision-induced dissociation (CID or MS/MS), allowing the establishment of relationships between parent ions and their fragments. Therefore, HRMS represents a major advantage for untargeted metabolomics. 7 Despite their usefulness, metabolomics studies present multiple analytical challenges. In particular, the samples are very complex, containing a diverse set of compounds over a wide polarity range. Since human serum contains an extreme diversity of metabolites, a single liquid chromatographic system, when coupled to HRMS, might not be sufficient to achieve reasonable metabolome coverage. 8 Hydrophilic interaction liquid chromatography (HILIC) offers complementary information to reverse-phase liquid chromatography (RPLC) by retaining polar metabolites. Traditional techniques such as RPLC provide adequate separations of nonpolar metabolites (triglycerides, cholesterol esters, diacylglycerols, sphingomyelins, phosphatidylcholines, phosphatidylethanolamines, fatty acids, eicosanoid, and their metabolites). However, many metabolites are small polar molecules that are difficult to separate by this kind of chromatography. Alternatively, HILIC offers an improvement, due to its multimodal separation capability, which yields an improvement in selectivity and reproducibility of more polar compounds. 9 Besides metabolite separation and detection, the extraction of metabolites prior to HRMS analysis is of equal importance. Concentrating sample extracts and developing separate extractions specific for polar and nonpolar metabolites are common strategies to overcome these challenges and increase metabolome coverage. In this study, we used a combination of RPLC and HILIC with optimized metabolite extraction, which provided the resolved chromatography of highly polar as well as hydrophobic analytes, enabling the analysis of a wide range of chemicals, necessary for untargeted metabolomics experiments. The choice of ionization mode used in LC-HRMS analyses plays a major role in metabolomics. One methodology cannot cover all types of molecules, since some metabolites are better ionized in one ionization mode, while others are ionized more efficiently in another mode. Electrospray ionization (ESI) is becoming a method of choice for profiling metabolites in complex biological samples. This is due to its ability to ionize a breadth of metabolites with minimal fragmentation, robustness, and ability to scale-up to support MS/MS–based structural studies. 10 In this work, we have used ESI in both positive (+) and negative (–) ion modes in combination with the two chromatographic approaches mentioned before.
A critical step in metabolomics is the large-scale, high-throughput conversion of raw LC-HRMS data sets into organized data matrices necessary for further statistical processing and data visualization. Generally, the instrument manufacturer provides software to process raw data and generate a list of ion intensities/areas for detected peaks after peak picking, peak deconvolution, and peak alignment. Prior to the statistical analysis, some steps are necessary to be performed on data matrices in order to obtain meaningful information. Useful preprocessing methods mainly include normalization and scaling. These steps can be used individually or in combination.
It should be noted that the reproducibility of HRMS can be a concern, and thus quality controls (QCs) are normally included in experiments to compensate instrument drift. In this sense, we prepared several QC samples that were periodically analyzed during the injection sequence.
In metabolomics studies, there are multiple statistical techniques available for extracting useful information from the data matrices, including many powerful classification and regression models and multiple model validation methods. These statistical techniques can be combined in a proper way to identify potential biomarkers and demonstrate how useful the selected biomarkers are. 11 In this article, we used in combination two independent variable selection techniques: principal component analysis (PCA) and Student t test. Although there is no guarantee that the different groups will be well separated this way, it is a common practice to keep the first two or three principal components (PCs) and examine the score plots. When the groups are well separated, the metabolites that have large loadings in the first two or three PCs can be selected as potential biomarkers. If PCA is not successful in showing the subtle difference among the sample groups, partial least-square discriminant analysis (PLS-DA) modeling can be used to maximize the separation among the sample groups and target putative biomarkers. Notably, variable importance in projection (VIP) values estimate the importance of each variable in the projection used in a PLS-DA model and are often used for variable selection. The t test is used to indicate how well each variable distinguished the two groups. Following this approach, we were able to observe a significant difference in metabolic profile concerning the two groups under study.
Four molecular features were found significantly downregulated in PCP compared with HC subjects, and they were selected as potential diagnostic biomarkers. Additionally, receiver operator characteristics (ROC) curve analysis was used to assess their clinical usefulness. As an outcome, we showed that the selected biomarkers have good to excellent performance as potential diagnostic biomarkers. 12
Metabolite identification is a labor-intensive task in HRMS-based metabolomics. Currently, this process relies heavily on MS/MS spectra generated simultaneously for peaks of interest identified from time-of-flight (TOF)–MS acquisitions. The most successful compound identification strategies typically involve matching fragmentation spectral features of the unknown compounds to curated spectral databases of reference compounds. This approach, in combination with exact mass and isotope ratio matches, may facilitate metabolite identification. According to this methodology, we were able to assign a tentative identification for each candidate biomarker within two phospholipid (PL) subclasses.
Materials and Methods
Sample Collection
Our study included 28 individuals distributed according two study groups: (1) HCs (composed of 12 individuals) and (2) PCPs (composed of 16 individuals).
The HC group consisted of nondiabetic and nonpancreatitis subjects consecutively recruited from the general community in the same period of time. All were Caucasians and with an age range between 20 and 65 years. All PCPs were Caucasians and with an age range between 46 and 80 years. Only three PCPs had diabetic disease. The sample collection was carried out before starting any therapeutic treatment. Regarding the stage of disease, three patients presented in the early stages (IB, IIB, IIA), while 13 were found in the late stage (IV).
Collection and Preparation of Serum Samples
Samples of venous blood were obtained at the Virgen de las Nieves university hospital in Granada. Written informed consent was obtained from all patients and controls before their enrollment in the study. The study was approved by the ethics committee of the Virgen de las Nieves university hospital, and all clinical investigations were conducted according to the principles expressed in the Declaration of Helsinki (“Ethical Principles for Medical Research Involving Human Subjects”). Before any type of chemotherapy was received, samples were taken in BD vacutainer SSTII advance tubes (Becton Dickinson, Franklin Lakes, NJ) with silica to activate clotting of the specimen, incubated at room temperature for 30 min, and centrifuged for 10 min at 1400g. After, the supernatant was carefully aspirated and stored at −80 °C until the examination.
Metabolomics Analysis
Metabolite extraction
All serum samples were kept at 4 °C throughout the analytical process. The proteins were removed from serum samples using methanol (MeOH) for HILIC (1:5 serum/MeOH) and acetonitrile (AcN) for RPLC (1:3 serum/AcN), and shaken for 60 s. The samples were then centrifuged at 13.300 rpm for 15 min at 4 °C.
LC-HRMS conditions
For HILIC, the supernatants then were evaporated (Savant, Holbrook, NY) and the dry residues were reconstituted in 50% water/AcN. These solutions were transferred to the analytical vials, stored in the autosampler at 4 °C, and analyzed by LC-HRMS. Thus, chromatographic separation was performed by the Agilent Series 1290 LC system (Agilent Technologies, Santa Clara, CA) using a Waters XBridge BEH Amide column (2.1 mm × 150 mm) (Waters Corporation, Milford, MA) kept at 25 °C in ESI (+) and at 45 °C in ESI (–). Mass detection was achieved using an AB SCIEX Triple TOF 5600 quadrupole-time-of-flight mass spectrometer (QTOF-MS) in ESI (+) and ESI (–) (AB SCIEX, Concord, ON). The injected sample volume was 3 μL. The mobile phase (MP) consisted of 0.1% formic acid–90:10 water/AcN (eluent A) and 0.1% formic acid–90:10 AcN/water (eluent B). The gradient elution was performed as follows: 0–0.1 min 99% eluent B, 0.1–7 min 99% eluent B, 7–7.10 min 30% eluent B, and 7.10–10 min 99% eluent B. The elution flow rate was 0.4 mL/min. 13
For RPLC, the supernatants were identically processed and stored. The chromatographic separation and mass detection was performed using a Waters Atlantis T3 HPLC column (C18: 2.1 mm × 150 mm, 3 μm) kept at 25 °C in ESI (+) and at 45 °C in ESI (–). The injected sample volume was 3 μL. The MP consisted of 0.1% formic acid–90:10 water/AcN (eluent A) and 0.1% formic acid–90:10 AcN/water (eluent B). The gradient elution was performed as follows: 0–0.5 min 99% eluent B, 0.5–10 min 99% eluent B, 10–12 min 1% eluent B, 12–12.10 min 99% eluent B, and 12.10–15 min 99% eluent B. The elution flow rate was 0.35 mL/min. The TripleTOF 5600 was operated using an information-dependent acquisition (IDA) method to collect full-scan HRMS and MS/MS information simultaneously. The exact mass calibration was automatically performed every 10 injections. It should be noted that the in-batch sequence of the samples was randomly injected to avoid any possible artificial sample aggregation due to analytical drift.
Within the sequence run, MP samples and QC samples were analyzed. QC samples were prepared by pooling an equal volume of all serum samples included in this study. QC samples were analyzed throughout the run every 10 injections to provide a measurement of the stability and performance of the system. MP samples were run alongside with QC samples to identify impurities of either the solvents or extraction procedure and for checking carryover contamination from intense analytes. 13
Data set creation
Before going to the data set creation, the reproducibility of both mass/charge (m/z) and retention time (RT) was assessed since it plays an important role in the successful processing of metabolomics data, especially in the peak aligning step. Although the minimization of m/z value fluctuation was ensured by regular mass spectrometer calibration, the in-batch stability of RT and m/z should be examined. For this purpose, we evaluated the RT and m/z variability of the three peaks eluting at RTs of 1.28, 4.14, and 9.83 min (with m/z 758.5714, 130.0494, and 300.3002, respectively) for HILIC ESI (+); RTs of 1.29, 4.51, and 9.25 min (with m/z 187.0426, 242.0804, and 325.1841, respectively) for HILIC ESI (–); RTs of 4.74, 7.30, and 12.15 min (with m/z 304.3006, 524.3725, and 782.5688, respectively) for RPLC ESI (+); and RTs of 3.21, 7.33, and 12.92 min (with m/z 187.0079, 540.3298, and 197.8086, respectively) for RPLC ESI (–). Besides full-scan mass spectra recording, simultaneous automatic acquisition of CID mass spectra (MS/MS) was performed for ions exceeding the intensity threshold setting, allowing us to obtain additional information on respective markers. MarkerView software (version 1.2.1, AB SCIEX, Concord, ON) was used for processing the LC-HRMS raw data. This is an adaptive processing software package designed for LC-HRMS data that performs peak detection, alignment, and data filtering, generating a feature table where the measured m/z, RT, and integrated ion intensity are defined. Data mining was performed by an automated algorithm in the RT range of 0.5–14.5 min at RPLC and 0.5–9.5 min at HILIC. Then, RT and m/z tolerances of 0.2 min and 15 ppm were used for the alignment of the respective peaks. The background noise (100 cps) was removed by a tool of the MarkerView software. To identify true molecular features, the algorithm uses the accuracy of mass measurement to group ions related to charge-state envelope and isotopic distribution. A filter by “presence” was applied in order to retain only masses that appear at least in 18 samples within the study case groups. Finally, a filtering procedure with fold change (>2) and t test (p < 0.05) was used in order to identify differentially expressed mass signals between both MP samples and case study samples (HCs and PCPs), thus removing the background and contaminants and preserving the true biological mass signals from LC-HRMS data. The next steps of the procedure were carried out using Metaboanalyst 3.0 Web Server. 14
Data pretreatment
Typically, this stage of the process comprises the normalization, scaling, and transformation. The normalization process removes systematic bias in ion intensities between measurements, making samples and metabolite concentrations more comparable. Multivariate statistical analysis (MVA) tends to focus on metabolites with high intensities. However, low-concentration metabolites may also play important roles in the biological processes. Scaling is often used in metabolomics to change the emphasis from metabolites with high concentrations to those with moderate or small abundances. Transformations are generally applied to correct for heteroscedasticity, to convert multiplicative relations into additive relations, and to make skewed distributions (more) symmetric. 15 In this work, we assessed different approaches for data normalization, scaling, and transformation. Finally, normalization by a QC reference sample (probabilistic quotient normalization), Pareto scaling, and log transformation were performed in order to transform the data matrix into a more Gaussian-type distribution. 16
Analytical validation and outlier detection
The PCA was used to validate the quality of the analytical system performance and to observe possible outliers. The QC presentation on a PCA plot was used for analytical validation: variables with unacceptable reproducibility (RSD > 30%) or detected in less than 50% of QC samples were rejected from the data matrix. Model quality description by goodness of fit (R2) and goodness of prediction (Q2) was the first step in statistical validation. 17 In parallel, random forest methodology and Hotelling’s T2 ellipse in a PLS-DA score plot allowed the identification of two outliers in the HCs despite attempts to modify the method of standardization (data not shown). Removal of outliers caused an increase in R2 and Q2 values, and consequently, the whole analysis was repeated with the outliers omitted.
Data treatment
Filtering according to significant differences was carried out based on statistical analysis, including both univariate (UVA) and MVA analysis. For UVA, a t test–based filter (p < 0.05) was used to eliminate redundant signals from the data set and to detect differences between the study groups (HCs and PCPs). This provided a quality criterion to select variables by relevance for further MVA. The MVA was used to identify the variables that were responsible for the discrimination between the groups. Hence, the VIP scores calculated from the first five components of each PLS-DA model were used to select the most discriminant metabolites according to the greater-than-one rule 18 (VIP > 1).
Identification of marker compounds
The PeakView software (version 1.0 with Formula Finder plug-in version 1.0, AB SCIEX, Concord, ON) was used to evaluate the LC-HRMS data obtained in LC-QTOF-MS and to estimate elemental formulas of preselected marker compounds. Elemental formula estimation was achieved from both single HRMS and MS/MS accurate mass spectra, which was followed by a spectral database search for structural identification. The automatic elemental formula estimation was carried out with the use of the (1) accurate single HRMS mass of the parent ion, (2) isotopic profile of the parent ion, and (3) accurate MS/MS fragment ions. For calculations, the following atoms were considered: C (n > 50), H (n > 100), N (n > 10), O (n > 20), P (n > 15), and S (n > 5). The Formula Finder software (AB SCIEX, Framingham, MA) used in this study enabled us to sort the proposed formulas according to MS rank and MS/MS rank, reflecting the differences between calculated and measured m/z values for both parent and fragment ions, and the match of experimental and theoretical isotope pattern in terms of isotope spacing and relative intensities. In the next step, a stepwise search of the molecular formula of the candidates in several online databases (MassBank, Metlin, Human Metabolome Database, Lipid Maps, PubChem, ChemSpider) and MS/MS libraries was performed. From all of the compounds obtained, only candidates with a probable presence in humans were further examined by comparing experimental fragmentation mass spectra with those provided either in databases (MassBank, Human Metabolome Database, Metlin, NIST 2012 MS/MS library) or in scientific literature. 19
Results and Discussion
LC-HRMS Metabolomics Analysis
Despite many recent advances in instrumentation, the sheer complexity of biological samples remains a major challenge in metabolomics experiments, reflecting both the large number of metabolites and the wide dynamic range of their expression levels. For nontargeted metabolomics of biological samples, deproteinization with an organic solvent is often carried out. The AcN-based extraction methods have been proven to give the richest information for lipid low-molecular-weight species, while the MeOH extractions were generally the most effective for metabolites such as those in the TCA cycle, glycolysis, amino acid metabolism, fatty acid metabolism, glutamine metabolism, and glutathione metabolism. 20 These fractions are then typically analyzed separately using RPLC and HILIC. Therefore, the combination of LC-HRMS approaches improves the comprehensiveness of global metabolic profiling of body fluids and thus is valuable for monitoring and discovering metabolic changes associated with health and disease in clinical research studies. 8
Under our experimental conditions, several observations could be made from the total ion current (TIC) chromatograms of a QC sample ( Fig. 1 ). The HILIC TIC chromatograms showed a clear differential peak profile as a function of the ionization mode. Specifically, the most intense ions in this separation mode were observed in ESI (+) between 1 and 2 min RT, corresponding to poorly retained compounds ( Fig. 1A ). In HILIC chromatography of serum samples, the compound classes eluted at such RTs have been related to the phosphatidyl glycerol compound classes. 21 In contrast, we observed more intense signals in the RT range of 2.1–4.7 min for the HILIC ESI (–) mode ( Fig. 1B ). It has been reported that under weak acid conditions, the negative ionization of molecules such as organic acids with –COOH functional groups, and phosphate groups is favored, and therefore intense mass signals are expected for such compound classes. 22 The analysis of the TIC chromatogram in ESI (+) from RPLC separations revealed that in the first 5 min, the most polar lipids, like lysophosphatidylcholines (LPCs), eluted, followed by a highly crowded range between 5 and 10 min containing most of the PLs ( Fig. 1C ). However, ESI (–) from RPLC provides superior results for certain lipid classes, such as phosphatidylinositol, phosphatidylserine, and phosphatidic acid ( Fig. 1D ). Therefore, these data suggested that the analytical approach used in this work enables the effective separation and detection of a wide range of compound classes.
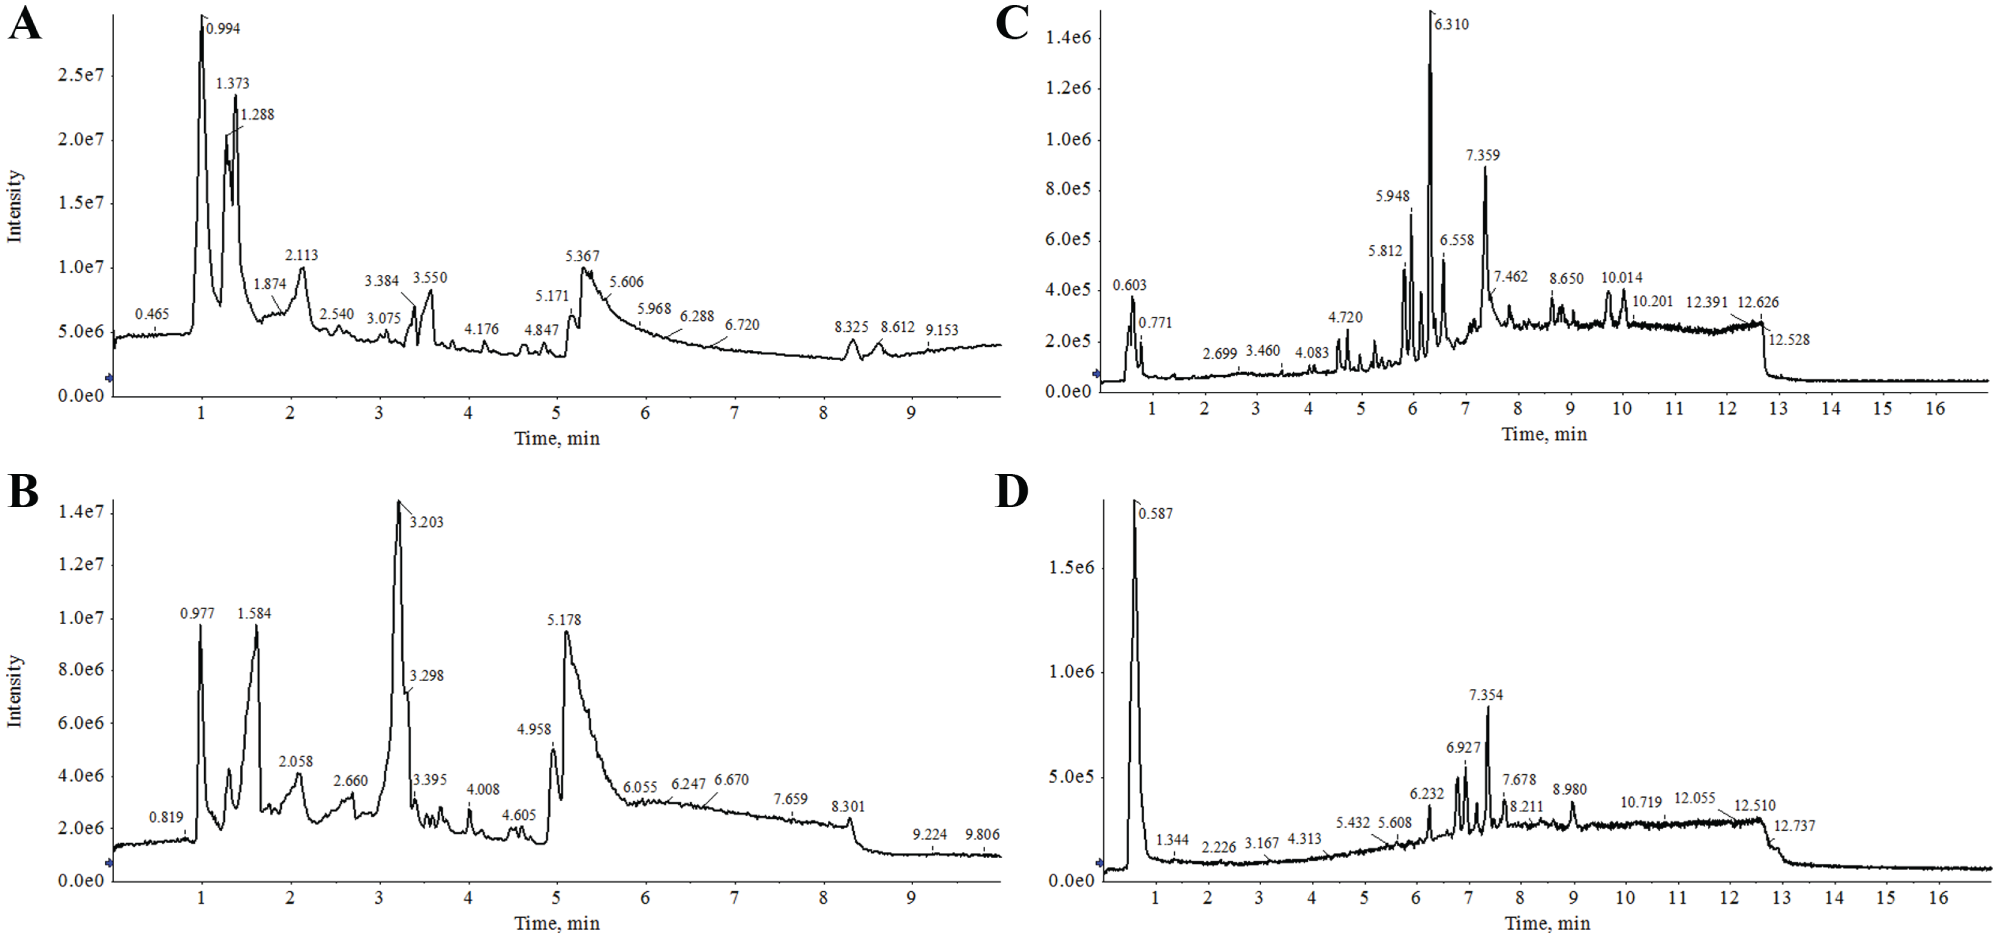
Representative LC-HRMS TIC of the serum samples from (
Chemometric Analysis
Based on the data from selected chromatographic peaks, the typical RT window and mass tolerance were found to be below 3 s and 10 ppm, respectively, which can be considered acceptable values. As a result, from peak picking and alignment procedures, a data matrix containing the intensity of mass signals was obtained for each chromatographic and ionization mode. As shown in Table 1 , the four analytical approaches considered in this work rendered a similar number of molecular features from peak extraction. However, the monoisotopic filtration (only peaks representing monoisotopic ions were selected) displayed a more complicated charge assignment for HILIC ESI (–). On the contrary, the combination of RPLC ESI (+) provided the highest number of true molecular features. In an effort to achieve the unique occurrence of true biological features, a filtering procedure with fold change (>2) and t test (p < 0.05) was performed in order to identify differentially expressed signals between study case samples (HCs and PCPs) and MP samples. This way, about 12%−50% of the previous feature information was discarded ( Table 1 ). With the aim of assessing the quality of the analytical system performance, PCA was also applied to track the clustering or spreading of QC samples. After discarding all those signals (between 5% and 48%, depending on the analytical approach; see Table 1 ) with unacceptable variability (CV% > 30), the PCA scores plot (not shown) revealed a close clustering of the QC samples, indicating that the separation observed between study case groups was mainly due to biological reasons.
Data Set Creation, Filtration, Biomarker Selection, and Statistical Validation.

This table summarizes the screening workflow of mass/RT features from data set creation to biomarker selection. Briefly, MarkerView software provided a data matrix containing the extracted peaks. In order to reduce mass redundancy and enhance the selection of the true molecular feature, only monoisotopic peaks were considered. A filtration based in t test (p < 0.05) and fold change (>2) was carried out between study case samples (HCs and PCPs) and MP samples with the aim of removing peak form contaminants. During the analytical validation, all those features showing coefficients of variation higher than 30% in the QC samples were excluded from the data matrix. Finally, biomarkers were selected according to t test (p < 0.05) and VIP (>1). Although several molecular features met the selection criteria, they were eluted at the dead-volume RT, and consequently, they were not considered. The model evaluation is often expressed as the explained variation by the estimated number of significant components, Q2 and R2. N.A., not applicable.
The explained variation (%) by the first fivePCs in PCA, after which the explained variance did not grow significantly. R2 estimates goodness of fit, while Q2 estimates predictive ability. High R2 and Q2 values are desirable, and the difference between them should not be too large.
After assessing different approaches of data pretreatment during the analytical validation, the best sample clustering was obtained with probabilistic quotient normalization using a QC as the reference sample in combination with Pareto scaling and log transformation. Pareto scaling is commonly applied to LC-HRMS data to reduce the influence of intense peaks while emphasizing weaker peaks that may have more biological relevance by either reducing the loadings of intensity or increasing the loadings from weak peaks. 19 The MVA of pretreated data matrices enabled us to observed different extents of sample clustering according to the group information. The most relevant separation was observed for RPLC ESI (–) independently of the MVA considered ( Fig. 2A ). This separation was also clear, although to a lesser extent for HILIC ESI (+) ( Fig. 2B ). Although for HILIC ESI (–) there is not evident separation using the first two PCs (not shown), we can observe a clear aggregation of HCs in the center of the diagram, suggesting a better separation with PLS-DA, as shown in Figure 2C . A more problematic separation is observed in the case of RPLC ESI (+), where the main discrimination is obtained within the HC group (not shown). Nevertheless, PLS-DA analysis ( Fig. 2D ) suggested that it is also possible to discriminate between HCs and PCPs.
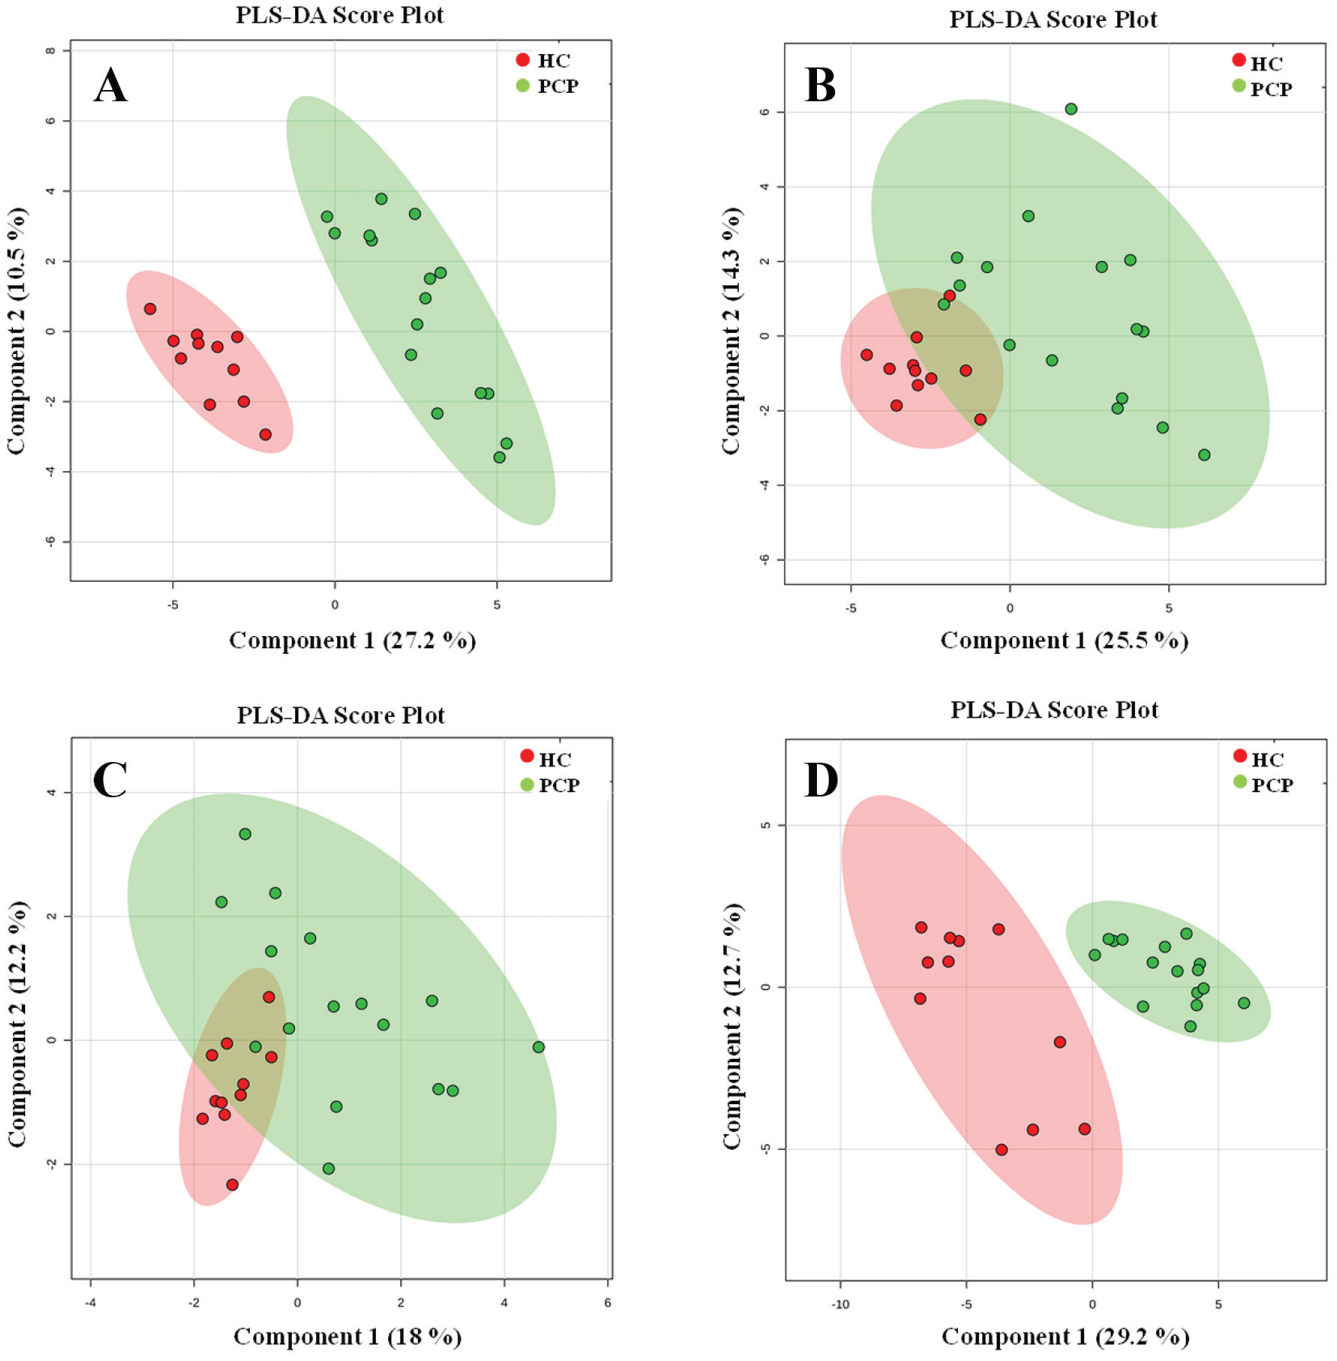
PLS-DA score plots based on LC-HRMS data of serum samples from the HC group (red) and PCP group (green) from (
The quality description of PLS-DA models for the discrimination of HC and PCP groups was carried out using R2 and Q2. R2, which explains variance, gives information about goodness of fit, while Q2, which predicts variance, provides information about model predictability. In this regard, it is assumed that to ensure the model is efficient for diagnostics, the metabolomics data should display R2 ≥ 0.7 and Q2 ≥ 0.4 and not vary more than 0.2–0.3. 23 According to these criteria, three models (HILIC ESI [–], RPLC ESI [+], and RPLC ESI [–]) are suitable for successfully discriminating between HCs and PCPs, while another model (HILIC ESI [+]) displayed bigger differences between R2 and Q2, which might affect to the final predictability ( Table 1 ).
Selection of the Potential Biomarkers
Biomarker selection involves the identification of an optimal subset of features that will provide the maximal discriminating power between the diseased and healthy samples. Various statistical techniques (MVA and UVA) can be combined in a proper way to identify potential biomarkers and demonstrate how useful the selected biomarkers are. PLS-DA is a typical supervised method (it requires class membership knowledge of biological specimens) that can be used to maximize the separation among the sample groups and target putative biomarkers for metabolomics studies. 23
In this work, we have used two model independent variable selection techniques, VIP and the Student t test, for selection purposes. VIP values estimate the importance of each variable in the projection used in a PLS-DA model and are often used for variable selection. 11 The greater-than-one rule is usually considered for detecting the descriptors with the greatest importance in the projection. 24 The Student t tests are used to show which metabolites have the power to differentiate the groups in the data set. This t test is applied to one metabolite at a time to determine whether the mean values of the two groups are different. If the p value for the test is smaller than a cutoff value, typically 0.05, the null hypothesis is rejected. If the p value is large, there is no significant difference between the mean values for the two groups, indicating the metabolite has little power to separate them. Then the 0.05 cutoff value is often used when the t test for a metabolite is examined individually. 25
According to this, the VIP parameter (>1) and t test (p < 0.05) were used to select significantly different variables as potential biomarkers in each of the PLS-DA proposed models. Fold change (>1.5) between HCs and PCPs was also considered as a selection criterion of changes in metabolite concentrations. Studies have shown that instrument variability is smaller than biological variability for mammals and suggested that fold-change thresholds of 1.5–2.0 should be used. 26 As a result, four molecular signals meeting these conditions (VIP = 1.633–1.401, p = 7.32E-04–7.82E-05, fold change = 1.730–1.618) were selected for ROC analysis in order to assess their potential as clinical biomarkers ( Table 2 ). Although more candidate metabolites met the selection criteria mentioned above, especially for HILIC separations, they were located in the dead-volume RT and, consequently, were not selected.
Potential Biomarkers of PDAC.
LPC and LPE are used to refer to species with one radyl side chain where the structures of the side chains are indicated within parentheses in the “head group (sn-1/sn-2)” format. By default, R stereochemistry at the C-2 carbon of glycerol and attachment of the head group at the sn-3 position is assumed.
Fold change expressed as the ratio of the two averages (HC/P).
Biomarker Evaluation
ROC curves are frequently used in biomedical informatics research to evaluate classification and prediction models for decision support, diagnosis, and prognosis. ROC curves are often summarized into a single metric known as the area under the curve (AUC). If all positive samples are ranked before negative ones (i.e., a perfect classifier), AUC is 1.0. An AUC of 0.5 is equivalent to randomly classifying subjects as either positive or negative (i.e., the classifier is of no practical utility). 12 Thus, it is possible within a metabolomics study to calculate ROC curves for each potential biomarker in order to assess its potential clinical utility in terms of AUC. In this regard, we have calculated the AUC for each selected candidate biomarkers. In this work, the AUC values obtained ranged from 0.881 to 0.943. Considering that AUC values greater than 0.8 indicate a good predictor model, our results ( Fig. 3A–D ) suggest that these markers might be a clinically useful biomarker test. 12
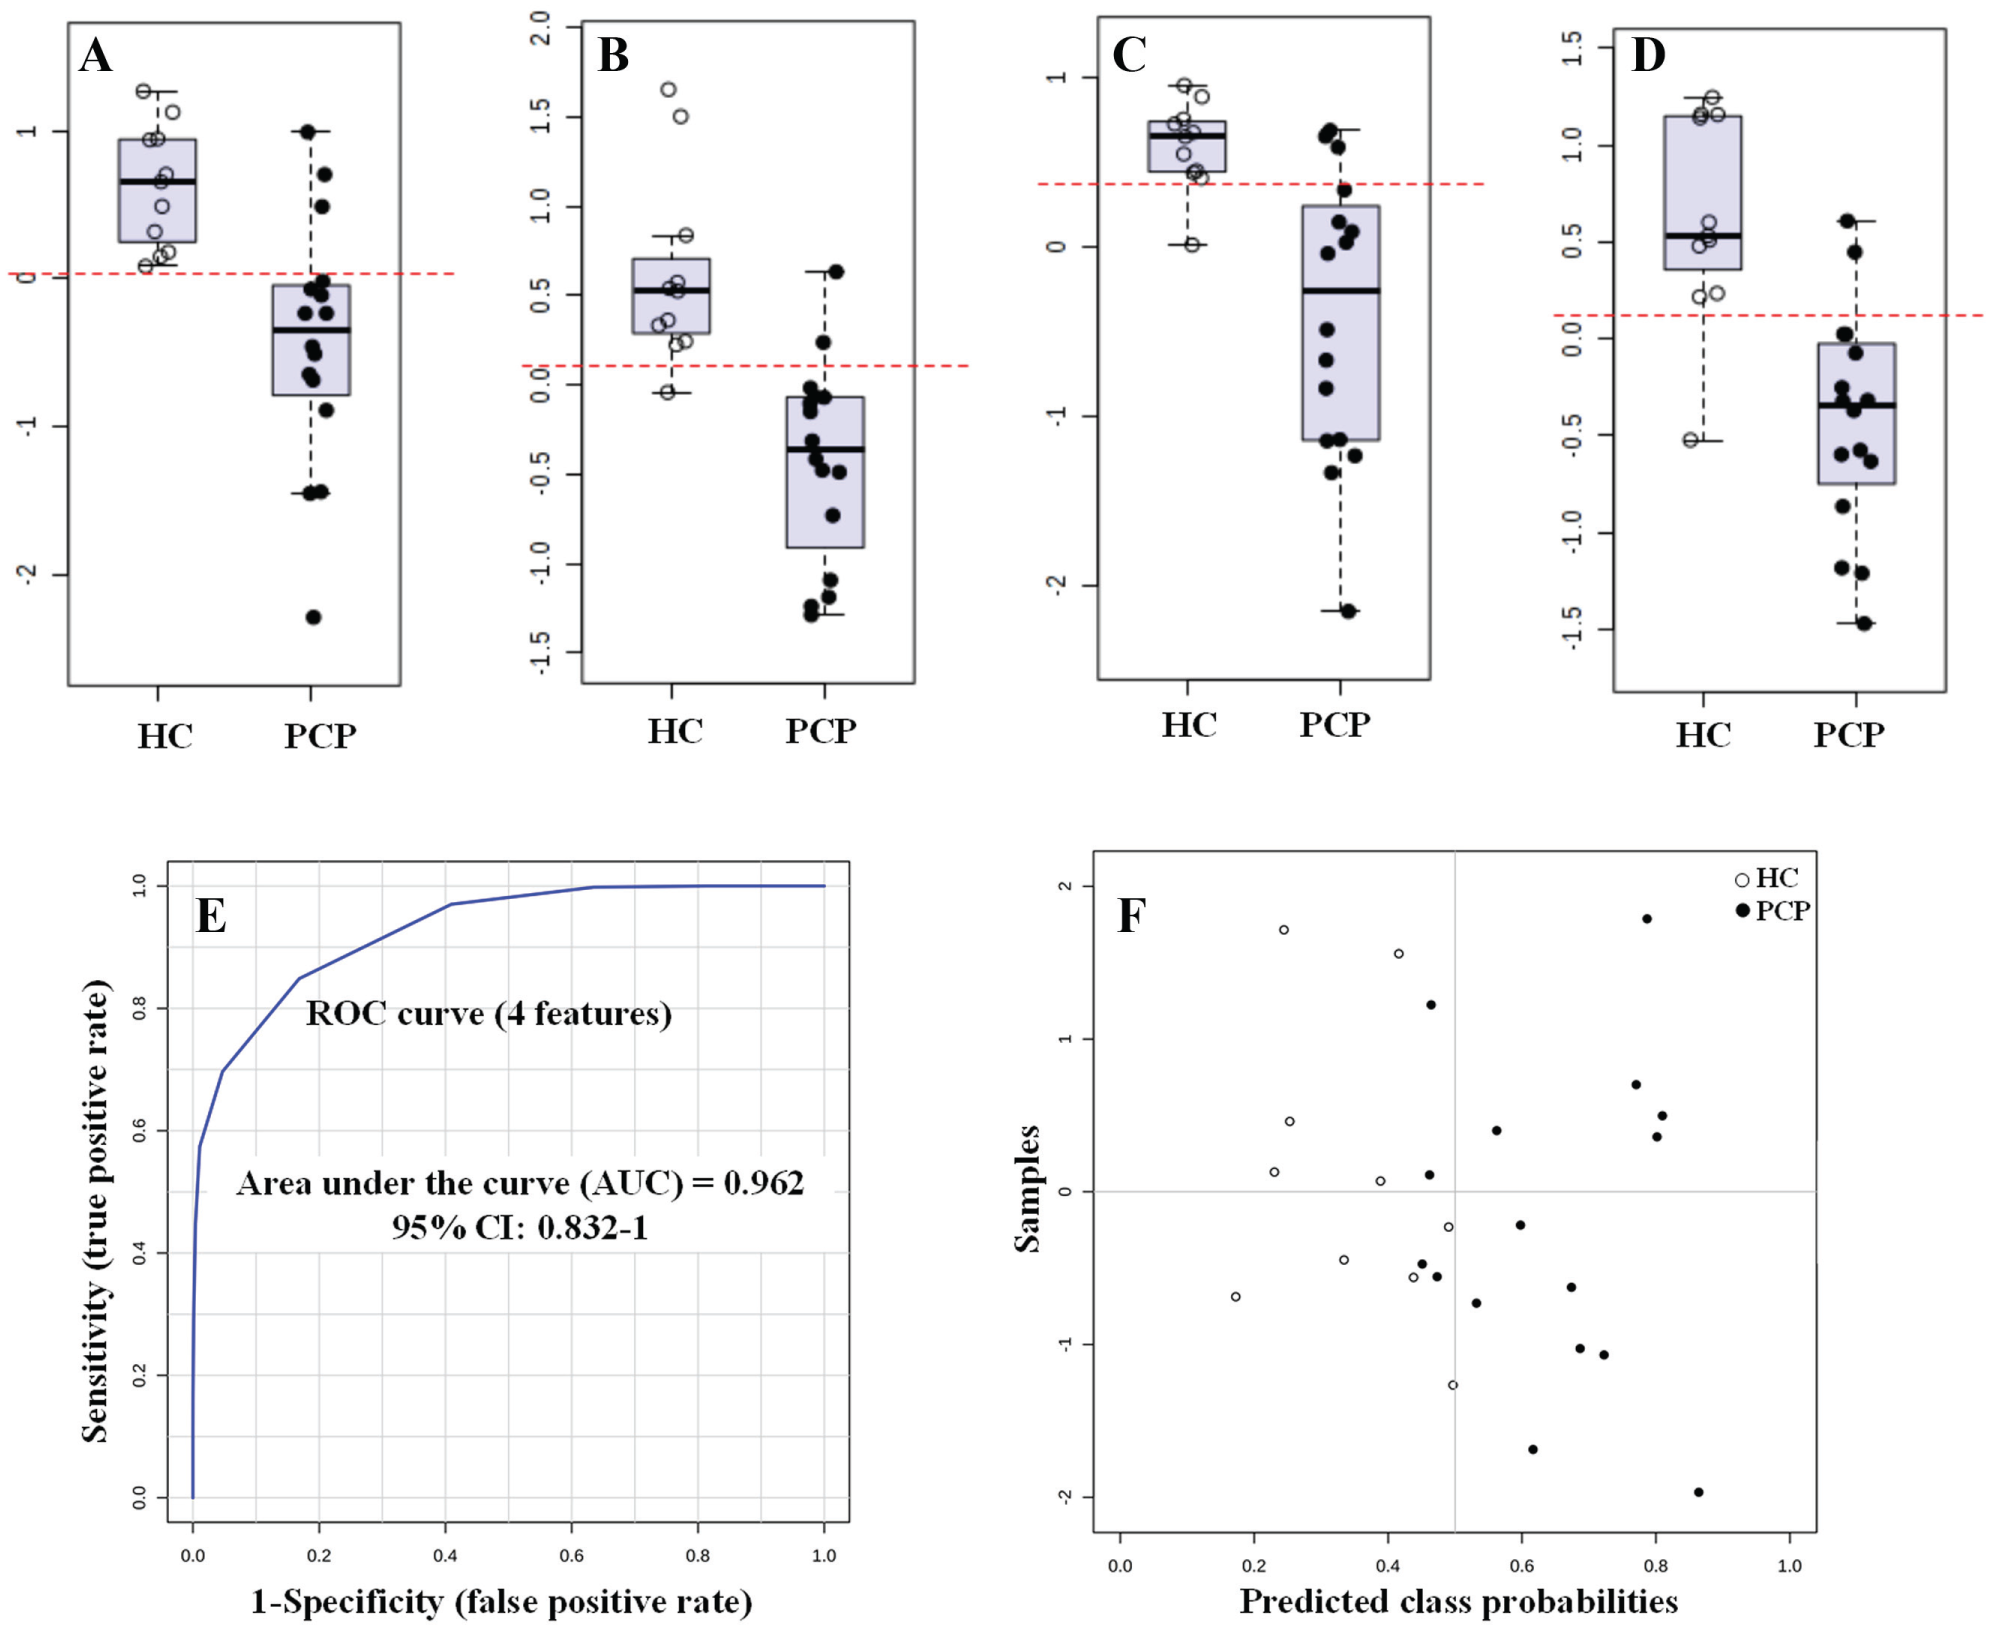
Box-and-whiskers plots representing relative abundance of (
Model Creation
In multifactorial diseases (such as heart disease, cancer, or neurological disorders), it is often the combination of multiple individual markers into a single multivariate model that provides improved levels of discrimination and confidence. The result is a multivariate mathematical equation, which provides a single score derived from multiple biomarkers. This score can be assessed through ROC curve analysis as previously described. 12 In this regard, we applied a PLS-DA model to combine our four biomarker candidates to obtain the AUC and predicted probability for each group ( Fig. 3E ). The ROC curve provided an AUC for the combination of the four biomarkers of 0.962 (95% CI 0.832–1), in this way improving the discrimination ability compared with individual biomarkers. The performance of this biomarker model was assessed using a balanced Monte Carlo cross-validation procedure. As a result, the average accuracy based on 100 cross-validations was 0.842. The results are presented in a graphical view ( Fig. 3F ) to facilitate understanding of them.
In order to assess the contribution of age-related factors to the observed effect on lipid concentration in the differentiation of the two study groups, we applied multivariate linear models fitted according to the ages of the patients. As a result, we did not observe any association between patient age and the observed change in concentrations of candidate biomarkers (p > 0.05 in all cases). Similarly, we did not observe any interaction between patient age and the study group (p > 0.05 in all cases), which leads us to assume that age effect is equal in both study groups. Conversely, when using models fitted by age, we did find significant differences (p < 0.05) between the concentrations of candidate markers and the two study groups. This result demonstrated that age is not a factor associated with the change observed in the concentrations of candidate markers, and therefore the group differentiation effect of each marker was still observed after patient age fitting.
Structural Identification of Potential Biomarkers
In this work, the identification of molecular components of selected potential biomarkers was achieved through some molecular properties (such as experimentally determined accurate mass) and MS/MS patterns that were used to define molecular and empirical formulas from which metabolites were derived or identified by comparative searches of available spectral and compound databases. 27 It has been previously demonstrated that for molecular formula assignment by HRMS, the mass spectra are most suitable with a low error for isotopic ratios (1%−5%), sufficient resolution (R = 5000 at m/z 400), and mass accuracy between 1 and 5 ppm. 28 According to these criteria, we could assigned a molecular formula for each candidate biomarker that provided a match in Metlin and the Human Metabolome Database within two PL subclasses, LPC, and lysophosphoethanolamine (LPE) (see Table 2 ). The fragment interpretation from the CID spectra of these candidates enabled us to identify characteristic ions of these subclasses of PLs. For instance, in the case of the candidate biomarkers within the LPC subclass, the product-ion spectra were dominated by the m/z 184, 125, and 104 ions, corresponding to specific fragments to this PL subclass ( Fig. 4A ). In the case of LPE, the product-ion mass spectrometric analyses of deprotonated ions ([M+H]–) provided characteristic anions, such as those corresponding to the fatty acyl carboxylate and the glycerophosphoethanolamine anion derivatives, which are characteristic of the phosphoethanolamine head group ( Fig. 4B ). 29
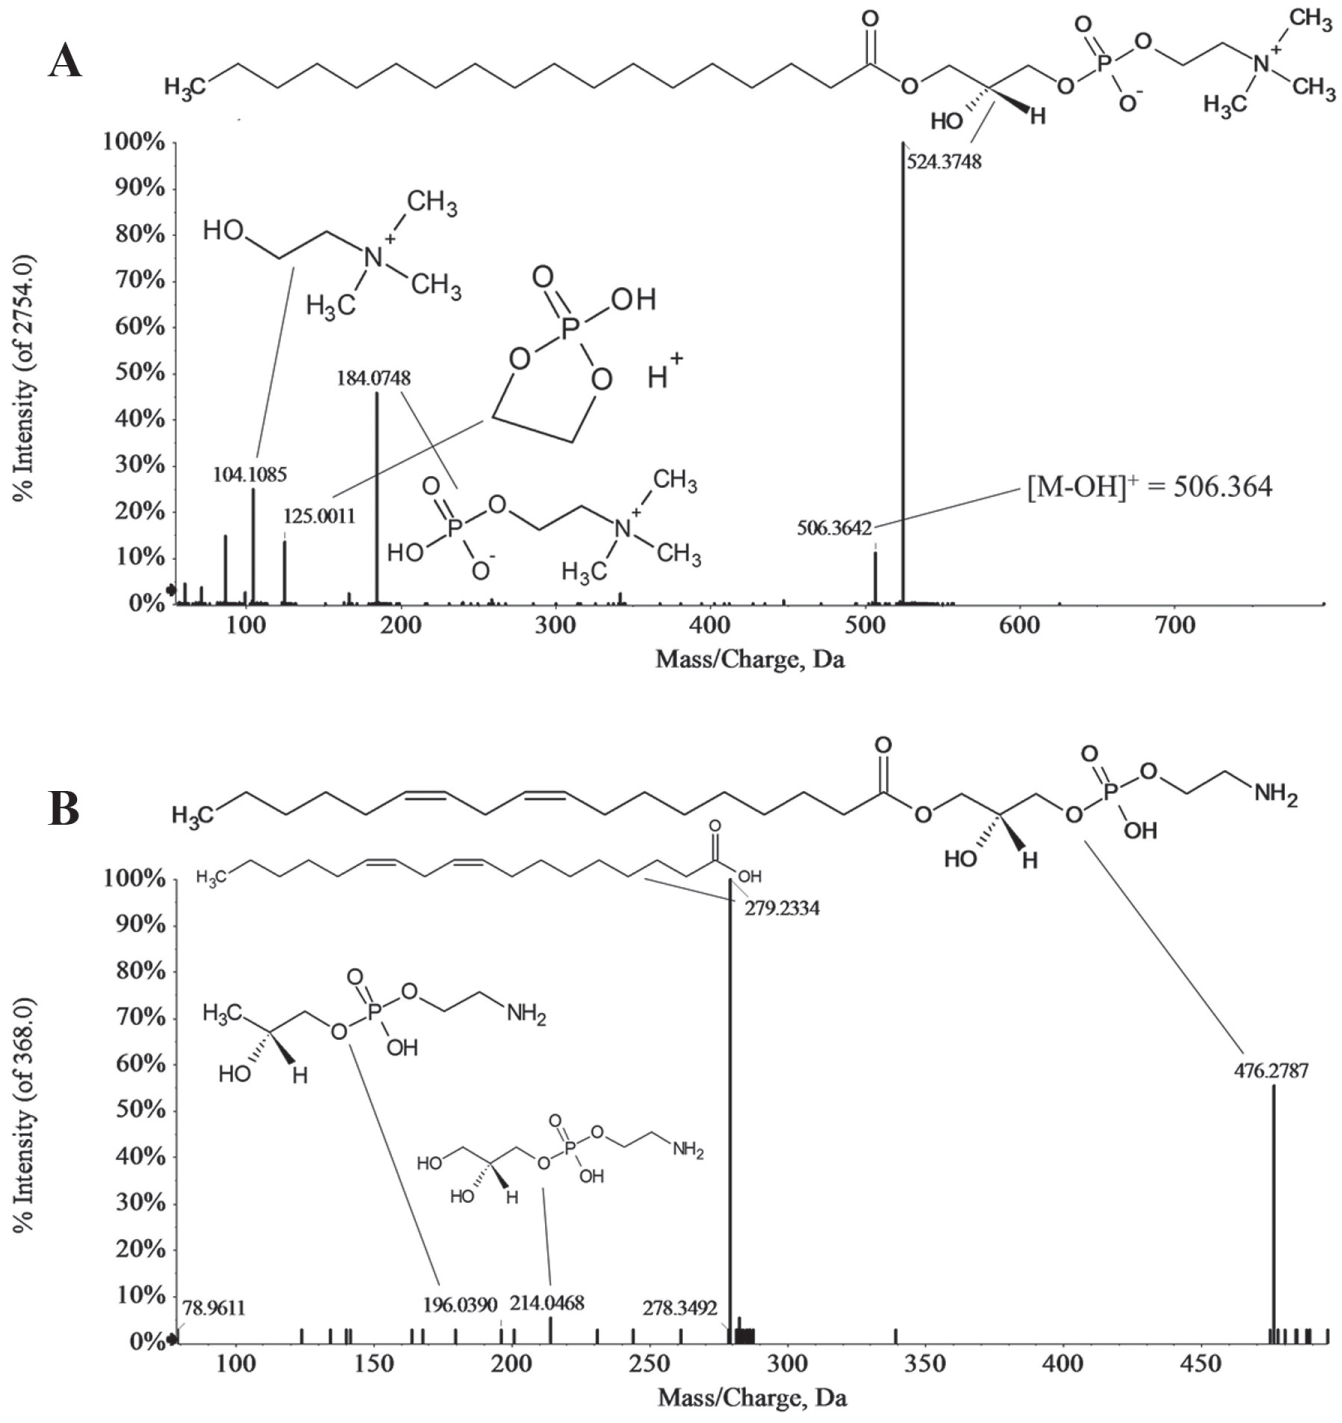
Representative positive product-ion ESI mass spectra of candidate biomarkers 1 and 4 after CID. Under acidic conditions, protonated molecular species ([M+H]+) are readily formed for LPC and LPE. (
Biological Interpretation
It has been widely demonstrated that detection of a metabolic profile in serum by MS-based techniques is a selective and sensitive tool to improve diagnosis of malignant diseases, including gastroenterological cancers. 30 In fact, determination of metabolites in serum has been proposed as a model to detect resectable patients with pancreatic cancer. 2 Other investigators demonstrated that a metabolic profile including serum concentrations of glutamate/glucose and creatine/glutamine may be useful for distinguishing benign from malignant lesions in PDAC. 31 Recently, studies in a mouse model showing a malignant progression analogous to human PDAC showed that some metabolites in serum, such as citrate, could be relevant in a profile signature to determine incipient lesions of this disease. 32 In our study, we found that four compounds in two PL subclasses were significantly downregulated in PCPs compared with HCs, and they were selected as potential biomarkers. PLs are the primary structural constituents of biological membranes, which contain a variety of fatty acyl and head group compositions. Therefore, an altered lipid composition in serum might be an indication that some permanent damage to the tissues has occurred. In fact, cancerous cells display unique properties, such as generalized membrane alterations and “leakiness” of lysosomal enzymes. Intriguingly, several lysosomal hydrolases are elevated in tumor tissues. 33 The enzymes aimed at cleaving the various bonds in PLs, namely, phospholipases, have been detected in many cells and tissues from various organisms. In particular, phospholipase A2 (PLA2), which produces free fatty acids, and 1-acyl lysophospholipid have been found in lysosomal and pancreatic locations. 34 On the other hand, phospholipase A1 (PLA1), the enzyme that hydrolyzes 1-acyl-phospholipids, which are thought to have a lysosomal origin, shows considerable sequence similarity to human pancreatic lipases. 35 In turn, both enzymes (PLA1 and pancreatic lipase) have been shown to possess phospholipase B activity (ability to cleave fatty acids from positions sn-1 and sn-2 of PL and lysoPL). 34 Hence, we hypothesized that the decreased levels in the PCP group of LPE and LPC, which derived from the degradation of PE and PC, respectively, could be partially explained by increased levels in either PLA2, PLA1, or pancreatic lipases in pancreatic tumor cell lysosomes. In agreement with our results, some studies have reported that pancreatic PLA2 activity in serum is strongly elevated in severe acute pancreatitis. 35 Interestingly, other investigators obtained very similar results using a different analytical approach. Specifically, they also found (among others) a significant reduction with a similar ratio and discrimination ability in markers 1, 2, and 3 (LPC [18:0], LPC [18:2(9Z,12Z)], and LPC [18:3(6Z,9Z,12Z)], respectively) in the PCP group. These independent results point to the critical role PLs could play in the development of the disease and their utility as clinical biomarkers. 36
In summary, we compared the metabolome profiles of serum of PCPs to those of HCs. Four significant metabolites with significantly lower levels were identified in PCPs compared with HCs. These four metabolites are involved in various pathways for lipid metabolism. The present study demonstrates the potential of metabolomics in identifying novel biomarkers in studying PDAC disease. Further studies may reveal the potential of these metabolites as diagnostics biomarkers for PDAC and their possible role in the pathogenesis of the disease.
Footnotes
Acknowledgements
Sandra Ríos Peces was a scholarship fellow within the grant program for the development of professional practices in companies: Santander/Junta de Andalucía.
We appreciate the support of Llenalia María García Fernández (Seplin, Soluciones Estadísticas) for the statistical calculations.
Declaration of Conflicting Interests
The authors declared no potential conflicts of interest with respect to the research, authorship, and/or publication of this article.
Funding
The authors disclosed receipt of the following financial support for the research, authorship, and/or publication of this article: The MEDINA authors disclosed the receipt of financial support from Fundación MEDINA, a public–private partnership of Merck Sharp & Dohme de España S.A./Universidad de Granada/Junta de Andalucía.
Moreover, some of the equipment used in this work was supported by the Ministerio de Ciencia e Innovación and European Union (grant INP-2011-0016-PCT-010000-ACT6).