
Abstract
The RAS-MAPK pathway controls many cellular programs, including cell proliferation, differentiation, and apoptosis. In colorectal cancers, recurrent mutations in this pathway often lead to increased cell signaling that may contribute to the development of neoplasms, thereby making this pathway attractive for therapeutic intervention. To this end, we developed a 26-member gene signature of RAS-MAPK pathway activity utilizing the Affymetrix QuantiGene Plex 2.0 reagent system and performed both primary and confirmatory gene expression–based high-throughput screens (GE-HTSs) using KRAS mutant colon cancer cells (SW837) and leveraging a highly annotated chemical library. The screen achieved a hit rate of 1.4% and was able to enrich for hit compounds that target RAS-MAPK pathway members such as MEK and EGFR. Sensitivity and selectivity performance measurements were 0.84 and 1.00, respectively, indicating high true-positive and true-negative rates. Active compounds from the primary screen were confirmed in a dose–response GE-HTS assay, a GE-HTS assay using 14 additional cancer cell lines, and an in vitro colony formation assay. Altogether, our data suggest that this GE-HTS assay will be useful for larger unbiased chemical screens to identify novel compounds and mechanisms that may modulate the RAS-MAPK pathway.
Keywords
Introduction
Colorectal cancer is one of the leading causes of cancer mortality in the United States, with the progression of normal tissue to metastatic disease being driven by one or more oncogenic pathways. It has been estimated that 30%–40% of colon tumors are KRAS mutant, and a further 8%–10% are BRAF V600E positive. 1 Furthermore, the RAS-MAPK pathway can be dysregulated by activation or amplification of tyrosine kinases such as EGFR or other pathway members,2,3 some of which may contribute to the emergence of drug-resistant cancer cells. Confounded also by an insufficiency of frontline therapeutics, there is a need for the discovery of novel inhibitors of the RAS-MAPK pathway. To facilitate this, we developed a 26-member gene signature and evaluated its use for high-throughput screening. Employing a hit funneling strategy that consisted of a primary gene expression–based high-throughput screen (GE-HTS) and an annotated library of diverse compounds, we demonstrated its ability to enrich for hit compounds that are known RAS-MAPK modulators. The results of this screen provide the rationale for screening larger unbiased libraries to identify novel inhibitors of this pathway using transcriptional readouts.
Previously, Loboda et al. 4 reported the generation of a 147-gene signature for the RAS-MAPK pathway that is able to quantify pathway signaling. 4 It was validated in 48 primary tumors, 130 cancer cell lines, and several microarray data sets of tumor samples from large cohort studies of lung, colon, and breast cancer patients. In so doing, it was observed to be highly predictive of the KRAS mutational status with greater than 90% accuracy. Notably, the RAS-MAPK signature also identified tumor cell lines with an activated MAPK pathway in the absence of RAS mutations, presumably as a consequence of other events, such as receptor tyrosine kinase activation. Thus, the ability to capture activation independent of a genetic lesion supports the hypothesis that the signature may be useful as a pharmacodynamic (PD) biomarker of RAS-MAPK pathway modulation.
Although useful as a biomarker tool for experiments with small sample sizes, the 147-gene signature is too large (and cost-prohibitive) for use in HTSs typically applied to early drug discovery efforts. However, recent advances in medium-throughput multiplex gene expression measurement have enabled moderately sized gene signatures to be assayed in HTS campaigns. Consequently, we developed a multiplexed PD gene expression assay with 26 reporter genes selected from the previously validated 147 RAS-MAPK signature.4,5 We specifically selected the Affymetrix QuantiGene Plex 2.0 Gene Expression platform because it can quantify pathway transcript levels of up to 80 different mRNA targets per well in a 96-well format amenable to HTSs.
To determine if the refined RAS-MAPK gene signature in the QuantiGene Plex 2.0 format was able to identify disease-relevant compounds, we tested its response to drug treatment using the SW837 colon cancer cell line with a library of 725 molecules representing 506 Food and Drug Administration (FDA)–approved compounds and 219 investigational agents with known targets and modes of action. Activities of the compounds were compared with the response of a positive control MEK1/2 inhibitor and ranked accordingly.
The data described here provide proof of concept for the use of the Affymetrix QuantiGene Plex 2.0 assay in an HTS format, as well as the use of transcriptional signatures to assess the modulation of oncogenic pathways in response to pharmacologic perturbation. Specifically, our study offers a novel tool for the potential discovery of effective anticancer therapies targeting the RAS-MAPK pathway.
Materials and Methods
Cell Culture
SW837, HCT116, SK-CO-1, LOVO, DLD-1, GEO, HT29, LS123, LS174T, LS411N, SK-CO-1, SW116, SW1463, SW620, and T84 colon cancer and A427 and H2122 lung cancer cell lines were purchased from the American Type Culture Collection (ATCC) and were cultured under the accompanying specifications at 37 °C, 5% CO2 without antibiotics. All cell lines were KRAS mutant except for the KRASwt SW116, LS411N, and HT29 colon cancer cell lines.
Gene Selection for Refined MAPK Signature
Ten lung and 10 colon cancer cell lines with mutant RAS were treated with 10 µM U0126 MEK1/2 inhibitor (Tocris Bioscience, Bristol, UK, #1144, used over the entire study) over a 6 h period of time at 37 °C/5%CO2. Total RNA was collected pre- and postdosing and analyzed by Affymetrix gene expression microarray (data not shown), and modulation of the147 RAS-MAPK gene signature was quantified. To refine the gene signature to a manageable number for high-throughput screening, a candidate reporter gene must (1) display an intensity level on the Affymetrix microarray of >1000 and (2) exhibit a greater than twofold expression difference in “active versus inactive” MAPK conditions. This resulted in a final signature consisting of 24 RAS-MAPK reporter genes and two reference genes used for normalization: MYL6 and DYNLT1. To generate a custom RAS-MAPK signature bead array assay, capture probes for each gene member were prepared by Affymetrix. This enabled a sandwich hybridization-based assay to be used in which target mRNAs were captured from cell lysates via hybridization probes and signal amplification achieved by branched DNA probes and fluorescent detection.
Western Blotting
U0126 MEK inhibitor or DMSO-treated cells in culture plates were washed twice by ice-cold phosphate-buffered saline (PBS) buffer, and then lysed by 1× lane marker sample buffer (ThermoFisher Scientific, Waltham, MA, #39000) on ice. Cell lysates were transferred to Eppendorf tubes, heated at 95 °C for 5 min, and then cooled on ice before being loaded onto sodium dodecyl sulfate–polyacrylamide gel electrophoresis (SDS-PAGE) gels (4%–15% Criterion Tris-HCL Gel, Bio-Rad, Hercules, CA). Gel-separated proteins were transferred to polyvinylidene fluoride (PVDF) (Invitrogen, Grand Island, NY, #LC2002) by wet transfer. After transfer, the membranes were incubated with 5% bovine serum albumin (BSA) blocking buffer (ThermoFisher Scientific, #37520), followed by protein detection with primary antibodies from Cell Signaling Technologies (Danvers, MA): p-ERK (#4376), ERK (#4695), p-AKT S473 (#4060), p-S6RP 235/236 (#4858), and p-PRAS40 T246 (#2997). Enhanced chemiluminescence (ECL) anti-rabbit IgG horseradish peroxidase–linked F(ab′)2 was from GE Healthcare (Little Chalfont, UK, #NA9340-1ML).
Pharmacodynamic Score Calculation
For assay development and the cell panel compound confirmation assay, a formalized metric system, the RAS-MAPK PD score, was developed for quantifying the degree of compound-induced pathway modulation. The PD score was calculated by averaging the Log2 gene expression fold change values of the MAPK signature “up” arm, and subtracting this by the average of the Log2 gene expression fold change values from the “down” arm of the signature. A positive PD score indicates the signature was upregulated, while a negative PD score signifies that the signature was downregulated.
Positivity Score Calculation
The PerkinElmer High Content Profiler (Waltham, MA), a commercially available module for the TIBCO Spotfire analytics software, was used for analysis of the Log2-based gene expression screening data. The program calculated and attributed a positivity score to both test and control compounds. Briefly, the positivity score is a multivariate measure that describes similarity with a given positive control profile on a continuous scale. It defines a reference vector that starts at the center of negative controls and points toward the center of a given positive control. For each sample in the data set, it uses a scalar projection to project a vector from the negative center to that sample on the reference vector. The length of that projection has value 0 if the sample is located at the negative center and 1 if the sample is located at the center of the positive control. Values below 0 denote samples even farther away from positives than the negative control center, while values above 1 denote samples that are farther away from the negative control center than positive controls. This score was used for analysis of (1) plate-to-plate reproducibility, (2) the primary GE-HTS results, and (3) the confirmatory dose–response GE-HTS results. Briefly, interplate data normalization was performed across the screen’s assay plates, followed by random forest classification of the response of individual gene features to each compound compared with those of the U0126 control compound. All of the genes were used as “features” in the data analysis. In the primary screens, compounds were ranked based on their score. That is, the higher the positivity score, the more similar the compound’s induced gene response is to the U0126-dependent gene response. Near-zero positivity scores are test compounds whose gene induction is similar to the DMSO-negative control treatment. Compounds with significant negative positivity scores are those that activate the RAS-MAPK pathway.
Compound Library
To compile a diverse set of clinically relevant compounds, we first generated a chemical library of FDA-approved drugs expanding on a commercially available library (http://www.mssr.ucla.edu/lib.html). This initial library was complemented with compounds identified from the literature and molecules in development from various therapeutic areas with known mechanisms and/or molecular targets. The final library comprised 725 unique small molecules.
Primary Gene Expression Assay
The 725-compound library was tested at 10 µM in the KRAS mutant SW837 colon cancer cell line. Cells were plated at 2 × 10⁴ cells/100 µL per well in Corning 3904, 96-well plates using the Matrix WellMate Reagent Dispenser and allowed to attach for 24 h at 37 °C/5%CO2. The Biomek FX Automated Liquid Handling System was used for compound addition with a 0.1% final DMSO concentration and incubated for 6 h at 37 °C/5%CO2 The Affymetrix QuantiGene Plex 2.0 assay platform was used to lyse cells, capture target mRNA, and amplify signal as per the protocol. Magnetic bead washing was performed on the BioRad Bio-Plex Pro II Wash Station, and signal was measured using the Luminex FlexMAP 3D plate reader.
Gene expression data were normalized using the two reference RNA targets DYNTL1 and MYL6. Fold change in expression was calculated by dividing the normalized value for the treated sample by the normalized value for the untreated DMSO control samples and then converted to base Log2 values.
Dose–Response Confirmation Screen
SW837 cells were plated as previously described for a period of 24 h. Cells were treated with test compounds in a 4-point dose–response assay at 10, 2, 0.4, and 0.08 µM final concentrations for 6 h, followed by gene expression analysis as above.
Confirmation of Hit Compound Activity in Additional Cell Lines
Selected hit compounds were tested in an additional 13 colon and 2 lung cancer cell lines. Cells were plated at 2 × 10⁴ cells/100 µL per well and treated with 10 µM compound, followed by Log2 base expression quantification.
Colony Formation Assay
Five thousand cells per milliliter in 0.8% agar (Sigma, St. Louis, MO, #A-9045-5G) media was plated on top of solidified 2% agar media in 96-well plates (MatriCal, Spokane, WA, #MGB096-1-2-LG-L). Media supplemented with inhibitors were added on top of the plated cells at the indicated concentrations. Ten days later, plates were rinsed and colonies were stained with LavaCell (Active Motif, Carlsbad, CA, #15004). The area of colonies was measured by the IsoCyte fluorimeter, and EC50 values were calculated using the GraphPad Prism software package.
Performance Measurements of Primary and Dose–Response GE-HTS
Matthew’s correlation coefficient
Matthew’s correlation coefficient (MCC) reflects the correlation between the observed and predicted binary classifications. The value provided ranges from −1 to +1. A coefficient of +1 represents a perfect prediction, 0 is no better than random prediction, and −1 indicates total disagreement between prediction and observation. It can be calculated using the following equation:
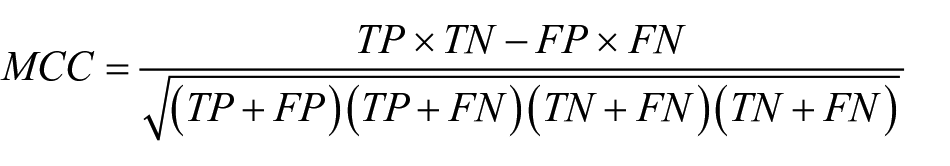
where TP is true positives, TN is true negatives, FP is false positives, and FN is false negatives.
Sensitivity (recall)
The sensitivity or true positive rate reflects the effectiveness of a classifier to identify positive labels. It evaluates the number of true positives against all positives:

where TPR it true positive rate, TP is true positives, P is positives, and FN is false negatives.
Specificity
This measure evaluates the effectiveness of a classifier to correctly identify negative labels. It evaluates the number of true negatives against all negatives:

where TN is true negative, N is negatives, FP is false positives, and TN is true negatives.
Results and Discussion
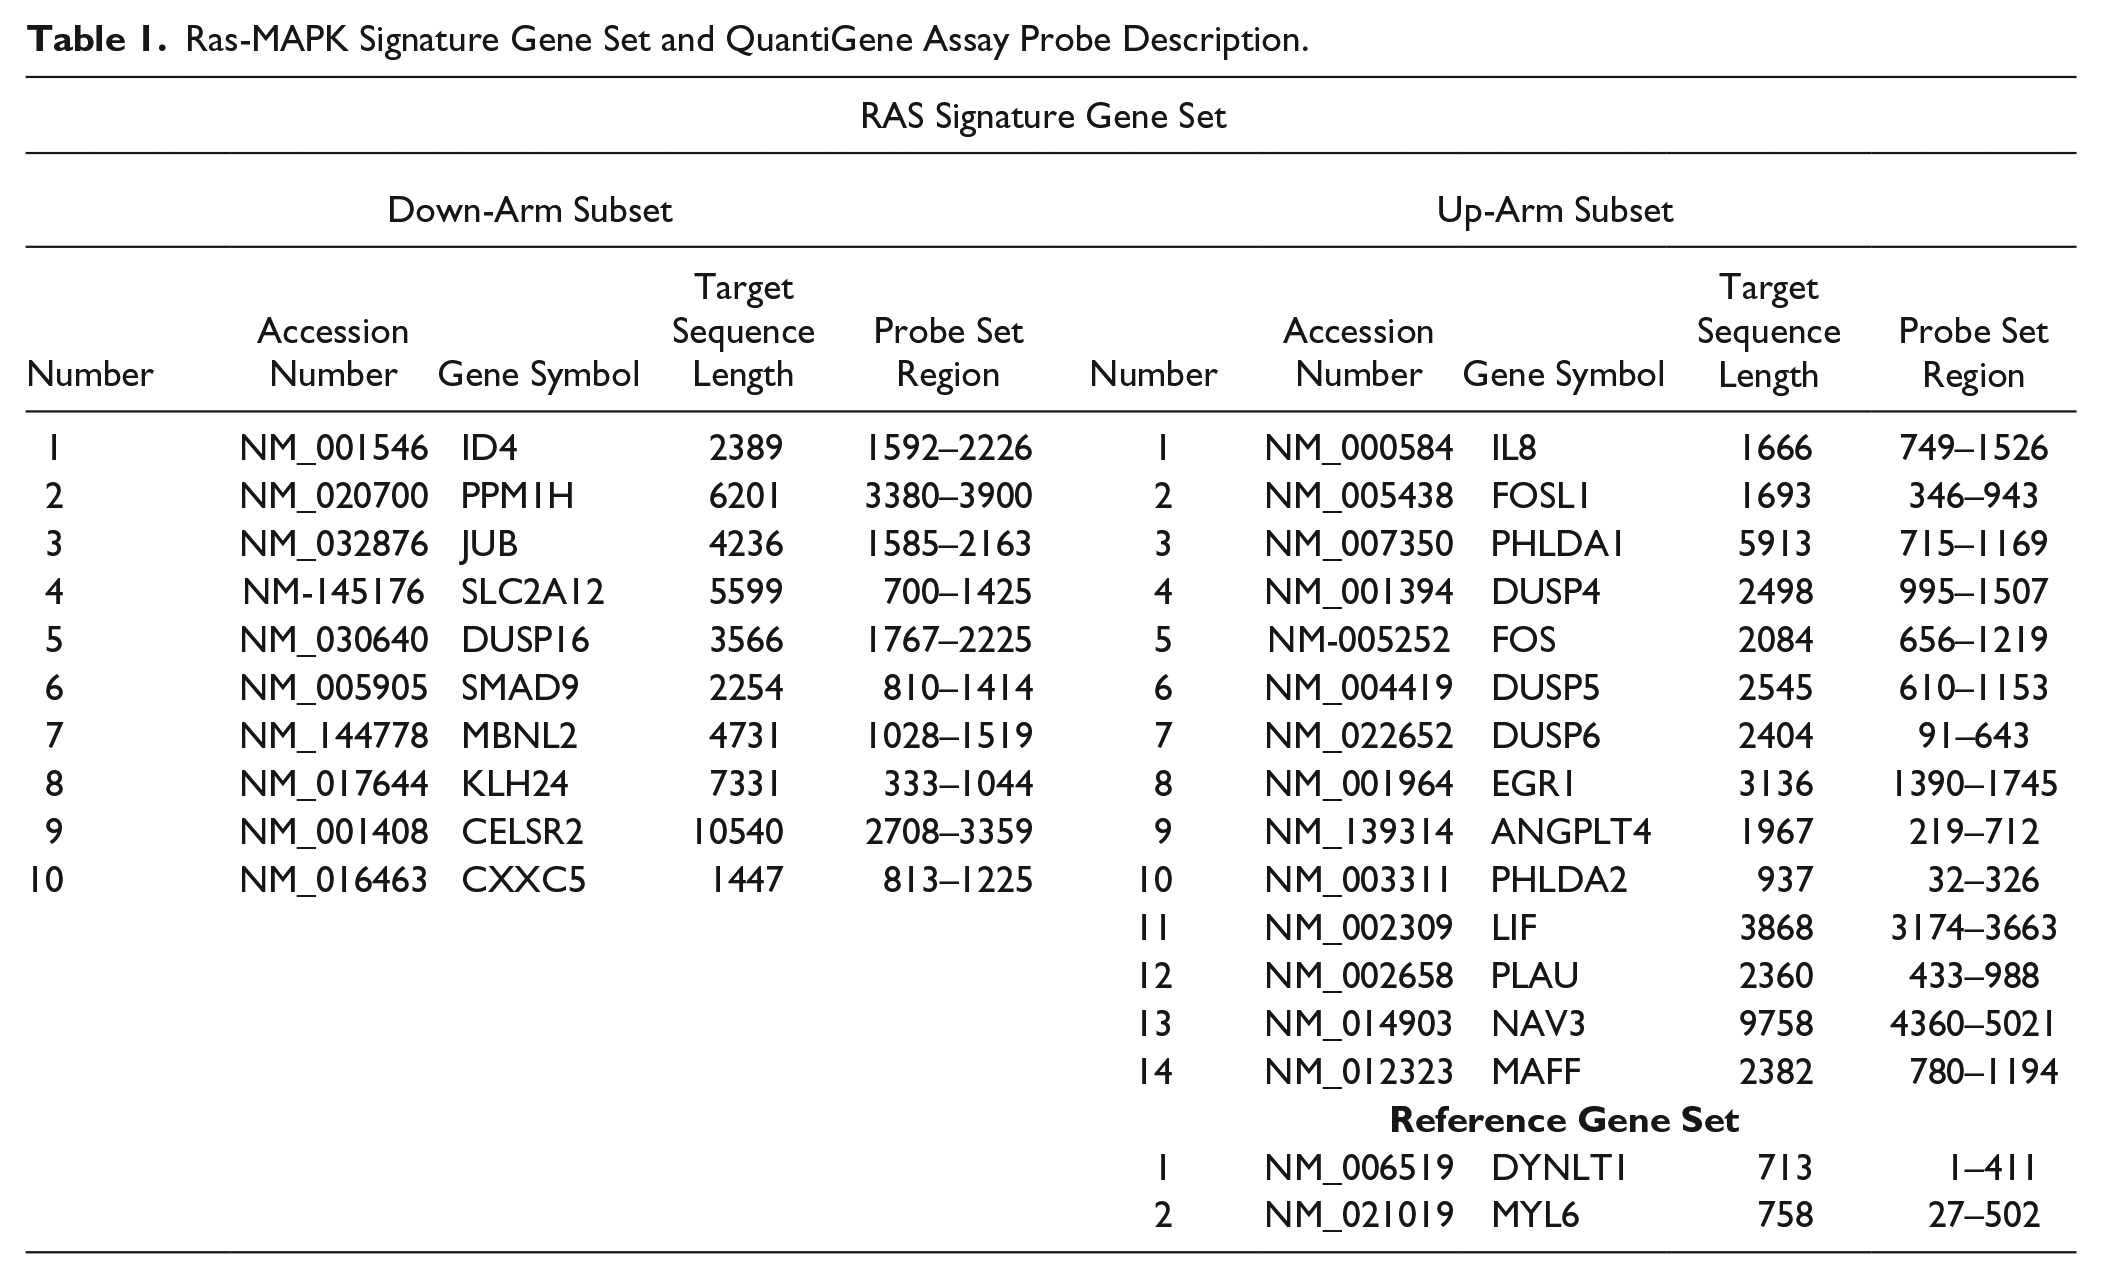
To evaluate if the RAS-MAPK gene signature ( Table 1 ) would be suitable for a large GE-HTS campaign, we employed the following stepwise strategy: (1) a pilot primary screen with an annotated chemical library to identify relevant hit compounds, followed by (2) a dose–response assay to confirm hit compound activity, (3) validation of select hit compounds in additional cell lines, and (4) a final evaluation of confirmed hit compounds in an in vitro soft agar colony formation assay for measurement of cell growth inhibition to ensure GE-HTS results translate into the appropriate phenotype ( Fig. 1A ).
Ras-MAPK Signature Gene Set and QuantiGene Assay Probe Description.
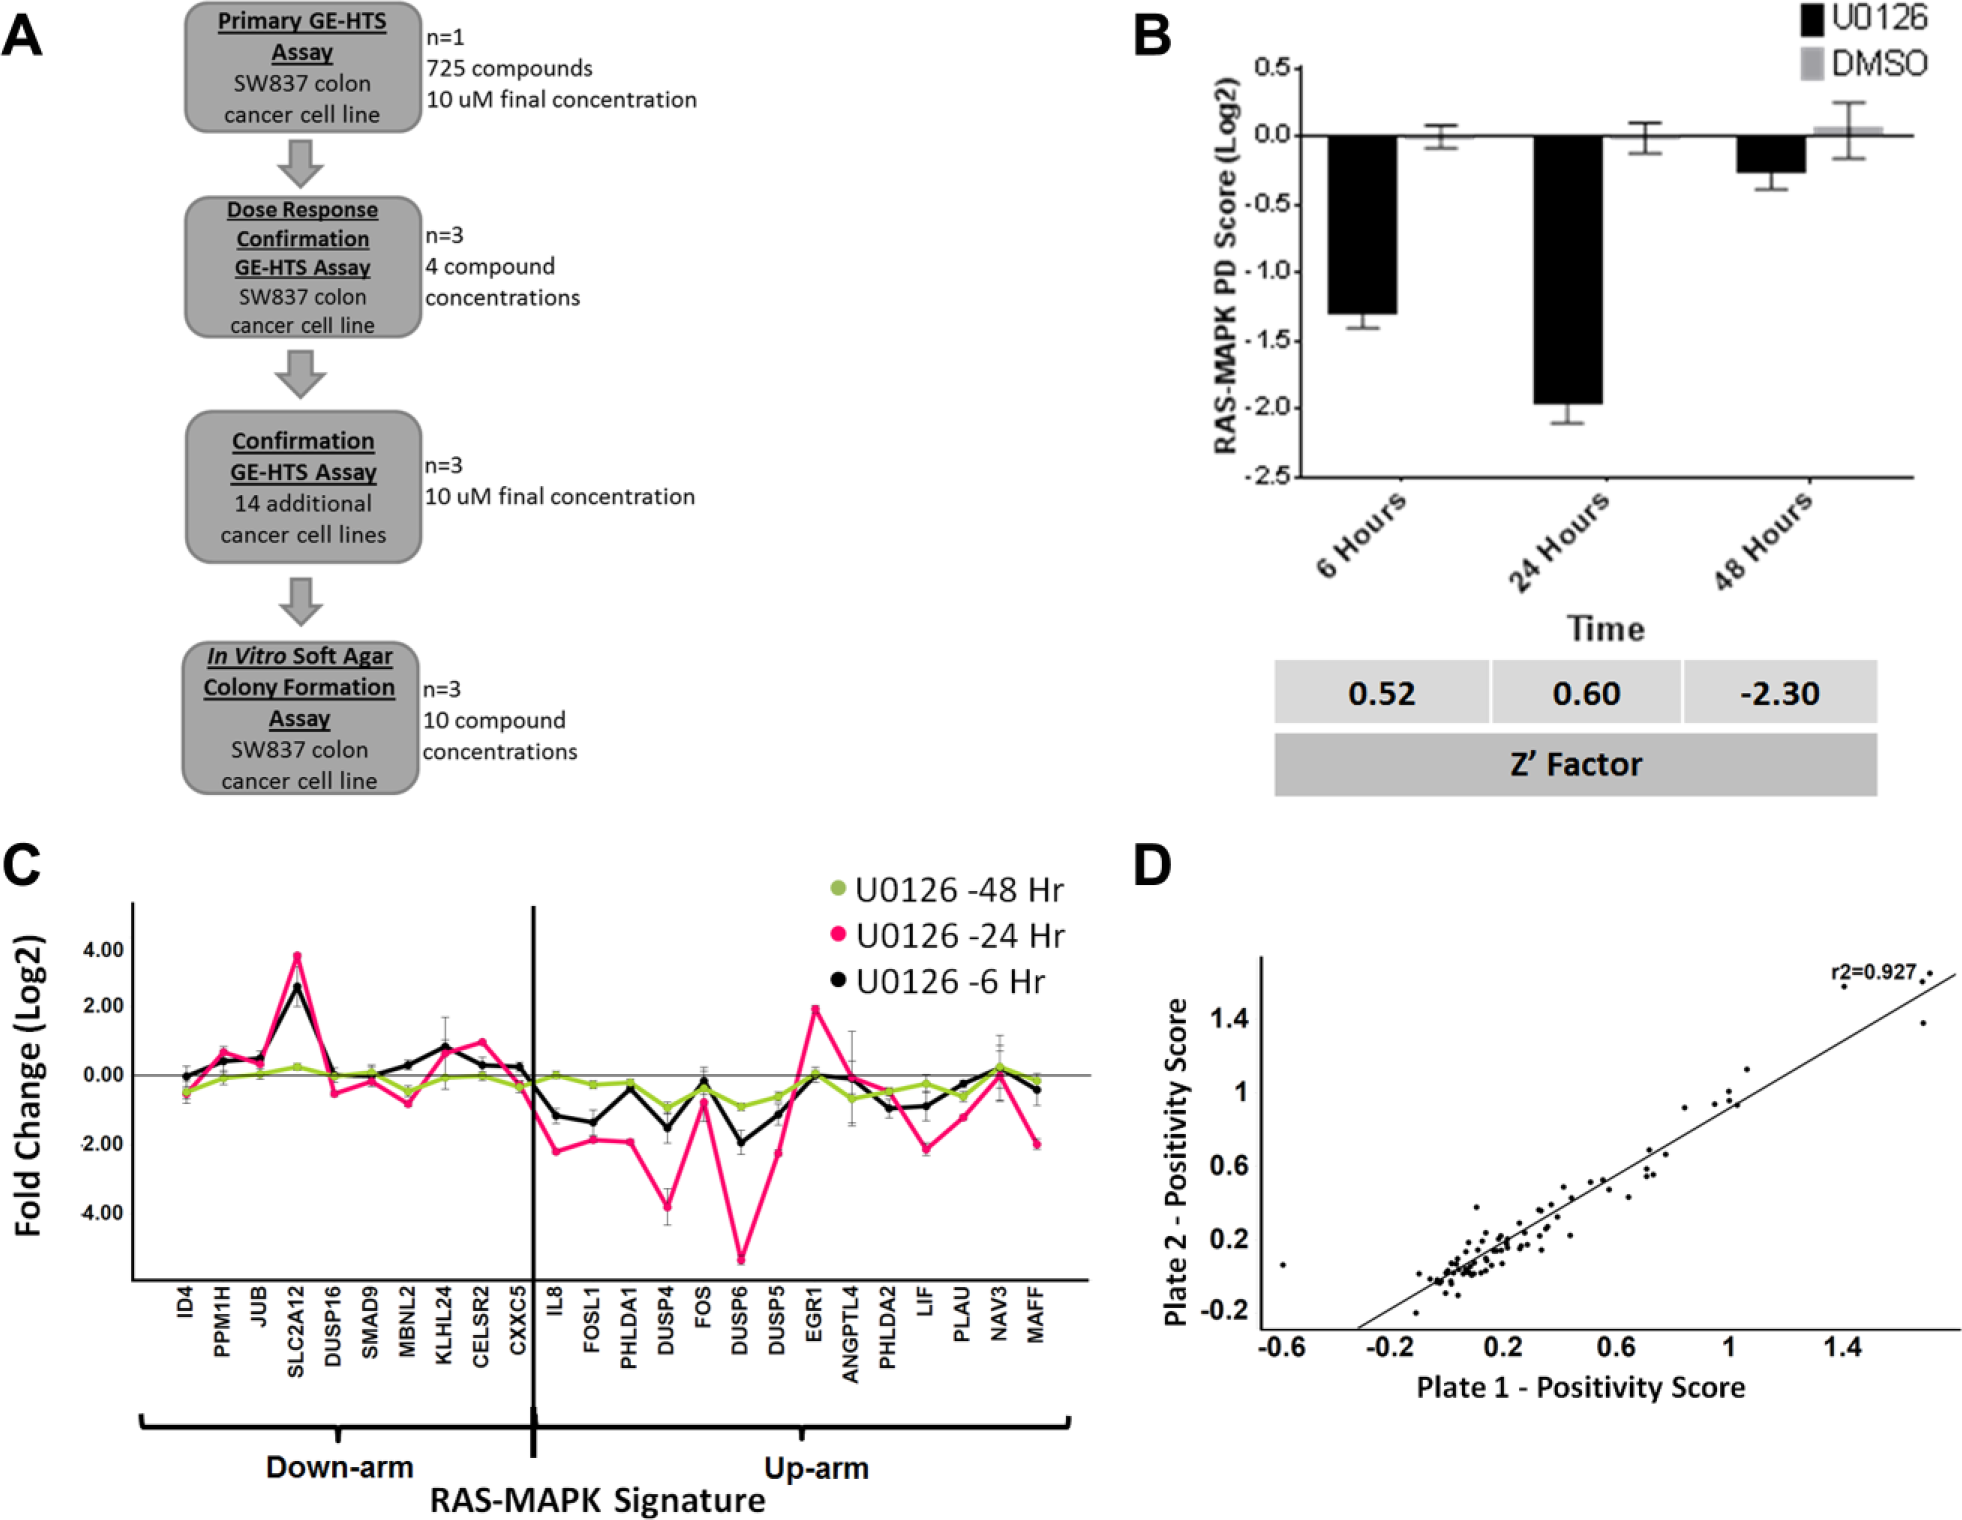
Optimization of the quantitative gene expression assay using the RAS-MAPK gene signature. (
Evaluation of Colon Cell Lines
Since we were interested in applying the gene expression technology to discover potential anticancer therapies for colorectal cancer, four KRAS mutant colon cancer cell lines (LOVO, HCT116, SK-C0-1, and SW837) were initially treated with U0126, a selective MEK1/2 inhibitor, to determine which cell line would yield a robust assay window (i.e., greatest downregulation of the signature) in response to a known RAS-MAPK pathway inhibitor. Specifically, we performed a 6 h treatment with the MEK1/2 inhibitor, at two cell concentrations (20,000 or 10,000 cells per well), followed by target mRNA measurements via the QuantiGene assay platform (
Time Course Evaluations
For SW837 assay optimization, we next conducted a time course study to characterize the relationship between gene signature modulation and drug exposure. We observed robust U0126-dependent downregulation of the signature’s PD score at both the 6 and 24 h time points (
Fig. 1B
,
C
) with robust Z′ factors (>0.5). The 6 h endpoint was chosen so the screen could emphasize candidate drugs that modulate the biomarker gene signature as a result of acute compound activity, rather than due to feedback regulation or secondary transcriptional effects following prolonged drug exposure. To confirm cell biochemical target engagement by U0126 in SW837 cells, immunoblots demonstrated that ERK phosphorylation was indeed inhibited by the MEK1/2 inhibitor; although pS6RP phosphorylation was also affected, this has been observed in previous reports (
Assay Reproducibility Using the SW837 Colon Cancer Cell Line
Day-to-day reproducibility of the assay was established by testing the U0126 (10 µM) and DMSO vehicle control over three separate days. Robust signature downregulation, Z′ factors (average = 0.63 ± 0.08), and low standard deviations were measured at each time point (
Pilot GE-HTS Screening
To evaluate the utility of our assay for high-throughput screening, we ran a pilot GE-HTS screen using a library of 725 annotated custom compounds that targeted a variety of druggable proteins, including known direct and indirect RAS-MAPK pathway members (
As the HTS results were complex, a multivariate statistical approach was used to rank compound activity using the data from each of the 26 gene features. Using the positivity scores described in Materials and Methods, assay statistics were calculated and compounds were ranked. The average Z′ factor was determined to be 0.49 ± 0.19 for this GE-HTS campaign, with a 1.38% hit rate when using a plate mean plus two standard deviation threshold for the positivity score (
Fig. 2A
). The screen’s MCC was measured to be 0.86, signifying the ability of the software to accurately predict positive and negative compounds. Both specificity and sensitivity (recall) scores were very robust at 1.0 and 0.84, respectively, indicating high true-negative and true-positive rates (
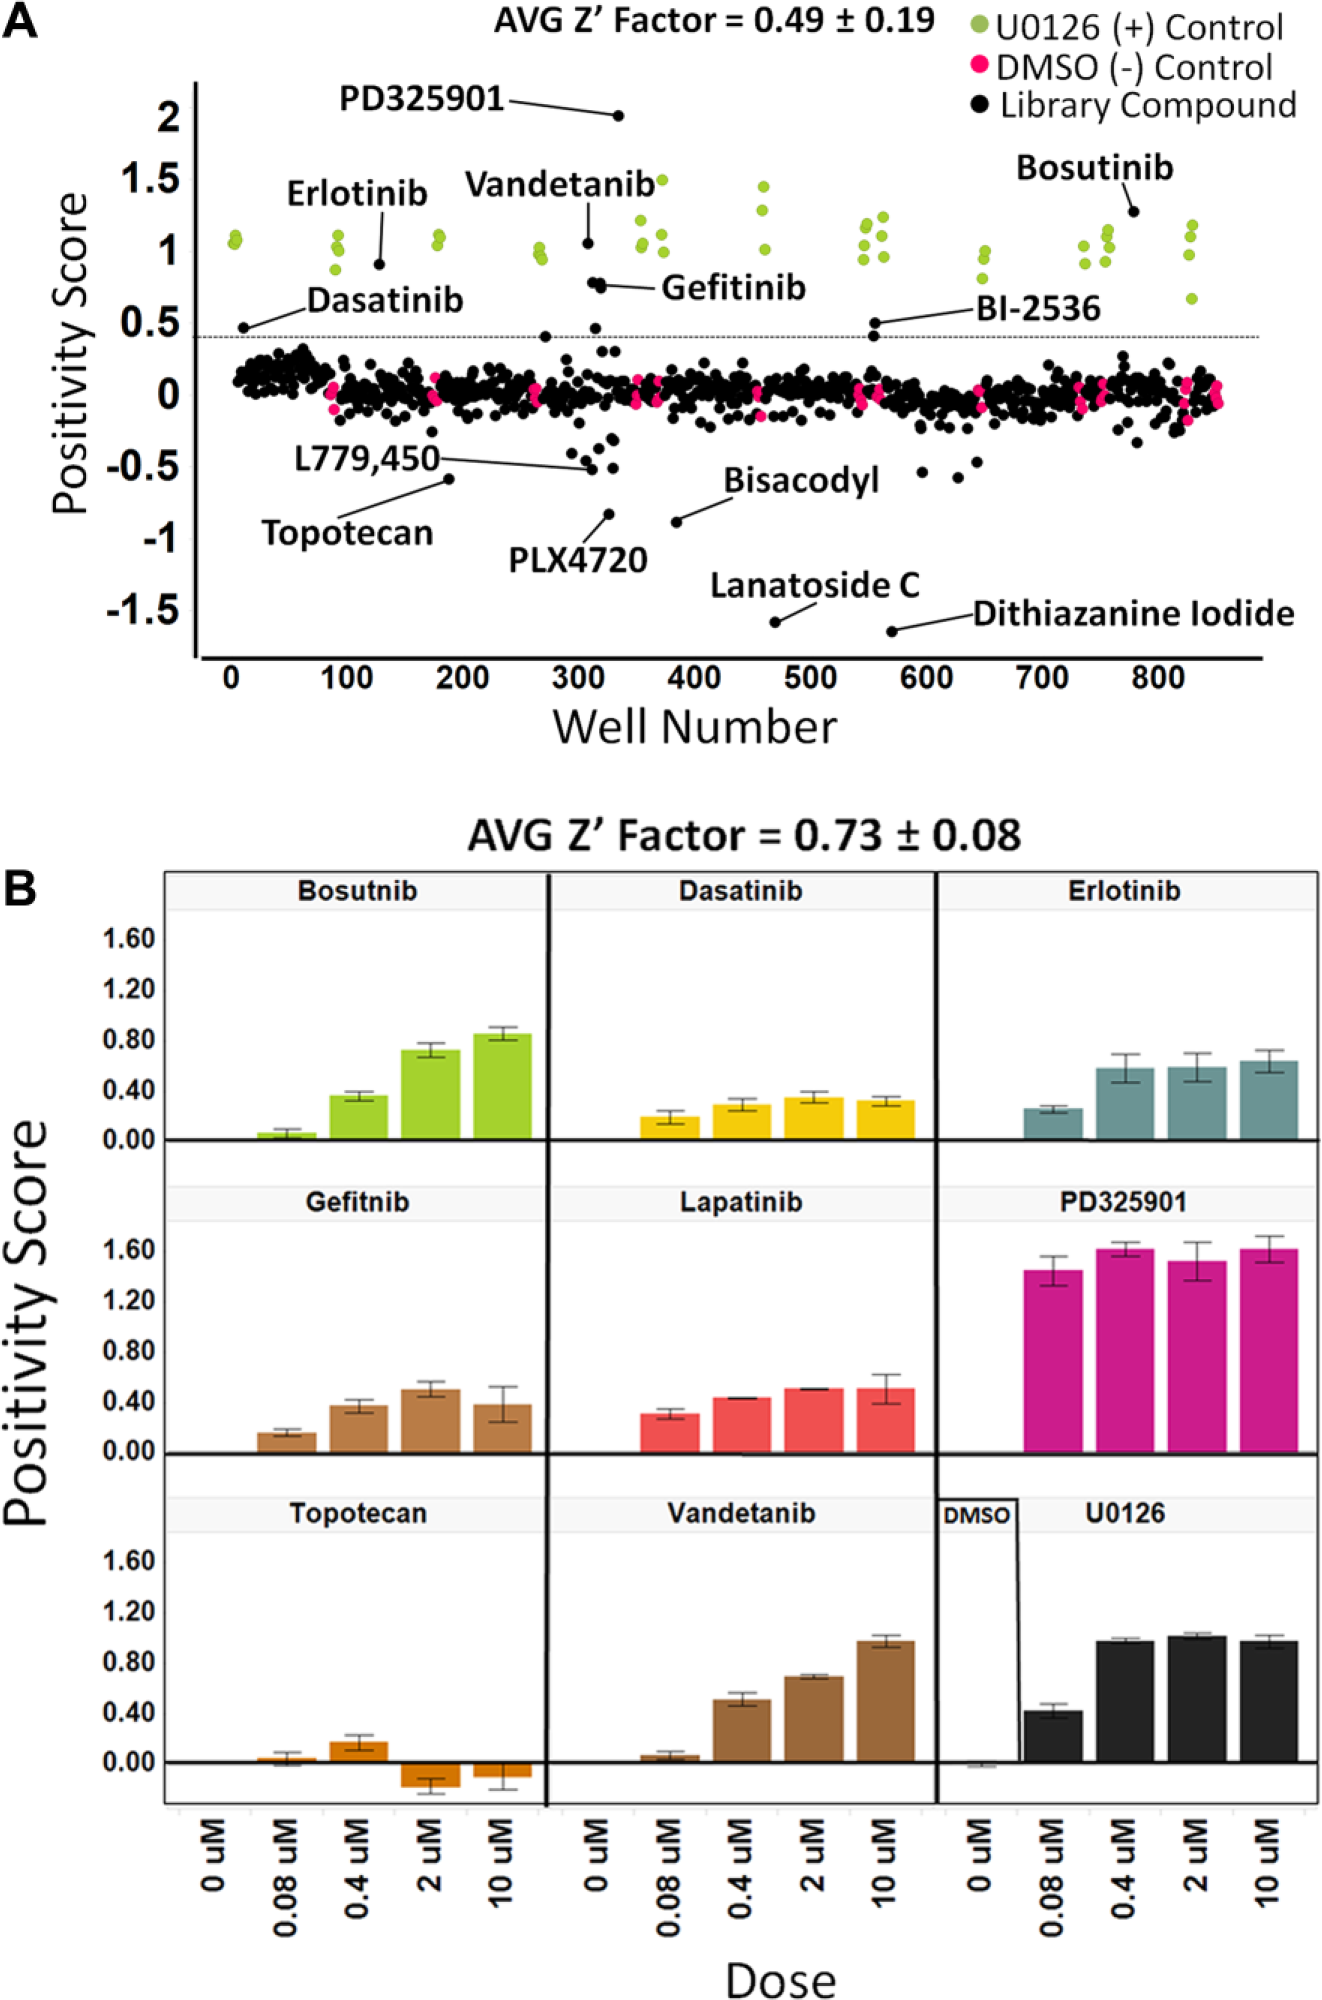
Results of the primary GE-HTS and dose–response GE-HTS. (
Top-ranked compounds from the primary screen showed a significant enrichment of RAS-MAPK pathway targeting compounds, included the MEK1/2 inhibitor PD325901, followed by receptor (EGFR) and nonreceptor tyrosine kinase inhibitors (SRC, ABL), as well as PLK-1 targeting compounds, all of which have been shown to inhibit phosphorylation of ERK9,10 ( Fig. 2A and Table 2 ).
List of the RAS-MAPK GE-HTS Hit Compounds and Corresponding Structures.
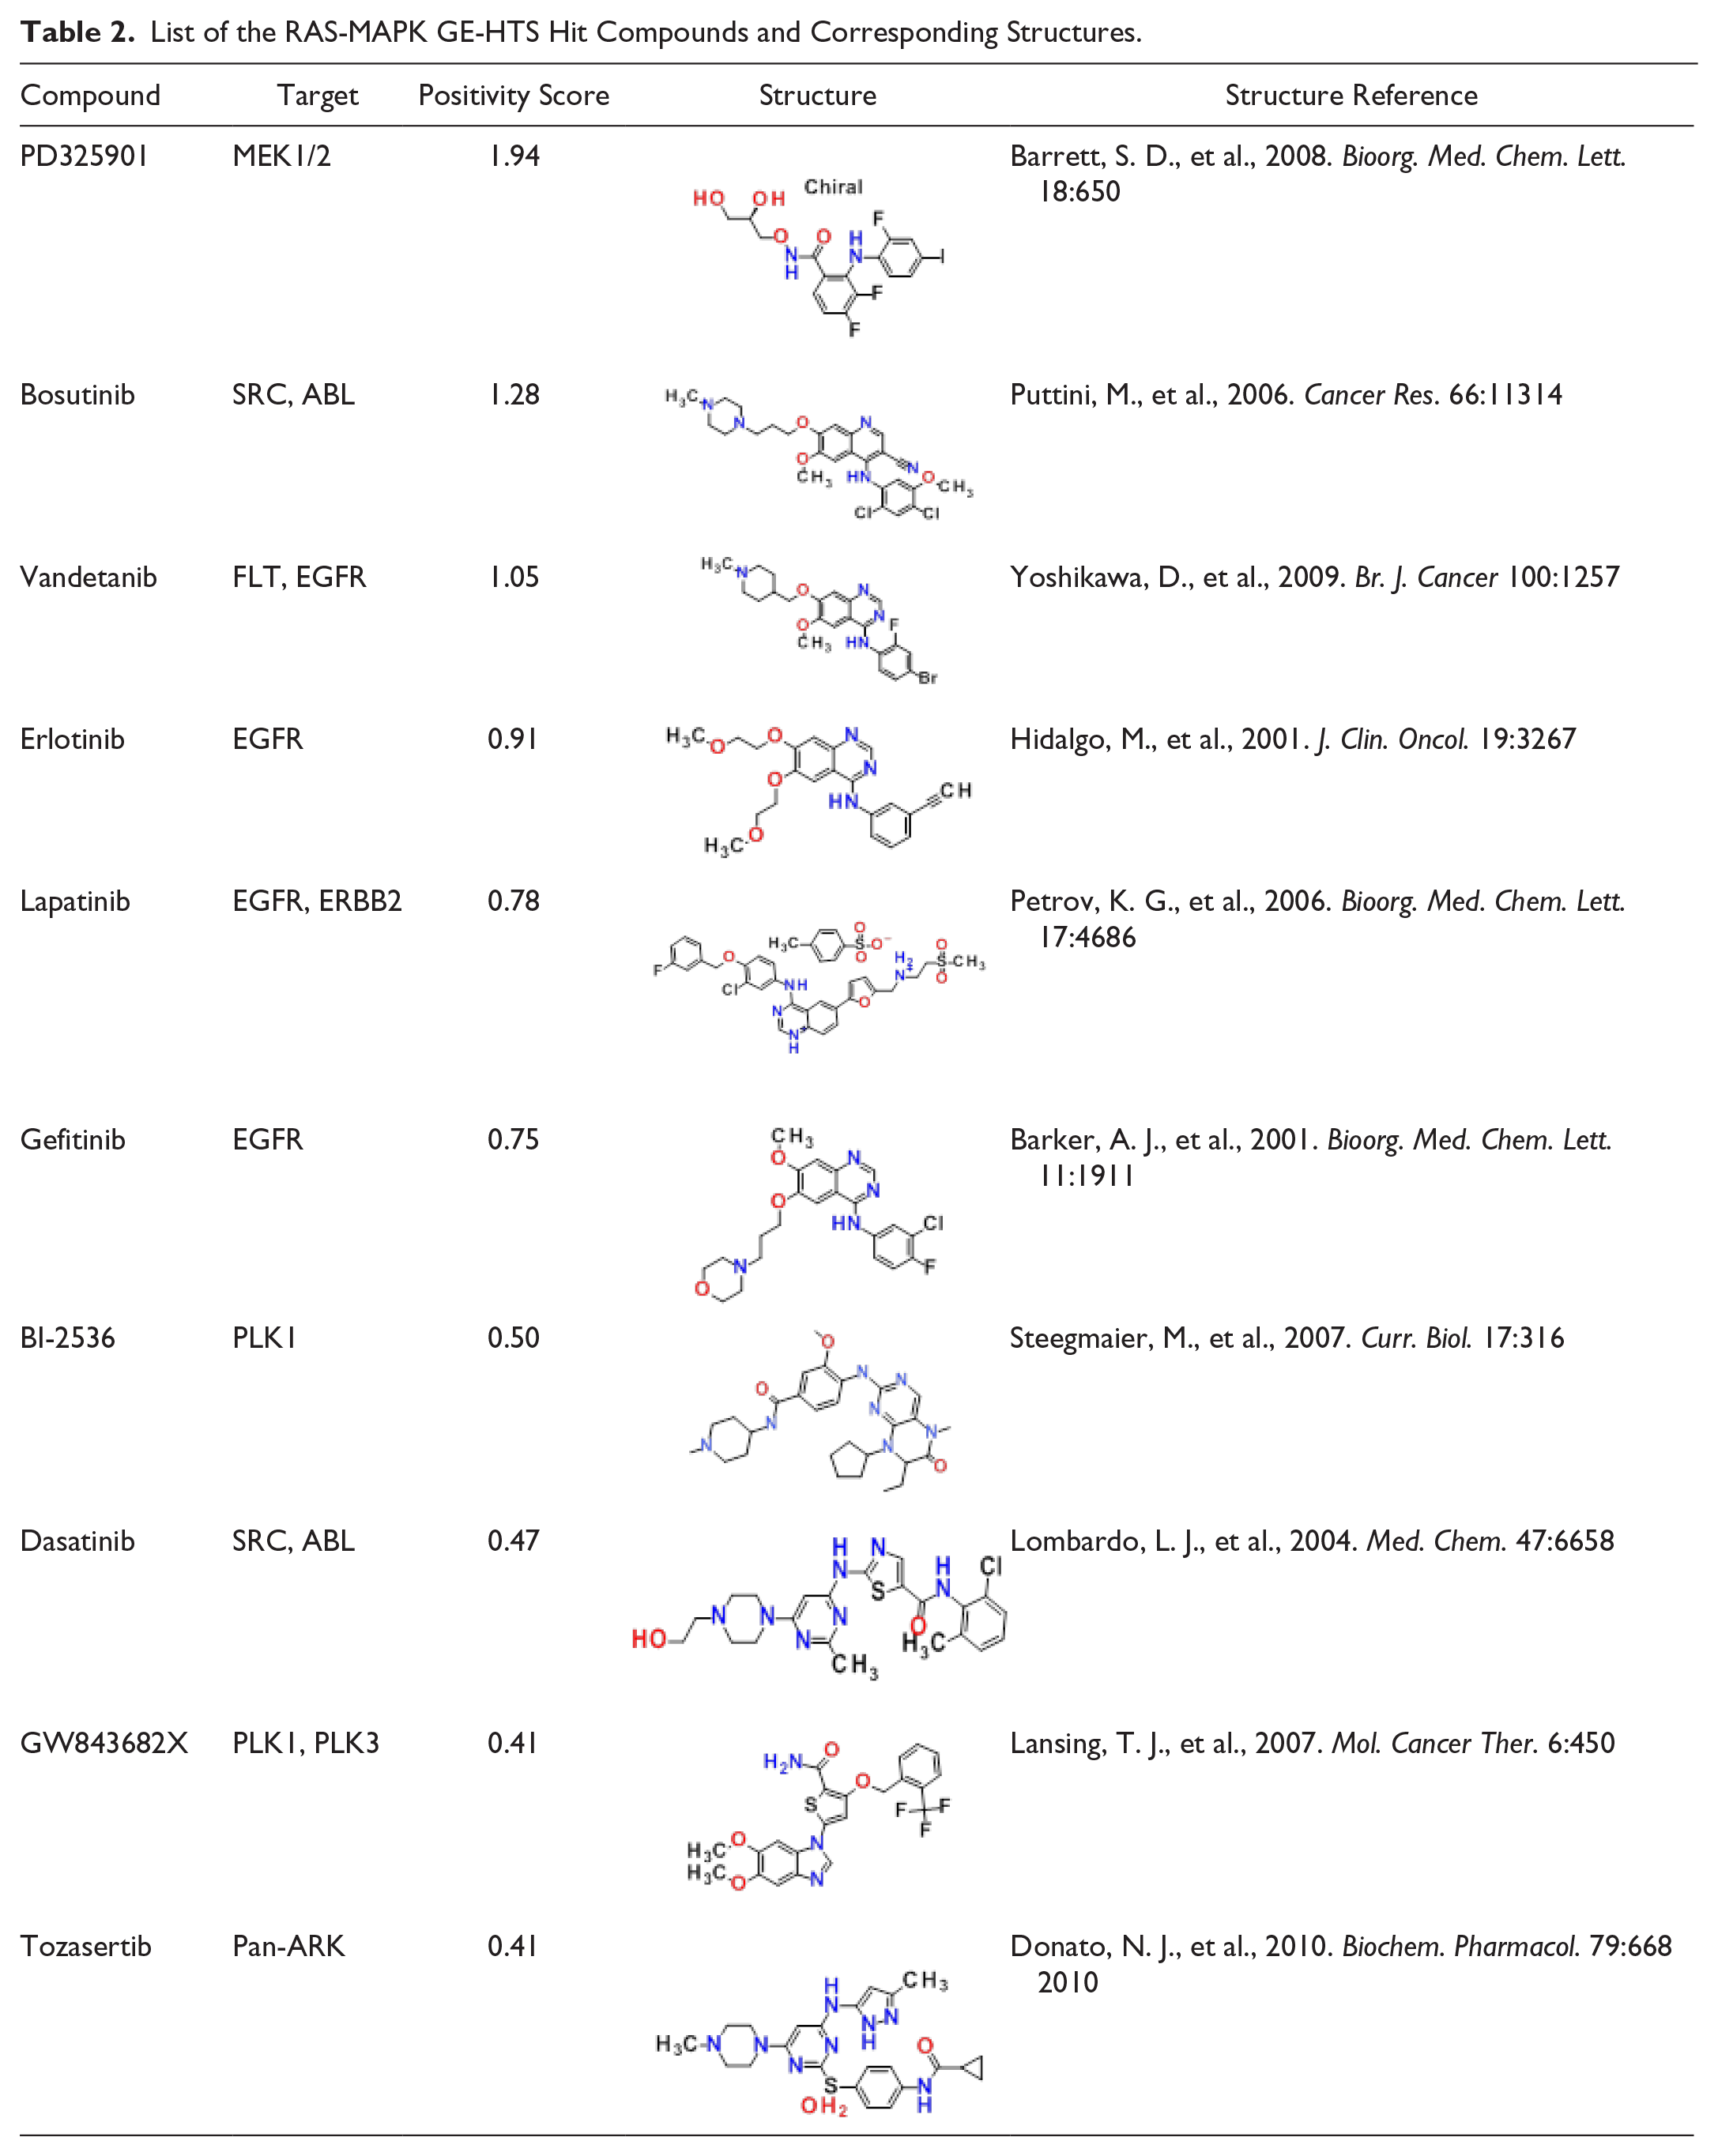
Several compounds presented strong negative positivity scores, that is, an increase in signaling through the pathway. The BRAF inhibitors PLX4720 (positivity score = −0.83) and the commercially available compound L779,450 (positivity score = −0.52) exhibited this characteristic ( Fig. 2A ). Results that are in agreement with previous reports describe the paradoxical activation of BRAF inhibitors in cancers that are RASmut/BRAFwt in which phosphorylation of ERK increases following compound exposure.10–13 (See Suppl. Note 1 and Table 2 for additional descriptions of compounds, targets, and the effect on the RAS-MAPK signature.)
Dose–Response GE-HTS
The control compound U0126, as well as several hit compounds from the primary screen and additional select compounds, was tested in a follow-up 4-point dose–response confirmation assay. The assay had an average Z′ factor = 0.73 ± 0.08, which is a very robust performance measure for a cell-based assay ( Fig. 2B ). The majority of hit compounds showed a concentration-dependent decrease in the positivity score. However, PD325901, a potent, selective MEK1/2 inhibitor with reported picomolar IC50 values in the CT26 murine colon cancer cell line and low nanomolar IC50 values in several melanoma cell lines, 9 exhibited significantly high positivity scores for all doses tested. Topotecan increased pathway activity at high concentrations, although it was shown to behave more similarly to U0126 at lower concentrations, thereby demonstrating the assay’s ability to reveal complex molecular responses to compound treatment ( Fig. 2B ). Hence, for future chemical screens using small to moderately sized drug libraries, it may be worthwhile to evaluate compounds at multiple concentrations (i.e., high, medium, and low) in order to dissect potential dose-dependent complexity at the level of gene signature modulation.
Testing Select Hits in Additional Cancer Cell Lines
To ensure that the performance of hit compounds is not specific to the SW837 cellular context, we tested several hit compounds in up to 14 additional cancer cell lines and measured their PD scores. Colon and lung tumor-derived cancer cell lines were challenged with identified EGFR, receptor tyrosine kinase, or MEK inhibitors (bosutinib, lapatinib, erlotinib, or PD325901) at 10 µM. All cell lines were KRAS mutant except for HT29, LS411N, and SW116, which harbor wild-type KRAS (
In Vitro Colony Formation Assay
As an additional orthogonal confirmation assay that could be used as part of the hit funneling strategy for a larger screen, we tested the receptor tyrosine kinase and MEK1/2 inhibitor hit compounds in a soft agar colony formation assay using the SW837 cells. All compounds exhibited IC50 values between 1.9 and 818 nM, indicating that the results of the GE-HTS assays could be translated to a phenotype of cell growth inhibition (
Conclusion
Multiplex gene expression readouts are more labor- and resource-intensive than other assays commonly used in drug discovery and HTS; however, in some instances, they may provide the only means of quantifying a phenotype of interest. This can be because a single readout (reporter gene, protein expression/modification) may not capture all possible responses of a model, or because a univariate readout may not have a sufficient assay window for screening. In cases where mRNA levels can be translated into relevant biological readouts, expression screening enables the interrogation of complex networks by small molecules, and hits identified from such GE-HTS efforts may yield important new insights. Indeed, the ability of the present assay system to identify RAS-MAPK targeting compounds, together with other recent gene signature–based proof-of-concept studies,17,18 suggests that these chemical genomic screens will be able to play a unique role in drug discovery.
Footnotes
Declaration of Conflicting Interests
The authors declared no potential conflicts of interest with respect to the research, authorship, and/or publication of this article.
Funding
The authors received no financial support for the research, authorship, and/or publication of this article.
References
Supplementary Material
Please find the following supplemental material available below.
For Open Access articles published under a Creative Commons License, all supplemental material carries the same license as the article it is associated with.
For non-Open Access articles published, all supplemental material carries a non-exclusive license, and permission requests for re-use of supplemental material or any part of supplemental material shall be sent directly to the copyright owner as specified in the copyright notice associated with the article.