
Abstract
Here, we describe an easy-to-use flow cytometric method using diphenylboric acid 2-amino ethyl ester (DPBA) stain for the detection of flavonoids in cells from human/animal origin. Flavonoid bioavailability and bioactivity depend on structure, conjugation and the cell type to which they are presented. We have studied cellular uptake of five flavonoids with different structures and conjugation forms. First, parameters including fixation method, technical and batch variability, and concentration were optimized. Second, uptake of two aglycones—quercetin and hesperetin—and their corresponding glycosides—rutin and hesperidin—in Caco-2 cells was compared. Third, the aglycone quercetin, glycoside rutin, and glucuronide baicalin were added to the Caco-2, HepG2, and CHO-K1 cell lines at 1, 10, and 20 µM concentrations and cellular uptake was measured after 1, 4, and 7 h. We conclude that quercetin was taken up by cells in a dose-dependent way, and that HepG2 cells had the highest uptake factors, followed by CHO-K1 and Caco-2 cells. Confocal microscopy showed cell type–dependent localization of quercetin in the cell membrane and cytoplasm. No uptake of flavonoid glycosides was detected. This flow cytometric method can be used for future research unravelling mechanisms behind flavonoid bioactivity in health and disease at the cellular level.
Introduction
Flavonoids are a well-studied and abundant class of plant polyphenols present in fruits, vegetables, tea, and wine.5,18 These antioxidants are associated with the prevention of various diseases associated with oxidative stress, such as cancers, inflammation, and cardiovascular diseases. 18 In general, flavonoid bioavailability is rather low, thereby limiting their final impact on the human body. Besides food matrix effects and the metabolic activity of the intestinal microbial community, this bioavailability is strongly dependent on the conjugation status of the phenolic backbone and is largely dependent on the hydrophilic/hydrophobic character of its structure. In general, hydrophobic aglycones are well absorbed through the intestinal cell membrane. 14 Yet, hydrophilic glycosides have a more homogenous distribution in the intestinal luminal content, and migrate better through the water-containing mucus layer surrounding the intestinal mucosa. Therefore, the final bioavailability of flavonoids is sometimes difficult to predict. Once the flavonoid aglycones are transported through the epithelial barrier, they reach the lymph and blood circulation system, where they are present as water-soluble glucuronidated and sulfated forms produced by mainly the intestinal and hepatic cells. In general, these conjugation steps decrease the bioactivity of the compounds in vitro, and therefore, it is suggested that prior to cellular uptake, the conjugate is removed to release the bioactive aglycone. 7 Indeed, previous studies showed that, for instance, neutrophils, 20 endothelial cells, 15 kidney cells, 2 and hepatocytes 13 are able to secrete glucuronidases under stressed conditions such as inflammation, cancer, and increased age, 24 but the final impact on flavonoid bioactivity is still under discussion. Therefore, mechanistic research at the cellular level is needed to unravel this interplay between flavonoid conjugation and final bioactivity.
Flow cytometry is an elegant and high-throughput method for determination of various characteristics of single cell suspensions. Many polyphenols—among which are flavonoids—have autofluorescent properties. These may be used for the detection of these compounds in cells. Although this property has been often applied for localization of polyphenols in plant and animal cells using confocal microscopy,6,10,12 publications describing flow cytometric protocols using this inherent fluorescence to determine the presence of polyphenols in single cell suspensions are very scarce. 3 The reasons for this may be that differences in autofluorescence are small, thereby increasing the variability, and the excitation/emission characteristics are dependent on the chemical structure. In literature, one probe, diphenylboric acid 2-amino ethyl ester (DPBA), has been shown to associate with flavonoids in particular, thereby strongly enhancing the fluorescent emission signal of the flavonoids by formation of complexes with 3-hydroxyflavones via a condensation reaction. 17 Recently, one publication has demonstrated the use of this probe for (semi-)quantitative determination of quercetin in animal-derived CHO-K1 cells using spectrofluorimetry of cell lysates and fluorescence-activated cell sorting (FACS) analysis of entire cells, and has compared the results with conventional spectrophotometric, microscopic, and analytical techniques. 8 The authors concluded that this probe enhances the sensitivity of the spectrofluorimetric and FACS method to the sensitivity of high-performance liquid chromatography analysis. Although this paper demonstrates that flow cytometric analysis in combination with DPBA is very promising for flavonoid research, it does not describe the optimization steps necessary for a reliable measurement of intercellular flavonoid fluxes, in which the conjugation form and cell characteristics play an important role.
Therefore, in this research, we have first optimized specific parameters related to the stability of the flavonoid accumulation in the cells, including the development of an appropriate cell fixation protocol, the determination of technical and batch variability of the flow cytometric results, and optimization of the applied flavonoid concentrations. Flavonoid uptake was confirmed using confocal microscopy. In a next step, the time-dependent intestinal absorption of two flavonoid aglycones and their corresponding naturally occurring glycosides were investigated using a human-derived intestinal cell line. Finally, to simulate the flavonoid fluxes in the body, this flow cytometric protocol was applied to investigate the cellular uptake of a flavonoid aglycone, glycoside, and glucuronide, in three different animal-derived cell lines at different incubation times and concentrations.
Materials and Methods
Chemicals and Standards
The standards of quercetin, rutin, hesperetin, hesperidin, and baicalin were purchased from Sigma-Aldrich (Diegem, Belgium), as well as DPBA, 4′,6-diamidino-2-phenylindole (DAPI), Trypan blue, DMSO, and paraformaldehyde. Ethano-lamine was purchased from Janssen Chimica (Beerse, Belgium), and methanol from Fisher Scientific (Erembodegem, Belgium).
Cell Culture
Caco-2, HepG2, and CHO-K1 cells were obtained from ATCC. The passage number of HepG2 and CHO-K1 cells was below 50, whereas for the Caco-2 cells, a late passage subculture (more than 100) was used, as this subculture displayed faster growth characteristics and a more homogenous morphology than the original culture. Cells were cultivated in T25 culture flasks in 4 mL of DMEM supplemented with glutamax (Life Technologies, Merelbeke, Belgium), 1% nonessential amino acids (Life Technologies), 1% penicillin/streptomycin (Life Technologies), and 10% fetal bovine serum (Greiner bio-one, Vilvoorde, Belgium), under 10% CO2 conditions and at 37 °C. For flow cytometric analysis, cells were washed for 20 s with 4 mL of phosphate-buffered saline (PBS) without calcium and magnesium, and trypsinized for 20 s with 2 mL of trypsin-EDTA (0.25%, Life Technologies). Next, trypsin was aspirated and the cells were dissolved in cell culture medium, counted using a Bürker counting chamber after Trypan blue (0.4%, 1/1 dilution in cell-containing culture medium) staining, and seeded in a six-well plate at a density of 300,000 cells/well. After approximately 80% confluency (corresponding to about 3 days of incubation), cells were treated with the flavonoid of interest in serum-free cell culture medium, incubated, and harvested using trypsinization. A negative control without flavonoid incubation was included in each experiment to allow correction for the background fluorescence of other cell compounds. After obtaining single cells, the trypsin was inactivated using 1 mL of cell culture medium, and the cells were suspended and transferred to a sterile Eppendorf tube. After centrifugation for 5 min at 2200g using a Spectrafuge 16M microcentrifuge (Labnet, Edison, NJ), the cells were washed with PBS, and after a second centrifugation step (5 min at 2200g), the supernatant was discarded and the pellet was used for fixation, staining, and flow cytometric analysis.
Cell Fixation
Three different conditions were tested, including a methanol and paraformaldehyde fixation step, and without fixation. For unfixed samples, the pellet was resuspended in 1 mL of PBS prior to staining. For methanol fixation, the pellet was resuspended in ice-cold methanol for 10 min, centrifuged, and resuspended in 1 mL of PBS prior to staining. For the paraformaldehyde staining, the pellet was resuspended in paraformaldehyde (4% in PBS) and incubated overnight at 4 °C. After centrifugation (5 min at 2200g) and discarding the paraformaldehyde, the cells were resuspended in ethanolamine (10 mM in PBS) for 5 min, centrifuged (5 min at 2200g), washed with PBS, centrifuged, and permeabilized with 0.5% Triton X-100 buffer in PBS for 5 min. Subsequently, the samples were centrifuged (5 min at 2200g), the supernatant was removed, and the cells were resuspended in 1 mL of PBS.
Flavonoid Staining with DPBA
The content of each sample was distributed in two Eppendorf tubes, of which one tube was incubated with the DPBA stain (0.2% w/v in 0.3% DMSO in water) during 1 h, whereas the other tube was incubated with 0.3% DMSO in water without stain. The latter sample was used to correct for background fluorescence of the flavonoid (conjugates). After staining, the cells were centrifuged (5 min at 2200g) and washed with PBS. After a last centrifuge step (5 min at 2200g), the supernatant was discarded and the pellets were dissolved in 200 µL of Evian water and analyzed using a BD AcurriTM C6 flow cytometer equipped with BD C-sampler software. Background signals were removed by gating of the forward (FSC) and side (SSC) scatter plots into green fluorescence plots. For the test with the incubation with a flavonoid aglycone, glycon, and glucuronide, the results are expressed as “uptake factors,” which are calculated according to the following formula:

in which F is the average green fluorescence of the cell population per analysis. The average of the uptake factors of at least three biological replicates, corresponding with three different wells, was taken into account for the statistics. A Student t test with unequal variances was used to determine significantly different results.
Confocal Microscopy
Cells were seeded onto a 24-well plate containing a 12 mm diameter glass cover slip. After treatment, cells were washed with prewarmed PBS (pH 7.5) and stained with 10 µM DiI cell membrane stain. Then, the cells were fixed with 3.7% paraformaldehyde in PBS overnight at 5 °C. The cover slip was then removed and placed in a washing recipient containing 10 mM ethanolamine for 5 min and washed twice with PBS. Thereafter, PBS buffer containing 0.5% Triton X-100 was added and incubated for 5 min prior to washing with PBS. A flavonoid staining solution containing 0.2% DPBA prepared in 0.3% DMSO in PBS, and DAPI was added onto the slides and incubated for 30 min. The samples were then washed with PBS and mounted onto a glass slide using 50% glycerol as a mounting agent. Cells were imaged using a Nikon A1 confocal microscope, with a Plan Apo 60× oil immersion objective with a numerical aperture of 1.27, a 488 nm argon laser, a pixel size of 0.2 μM, and NIS-Elements AR v4.1004 (Build 854) software. Image processing was performed in ImageJ freeware (W. S. Rasband, National Institutes of Health, Bethesda, MD, http://rsb.info.nih.gov/ij/, 1997–2012).
Results
Optimization of the Fixation Protocol
Because flavonoids are continuously transported inside, but also effluxed out of the cells, it is possible to have a loss of flavonoids during the washing and centrifugation steps in the protocol, and therefore, fixation of the cells prior to flow cytometric analysis is warranted. Figure 1 shows the plots of the SSC in function of the green fluorescence signal, as well as the corresponding histograms, of unfixed, methanol fixed, and paraformaldehyde fixed Caco-2 cells pretreated with 25 µM quercetin for 18 h. These fixation steps were performed upon trypsinization, because it was not possible to have a strong signal when fixation was performed prior to trypsinization (data not shown). This was probably due to the resistance of denaturated and cross-linked cell proteins to enzymatic cleavage by trypsin, and therefore, the signal of the cell aggregates may have fallen outside the detection range of the detectors of the flow cytometer.
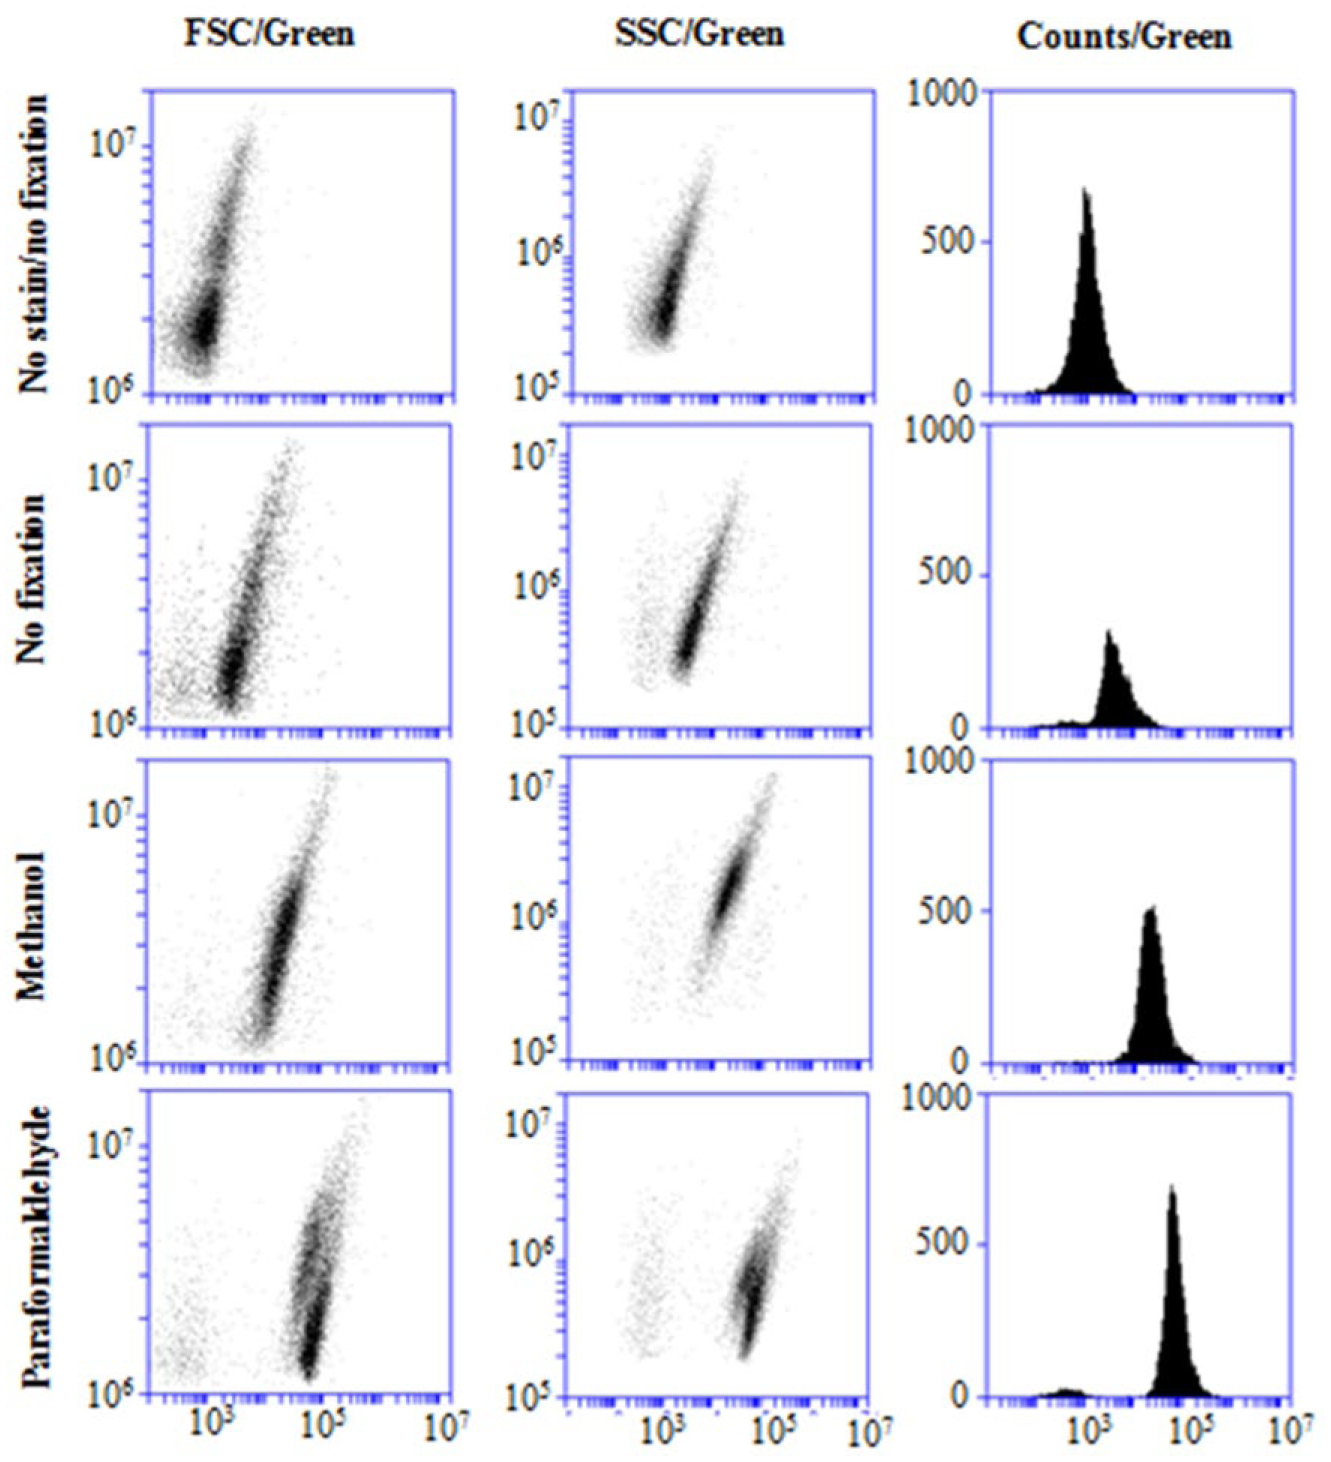
Impact of fixation method on green fluorescence. FSC plots (left panels), SSC plots (middle panels), and histograms (right panels) in function of the green fluorescence (X axis) of Caco-2 cell populations pretreated with 25 µM quercetin for 18 h, without staining and fixation, and under unfixed, methanol, and paraformaldehyde fixed conditions, followed by DPBA staining.
It can be observed that DPBA staining clearly increases the green fluorescence of the cells, which was the highest for the paraformaldehyde fixed cells, followed by methanol and unfixed cells, having the lowest intensity. Compared to cells without fixation, which were obtained using the protocol published by Lee et al., 8 methanol fixation has increased the green fluorescent signal 5-fold, and paraformaldehyde fixation 14-fold. Therefore, it is indeed possible that quercetin has been metabolized and effluxed from the unfixed cells. As quercetin is also very soluble in methanol, we have used the paraformaldehyde fixation for the following experiments. Interestingly, the paraformaldehyde fixed cells showed two partially overlapping cell populations in the FSC and SSC plots. This was probably not due to cross-linking between cells, because then we would expect a higher green fluorescence of the cell population with the highest FSC, but this may be caused by swelling and granulation of the cells, which may indicate a slightly toxic effect of the quercetin at the applied conditions. Therefore, for the next experiment, the concentration of quercetin was decreased to 20 µM.
Effect of Concentration, Incubation Time, and Glycoside Presence
To investigate the concentration-dependent uptake of quercetin, Caco-2 cells were incubated with 0, 0.5, 1, 5, 10, and 20 µM quercetin for 7 h. The uptake, expressed as fold increase compared to the blank (0 µM quercetin), is presented in Figure 2A . These results demonstrate that the uptake of quercetin is concentration dependent, which corresponds with the results of Lee et al. 8 Therefore, in a next experiment, a concentration of 20 µM was chosen for the tested substrates, as this concentration gave the highest uptake without any visible toxicity for the Caco-2 cells.
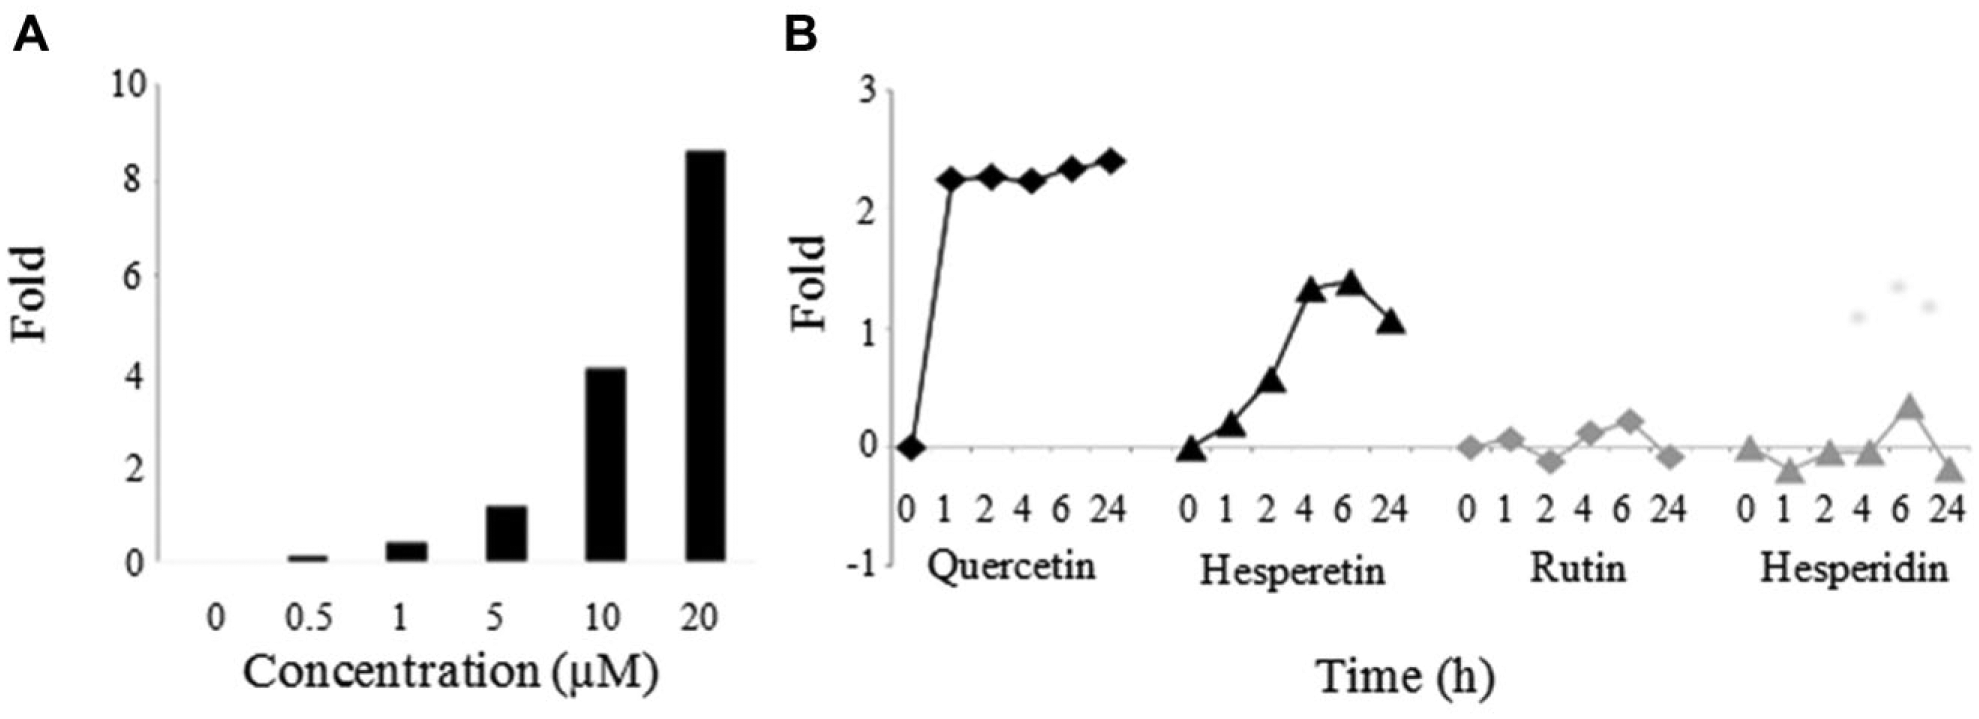
Impact of concentration, incubation time, and compound on flavonoid uptake by Caco-2 cells. (
In this experiment, two aglycones, quercetin and hesperetin, and their corresponding glycosides, rutin and hesperedin, were added to a new batch of Caco-2 cells to investigate the effect of the glycoside group on intestinal uptake. Because differences in polyphenol structure may lead toward different transport kinetics, this uptake was measured after several time points, including 0, 1, 2, 4, 6, and 24 h of incubation. Figure 2B shows that quercetin is already taken up after 1 h, and the average fluorescence remained stable over time. Hesperetin showed a lower and slower uptake, with maximum levels at 6 h of incubation, and a slight decrease after 24 h. In correspondence with literature, the uptake of the glycosides was negligible. For the following experiments, incubation times will be restricted to a maximum of 7 h, to avoid toxicity, degradation, and efflux of the flavonoids. In addition, because interbatch variability was observed between the first and second experiments, which may have been caused by the different passage numbers of the Caco-2 cell batches, extra attention was given to the randomization and subculture conditions in the next experiments.
Technical and Batch Variability
To investigate the robustness of the protocols, three biological replicates were created by cultivating Caco-2 cells in three T25 culture flasks, with a cell density of 600,000 Caco-2 cells per flask. After exposure to 20 µM quercetin for 7 h, cells were trypsinized, and three technical replicates were obtained from every biological replicate by dividing the cell solution from each flask into three Eppendorf tubes. Then the fixation, staining, and flow cytometric protocols were applied to each tube. The coefficients of variation for the technical replicas ranged from 4% to 10%, which indicate a good reproducibility of the method. The coefficient of variation of the biological replicas was 13%, which is also considered sufficient.
Concentration- and Time-Dependent Uptake of Flavonoid Aglycone, Glycoside, and Glucuronide by Three Different Cell Lines
To study the impact of flavonoid conjugation and the cell type on flavonoid uptake, intestinal Caco-2, hepatic HepG2, and ovarian CHO-K1 cell lines were incubated with quercetin, rutin, and baicalin. The concentrations were 0, 1, 10, and 20 µM, and samples were taken after 1, 4, and 7 h of incubation. To correct for background fluorescence from aspecific cell components and the flavonoids itself, the results are expressed as uptake factors as described in Materials and Methods.
Only quercetin was taken up in significant amounts by all cell lines ( Fig. 3 ), at a concentration of 10 and 20 µM, whereas no uptake was visible for rutin and baicalin. Second, the quercetin uptake was the highest for the HepG2 cell line, followed by Caco-2 and CHO-K1 cells. Third, the most optimal incubation time at which maximal uptake occurred was different among the cell lines. Quercetin uptake in the Caco-2 cell line was fast, and remained stable throughout time. The CHO-K1 cell line also had a fast uptake of quercetin after 1 h; however, after 4 and 7 h the uptake factors decreased. The HepG2 cell line displayed a more complex kinetic profile, as uptake was fast, then decreased after 4 h, and then increased again after 7 h. Overall, these results indicate that conjugation is negatively affecting flavonoid uptake, and that transport kinetics are cell type dependent.
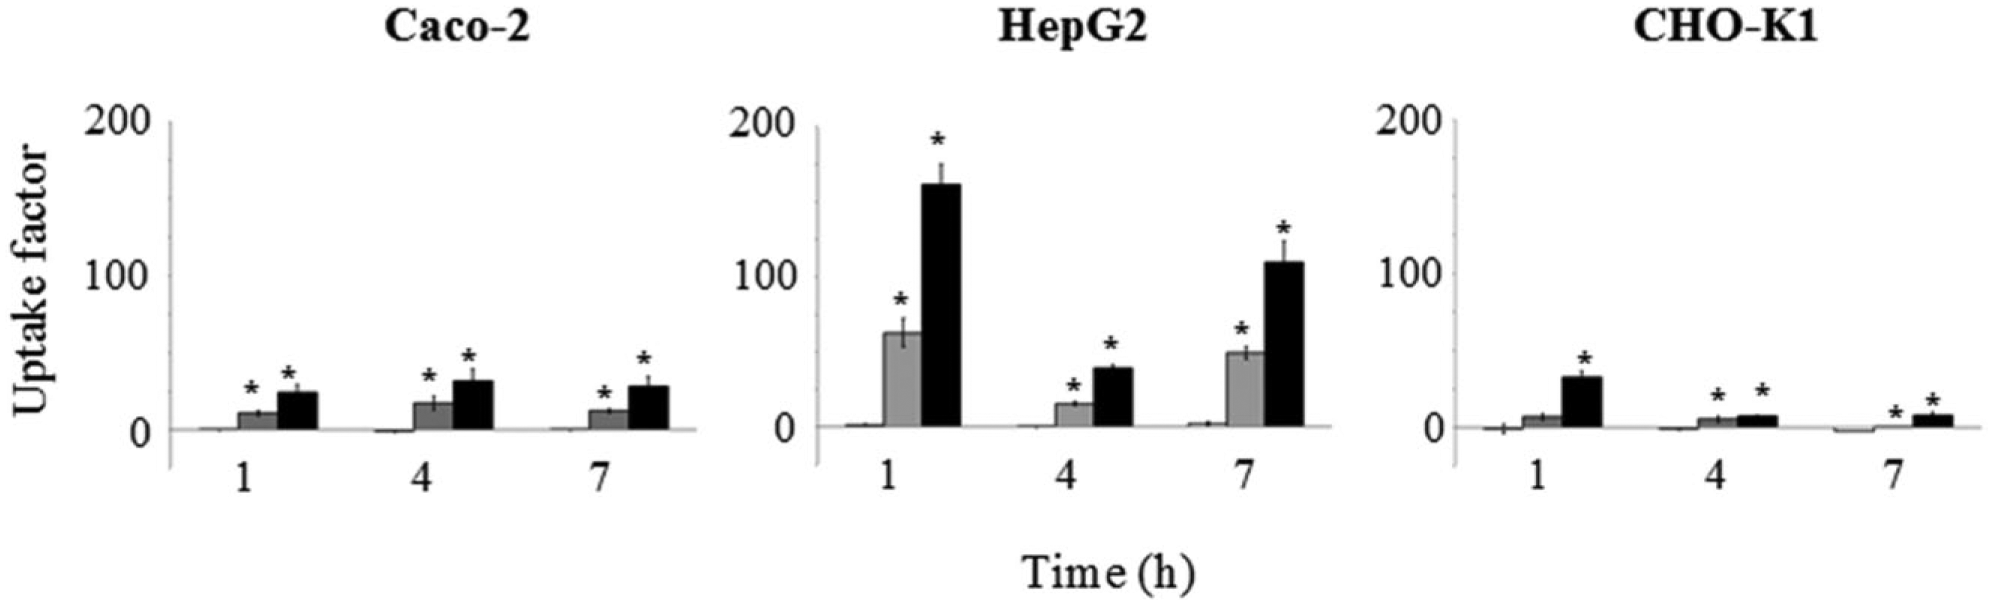
Impact of cell line on flavonoid uptake in a concentration- and time-dependent way. Concentrations of 1 µM (white bars), 10 µM (grey bars), and 20 µM (black bars) of quercetin were added to Caco-2, HepG2, and CHO-K1 cells for 1, 4, and 7 h. Error bars indicate standard deviations, and * indicates conditions that were significantly different (p < 0.05) from the untreated cells at the same incubation times (n = 3).
Localization of Quercetin in Three Different Cell Lines
Confocal microscopy was used to investigate whether the different flavonoid uptake behaviors of the cell lines could be explained by different locations of storage inside the cells. Figure 4 shows that for Caco-2 cells, the green flavonoid staining fully colocalizes with the red cell membrane stain, thereby suggesting the presence of quercetin in the cell membrane and its absence in the cell cytoplasm and nucleus. This membrane association may explain the relatively stable profile of quercetin-exposed Caco-2 cells as determined by flow cytometry. For the HepG2 and especially the CHO-K1 cell lines, a similar membrane-associated colocalization was visible, but in addition, clear green dots are also visible in the cell cytoplasm. This cytoplasmic trafficking of the flavonoids may partially explain the more dynamic profiles of the uptake factors of these cell lines, as shown in Figure 3 .
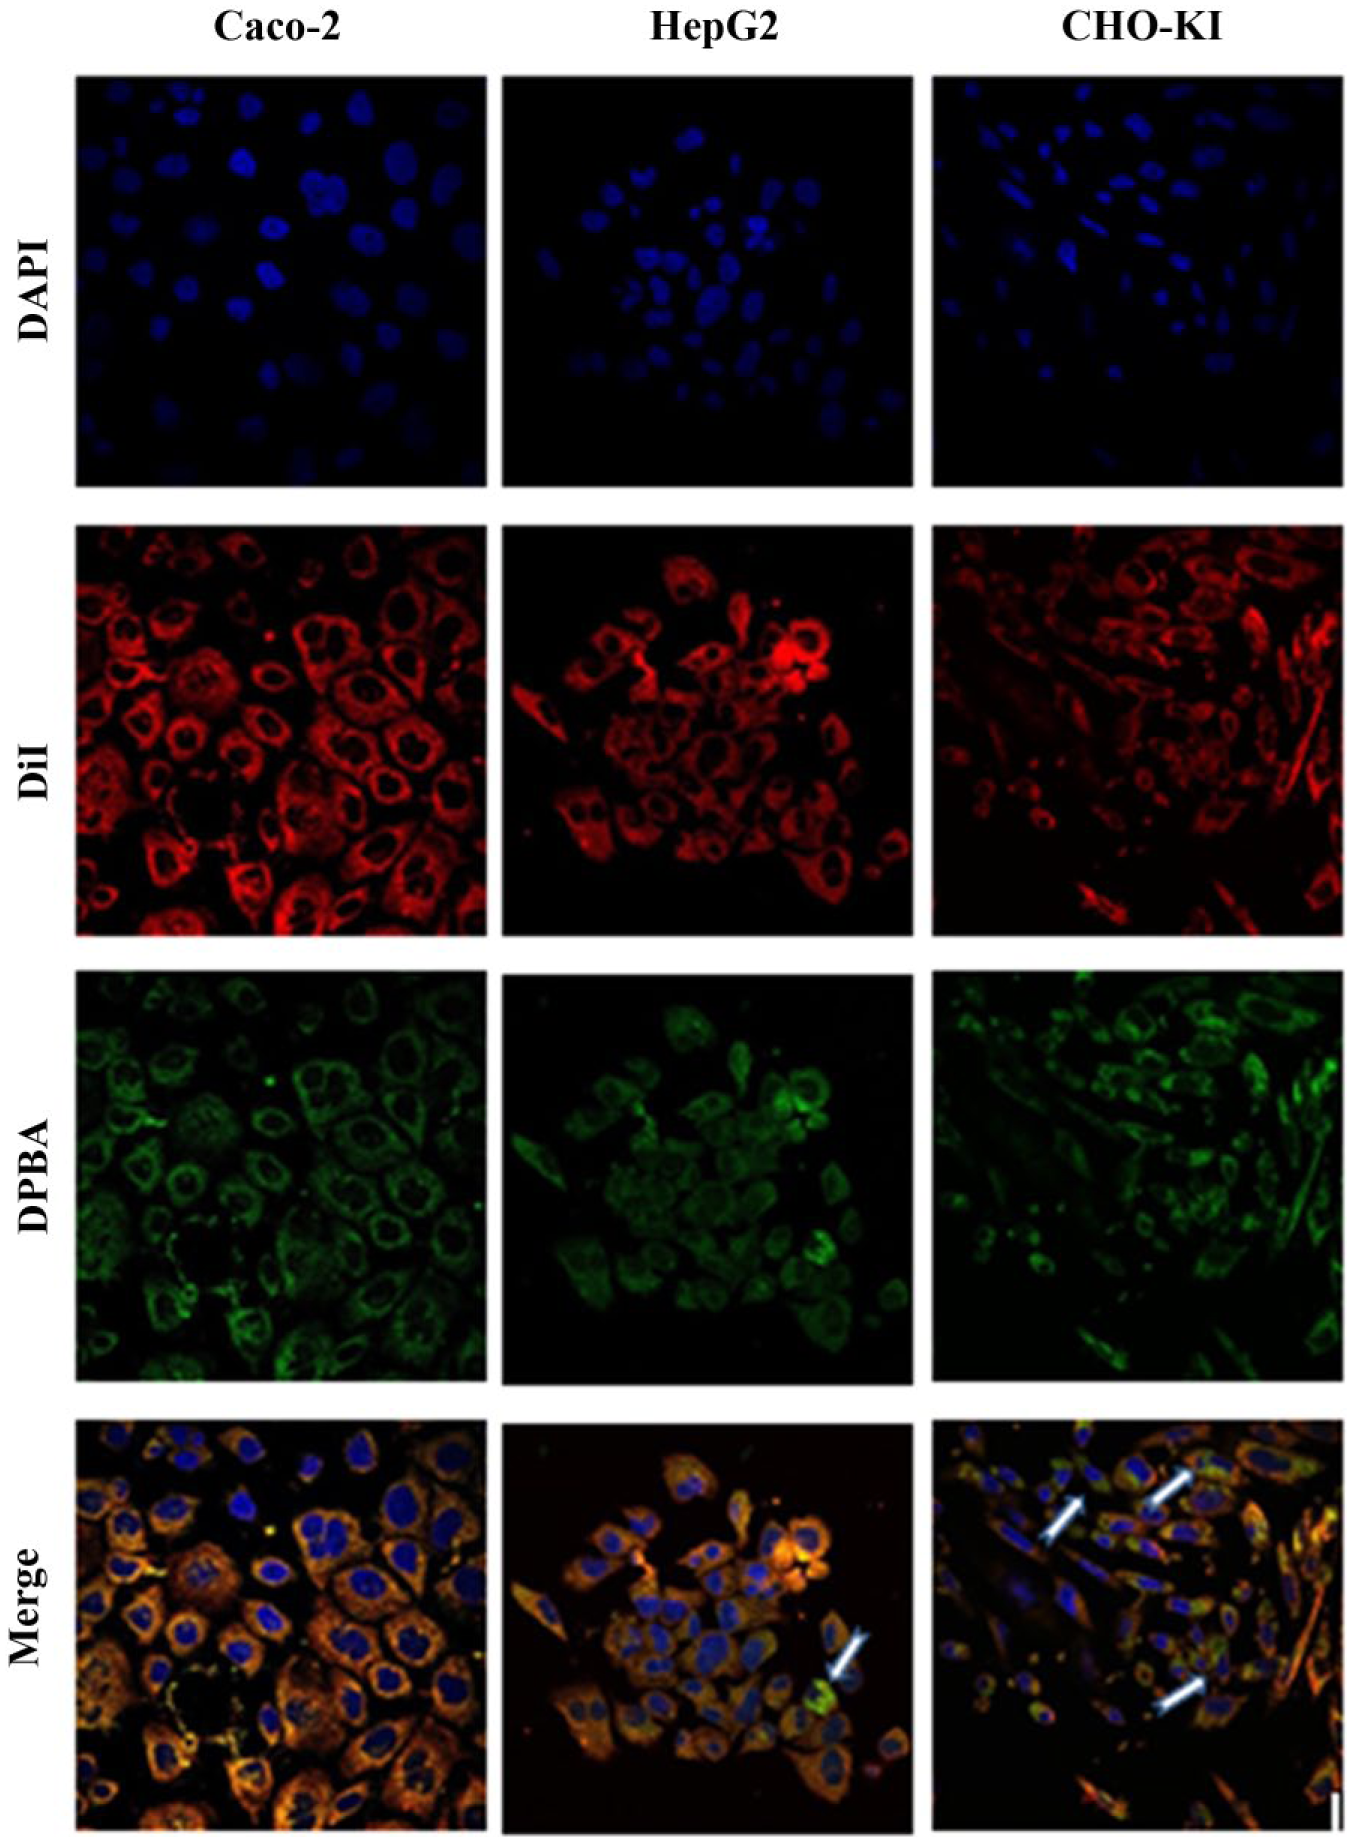
Localization of quercetin in the cell visualized by confocal microscopy. Caco-2, HepG2, and CHO-K1 were incubated with quercetin, and the cell nuclei were stained with DAPI (blue), the cell membrane with DiI-C18 (red), and quercetin with DPBA (green). Overlap of the membrane and quercetin stains is presented in yellow in the merged pictures. The white arrows indicate cytoplasmic quercetin.
Discussion
In this article, we have fine-tuned an earlier published protocol for the use of flow cytometry in combination with DPBA staining, and applied the improved protocol to investigate flavonoid fluxes in different human/animal cell types. The bioavailability and bioactivity of flavonoids largely depend on their conjugation status, which is directly linked to their solubility, as well as on the characteristics of the cell type to which the flavonoid is administered.
In general, the improved flow cytometric protocol is suitable to demonstrate that aglycones are better absorbed then flavonoid glycosides, not only by intestinal cells, but also by hepatic and ovarian cells, which is in accordance with previous findings.9,10,23,27 Our results also show that quercetin accumulation by Caco-2 cells was faster and more stable than hesperetin accumulation. This may partially be explained by the different transport kinetics of these compounds. Tian et al. 23 have determined the apparent permeability (Papp) of quercetin and hesperetin, which was 3.91 and 18.30 (*106 cm/s), respectively, from the apical to the basal side of the Caco-2 cell monolayer. In the same study, Papp values for the basal to the apical side were in the same range for quercetin and hesperetin, more specifically, 3.47 and 15.70 (*106 cm/s), respectively, and therefore, it can be concluded that in differentiated Caco-2 cells, both compounds are probably transported by the same mechanism, that is, passive diffusion. Although our Caco-2 cells were not differentiated, we may expect that similar differences in passive diffusion may occur, as this is a membrane-associated process that does not require active transporters. Therefore, one may conclude that the differences in passive diffusion rate may explain the higher accumulation of quercetin than of hesperitin in our experiments. However, this conclusion can be questioned because our confocal images showed that quercetin was accumulating in the apical cell membranes, and it was therefore not certain that quercetin had diffused inside the cell cytoplasm in our experiments.
We have also studied for the first time the kinetics of flavonoid uptake in three different cell lines. It was observed that the uptake factor of quercetin differs considerably among the different cell types. This is most probably not a size effect, because when checking the cells microscopically, HepG2 cells are smaller than Caco-2 cells, but they have a higher uptake factor. In addition, because the same seeding density, cell culture medium, supplements, and CO2 levels were applied for all cell types, and because the incubation time was limited to a few hours, we do not expect that the environmental conditions had a strong impact on the differences in quercetin uptake between the different cell types. Therefore, other mechanisms may explain this effect, more specifically, (1) the different sites of accumulation in the cell and (2) the different expressions of influx, efflux, and conjugation proteins in the cell.
First, we have observed that the site of flavonoid accumulation is cell type dependent, and is mostly associated with the cell membrane, followed by the cell cytoplasm. This is largely in accordance with previous research, which demonstrated that for Caco-2 cells, flavonoids accumulate on the apical cell membrane without penetrating into the cell, whereas for HepG2 cells, accumulation was visible in the cytoplasm but also in the nucleus.10,16,22 Yet, no nuclear quercetin was found in our confocal samples. A reason for this is not clear, but may depend on incubation time, concentration, cell passage number, or undefined environmental factors. Although quercetin accumulation in CHO-K1 cells has been described previously, 8 as far as we know, we are the first one to report its presence in both cell membrane and cytoplasm.
There are indications that the location of flavonoid accumulation may be directly linked to its bioactivity, though this type of research is still in the explorative phase. Using artificial bilayer membranes simulating the cell membrane, Saija et al. 16 and Schnitzer et al. 19 have reported that, together with the redox properties of the flavonoids, the ability to interact with membranes and their consequent rigidification is necessary to express antioxidant activity. For HepG2 cells, Notas et al. 12 showed that quercetin accumulation in the nucleus modifies the transcription of about 2200 genes that are related to cell motility, cell cycle regulation, and xenobiotic metabolism, yet when present in the cytosol in high concentrations, it inhibits cell proliferation and disrupts the actin skeleton. In conclusion, though the developed flow cytometric protocol is not able to directly identify the location of accumulation, it may already give a first and fast indication of accumulation behavior in the cells, and therefore predict changes in bioactivity of the flavonoids.
Second, the presence of flavonoids in the cell is largely dependent on the speed of transport inside the cells, efflux out of the cells, and conjugation/deconjugation mechanisms, which are dependent on cell type. 21 Flavonoids absorption occurs by passive diffusion through the cell membrane, 21 as well as by specific transporters, including solute carrier transporters (SLCs),21,26,28 sodium-dependent glucose transporters (SGLTs), and bilitranslocases.4,21 Flavonoid efflux is controlled by ATP-binding cassette (ABC) transporters,1,9,11,26,28 whereas conjugation is controlled by UDP-glucuronosyltransferases (UGTs)20,21 and sulfotransferase (SULT). 25 Further molecular research is warranted to investigate whether differences in transporter expression and activity may explain the observed flow cytometric results in the tested cell lines.
We have fine-tuned a fast and high-throughput flow cytometric protocol that allows investigating accumulation behavior of flavonoids in human/animal-derived cell lines. When validated with the appropriate markers using molecular tools, this protocol may have the potential to rapidly predict shifts in accumulation site of the flavonoid, transporter, and conjugation/deconjugation enzyme expression, and finally bioactivity in the cell.
Footnotes
Acknowledgements
The authors would like to thank Prof. Winnok de Vos and Geert Meesen for their contribution in the execution of the work. Special thanks also go to the Special Research Fund (BOF) for financial support.
Declaration of Conflicting Interests
The authors declared no potential conflicts of interest with respect to the research, authorship, and/or publication of this article.
Funding
The authors received no financial support for the research, authorship, and/or publication of this article.