
Abstract
Technologies to improve the throughput for screening protein formulations are continuously evolving. The purpose of this article is to highlight novel applications of a molecular rotor dye, 4-(4-(dimethylamino)styryl)-N-methylpyridinium iodide (DASPMI) in screening for the conformational stability, colloidal stability, and subtle pretransition dynamics of protein structures during early formulation development. The measurement of the apparent unfolding temperature (Tm) for a monoclonal antibody in the presence of Tween 80 was conducted and data were compared to the results of differential scanning calorimetry (DSC) measurements. Additionally, measuring the fluorescence intensity of DASPMI as a function of protein concentration shows consistent correlation to the diffusion interaction parameter (kD) for two distinct monoclonal antibody formulations measured by DLS. Lastly, due to the sensitivity of the molecular rotor dye to changes in microviscosity (ηmicro), subtle pretransition dynamics were discernable for two monoclonal antibody formulations that correlate with findings by red-edge excitation shift (REES) experiments. This novel application of molecular rotor dyes offers a valuable and promising approach for streamlining the early formulation development process due to low material consumption and rapid analysis time in a 96-well plate format.
Keywords
Introduction
Evaluation of protein conformational and colloidal stability is critical during biopharmaceutical development. 1 During the formulation development process, a wide range of conditions must be screened; therefore, high-throughput methodologies are a necessity. Conformational stability is commonly assessed by identifying a protein melting temperature (Tm), which can be defined as the temperature at which half of the protein population is in the unfolded state. 2 A commonly used and widely accepted method of determining the Tm of biotherapeutics is differential scanning calorimetry (DSC). Despite its accuracy, the usefulness of DSC is limited by its limited dynamic range of concentration that can be tested, low throughput, and high material consumption. The need for a more high-throughput method of conformational stability screening has been partially met by the introduction of differential scanning fluorimetry (DSF). This method involves the use of an extrinsic fluorescent dye as a reporter for protein unfolding and a multiwell fluorescence plate reader (e.g., real-time PCR instrument) to measure the change in fluorescence intensity as a function of temperature. 3 The most commonly used extrinsic fluorescent dye for DSF is SYPRO Orange. However, it is widely known that due to the physicochemical properties of SYPRO Orange as a polarity-sensitive dye, there is extensive background interference from surfactants that obscures the determination of a Tm and other characterization.4,5 Since many therapeutic protein and monoclonal antibody formulations contain surfactants as stabilizing agents, another extrinsic fluorescent dye is needed to use DSF to screen such formulations.
Recently, investigators have successfully evaluated the use of a molecular rotor dye, 4-(dicyanovinyl)julolidine (DCVJ), for thermal stability screening of surfactant-containing formulations by DSF. 6 Molecular rotors are a novel class of fluorescent molecules that are characterized by an ability to undergo intramolecular rotation about their electron donor–acceptor bond when in the excited state. 7 When a molecular rotor’s intramolecular rotation is restricted by high viscosity or steric hindrance, its quantum yield increases. Since DCVJ is a viscosity-dependent dye, it can be used in place of SYPRO Orange in DSF measurements of surfactant-containing formulations. 6 While the work by Menzen and Friess (2013) 6 clearly demonstrates the utility of measuring the conformational stability of protein formulations in a 96-well plate format using DSF with a molecular rotor dye, DCVJ may not be suitable for use with low protein concentrations.
Another type of stability that concerns formulation scientists is colloidal stability. Colloidal stability refers to the two-body interaction of protein molecules, 1 that is, the propensity for protein–protein interactions. Assessment of the colloidal stability of a protein formulation provides insight into its aggregation propensity, which may in turn affect biopharmaceutical stability. Colloidal stability is commonly evaluated by measuring the second virial coefficient (B22) 1 or the diffusion interaction parameter (kD). 8 Some of the methods currently employed by the biopharmaceutical industry to measure protein–protein interactions include static light scattering (SLS), 1 dynamic light scattering (DLS) 8 , self-interaction chromatography (SIC), 9 and analytical ultracentrifugation (AUC). 10 Considering that the fluorescence intensity of molecular rotor dyes is dependent on the microviscosity of the solution, 11 we hypothesized that molecular rotors might also be used to characterize the colloidal stability of formulations through detection of protein–protein interactions.
An additional type of stability that is relevant in this context is related to protein flexibility. 12 The flexible nature of proteins in solution is believed to contribute to properties of the protein such as its potency and stability. From a stability perspective, increased protein flexibility can lead to increased propensity for aggregation 13 and fragmentation. 14 Protein flexibility can be dependent on solution properties such as pH and excipients.15,16 Therefore, the ability to screen for formulation conditions that can modulate the mobility and flexibility of the protein in solution in a high-throughput fashion is extremely valuable.
In this work, we examined the use of the fluorescent molecular rotor dye, 4-(4-(dimethylamino)styryl)-N-methylpyridinium iodide (DASPMI) for use with DSF in a 96-well plate format. This study demonstrated that DSF with DASPMI is a powerful method that, in a single assay, assesses thermal stability, evaluates protein colloidal stability, and detects subtle structural pretransition dynamics previously only distinguishable by red-edge excitation shift (REES) experiments. An IgG1 was used in this study to establish proof of concept for the novel use of DASPMI. We put forth that implementation of this screening methodology using the molecular rotor dye DASPMI is a promising methodology particularly useful for early stages of formulation development of biologicals.
Materials and Methods
Materials
IgG1 monoclonal antibody was obtained from bulk drug substance manufactured at Boehringer Ingelheim (Fremont, CA). The monoclonal antibody (mAb1) was formulated in two different formulations designated as Formulation A and Formulation B, both containing 0.04% (w/v) Tween 80. The 4-(4-(dimethylamino)styryl)-N-methylpyridinium iodide (DASPMI; excitation/emission wavelengths, 475 nm/606 nm) and 5000× SYPRO Orange were purchased from Life Technologies (Eugene, OR). Stock solutions of DASPMI were prepared in methanol.
Methods
Concentration determination
Protein and DASPMI concentrations were measured using a Varian Solo VPE (C-Technologies, Bridgewater, NJ) spectrophotometer. For protein samples, absorption was measured at 280 nm with dual-wavelength scatter correction at 320 and 350 nm. Stock DASPMI solutions were prepared in methanol, and absorption was measured at 475 nm with a molar extinction coefficient of 43,600 cm−1 M−1.
Differential scanning fluorimetry (DSF)
DASPMI stock and SYPRO Orange stock were diluted in Milli-Q water to create working solutions of 200 µM and 50×, respectively. mAb1 Formulation A and mAb1 Formulation B stocks were diluted with their respective buffers as needed to achieve the desired working concentrations. Then, 90 µL of protein solution or non-protein-containing buffer of the same composition and DASPMI concentration were pipetted into the wells of Hard-Shell 96-Well Real-Time PCR Plates (Bio-Rad Laboratories, Hercules, CA), followed by 10 µL of dye working solution, for a final well volume of 100 µL and final dye concentration of 20 µM DASPMI or 5× SYPRO. A range of DASPMI concentrations were evaluated during method development, and the optimal concentration was determined to be 20 µM. Well contents were mixed by aspiration and expelling with a pipet. PCR plates were sealed with Microseal B Adhesive Sealer (Bio-Rad Laboratories) and centrifuged at approximately 1562g for 4 min. A 7900 HT Sequence Detection System (Applied Biosystems, Life Technologies, Carlsbad, CA) was used to heat the samples from 20 °C to 95 °C with a ramp rate of 1%. Fluorescence intensity was quantified using SDS 2.4 (Life Technologies) with argon fixed excitation at 488 nm and ROX emission at 600–630 nm. Raw data from SDS 2.4 was exported to Microsoft Excel, where each scan was normalized, processed, and averaged. Data normalization was performed by calculating the ratio of the protein sample scans to the buffer scans. Normalized data were then exported to GRAMS/AI version 9.1 (Thermo Fisher Scientific, Waltham, MA) and smoothed using a binomial function with 11 points. The apparent unfolding temperatures (Tm-app) were determined by derivative analysis using the Savitky–Golay algorithm (fist-order polynomial with 41 points). The Tm-app is the average of triplicate measurements with the standard deviation reported.
Differential scanning calorimetry (DSC)
A 200 µM working solution of DASPMI was prepared in the same manner as for DSF. One 2 mL 96 Well Deep Well Plate (TA Instruments, New Castle, DE; Part 602071.001) was designated as a sample plate, and another was designated as a reference plate. Wells of the sample plate were filled with 900 µL of protein solution at 1 mg/mL, and the corresponding wells of the reference plate were filled with 900 µL of placebo buffer. One hundred microliters of 200 µM DASPMI were added to samples and placebos and mixed by aspiration and expelling, for a final well volume of 1 mL and final dye concentration of 20 µM. Deep well plates were sealed with sealing mats (TA Instruments, Part 602072.001) and centrifuged at approximately 1562g for 4 min. A Nano DSC (TA Instruments) was used to obtain DSC thermograms from 25 °C to 100 °C with a heating rate of 1 °C/min. Placebo thermograms were subtracted from the sample thermograms using NanoAnalyze (TA Instruments). Subtracted thermograms were analyzed after baseline correction and fit to a two-state scaled model to obtain a Tm.
Diffusion Interaction Parameter (kD) Determination by Dynamic Light Scattering
The kD for mAb1 was determined in two different formulations (mAb1 Formulations A and B). Samples in each formulation were diluted to 20, 15, 10, 7.5, and 2.5 mg/mL in respective formulation buffers. Diffusion coefficients were determined using a Zetasizer Nano (Malvern Instruments Ltd., Worcester, UK) at a temperature of 20 °C. Samples of 120 µL were pipetted into a 3 mm Quartz SUPRASIL Precision Cell (Hellma Analytics, Müllheim, Germany). Triplicate samples were prepared for each concentration and formulation. The kD was obtained from the measurement of the diffusion coefficient by using the relationship below (eq 1).8,17
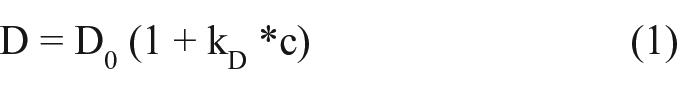
where kD is the diffusion interaction parameter, D is the diffusion coefficient, and D0 is the self-diffusion coefficient, which is the value of D (c → 0). 17 The kD was determined by linear regression of the plot of diffusion coefficient with concentration.
Colloidal Stability Screening Using DASPMI
A stock solution of DASPMI was diluted in Milli-Q water to create a working solution of 1000 µM. A range of protein concentrations were prepared, from 20 to 2.5 mg/mL for each formulation, mAb1 Formulation A and mAb1 Formulation B. Then, 90 µL of protein solution or non-protein-containing placebo buffer was pipetted into the wells of 96-Well PCR Plates (Applied Biosystems), followed by 10 µL of dye working solution, for a final well volume of 100 µL and final dye concentration of 100 µM DASPMI. Well contents were mixed by aspiration and expelling with a pipet. PCR plates were sealed with Microseal B Adhesive Sealer (Bio-Rad Laboratories) and centrifuged at approximately 1500g for 4 min. A 7900 HT Sequence Detection System (Applied Biosystems) and SDS 2.4 (Life Technologies) were used to measure the fluorescence intensity at 20 °C. Raw data from SDS 2.4 were exported to Microsoft Excel where triplicate measurements were normalized in the same manner as for DSF. The average normalized fluorescence intensity and standard deviations for the triplicate measurements are reported.
Red-Edge Excitation Shift
mAb1 Formulation A, mAb1 Formulation B, and their corresponding placebos were analyzed by red-edge excitation shift. Samples of 3 mL were pipetted into 10 mm Closed Cap Quartz Fluorimeter Cells (Starna Cells, Inc., Atascadero, CA). The samples were mixed by a stir bar for the duration of the experiment. A FluoroMax-3 (Horiba Jobin Yvon, Edison, NJ) and FluorEssence (Horiba Jobin Yvon) were used to generate fluorescence spectra at a set temperature with excitation wavelengths at 292, 296, 300, 304, and 304 nm, and an excitation slit of 2.5 nm. Emission wavelengths were measured from 300 to 400 nm with an emission slit of 3 nm. Spectra were generated for the sample starting at 15 °C and ending at 75 °C, in increments of 5 °C. Data were exported to Microsoft Excel where the placebo was subtracted from the sample. The wavelength of maximum emission was determined by identifying the center of spectral mass (CSM) (between 320 and 380 nm). The CSM was calculated according to the following formula:

where CSM is the center of spectral mass (295–385 nm), Fi is the fluoresence intensity, and λi is the wavelength.
Results and Discussion
Comparison of SYPRO Orange and DASPMI DSF for Use in Screening Surfactant-Containing Formulations
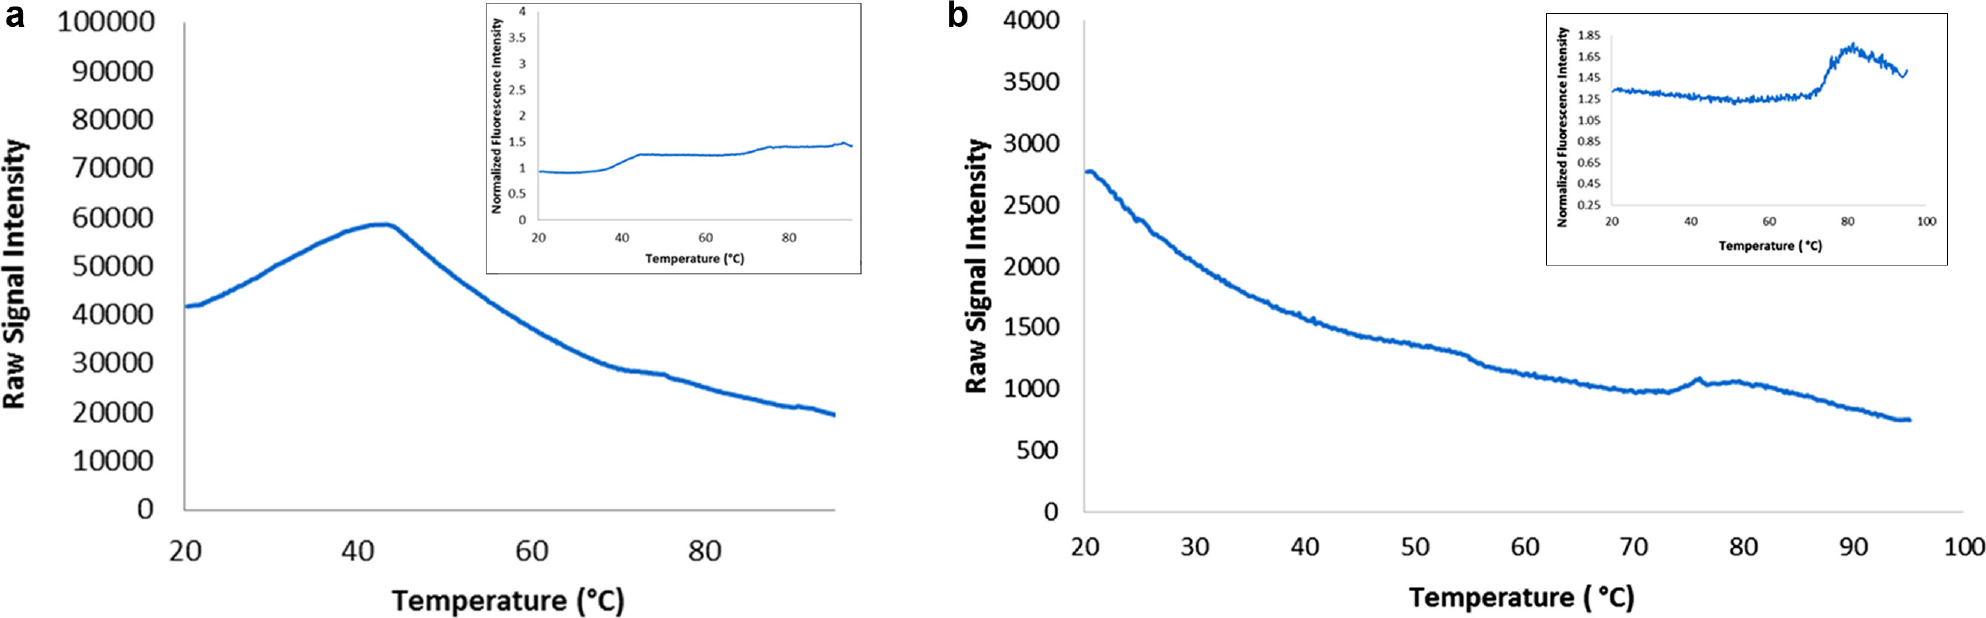
Due to the polar sensitivity of SYPRO Orange, the measurement in the presence of a surfactant is expected to lead to extensive background interference from Tween 80, since this phenomenon has been documented by other investigators.4–6 We confirmed that at the typical concentration of 5×, SYPRO Orange is not suitable for use for DSF measurements of surfactant-containing formulations. This can be seen in the SYPRO Orange DSF profile of mAb1 at 0.5 mg/mL in a formulation that contains 0.04% (w/v) Tween 80 ( Fig. 1a ). There is no clear transition from which an unfolding temperature can be obtained. On the other hand, under the same conditions, an easily discernable transition is observed in a DASPMI DSF profile ( Fig. 1b ).
(
Concentrations of 100 µM DASPMI and 5×, 50×, and 100× SYPRO Orange were also evaluated to compare the performance of the dyes in formulations at or above pharmaceutically relevant surfactant concentrations (0.04%–0.2% w/v). We found that adequately high concentrations of SYPRO Orange are able to overcome background interference up to a certain Tween 80 concentration, whereas 100 µM DASPMI resulted in identifiable melting transitions regardless of surfactant concentration (data not shown). Although increasing the concentration of SYPRO Orange is a potential option for screening surfactant-containing formulations, it is not preferable, since artifacts due to dye–protein interactions are of concern for these measurements. In addition, SYPRO Orange is provided at a fixed concentration in DMSO; therefore, measured samples will have higher concentrations of DMSO. Increased amounts of DMSO might also result in experimental artifacts.
Demonstration of the Utility of DASPMI for Conformational Stability Screening in the Presence of Surfactants
Nonionic surfactants such as Tween 20 and Tween 80 have been used extensively in protein formulations to prevent unwanted events such as freeze–thaw and agitation-induced degradation and protein adsorption to surfaces.18–20 On the other hand, there are known destabilizing effects of nonionic surfactants that decrease protein stability. 21 Therefore, the ability to screen for conformational stability in the presence of a range of surfactant concentrations in a high-throughput manner is important for the formulation development of protein therapeutics.
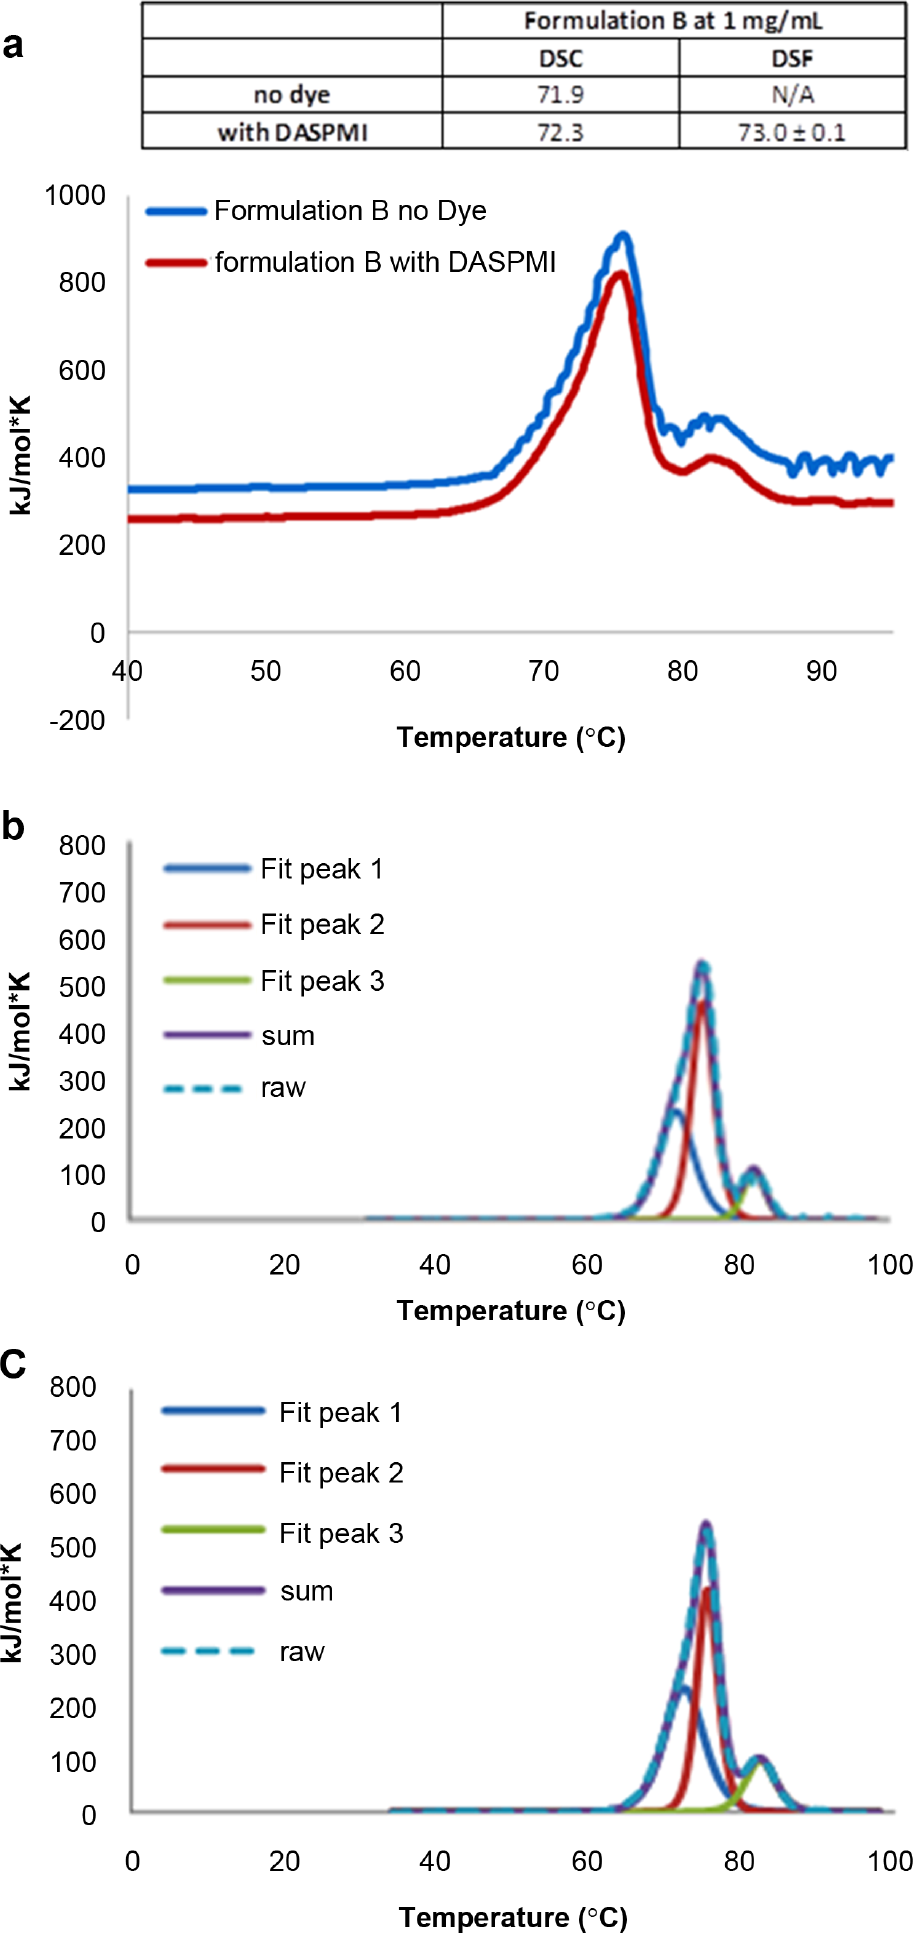
In order to demonstrate that DSF with DASPMI can be used for conformational stability screening of a monoclonal antibody in a surfactant-containing formulation, we evaluated the melting temperatures of an IgG1 (mAb1, MW ~ 150 kDa). The fluorescence unfolding profiles using DASPMI for mAb1 were reproducible at protein concentrations as low as 0.5 mg/mL ( Fig. 2 ). Variability of the DSF assay is represented as standard deviation (±) of triplicate measurements, as shown in the inset table of Figure 3a . Melting temperatures obtained from DSF with DASPMI were in very close agreement with those obtained from DSC ( Fig. 3a ). The samples were analyzed by DSC with and without dye (single measurements) in order to ensure that DASPMI does not interact and alter the unfolding temperature of the monoclonal antibody. Furthermore, the presence of DASPMI does not affect the profile of the DSC thermogram, as the unfolding profiles for each of the domains of the mAb appear very similar with and without the dye ( Fig. 3b , c ). This information, together, provides confidence that the presence of DASPMI does not adversely impact the protein of interest.
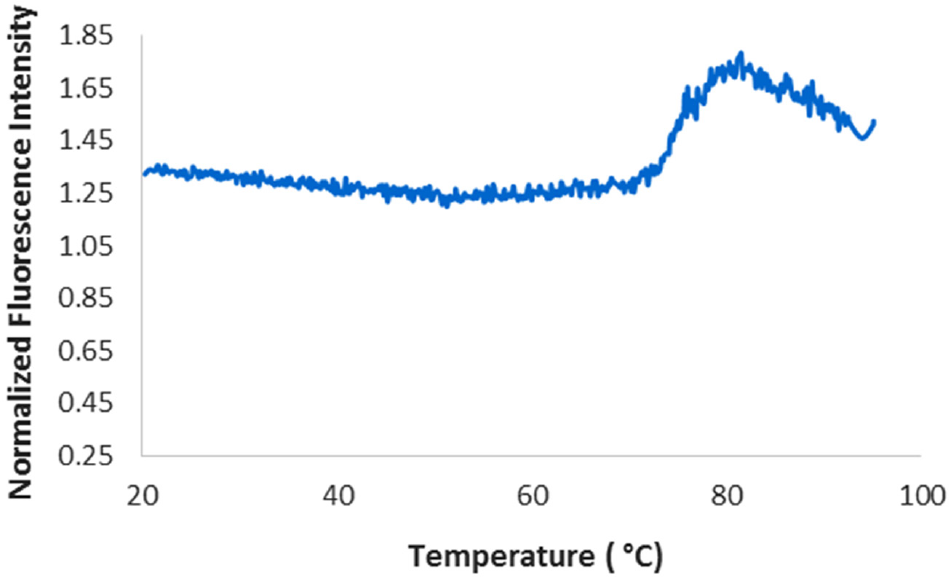
Normalized differential scanning fluorescence thermogram of mAb1 Formulation B at 0.5 mg/mL with 20 µM DASPMI. (Plots are the average of triplicate measurements.)
(
Menzen and Friess (2013) 6 demonstrated that, by using the molecular rotor fluorescence dye DCVJ in a DSF experiment, it is possible to determine the protein unfolding temperatures for formulations containing surfactants. However, the lowest protein concentration for which they were able to reliably detect a Tm was 4 mg/mL. In this study, we have shown that when using DASPMI as the reporter dye, thermal unfolding temperatures can be obtained reproducibly for an IgG1 at concentrations as low as 0.5 mg/mL. It is clear that molecular rotor fluorescent dyes show promise as a high-throughput methodology for conformational stability screening of surfactant-containing protein formulations for conformational stability.
Evaluation of the Molecular Rotor Dye (DASPMI) for High-Throughput Colloidal Stability Screening
Another aspect of protein stability that is important to consider early in development is colloidal stability. In contrast to conformational stability, which concerns structural changes as a function of temperature, colloidal stability concerns the propensity for protein–protein interactions in the native conformation. Colloidal stability is commonly assessed by measuring the second virial coefficient (B22)1,9 or the diffusion interaction parameter (kD).8,17
There have been many successful applications of molecular rotor dyes as a measure of the microvicosity (ηmicro) for numerous biological systems. 11 Briefly, molecular rotor dyes serve as a reporter of the ηmicro of a solution where the dyes exhibits an increase in fluorescence emission intensity with an increase in ηmicro.23,24 The fluorescence quantum yield of the molecular rotor dye is proportional to the radiative relaxation rate relative to the total relaxation rate, where the total relaxation rate is dominated by the reorientation relaxation rate (kor).11,23 Therefore, the quantum yield (ΦF) is approximated by eq 3:
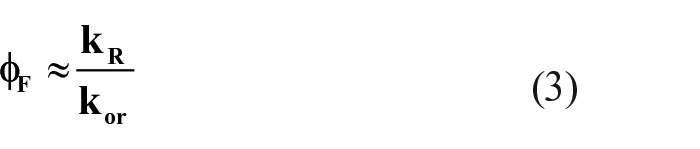
where kR is the radiative relaxation rate and kor is the intramolecular reorientation rate. kor is dependent on the rotational diffusion (Dr) such that kor ∝ Dr.11,22,23 Therefore, as the rotational diffusivity of the dye is decreased as a result of protein–protein interactions, the intramolecular reorientation rate decreases, thereby leading to an increase in the fluorescence quantum yield.
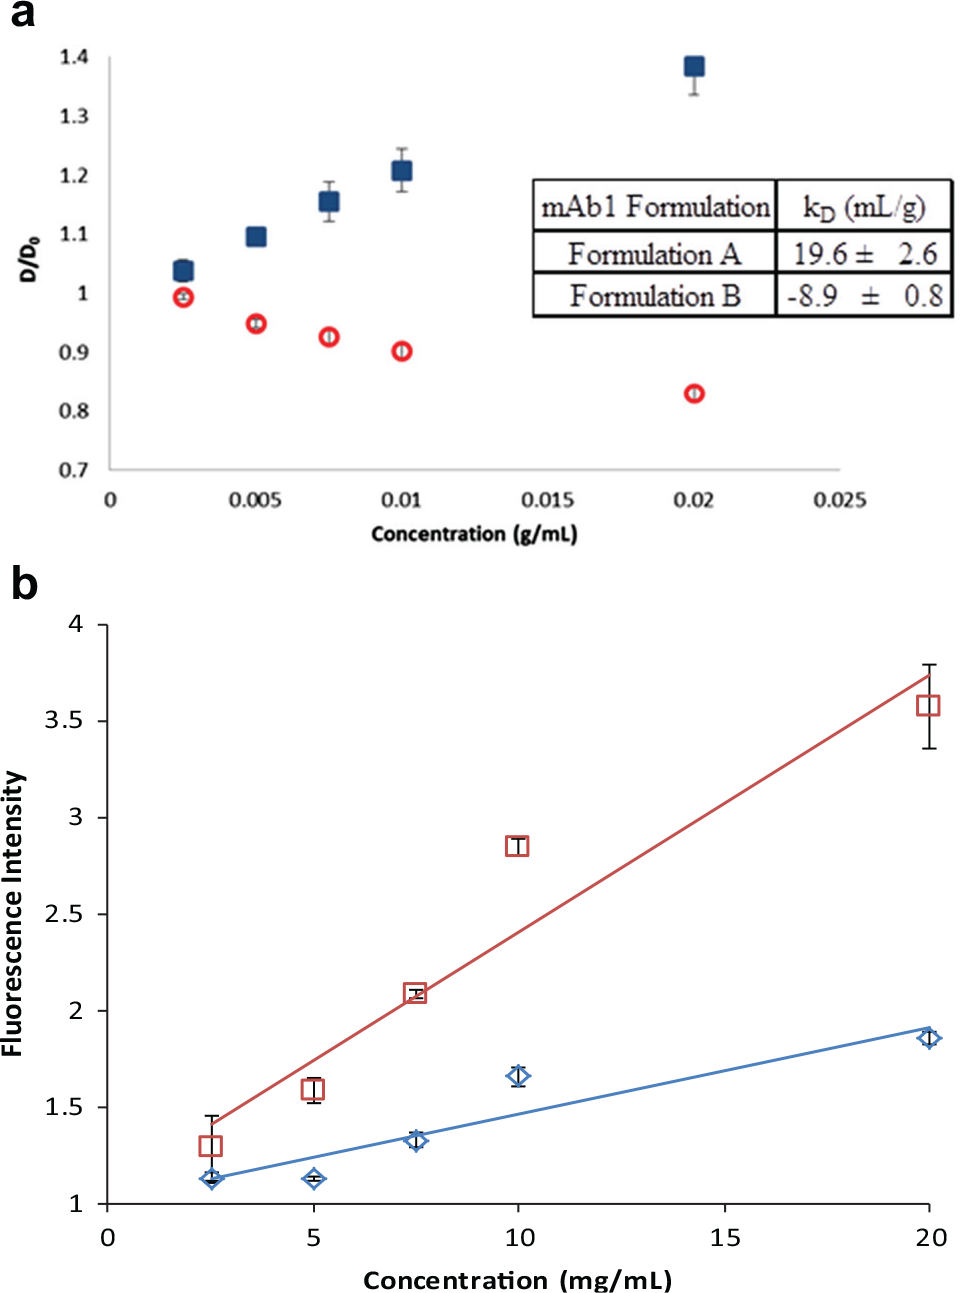
We explored a novel application that leverages the sensitivity of molecular rotor dyes to the microviscosity of the solution to evaluate the colloidal stability of protein formulations in a high-throughput fashion using DSF with a molecular rotor dye, DASPMI. During formulation development for a mAb, two formulations were found to exhibit distinct differences in protein–protein interactions, as evidenced by differing diafiltration fluxes observed during downstream process development. Since the fluorescence intensity of DASPMI is dependent on the rotational diffusivity of the dye molecule, we hypothesized that DASPMI could be used as reporter for protein–protein interactions via detection of differences in microviscosity. To investigate this novel application of molecular rotor dyes, the fluorescence intensity of DASPMI was measured for Formulations A and B at 20 °C as a function of mAb concentration (2.5–20 mg/mL). Upon plotting the normalized fluorescence intensity against concentration, we see that Formulation B exhibits a greater rate of increase in fluorescence intensity than Formulation A ( Fig. 4a ). An increase in fluorescence intensity indicates decreased mobility of the dye molecule, which suggests that with increasing mAb concentration, there is a more rigid microenvironment in Formulation B than in Formulation A. This likely suggests a greater amount of protein–protein interactions in Formulation B.
(
To confirm this result, we measured the diffusion interaction parameter (kD) by dynamic light scattering to demonstrate the colloidal stability differences between two protein formulations (mAb1 Formulations A and B). By preparing dilutions of mAb1 concentration between 2.5 and 20 mg/mL in the respective formulations, the diffusion coefficient of mAb1 was plotted as a function of protein concentration to determine the kD. As can be seen in Figure 4b , there appear to be distinct differences in the propensity for protein–protein interactions as determined by the measured kD. Formulation A shows an increase in the diffusion coefficient with increasing protein concentration, which implies net repulsions between protein molecules. On the contrary, Formulation B exhibits a net attraction between molecules as the diffusion coefficient decreases with increasing concentration.
The results from the DSF experiment with DASPMI are consistent with results from DLS, where Formulation B shows a greater amount of protein–protein interactions than Formulation A. These results are also consistent observations during downstream development for these formulations where Formulation A exhibited a greater flux during diafiltration than Formulation B (internal communication). Although high-throughput and automated DLS exists, an advantage of a DSF-type experiment using DASPMI is that it affords an elegant and convenient way of evaluating colloidal stability in tandem with conformational stability, as colloidal stability data can be extracted from a single DSF experiment without having to perform a separate assay.
Use of a Molecular Rotor Dye (DASPMI) for Detection of Subtle Pretransition Dynamics in Protein Structure in a High-Throughput Screening Assay
The evaluation and prediction of protein stability typically involves understanding the conformational (e.g., Tm) and colloidal (i.e., B22, kD) stability. However, another important aspect of protein stability is pretransition dynamics.12,15,16 This refers to the conformational flexibility of a protein. These pretransition dynamics may be not be visible by DSC since they are extremely subtle and do not usually result in a detectable change in heat capacity. This subtle yet valuable information regarding conformational flexibility can be ascertained by H-D exchange methods using nuclear magnetic resonance (NMR) 24 and Fourier transform infrared (FT-IR) spectroscopy, 25 and REES fluorescence experiments.15,26 In this section, we highlight data from the thermal unfolding profiles obtained by DSF of two distinctly different formulations (mAb1 Formulations A and B). In the DSF unfolding profiles, we observe reproducible pretransition dynamics that matches the approximate pretransition dynamics temperatures that are measured by REES. REES experiments can be laborious and time-consuming and are thus not typically done during formulation screening. We therefore proposed that DASPMI can be used in a DSF thermal unfolding experiment to screen for pretransiton dynamics of protein formulations, thereby providing information regarding protein conformational flexibility at an early stage of development.
There are several comprehensive publications on the background and theory of REES.26–28 Briefly, during a fluorescence experiment, the fluorescence emission is independent of the excitation wavelength (if within the absorbance band).27,28 The majority of protein has a solvation envelope with the dipoles ordered; however, there is a subpopulation that has an unordered solvation envelope. This subpopulation of molecules is preferentially excited by photons of lower energy (i.e., at the red edge of the excitation spectrum).27,28 A change in the viscosity of the fluorophore’s solvent environment leads to a change in the red-edge emission spectrum. As a result, the peak position of the red-edge emission spectrum will be impacted in environments of differing viscosity, thus providing information regarding conformational flexibility of the protein. 15
REES-temperature study
REES is a sensitive methodology to detect subtle changes in protein structure; therefore, we evaluated the REES-temperature profile for potential differences between Formulations A and B. Plotting the difference between CSM308nm and CSM292nm as a function of temperature provides information regarding the extent of a red shift in the fluorescence spectra, and hence information regarding molecular flexibility as a function of temperature. A decrease in ΔCSM308–292nm is observed, which corresponds to a temperature range in which the solvent relaxation rate is greater than the rate for fluorescence decay. When the flexibility/mobility of the protein molecule increases, there is an expected decrease in the ΔCSM308–292nm. In the case of mAb1 Formulation A, a marked decrease of ΔCSM308–292nm is observed around 45 °C, whereas for Formulation B, there is a less dramatic, yet discernable transition around 60 °C ( Fig. 5 ). These results suggest that mAb1 in Formulation B has more structural rigidity as a function of temperature than Formulation A.
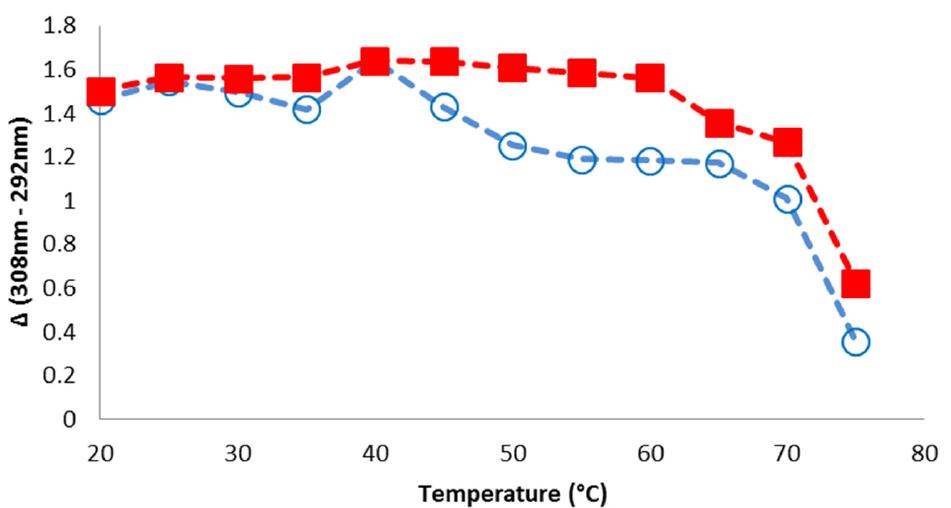
REES-temperature profile for mAb1 Formulations A and B. Formulation A, blue, open circles; Formulation B, red, closed squares.
Connection between DSF profile with DASPMI and REES experiments
In the REES-temperature experiment, the fluorescence peak position is dependent on the timescale for solvent relaxation. This method capitalizes on the differing rates of solvent relaxation around the excited-state fluorophore in different conformational states in order to differentiate subtle changes in protein structure. Similarly, the DSF thermal unfolding profile using DASPMI is dependent on the rotational diffusivity of the dye, which impacts the rate of reorientation and thus is a reporter of the microviscosity of the solution. The fluorescence intensity of DASPMI in a DSF thermal profile and the fluorescence peak position of a REES-temperature study both stem from the impact of local solvent viscosity around the chromophore of the protein. Therefore, it seems conceptually reasonable that local changes and flexibility differences might be observable in the DASPMI DSF thermal profile.
Observations of pretransition dynamics of DASPMI DSF thermal profile
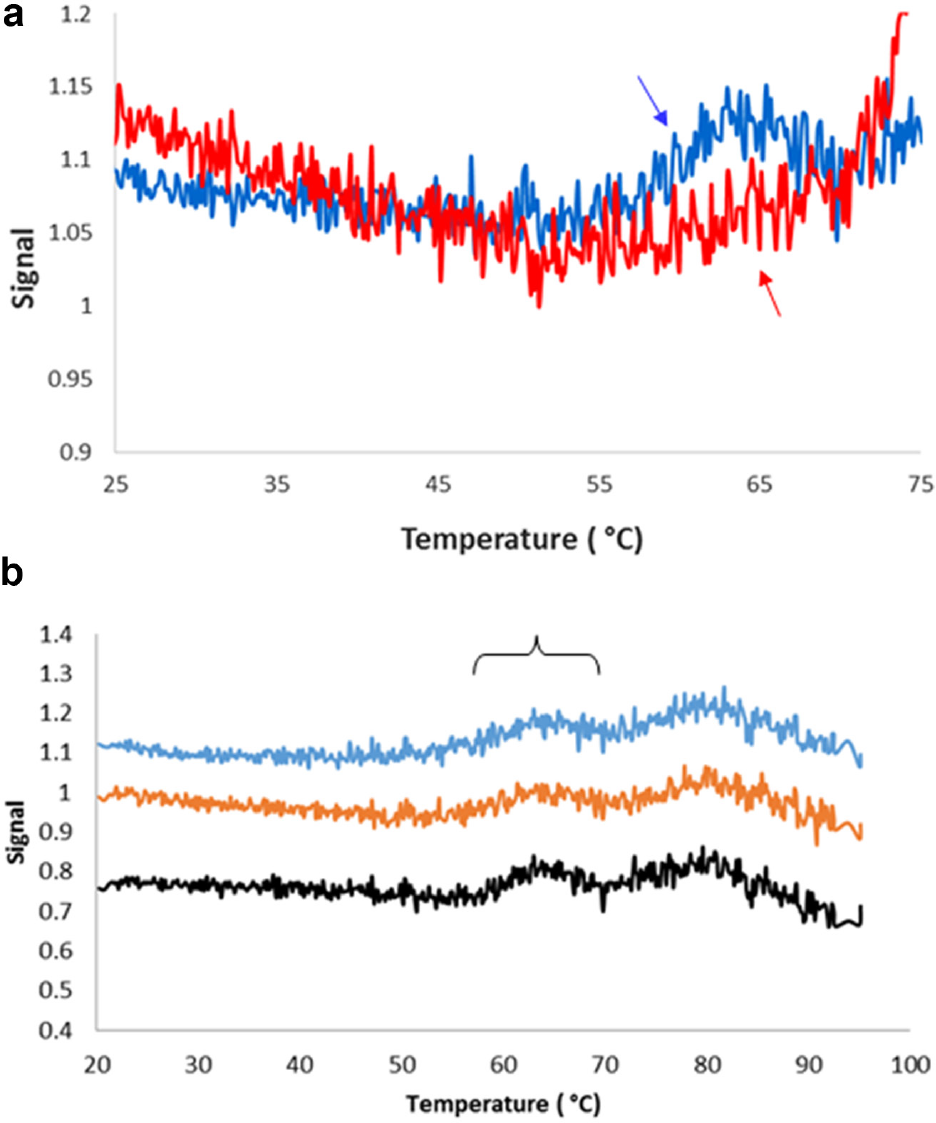
Close evaluation of the DASPMI DSF thermal profile of both mAb1 Formulation A and mAb1 Formulation B at 0.5 mg/mL in the temperature range between 25ºC and 75ºC revealed subtle inflections in the thermal profile. Detectable changes were observed for mAb1 Formulation A around 55ºC, whereas mAb1 Formulation B exhibits discernable changes around 60 °C ( Fig. 6a ). Figure 6b shows a stacked plot of replicate samples of mAb1 Formulation A in order to highlight the consistency of these subtle transitions. As expected, due to the subtle nature of these transitions, we did not observe any corresponding pretransition dynamics in the DSC thermograms. These temperature ranges for the pretransition dynamics are consistent with the pretransition dynamics observed in the REES-temperature study for the corresponding formulations of mAb 1.
(
The data presented here highlight the use of DASPMI DSF to observe subtle thermal pretransition dynamics that correspond to those observed by a REES-temperature experiment. This application allows the detection of subtle protein pretransition dynamics as a function of temperature in a low-volume and high-throughput manner at a very early stage of formulation development.
Our findings suggest that DASPMI can be used with DSF to broadly characterize the protein stability of surfactant-containing formulations in a high-throughput format. Information regarding conformational and colloidal stability, as well as pretransition dynamics, can be obtained from a single experimental setup using a 96-well plate format. Multiple conditions can be screened using a limited amount of material in a short period of time, providing potentially predictive information impacting long-term stability.
Footnotes
Acknowledgements
The authors would like to thank the Boehringer Ingelheim project Independent Development Program for supporting the work in this article. We would also like to thank Dr. Jonathan Coffman for his valuable review of the article, as well as his support of the project.
Declaration of Conflicting Interests
The authors declared no potential conflicts of interest with respect to the research, authorship, and/or publication of this article.
Funding
The authors received no financial support for the research, authorship, and/or publication of this article.