
Abstract
RNA activation (RNAa) is a mechanism of positive gene expression regulation mediated by small-activating RNAs (saRNAs), which target gene promoters and have been used as tools to manipulate gene expression. Studies have shown that RNAa is associated with epigenetic modifications at promoter regions; however, it is unclear whether these modifications are the cause or a consequence of RNAa. In this study, we examined changes in nucleosome repositioning and the involvement of RNA polymerase II (RNAPII) in this process. We screened saRNAs for OCT4 (POU5F1), SOX2, and NANOG, and identified several novel saRNAs. We found that nucleosome positioning was altered after saRNA treatment and that the formation of nucleosome-depleted regions (NDRs) contributed to RNAa at sites of RNAPII binding, such as the TATA box, CpG islands (CGIs), proximal enhancers, and proximal promoters. Moreover, RNAPII appeared to be bound specifically to NDRs. These results suggested that changes in nucleosome positions resulted from RNAa. We thus propose a hypothesis that targeting promoter regions using exogenous saRNAs can induce the formation of NDRs, exposing regulatory binding sites to recruit RNAPII, a key component of preinitiation complex, and leading to increased initiation of transcription.
Introduction
Small RNAs form complexes with argonautes and play important roles in cellular processes, such as cell differentiation, growth/proliferation, migration, apoptosis/death, metabolism, and defense, via RNA interference (RNAi). Small RNAs that target promoter sequences have also been shown to activate gene expression at the transcriptional level via a mechanism known as RNA activation (RNAa); these small RNAs are termed small-activating RNAs (saRNAs).1,2 In RNAa, epigenetic modifications have been shown to be altered at promoter regions, concurrent with transcriptional activation.1–3 However, it is unclear whether such changes in chromatin are a cause or consequence of RNAa. 4 Further studies have shown that RNAa is associated with the recruitment of RNA polymerase II (RNAPII) and argonaute2 (AGO2) protein to the saRNA target site. Moreover, heterogeneous nuclear ribonucleoprotein A2/B1 (hnRNPA2/B1), a component of chromatin remodeling complexes, 5 interacts with saRNA in vivo and in vitro and is required for RNAa. 6 Additionally, Portnoy et al. suggested that guide RNAs facilitate the localization of AGO proteins to their target DNAs, thereby mediating the function of AGO proteins as a recruiting platform to attract histone-modifying activities and leading to an open chromatin structure and active transcription. 4 However, no studies have fully elucidated the characteristics of the open chromatin structure, and it is unclear how transcription is activated via this process. Because the epigenetic mechanisms of RNAa are not well understood, saRNAs have not been used as widely as small interfering RNA (siRNA) and other types of RNAi.
In the process of RNAPII binding to RNAa, three core reprogramming genes (POU5F1 [OCT4], SOX2, and NANOG) have been identified. The promoters of these genes contain regulatory elements, such as RNAPII binding sites (i.e., TATA boxes and CpG islands [CGIs]), 7 as well as RNAPII preparing region proximal promoters. Indeed, the SOX2 promoter contains a TATA box and CGI, while OCT4 and NANOG contain canonical proximal promoters.8,9 Recent studies have identified several genes that contain TATA boxes and CGIs activated by RNAa, including CDKN1A, CDH1, PAWR, NKX3-1, WT1, PR, VEGFA, MVP, PTEN, and APC;2,3,10,11 however, few reports have described saRNA-activated genes that do not contain either a CGI or TATA box. Based on these studies, promoters can be classified as either type I, which contain a CGI and TATA box (i.e., SOX2), or type II, which do not contain a CGI or TATA box (i.e., OCT4 and NANOG). Comparisons of these two types of promoters could help determine the effects of RNAPII on RNAa.
In this study, we examined whether saRNA binding its target DNA template could induce chromatin remodeling and ultimately affect nucleosome positioning through the formation of an open chromatin structure, in which RNAPII and other transcriptional factors could bind and initiate transcription. Our results provide important insights into the functions of exogenous environmental factors in nucleosome positioning and transcriptional activation.
Materials and Methods
Design and Synthesis of saRNAs
The promoter sequences of OCT4, SOX2, and NANOG were retrieved from the Ensembl genome database (www.ensembl.org). Transcriptional start site (TSS) and TATA boxes were analyzed with the Eukaryotic Promoter Database (http://epd.vital-it.ch/master_search.php). CpG islands were identified using the CGI search engine (uscnorris.com/cpgislands2/cpg.aspx) and EMBOSS Cpgplot (ebi.ac.uk/Tools/seqstats/emboss_cpgplot/). The basic principles of saRNA design were based on the methods by Li et al.
1
and avoid targeting CGIs and TATA boxes; saRNAs were chemically synthesized by GenePharma (Shanghai, China). A mismatched 21 nt double-stranded RNA (dsRNA) was designed as a negative control and was verified to have no genomic target by NCBI BLAST (
Cell Culture and saRNA Transfection
Human lung diploid fibroblast (KMB17 cells, Institute of Medical Biology, Chinese Academy of Medical Sciences) were grown in minimum essential medium (MEM) supplemented with 10% (v/v) fetal bovine serum (FBS; Minhai Biotech, Beijing, China), 2 mM
Reverse Transcription PCR (RT-PCR) and Real-Time RT-PCR
Total RNA from transfected cells was extracted using the Trizol reagent (Invitrogen, Grand Island, NY), and RT was performed using the Reverse Transcription System (Promega, Madison, WI). Expression of the OCT4, SOX2, and NANOG genes was screened by RT-PCR using the primers shown in
SOX2 and NANOG: 95.0 °C for 3 min, followed by 39 cycles of 95.0 °C for 30 s, 49 °C for 30 s, and 72.0 °C for 45 s
OCT4: 95.0 °C for 3 min, followed by 39 cycles of 95.0 °C for 30 s, 56 °C for 30 s, and 72.0 °C for 45 s
Melt curve analysis was performed from 65 °C to 95 °C with 0.5 °C increments to evaluate primer specificity. The cellular glyceraldehyde 3-phosphate dehydrogenase (GAPDH) gene was used as an internal standard for measuring target gene expression levels. Relative mRNA expression levels of target genes were normalized to that of GAPDH mRNA and calculated by the 2–ΔΔCt method. The data were collected from two independent experiments, which contained three replicates. The data are shown as the mean ± standard deviation (SD) of the fold activation from the two independent experiments. The STDEVP function of Microsoft Excel was used to calculate the experimental SDs.
Western Blotting
Six days after transfection, cell lysates were denatured, separated by sodium dodecyl sulfate–polyacrylamide gel electrophoresis (SDS-PAGE), and blotted onto polyvinylidene difluoride (PVDF) membranes (Millipore, Billerica, MA). The membranes were blocked with 5% skim milk powder/PBS containing 0.05% Tween (PBST) for 2 h. Membranes were then incubated with anti-Oct4 (Proteintech#11263-1-AP; 1:500 dilution), anti-Sox2 (Proteintech#20118-1-AP; 1:500 dilution), anti-Nanog (Proteintech#14295-1-AP; 1:500 dilution), and anti-tubulin (Proteintech#66031-1-lg; 1:500 dilution) antibodies for 1 h at 4 °C. The membranes were washed with PBST and incubated with horseradish peroxidase (HRP)–conjugated secondary antibodies (1:2000). After a final wash, chemiluminescence reagent was added, and the membranes were scanned with a UVP ChemiDOC-IT imaging system (UVP, Upland, CA).
Cell Fractionation and Preparation of Nuclear Extracts
KMB17 cells were transduced with shRNA-carrying and negative control siRNA-carrying lentiviruses. Cell extracts were analyzed at 4 days posttransduction in chromatin immunoprecipitation (ChIP) assays using the Agarose ChIP Kit (Pierce, Rockford, IL), following the manufacturer’s recommended protocol. In order to avoid variation caused by the traditional method of sonication, we used the micrococcal nuclease (Pierce) to digest DNA from fibroblasts. To obtain single-digested nucleosomes, we incubated 0.25 μL of micrococcal nuclease (10 U/μL) with 6 × 10⁶ KMB17 cells at 37 °C for 15 min. Digestion with micrococcal nuclease before running experiments ensured that 200 bp DNA fragments (on average) were generated.
ChIP and ChIP-qPCR Experiments
Cellular lysates were diluted 1:10 in ChIP dilution buffer as recommended in protocol for the Agarose ChIP Kit. Chromatin solutions were incubated overnight at 4 °C with 10 µL of an anti-RNA polymerase II (Pierce) or an anti-histone H3 C-terminus (Millipore cat. 05-928) primary antibody, or 5 µL of normal rabbit IgG (Pierce) (negative control), with rotation. Immunocomplexes were precipitated with 20 µL of ChIP Grade Protein A/G Plus Agarose (Upstate Biotechnology, Lake Placid, NY) and eluted fragments not bound to the antibody and bound antibodies, respectively. Precipitated DNA was recovered by phenol extraction and used for PCR amplification to check for the enrichment of RNAPII or the C-terminus of histone H3 in gene promoter regions. qPCR was performed with purified DNA using the BioRad CFX96 Real-Time PCR detection system. Samples pulled down with IgG served as the negative control. Primers (listed in
Results
Screening of saRNAs Targeting OCT4, SOX2, and NANOG Promoters
To obtain saRNAs that could activate target genes, we designed three saRNAs for the SOX2 promoter: S134 and S227 were located upstream of the furthest TATA box, and S278 was located between the TATA box and CGI. To target the type II promoters, we designed four saRNAs for OCT4 (O302, O619, O134, O38, and O111) and three for NANOG (N35, N116, N185, and N80). O134 was located in the proximal enhancer of OCT4, O38 and N185 were located in the proximal promoters of OCT4 and NANOG, and the remainder were located upstream of the regulatory elements in each core promoter ( Fig. 1 ).
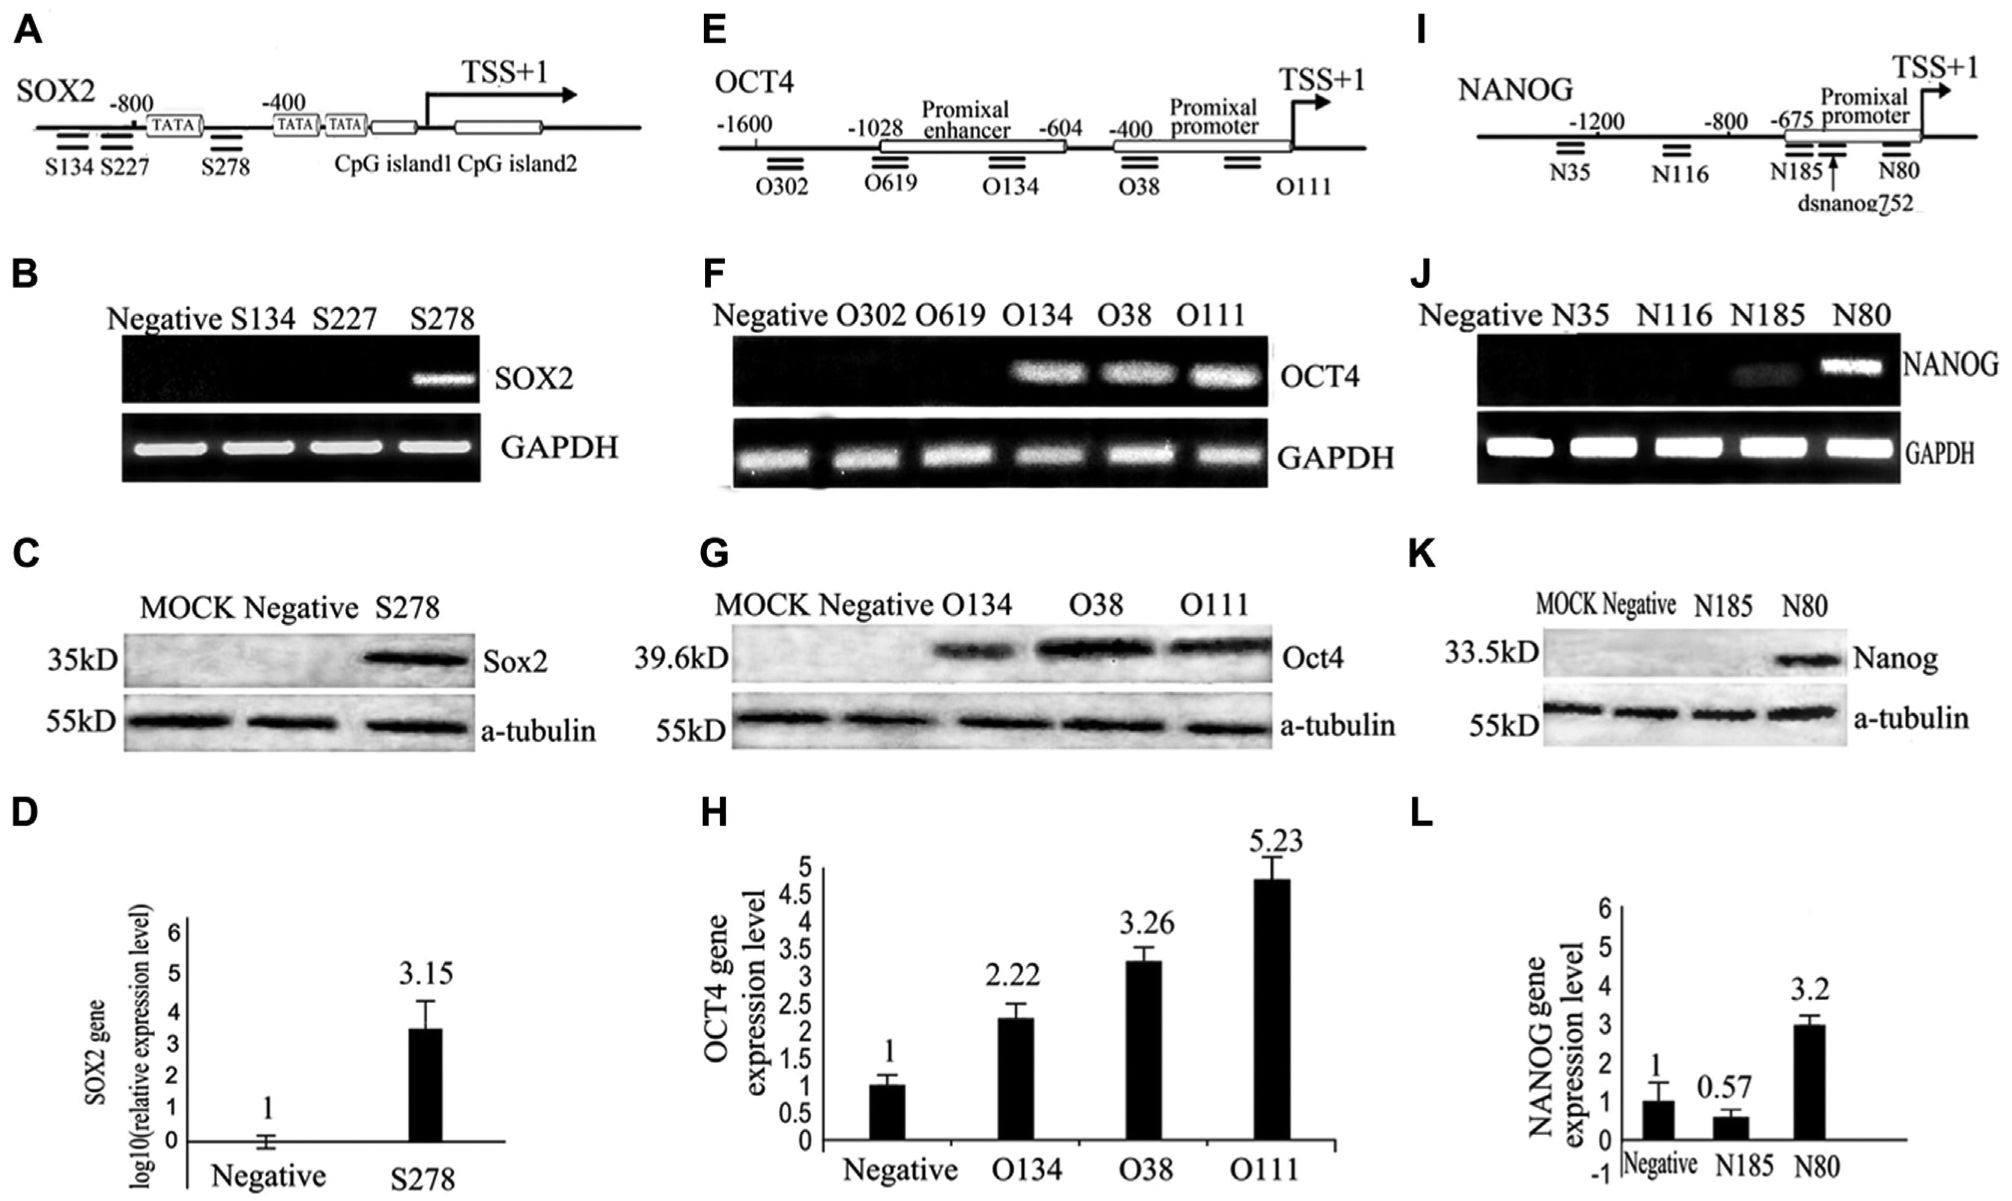
Screening of saRNAs for OCT4, NANOG, and SOX2. (
We screened for saRNAs targeting OCT4, SOX2, and NANOG genes by regular RT-PCR and confirmed the results by Western blotting and RT-qPCR in human fibroblasts transfected with saRNA for 96 h. The preliminary screening results showed that the mRNA and protein levels of OCT4 and SOX2 were altered by several saRNAs: S278 activated SOX2, while O134 and O38 activated OCT4 (
Fig. 1
). This is the first report of saRNAs for OCT4 and SOX2. Although the saRNA dsNanog752 has been reported to activate NANOG,
11
we also found that our designed dsRNA N185 activated NANOG, although this response was minor. All positive results were confirmed by gel extraction and sequencing (
Activation Efficiency of saRNA Was Associated with Regulatory Elements
To study whether the presence of regulatory elements such as the TATA box and CGI in the promoter region affected RNAa, we compared type I and type II promoters to determine their activation efficiency. SOX2 had a type I promoter in which S278 targeted a site between the TATA box and CGI ( Fig. 1A–D ). Indeed, we found that S278 targeted the SOX2 type I promoter and produced approximately 1000-fold activation ( Fig. 1D ); in comparison, activation of genes having a type II promoter, including OCT4 and NANOG, by their respective saRNAs yielded less than 10-fold increased activation ( Fig. 1H , L ). While the possibility that markedly reduced basal SOX2 transcription leads to a high level of activated expression could not be excluded, the tremendous expression difference observed suggested that the TATA box and CGI on the promoter facilitated efficient saRNA-mediated activation of gene expression.
Furthermore, we examined how the obtained saRNAs associated with regulatory elements on type II promoters. OCT4 and NANOG have type II promoters and were activated by saRNAs targeting the proximal promoter and enhancer. At the OCT4 promoter, O38, which targeted the proximal promoter, provided 3.26-fold activation, and O134, which targeted the enhancer, provided 2.22-fold activation in comparison to the mismatched, negative control dsRNA ( Fig. 1H ). To confirm that dsRNA targeted the proximal promoter to activate transcription, we designed dsRNAs O111 (positions −135 to −114; Fig. 1E ) and N80 (positions −109 to −88; Fig. 1I ), both of which targeted the proximal promoter and were closer to their respective TSSs than O38 and N185. Indeed, O111 provided 5.23-fold activation of OCT4, greater than that of the upstream-targeted O134 and O38 ( Fig. 1H ). Similarly, N80 provided 3.2-fold greater activation of NANOG than did N185 ( Fig. 1L ). These results showed that saRNAs target an enhancer or proximal promoter and tended to activate transcription of the three genes efficiently when close to the TSS.
RNAPII Was Recruited to the saRNA Targeting Region
Because the aforementioned regulatory elements associated with saRNA were involved in recruitment of RNAPII, we detected whether RNAa induced recruitment of RNAPII to the saRNA targeting region. We performed ChIP assays using an anti-RNAPII antibody to compare KMB17 cells transfected with saRNA and negative dsRNA for 96 h. RNAPII binding increased markedly near primer sites Sp3, Sp5, Sp7, Sp9, Sp10, and Sp11 in the SOX2 promoter ( Fig. 2A ), where the S278-targeted region recruited RNAPII to the region between the TATA box and CGI. Moreover, we used primers Op1 to Op12 for the OCT4 promoter ( Fig. 2B ) and primers Nr1 to Nr6 and Np1 to Np8 for the NANOG promoter ( Fig. 2C ). After O38 activation, RNAPII binding decreased at the Op3 to Op8 primer sites, which are located upstream of the O38 target site, and increased at primer sites Op9, Op11, and Op12, located between the O38 target site and the TSS, in the proximal promoter region of OCT4 ( Fig. 2B ). In general, proximal promoter regions facilitate formation of initiation transcriptional complexes; recruitment of RNAPII to this region of the OCT4 gene implies its involvement in transcription initiation. In addition, RNAPII binding increased at the Np1, Np2, Np7, and Np8 primer sites, which are close to the N80 target site. These results showed that RNAPII was recruited to the saRNA targeting region in the promoter of the three genes, consistent with studies by Mahajan et al. 5 and Hu et al., 6 which showed that ChIP-PCR could be used to effectively analyze variations in involved proteins during RNAa. Therefore, we attempted to use similar methods to detect changes in nucleosomes during RNAa.
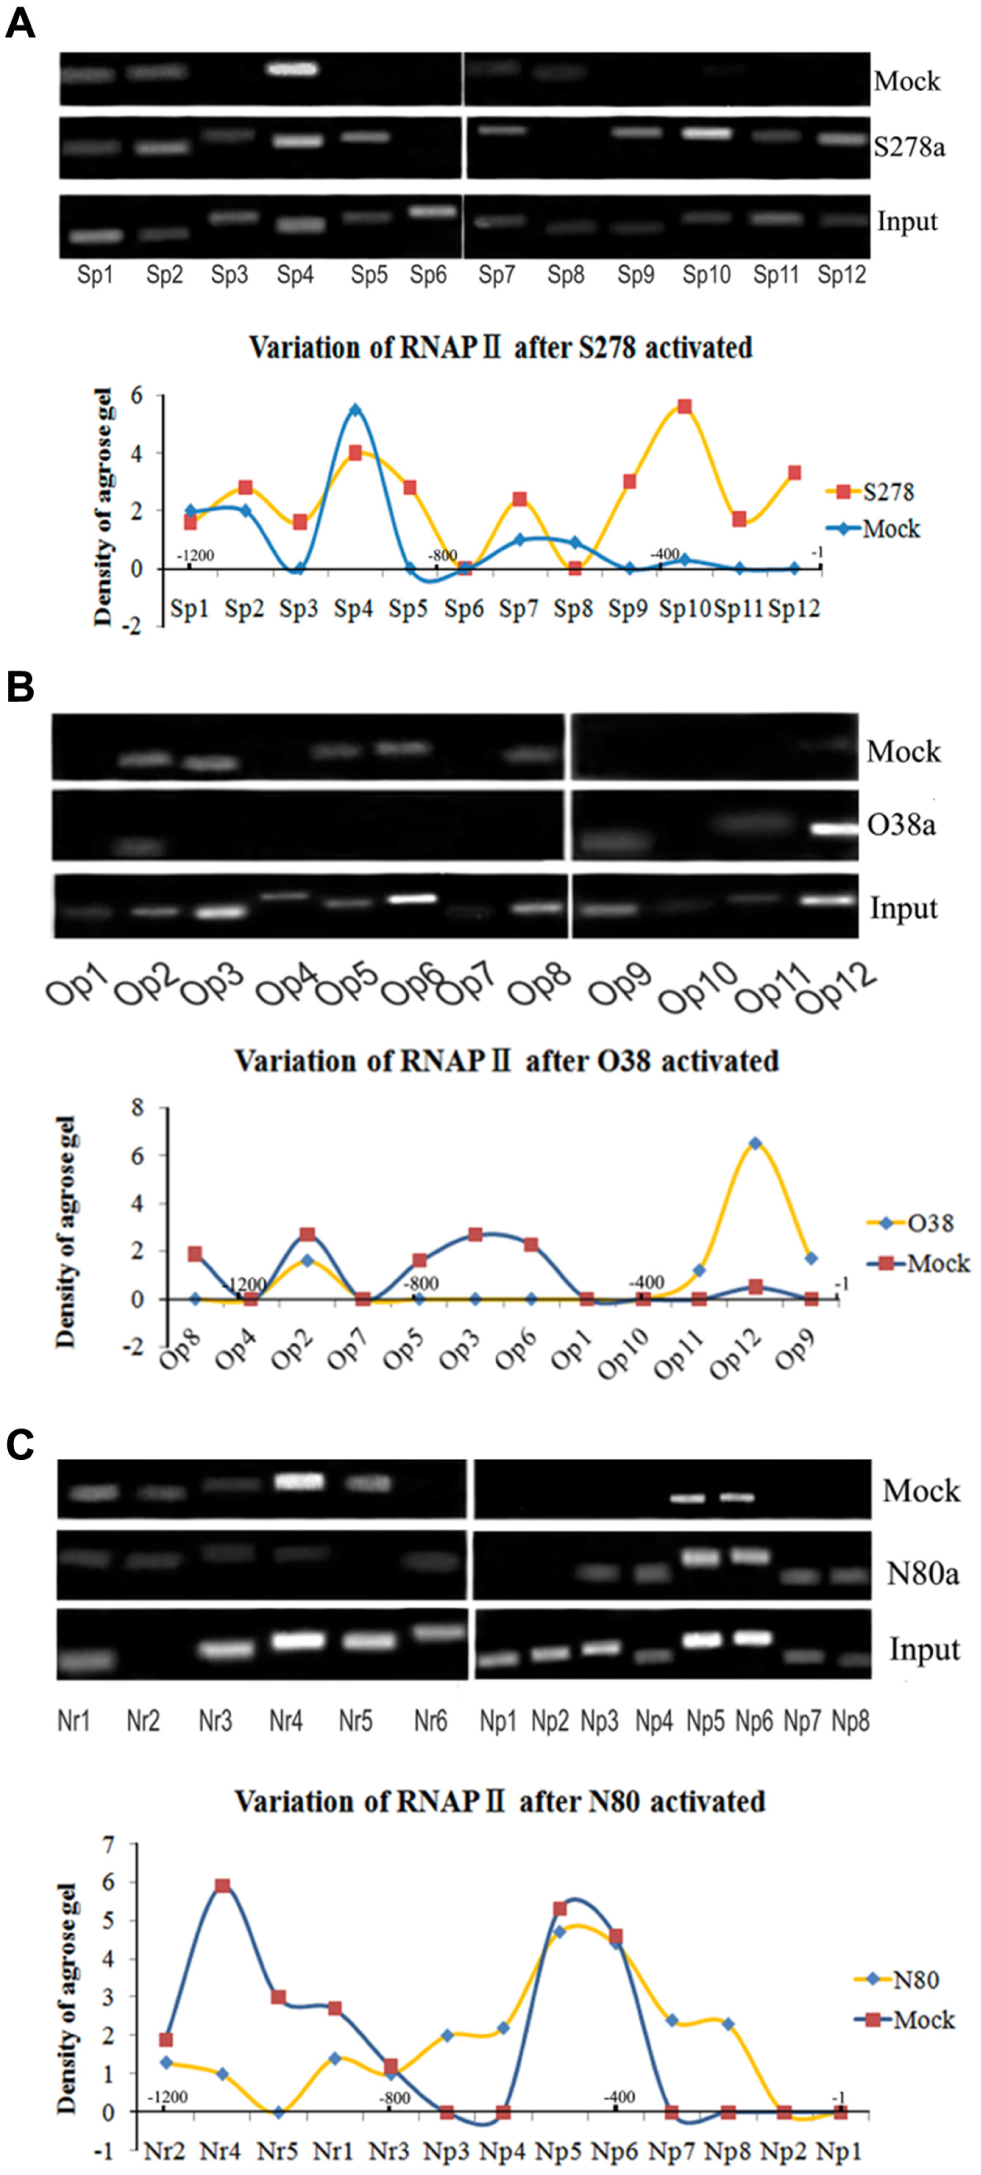
ChIP-PCR results revealed RNAPII enrichment at saRNA target sites after RNAa. (
NDRs Formed an Open Chromatin Structure for RNAa
To examine the hypothesis that saRNA binding its target DNA template could induce chromatin remodeling and ultimately affect nucleosome positioning through the formation of an open chromatin structure, we compared RNAa samples with mock control samples to assay nucleosome binding in the promoter region by ChIP using anti-H3 antibodies and PCR. 12 Because H3 is one of the core histones making up the nucleosome, detecting a loss in H3 histone on the promoter can reflect formation of nucleosome-depleted regions (NDRs), which are involved in nucleosome positioning. 13 For specific loci, regular nucleosomal arrays with 195 bp periodicity are found. 14 Therefore, we analyzed nucleosomes according to this 195 bp periodicity and started from the TSS because the region near the TSS is generally an NDR. 14 From this analysis, we speculated that there were six nucleosomes within the region from −1200 to +1 on the SOX2 and OCT4 promoters ( Figs. 3 and 4 ) and four nucleosomes within the region from −800 to +1 on the NANOG promoter ( Fig. 5 ). Based on the ChIP-PCR results of the H3 binding sites, we generated a densitogram distribution map for saRNA-treated samples and mock control samples. These maps showed nucleosomes distributed at sites every 195 bp: six loci in SOX2 ( Fig. 3 ), six loci in OCT4 ( Fig. 4 ), and four loci in NANOG ( Fig. 5 ). If one of these nucleosomes was deleted or depleted, the corresponding DNA region would not be identified by the H3 histone antibody and should be negative by ChIP-PCR.
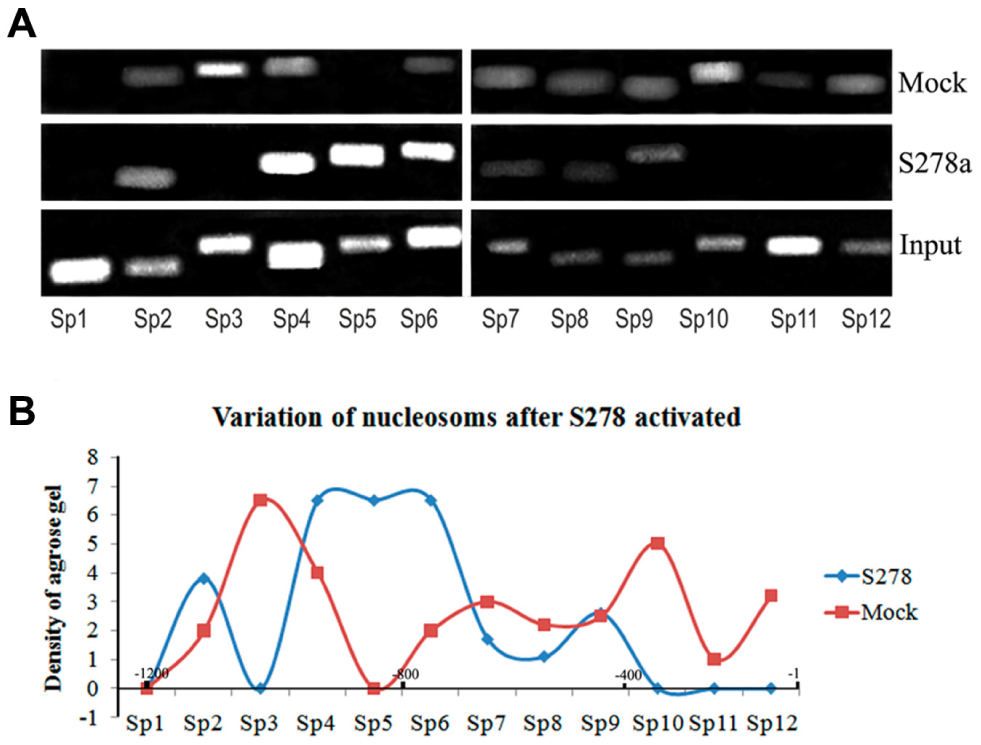
Nucleosome deletion and NDR formation after S278 activation. (
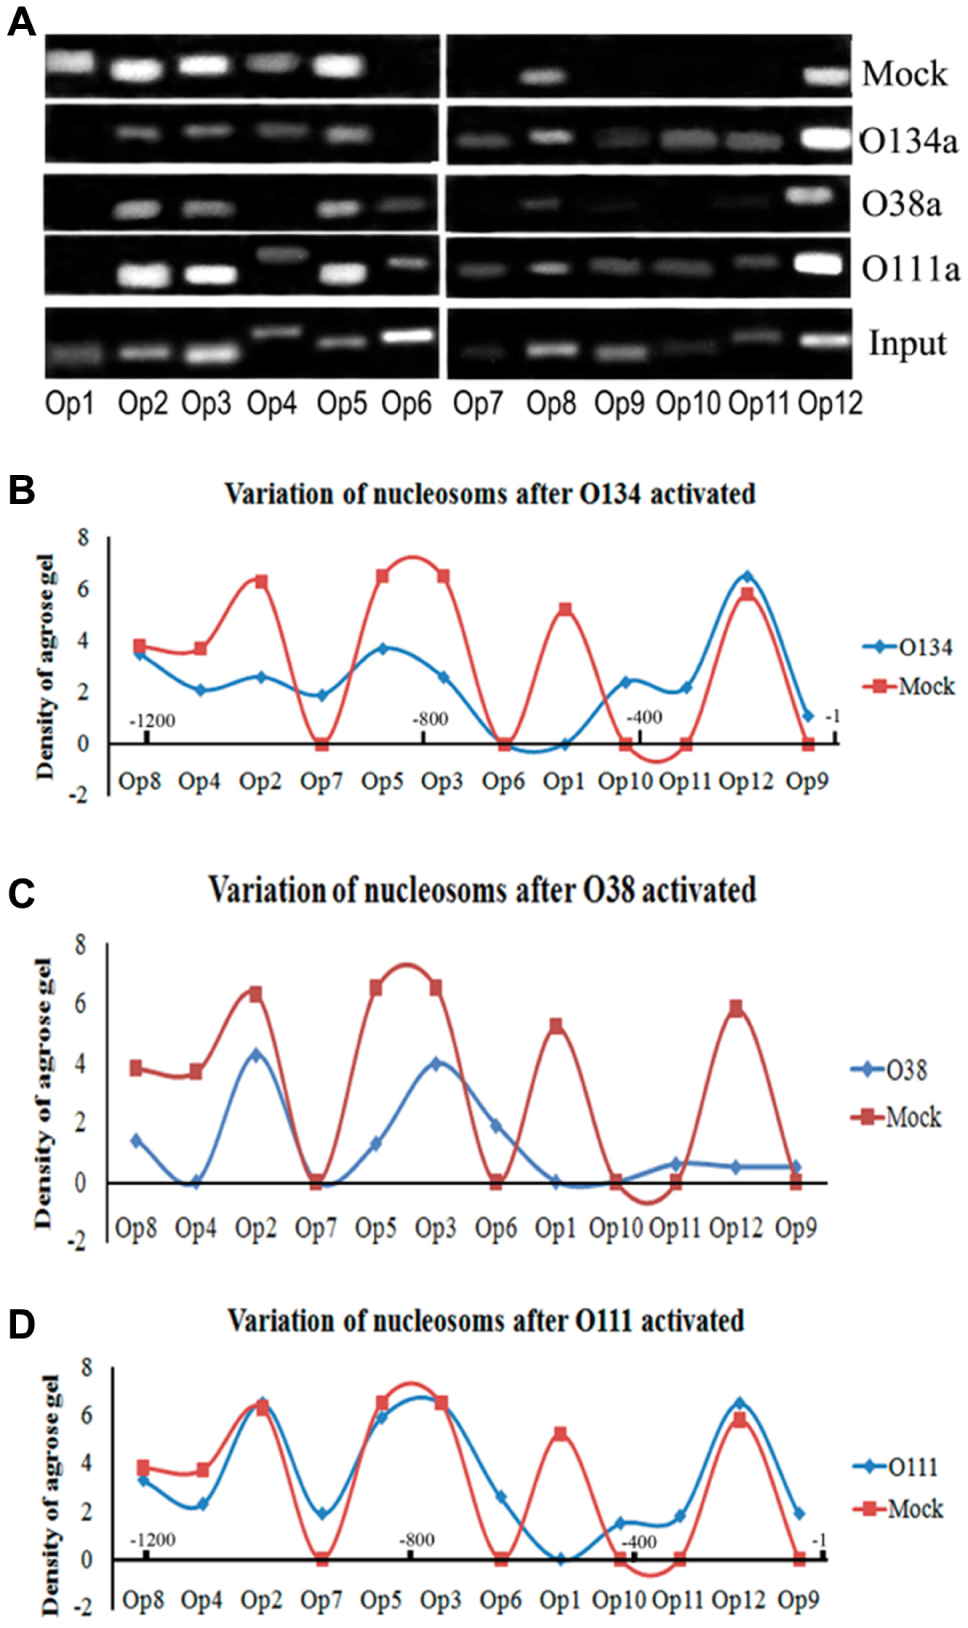
Nucleosome repositioning on the OCT4 promoter after RNAa. (
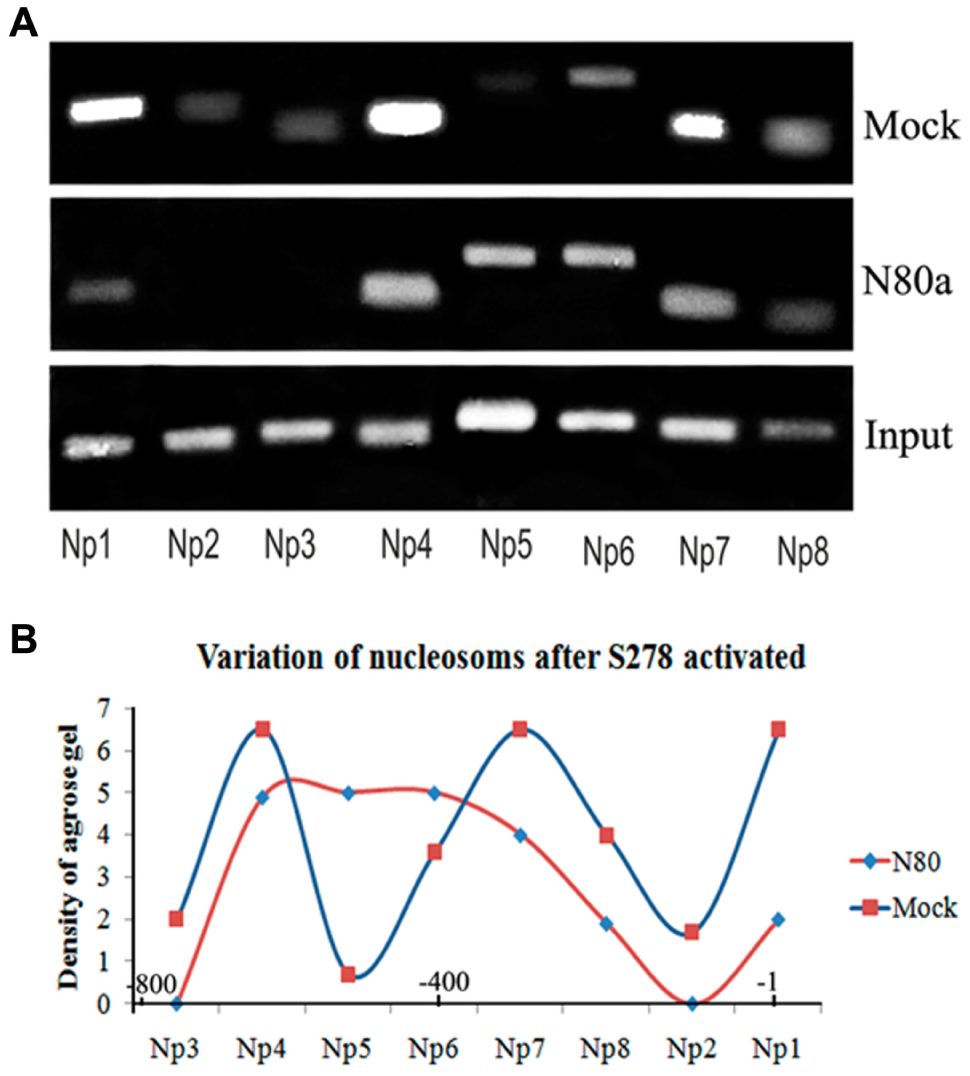
Nucleosomes repositioning after N80 activation. (
By comparing these nucleosome positions with those in the mock control, we found that nucleosomes in two hotspots were generally depleted. The first nucleosome position spanned the region between the saRNA target site and the TSS. After S278 activation, nucleosomes on the SOX2 promoter were deleted and formed an NDR close to the TSS where the TATA box and CpG were located ( Fig. 3B ). After the OCT4 and NANOG promoters were activated, nucleosomes did not change in an all-or-nothing manner, but instead varied quantitatively. In addition to the change in the first hotspot of the OCT4 promoter, another hotspot was identified where the proximal enhancer was located. Thus, O134 activation triggered decreased binding at positions −400 to −600 bp, generating an NDR where the enhancer region resides ( Fig. 4B ). After activation with O38, nucleosomes binding to nucleotides at positions −1 to 600 were depleted, a region that spans the proximal promoter and proximal enhancer ( Fig. 4C ). O111, which is located in the natural NDR near the TSS, triggered nucleosome depletion at nucleotide positions 300 to 500 ( Fig. 4D ), where the proximal enhancer is located. On the NANOG promoter, N80 caused reduction of the −1 and −2 nucleosomes (positions −1 to −400), forming an NDR at the proximal promoter region ( Fig. 5 ). Thus, we found that, at least in the KMB17 cell, all saRNAs induced NDR formation near or within their target sites, which serve as regulatory elements for RNAPII binding.
Interestingly, when we combined the distribution maps for RNAPII recruitment ( Fig. 2 ) and the NDRs ( Figs. 3 – 5 ) after RNAa, we found the RNAPII enriched at Op12 in the OCT4 promoter, at Sp10,Sp12 in the SOX2 promoter, and at Np8 in the NANOG promoter, all where nucleosomes were depleted. That is, the recruited RNAPII was always located in the promoter-proximal NDR induced by saRNAs for the three genes ( Fig. 6 ), suggesting that NDR formation and RNAPII binding to the proximal promoter were the causes of RNAa in the KMB17 cell.
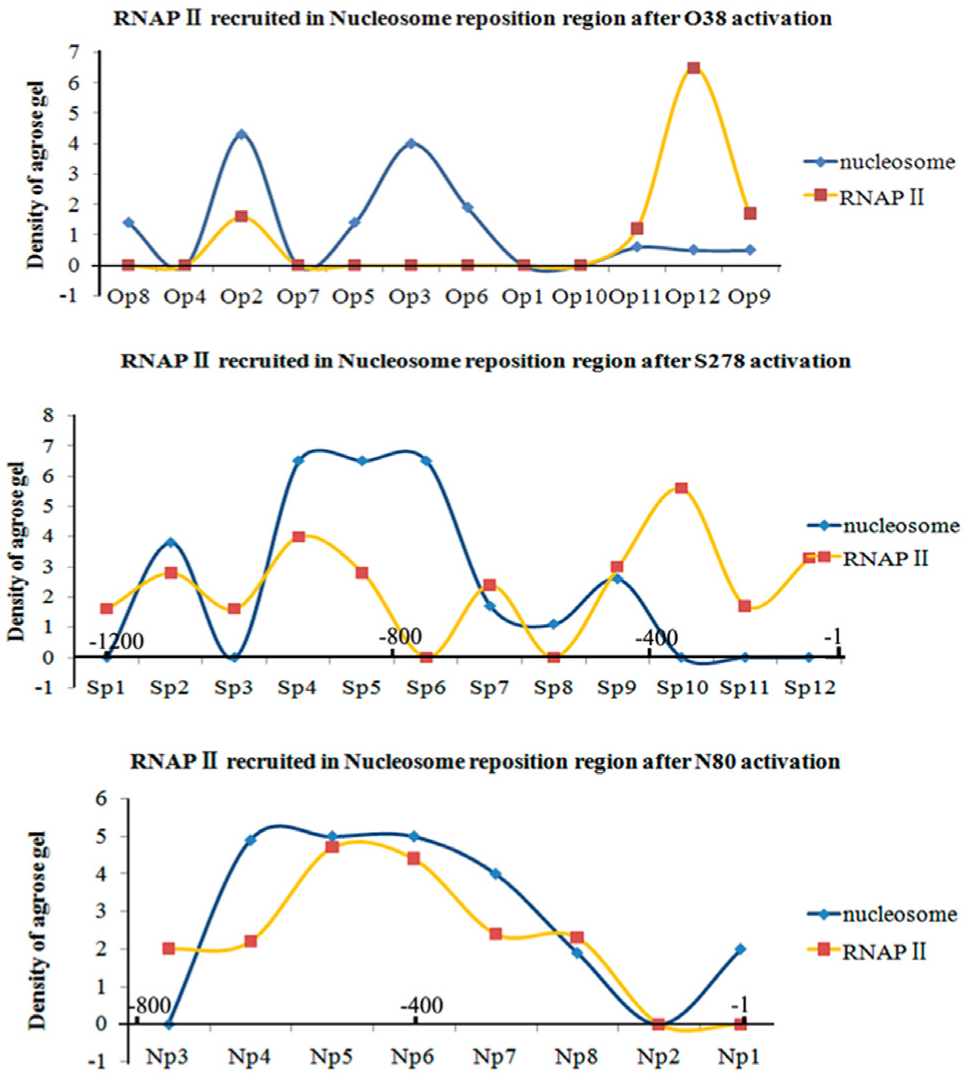
Merged densitograms of variations in nucleosome and RNAPII binding after RNAa showed that recruited RNAPII consistently bound to NDRs induced by saRNAs. The individual densitograms represent the O38-activated OCT4 gene, the N80-activated NANOG gene, and the S278-activated SOX2 gene. The horizontal axes indicate the promoter regions upstream of the TSS.
Discussion
Rules for designing effective saRNAs have not yet been completely established. In our experience of saRNA design, a primary principle is to avoid targeting TATA boxes and CGIs. 1 In the majority of studies, effective saRNAs were generally found to be associated with type I promoters, which contain a TATA box and CGI. Li et al. 1 reported that the type I promoter for the CDH1 gene (encoding E-cadherin) is activated 3.8- to 14-fold, while that of the CDKN1A gene (encoding p21) is activated 12.5-fold by dsRNA. Additionally, Janowski et al. 2 reported that PR can be activated up to 17-fold by dsRNA. However, the activation of genes containing other types of promoters, such as VEGFA and MVP, is much lower.1,2 This has also been confirmed for the type II promoter of NANOG, which has been shown to be activated 2.87-fold by dsNanog752. 11 In this study, we found that the SOX2 promoter can be activated nearly 1000-fold; however, activation of the OCT4 and NANOG promoters was less than 10-fold. Thus, these data indicated that type I promoters are more efficiently activated (i.e., by more than 10-fold) by dsRNA than are other promoter types.
We found NDR preferentially formed in transcription factor (TF)–binding sites like the TATA box, the CGI, the proximal promoter, and the proximal enhancer of the three genes studied. NDRs forming close to the TSS facilitate gene activation, 17 but relationships between NDRs and TF binding sites have only been investigated in a limited number of studies. Concerning the SOX2 gene of KMB17 cells, the TATA box and CGI are juxtaposed to the TSS, with the TSS located just inside of the CGI for the promoter. This layout of TF binding sites and the NDR induced by saRNA could be closely related to the 1000-fold activation of transcription that was observed.
The TATA box is a classic site for the recruitment of RNAPII, and the proximal promoter region mediates RNAPII docking. CGIs and enhancer regions can also promote RNAPII recruitment, and RNAPII recruitment to the TATA box and proximal promoter can activate transcription. In addition, TATA boxes and CGIs have been shown to have epigenetic functions. Indeed, the TATA box has a major role in the recruitment of chromatin-modifying complexes to the promoter, 15 and genes with CGI promoters have a characteristic transcription-associated chromatin organization. 16 Our results indicated that saRNA targeting can lead to nucleosome and can create NDRs in type I promoters via the TATA box and CGIs, and for type II promoters, the nucleosome depletion occurred in the regions of the proximal promoter and enhancer after saRNA targeting. The results were substantiated by ChIP-seq experiments in embryonic stem cells (ESCs); 18 in that study, some TF binding sites identified were depleted of nucleosomes, with the nucleosome occupancy reduced to 40%–80% of that of the flanking regions in all cell types. Thus, it is possible that the presence of nucleosomes caused weakened activation and nucleosome depletion caused stronger activation, during which time the participation of TATA boxes and CGIs reinforced the nucleosome depletion by their function of recruiting chromatin-modifying complexes.
Furthermore, in this study, we found that RNAPII was particularly enriched in NDRs formed after RNAa. Given that RNAPII binding is a prerequisite of transcription initiation, the efficiency of RNAa should be related to RNAPII binding. Thus, the greater efficiency of TATA box– and CGI-mediated recruitment of RNAPII than by other cis elements in the proximal promoter could be an important impact factor supporting RNAa.
An important unanswered question is whether nucleosomea removal is a cause or an effect of RNAPII recruitment to the proximal promoter. Yadav et al. 17 analyzed the genomic binding sites of the TF, and their promoter nucleosome occupancy and transcriptome profile data showed that TF binding to proximal promoters influenced target gene expression when coupled to nucleosome repositioning or when binding close to nucleosome binding sites, in most cases. Therefore, we concluded that saRNA induced nucleosome removal, forming NDRs, which can recruit RNAPII.
Theoretically, DNA duplex twined nucleosomes block regulatory elements from binding other proteins. However, small molecules like dsRNAs can penetrate the lacunae of chromatin and trigger chromatin remodeling, while promoting the depletion of nucleosomes from the regulatory elements to provide the necessary space for RNAPII binding to the proximal promoter, which in turn can initiate transcription. Thus, we can conclude that chromatin remodeling is likely the underlying cause of RNAa.
Footnotes
Acknowledgements
We thank our colleagues at the Institute of Medical Biology, Chinese Academy of Medical Sciences, for designing the study and applying for research ethics board approval.
Authors’ Contributions
Bin Wang carried out all the experimental study and drafted the manuscript. Jing Sun, Ningzhu Hu, and Jiandong Shi participated in experimental designing, and Qing Guo, Xiangrong Tong, and Jin Zhang participated in the sequence alignment and performed the statistical analysis. YunZhang Hu conceived of the study, participated in its design and coordination, and helped to draft the manuscript. All authors read and approved the final manuscript.
Authors’ Note
YunZhang Hu is the director of the vaccine research lab at the Institute of Medical Biology, Chinese Academy of Medical Sciences and Peking Union Medical College.
Declaration of Conflicting Interests
The authors declared no potential conflicts of interest with respect to the research, authorship, and/or publication of this article.
Funding
The authors disclosed receipt of the following financial support for the research, authorship, and/or publication of this article: This project was funded as an Innovation Team Project of the Yunnan Province of China, entitled “Provincial Innovation Team for Application Research on New Type of Vaccine Adjuvants, Institute of Medical Biology, Chinese Academy of Medical Sciences” (2011CI140); as an Applied Basic Research Key Project in Yunnan Province (2013FA025); and by support from the Fund of the Institute of Medical Biology, Chinese Academy of Medical Sciences (IMB2013ZD01). Funding was also provided by the National High Technology Research and Development Program (863 program) of China: Development and Application of New Type of Vaccine Adjuvants (grant 2012AA02A406) and by the Fund of the Department of Education in Yunnan Province (2012C210).
References
Supplementary Material
Please find the following supplemental material available below.
For Open Access articles published under a Creative Commons License, all supplemental material carries the same license as the article it is associated with.
For non-Open Access articles published, all supplemental material carries a non-exclusive license, and permission requests for re-use of supplemental material or any part of supplemental material shall be sent directly to the copyright owner as specified in the copyright notice associated with the article.