
Abstract
Histone deacetylases (HDACs) are a class of epigenetic enzymes that regulate gene expression by histone deacetylation. Altered HDAC function has been linked to cancer and neurodegenerative diseases, making HDACs popular therapeutic targets. In this study, we describe a screening approach for identification of compounds that inhibit endogenous class I and II HDACs. A homogeneous, luminogenic HDAC I/II assay was optimized in a 1536-well plate format in several human cancer cell lines, including HCT116 and human neural stem cells. The assay confirmed 37 known HDAC inhibitors from two libraries of known epigenetics-active compounds. Using the assay, we identified a group of potential HDAC inhibitors by screening the National Center for Advancing Translational Sciences (NCATS) Pharmaceutical Collection of 2527 small-molecule drugs. The selected compounds showed similar HDAC I/II inhibitory potency and efficacy values in both HCT116 and neural stem cells. Several previously unidentified HDAC inhibitors were further evaluated and profiled for their selectivity against a panel of 10 HDAC I/II isoforms using fluorogenic HDAC biochemical assays. In summary, our results show that several novel HDAC inhibitors, including nafamostat and piceatannol, have been identified using the HDAC I/II cell-based assay, and multiple cell types have been validated for high-throughput screening of large chemical libraries.
Introduction
Epigenetic aberrations contribute substantially to the onset and progression of human disease. A group of enzymes called histone deacetylases (HDACs) are capable of introducing epigenetic modifications. 1 The major function of HDACs is to remove an acetyl group from a ε-N-acetyl lysine residue on a histone, causing an increase in positive charges at the residue and enhancing the binding ability of histones to negatively charged DNA molecules. 2 HDACs also regulate gene expression by deacetylating nonhistone proteins such as tubulin and several transcription factors (e.g., p53, CREB, and NF-κB). Based on sequence similarity to yeast HDAC homologs, the HDAC family containing 18 enzymes is categorized into four classes: I, II, III, and IV. Class I and II HDACs include HDAC1, HDAC2, HDAC3, HDAC4, HDAC5, HDAC6, HDAC7, HDAC8, HDAC9, and HDAC10. Class III HDACs, or sirtuins (SIRTs), contain seven isoforms in mammals. Class IV HDACs have only one isoform, HDAC11. Class I and II HDACs have similar substrate specificity and sensitivity to trichostatin A inhibition. 3 Class III HDACs require nicotinamide adenine dinucleotide (NAD) coenzymes for activation, and class II HDACs can be categorized into subgroups of class IIa and class IIb enzymes. 2
HDAC isoforms exert distinct functions in various tissues; therefore, altered HDAC functions have been implicated in cancer and neurological disorders. 4 Inhibition of class I HDACs, including HDAC1, HDAC2, and HDAC3, has been shown to suppress tumor differentiation and transformation in promyelocytic leukemia (PML). 5 For example, the commonly used control compound trichostatin A and the Food and Drug Administration (FDA)–approved drug vorinostat (suberoylanilide hydroxamic acid [SAHA]), first discovered as anticancer agents, were later characterized as class I and II HDAC inhibitors. 4 One of the class I HDACs (HDAC2) and three of the class II HDACs (HDAC4, HDAC5, and HDAC9) regulate the development and function of the brain and other neurological systems, playing an important role in Alzheimer’s disease and Parkinson’s disease. Due to the diverse physiological function and disease relevance of HDACs, several isoform-specific HDAC inhibitors are under preclinical development and clinical trials, such as the HDAC3 inhibitor, RGFP966, for the treatment of cancer and neurological diseases and the HDAC6 inhibitor, tubastatin A, for the treatment of neurodegeneration, demonstrating that HDACs are important therapeutic targets for further drug development.
Conducting high-throughput screening (HTS) assays that measure HDAC activity in biochemical or cell-based formats is the initial step toward identifying HDAC modulators that may later be developed into drugs for the treatment of HDAC-relevant diseases. Several HTS-compatible HDAC enzyme activity assays based on bioluminogenic reaction, 6 fluorescence anisotropy, 7 fluorescence lifetime, 7 fluorescence polarization (FP), 8 fluorescence resonance energy transfer (FRET), 9 and fluorogenic reaction 10 have been employed in previous studies. Furthermore, a panel of isoform-specific and cell-based HDAC assays was recently developed in 96- and 384-well plate formats through coupling of enzyme-linked immunosorbent assays (ELISAs) for each HDAC isoform with a generic bioluminescence reaction. 11 In this study, we describe a cell-based screening approach for rapid identification of compounds that potentially inhibit class I and II HDACs. A homogeneous, luminogenic HDAC I/II assay was first optimized in several human cancer cell lines and human neural stem cells in 1536-well plate formats. The assay was validated by using known epigenetic compound libraries and by profiling the NCATS Pharmaceutical Collection (NPC) of approved and investigational drugs. The identified potential HDAC inhibitors were further confirmed by fluorogenic HDAC isoform-specific biochemical assays. Our results show that the HDAC I/II luminescent assays can detect endogenous HDAC I/II activities in various cell backgrounds and can be used for HTS of large chemical libraries.
Materials and Methods
Reagents
Four cell lines (human colon cancer cell line HCT116, human embryonic kidney cell line HEK293, human liver cancer cell line HepG2, and human B lymphoma cell line SU-DHL-6), fetal bovine serum (FBS), Eagle’s Minimum Essential Medium (EMEM), and Roswell Park Memorial Institute (RPMI) 1640 medium were purchased from American Type Culture Collection (ATCC, Manassas, VA). H9-derived human neural stem cells, defined FBS, trypsin-EDTA, fibronectin, basal fibroblast growth factor (bFGF), epidermal growth factor (EGF), KnockOut Dulbecco’s Modified Eagle Medium (DMEM)/F12, and penicillin-streptomycin, StemPro Neural Supplement, were acquired from Life Technologies (Carlsbad, CA). Chemicals and epigenetic compound libraries were purchased from Cayman Chemicals (Ann Arbor, MI), Santa Cruz Biotechnology (Dallas, TX), SelleckChem (Houston, TX), and Sigma-Aldrich (St. Louis, MO). HDAC-Glo I/II and CellTiter-Glo reagents were purchased from Promega (Madison, WI). Fluorogenic assay kits for HDAC1, HDAC2, HDAC3, HDAC4, HDAC5, HDAC6, HDAC7, HDAC8, HDAC9, and HDAC10 were acquired from BPS Bioscience (San Diego, CA). White solid-bottom 1536-well assay plates were purchased from Greiner Bio-One (Monroe, NC).
Cell Line and Cell Culture
HCT116 cells were cultured with RPMI-1640 medium supplemented with 10% defined FBS, 100 U/mL penicillin, and 100 µg/mL streptomycin. HEK 293 and HepG2 cells were cultured with EMEM supplemented with 10% FBS (ATCC), 100 U/mL penicillin, and 100 µg/mL streptomycin. SU-DHL-6 cells were cultured in RMPI-1640 medium supplemented with 10% FBS (ATCC), 100 U/mL penicillin, and 100 μg/mL streptomycin. Human neural stem cells in CELLstart-coated flasks were cultured in KnockOut DMEM/F12 medium supplemented with 2 mM GlutaMAX, StemPro Neural Supplement, and 20 ng/mL EGF and bFGF. All cell lines were cultured in a 37 °C humidified incubator with 5% CO2. HCT116, HEK293, and HepG2 cells were passaged at 70% to 90% confluence with 0.25%, 0.05%, and 0.25% trypsin-EDTA, respectively. SU-DHL-6 cells were maintained at <2 × 10⁶ cells per mL by supplying fresh medium every 3 to 4 days.
HDAC-Glo I/II and Cell Viability Assays
HCT116, HEK293, HepG2, and SU-DHL-6 cells were seeded into 1536-well white solid-bottom assay plates at desired cell densities in 5 µL medium using a microfluidic reagent dispenser (BioRAPTR FRD; Beckman Coulter, Indianapolis, IN). Before plating 5 µL of human neural stem cells into each well, assay plates were precoated with 5 µL of 10 µg/mL fibronectin in culture medium at 37 °C for 1 h, and the coating solution was removed by centrifuging the inverted plates. Cells were settled overnight in a cell incubator at 37 °C, 5% CO2, followed by addition of 23 nL of compound solution on a pintool workstation (Kalypsys, San Diego, CA). After compound incubation for indicated period at 37 °C/5% CO2, 5 µL HDAC-Glo was dispensed using BioRAPTR FRD. To measure cell viability, 5 µL CellTiter-Glo Cell Viability reagent was added to each well in a separate assay plate using BioRAPTR FRD. The luminescence signals of HDAC-Glo and CellTiter-Glo assays were measured on a ViewLux plate reader (Perkin-Elmer, Shelton, CT).
Compound Screening and Data Analysis
For primary screening of the NPC, 1500 HCT116 cells in 5 µL assay medium were seeded into each well using a 16-tip Multidrop dispenser (Thermo Scientific, Waltham, MA). Cells were plated overnight in a humidified incubator at 37 °C, 5% CO2, followed by an online workflow of compound addition, assay plate incubation, reagent addition, and plate reading on a robotic quantitative high-throughput screening (qHTS) platform (Kalypsys). For validation and confirmation studies, HCT116, HEK293, and human neural stem cells were seeded at 1500, 1500, and 4000 cells per well, respectively, using BioRAPTR FRD. All wells were added with 23 nL of test compounds or DMSO and incubated at 37 °C, 5% CO2, for 1 h. HDAC-Glo and CellTiter-Glo assays were conducted accordingly. Analysis of the qHTS data was performed as follows. First, raw plate reads containing individual titration points were normalized relative to the controls (i.e., DMSO as 0% inhibition in HDAC activity or cytotoxicity, trichostatin A as 100% HDAC inhibition, and tetraoctylammonium bromide [TOAB] as 100% cytotoxicity) using the following formula: %activity = [(Vcompound - VDMSO)/(Vpos - VDMSO)] × 100, where Vcompound, Vpos, and VDMSO denote the median value of the compound wells, the positive control wells, and the DMSO-only wells, respectively. The normalized plate reads were corrected with DMSO-only plates placed before and after the sample plates using an NCATS in-house pattern correction algorithm. The half-maximal inhibitory concentration (IC50) and maximal response (efficacy) values were determined by fitting the concentration-response curves to a four-parameter Hill equation.
Fluorogenic Isoform-Specific HDAC Assays
The fluorogenic assays were performed at BPS Bioscience (San Diego, CA) for individual HDAC I/II enzymes (BPS Bioscience) using human recombinant enzymes and fluorogenic HDAC substrates12–14 (
Results
Optimization of Cell-Based HDAC-Glo I/II Assays
The HDAC-Glo I/II assay was optimized in 1536-well plate formats by measuring the inhibitory effect of trichostatin A on endogenous HDAC I/II activities in a panel of five human cell lines, SU-DHL-6, HCT116, HEK293, HepG2, and human neural stem cells (hNSCs) (
Fig. 1A
). The assay uses a cell-permeable HDAC I/II substrate that can be converted into a luciferase substrate upon deacetylation by endogenous HDACs, and therefore no wash steps are needed in the cell-based HDAC-Glo I/II assays. Compared to HEK293 cells, the HCT116, HepG2, SU-DHL-6, and hNSCs showed higher basal activity levels of HDAC I/II enzymes at their optimal cell densities. The time course of a 1-h treatment for trichostatin A in HCT116 cells had the most potent activity (IC50 = 0.05 ± 0.03 µM) compared to other time points for the HDAC-Glo I/II assay (
Fig. 1B
). Based on the signal to background ratio (S/B), Z′ factor, and IC50 values of the five cell lines (
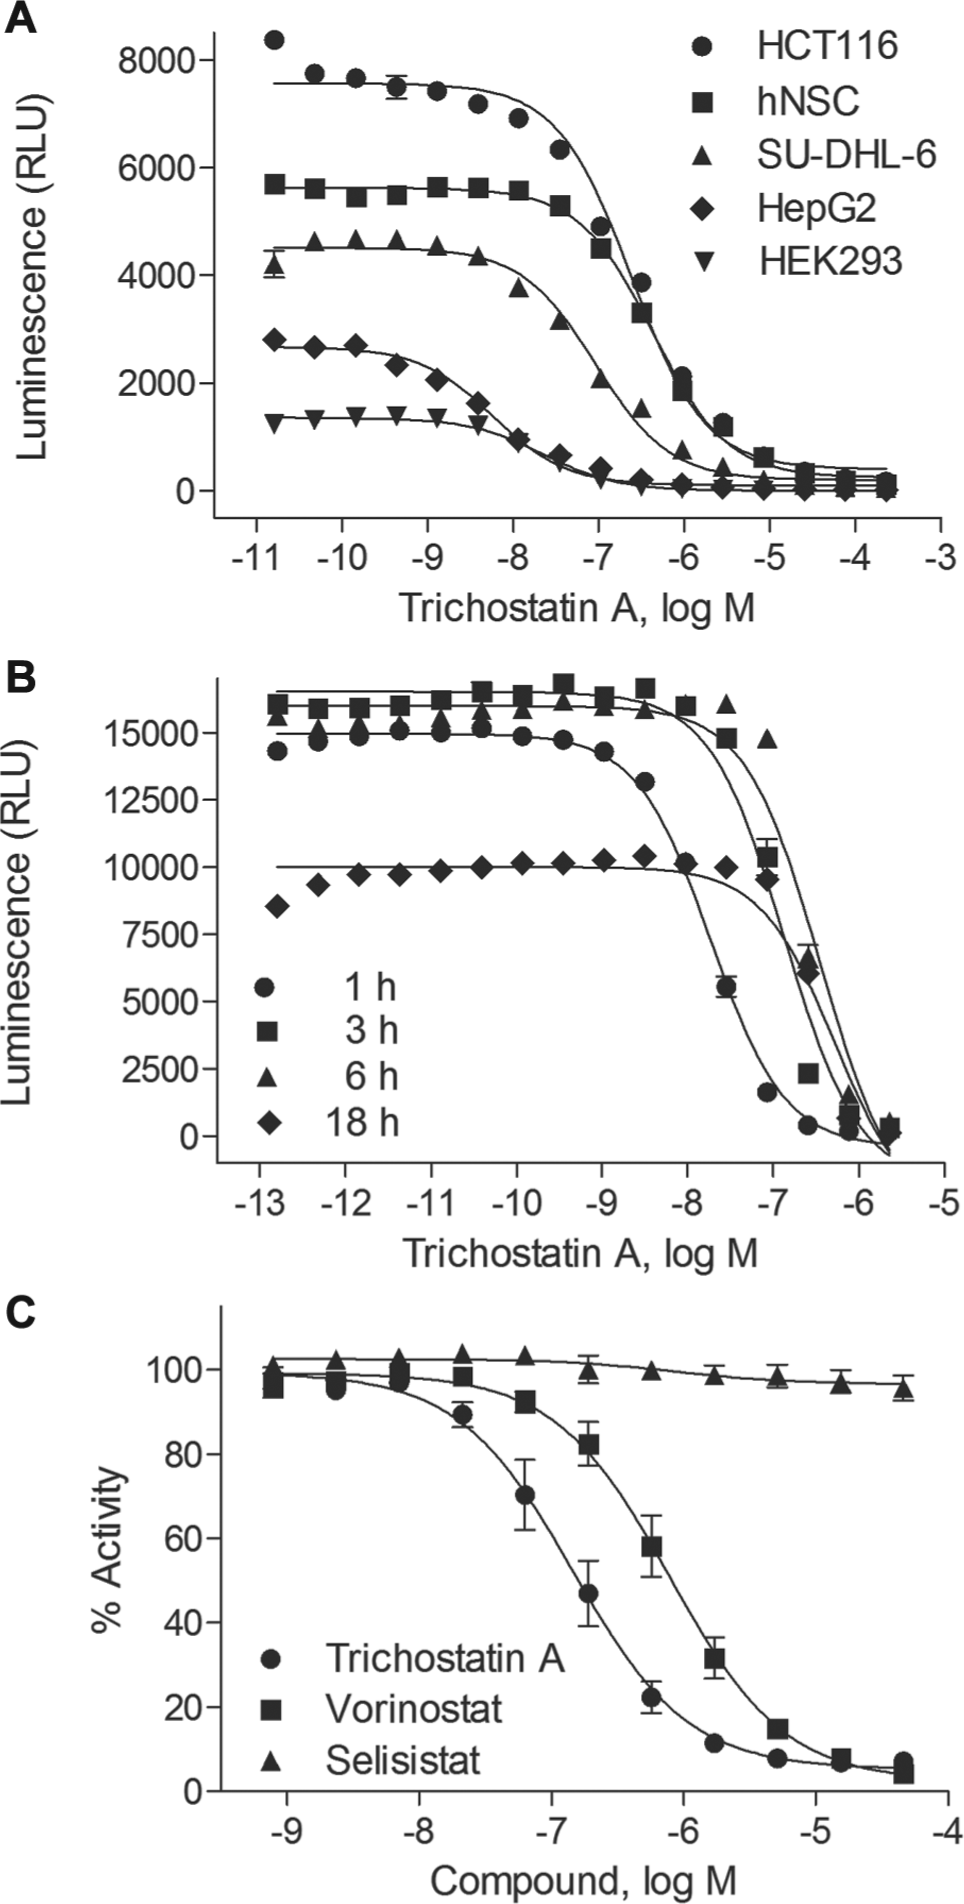
Optimization and validation of the histone deacetylase (HDAC)–Glo I/II assay in 1536-well formats. (
Validation of HDAC-Glo I/II Assay with Epigenetics Libraries
The HDAC-Glo I/II assay was evaluated using two epigenetic chemical libraries, Cayman (https://www.caymanchem.com/app/template/Product.vm/catalog/11076) and the SelleckChem (http://www.selleckchem.com/screening/epigenetics-compound-library.html) chemical collections. Each compound was tested at multiple concentrations ranging from 0.7 nM to 46 µM in HCT116 and HEK293 cells. Of the 22 known HDAC I/II inhibitors from the Cayman collection, 18 compounds showed HDAC I/II inhibitory activities, whereas 26 of the 31 known HDAC I/II inhibitors in the SelleckChem chemical collection showed assay activities as shown in
qHTS of NPC for HDAC I/II Inhibitors
The HDAC-Glo I/II assay using HCT116 cells identified 43 (1.7%) active compounds from the NPC library based on potency (IC50 <10 µM) and efficacy (≥70%). Each compound was tested at eight concentrations ranging from 0.6 nM to 92 µM. The online screen of the HDAC assay yielded a signal-to-background (S/B) ratio of 5.34 ± 0.56-fold, a coefficient of variation (CV) of 2.83% ± 0.49%, and Z′ factor of 0.84 ± 0.19. The positive control compound trichostatin A had an IC50 value of 0.16 ± 0.03 µM. The assay identified both of the two known HDAC inhibitors—resveratrol (IC50 = 2.66 µM) and vorinostat (IC50 = 0.67 µM)—from the NPC library. Nafamostat was the most potent hit (IC50 = 0.07 µM) identified from the primary screening. Both nafamostat and its analogue camostat (IC50 = 0.60 µM) reduced HDAC-Glo signals at submicromolar concentrations in HCT116 cells. Three benzimidazole-based compounds, including albendazole (IC50 = 9.44 µM), albendazole oxide (IC50 = 3.76 µM), and thiabendazole (IC50 = 2.98 µM), inhibited more than half of HDAC activity in the HDAC-Glo I/II HCT116 assay.
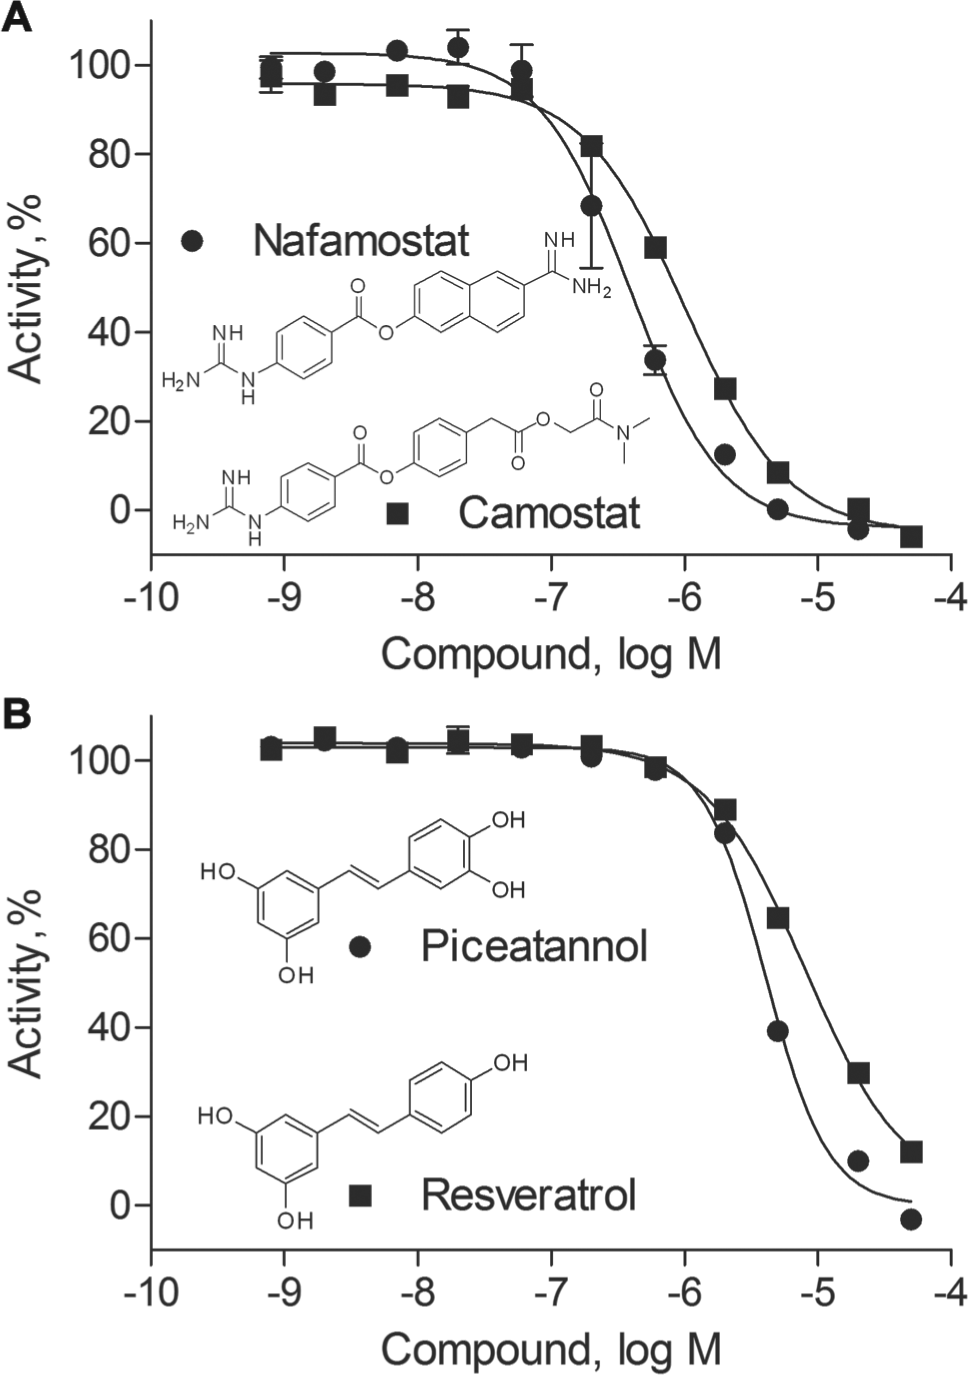
Confirmation of Identified HDAC Inhibitors
Fifty compounds, 7 from the epigenetic libraries and 43 from the NPC library, were cherry-picked and retested at 11 concentrations in the HDAC-Glo I/II assay in HCT116 cells and human neural stem cells (hNSCs) ( Table 1 ), yielding a confirmation rate of 94% (i.e., efficacy ≥30%). The IC50 values of the top 20 potent compounds had a good correlation between HCT116 cells and hNSCs (R2 = 0.69; Table 1 ). Camostat, nafamostat, piceatannol, and resveratrol completely inhibited HDAC-Glo I/II luminescence signals in hNSCs ( Fig. 2 ). Several compounds such as daniquidone, nitazoxanide, and tenonitrozole were more potent in decreasing HDAC-Glo I/II signals than suppressing proliferation of HCT116 cells and hNSCs after a 1-h incubation. Fifteen compounds, including four known HDAC inhibitors (resveratrol, trichostatin A, scriptaid, and vorinostat) and 11 potential HDAC-Glo I/II inhibitors, chosen based on potency and efficacy (i.e., IC50 ≤10 µM and ≥70% inhibition in the HDAC-Glo hNSC assay) from the cherry-pick confirmatory results, were prepared from powders and tested in the HDAC-Glo I/II assay with HCT116 cells ( Table 2 ). All 15 compounds were confirmed to decrease HDAC-Glo I/II signals with less than threefold changes in IC50 values.
Cherry-Pick Confirmation Data of the Top 20 Potential HDAC Inhibitors.
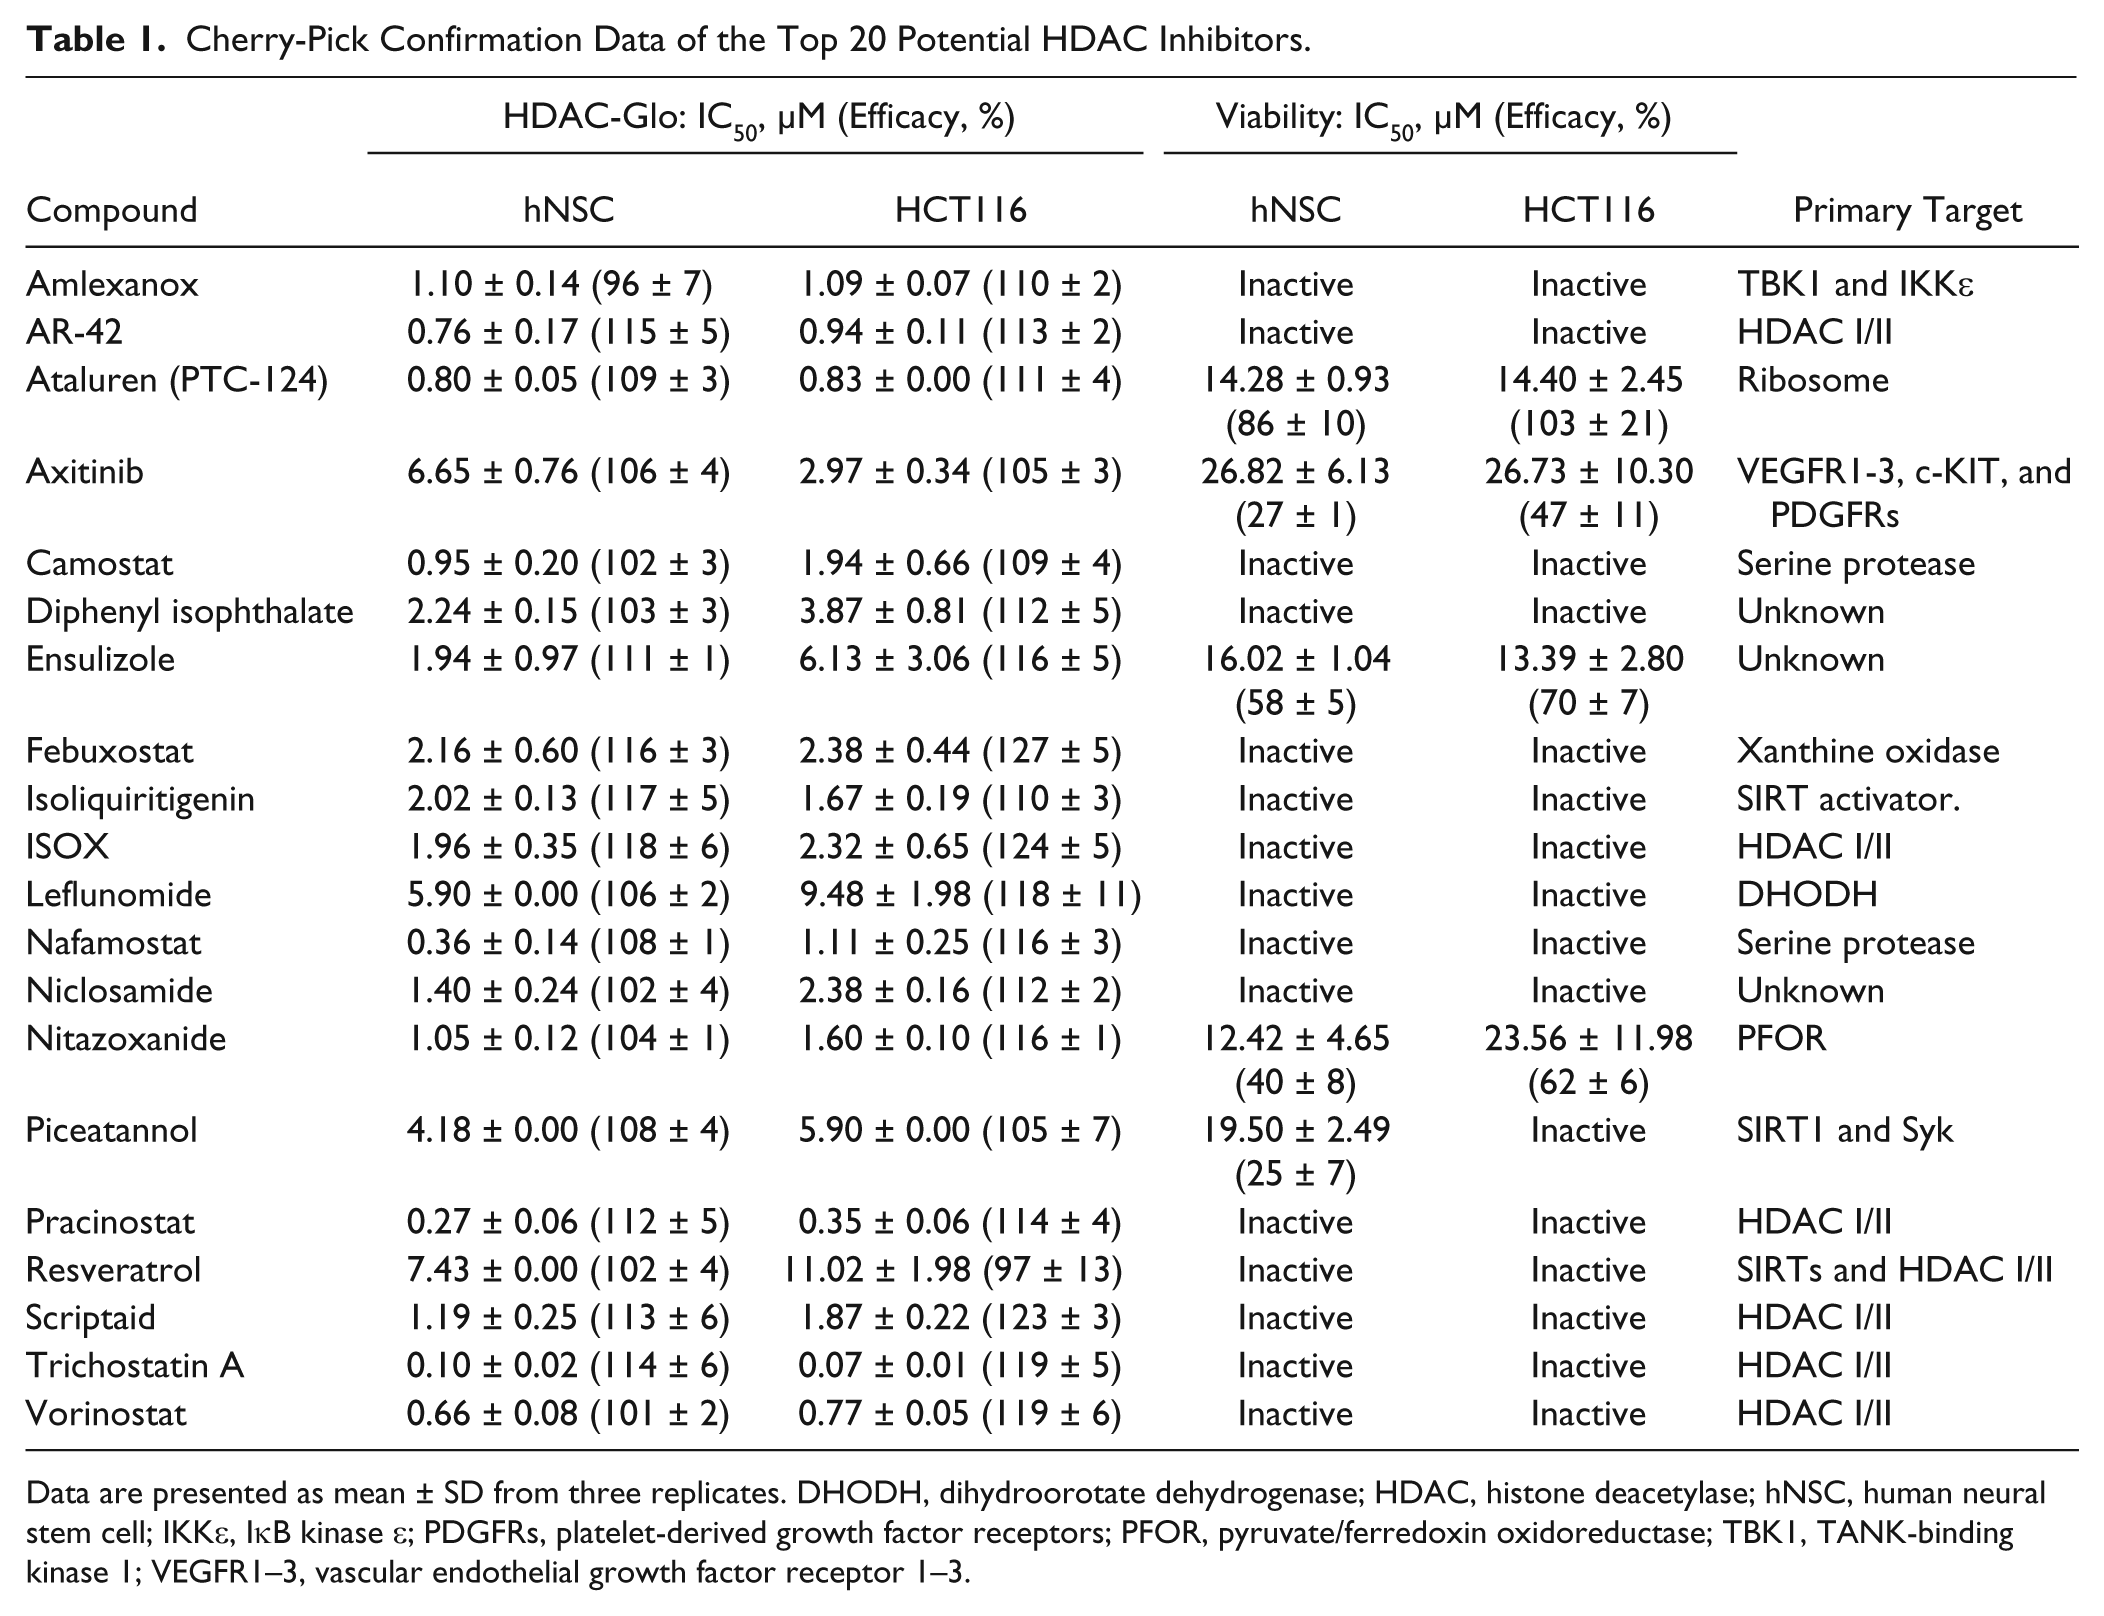
Data are presented as mean ± SD from three replicates. DHODH, dihydroorotate dehydrogenase; HDAC, histone deacetylase; hNSC, human neural stem cell; IKKε, IκB kinase ε; PDGFRs, platelet-derived growth factor receptors; PFOR, pyruvate/ferredoxin oxidoreductase; TBK1, TANK-binding kinase 1; VEGFR1–3, vascular endothelial growth factor receptor 1–3.
Histone deacetylase (HDAC) inhibitor hits identified from the National Center for Advancing Translational Sciences (NCATS) Pharmaceutical Collection. (
Powder Confirmation Data of the 15 Selected Compounds in the HDAC-Glo I/II HCT116 Assay.
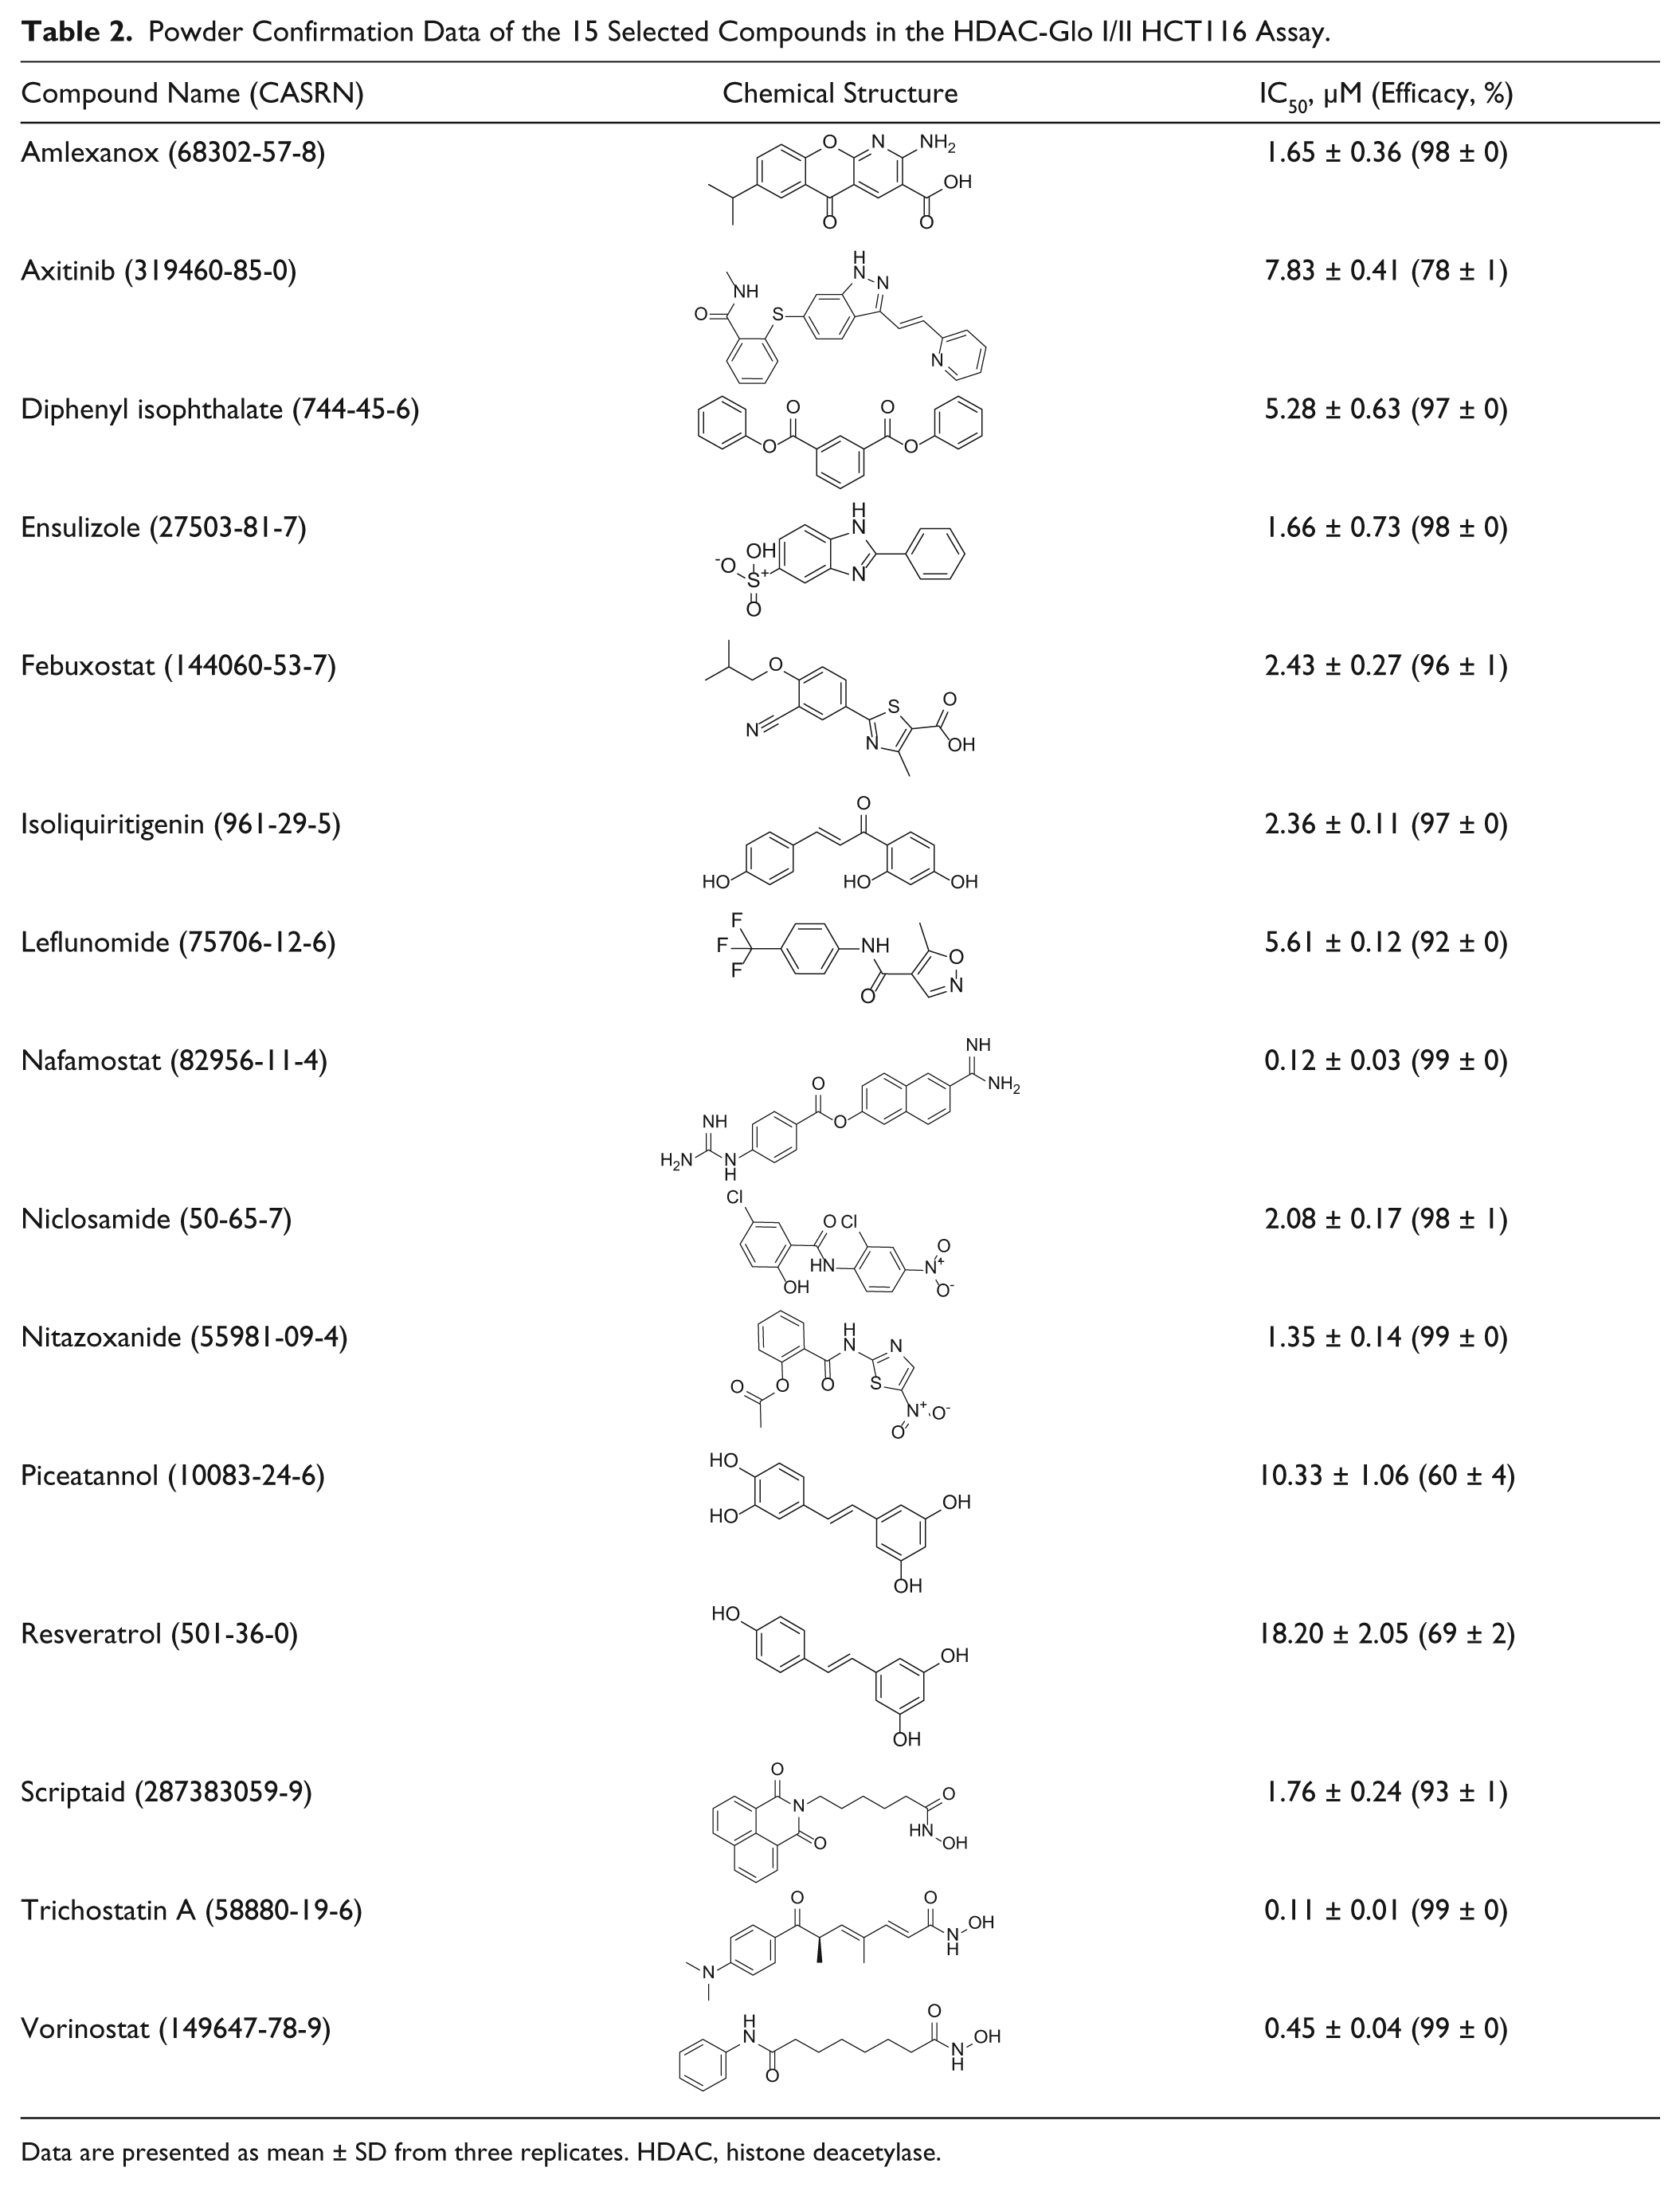
Data are presented as mean ± SD from three replicates. HDAC, histone deacetylase.
Isoform Selectivity of Identified HDAC Inhibitors
The 15 potential HDAC inhibitors were profiled at 20 µM for isoform selectivity with a panel of fluorogenic assays against 10 class I and II HDAC isoforms (
Fig. 3
). The known HDAC inhibitors such as trichostatin A, vorinostat, and scriptaid inhibited activities of all isoforms, whereas resveratrol partially inhibited HDAC2 and HDAC6 at 20 µM. Amlexanox inhibited more than half of enzyme activities of HDAC3, HDAC10, and HDAC11. Axitinib inhibited HDADC6 the most. In addition to HDAC3, isoliquiritigenin also weakly inhibited many class I and II HDAC enzymes at 20 µM. Several potential HDAC inhibitors, including diphenyl isophthalate, ensulizole, febuxostat, and leflunomide, selectively inhibited activity of HDAC3. Nafamostat had high basal fluorescence when excited at 360 nm, and therefore red-shifted versions of fluorogenic assays were used to confirm its anti-HDAC activity. The results showed that nafamostat was more selective in inhibiting HDAC4, HDAC5, and HDAC8 than other HDAC isoforms (
Fig. 4A
,
B
and
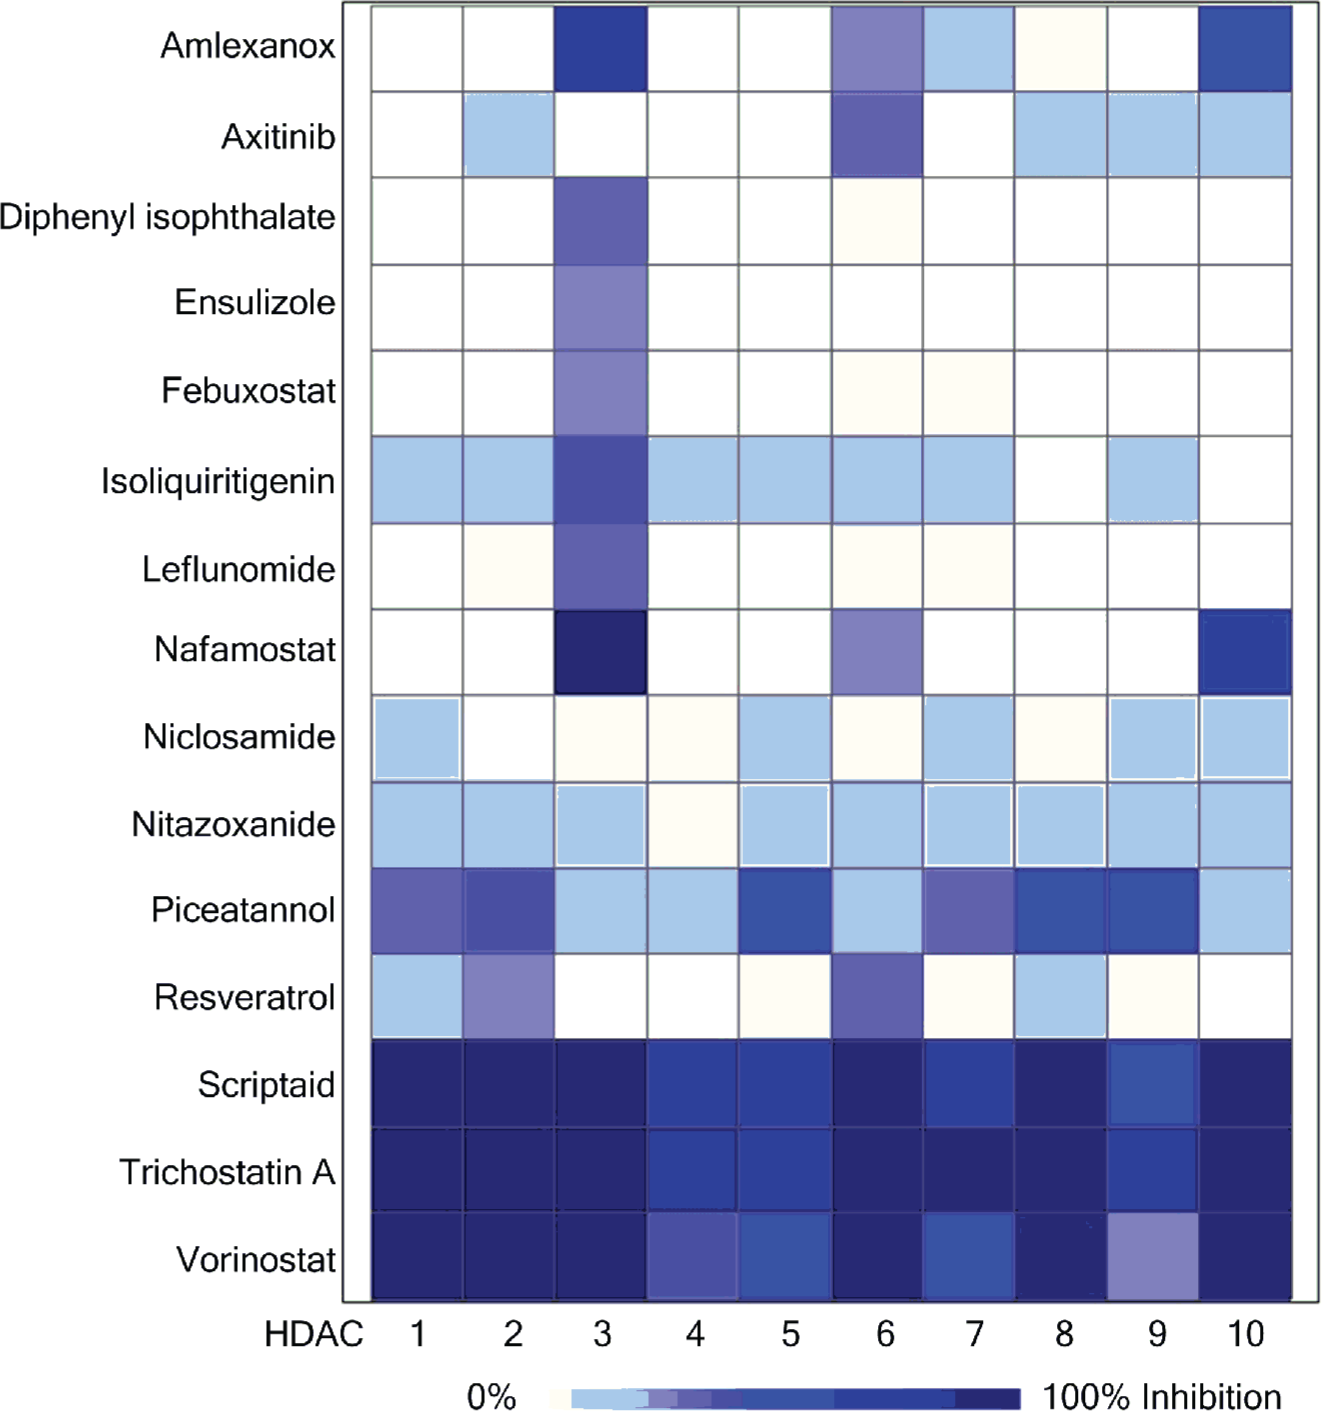
Biochemical profiling of isoform selectivity of histone deacetylase (HDAC) inhibitor hits. In total, 20 µM of the 15 selected potential HDAC inhibitors was tested with individual recombinant HDAC class I and II enzymes and their corresponding fluorogenic substrates. Efficacy values were averaged from three replicates and shown in heat map.
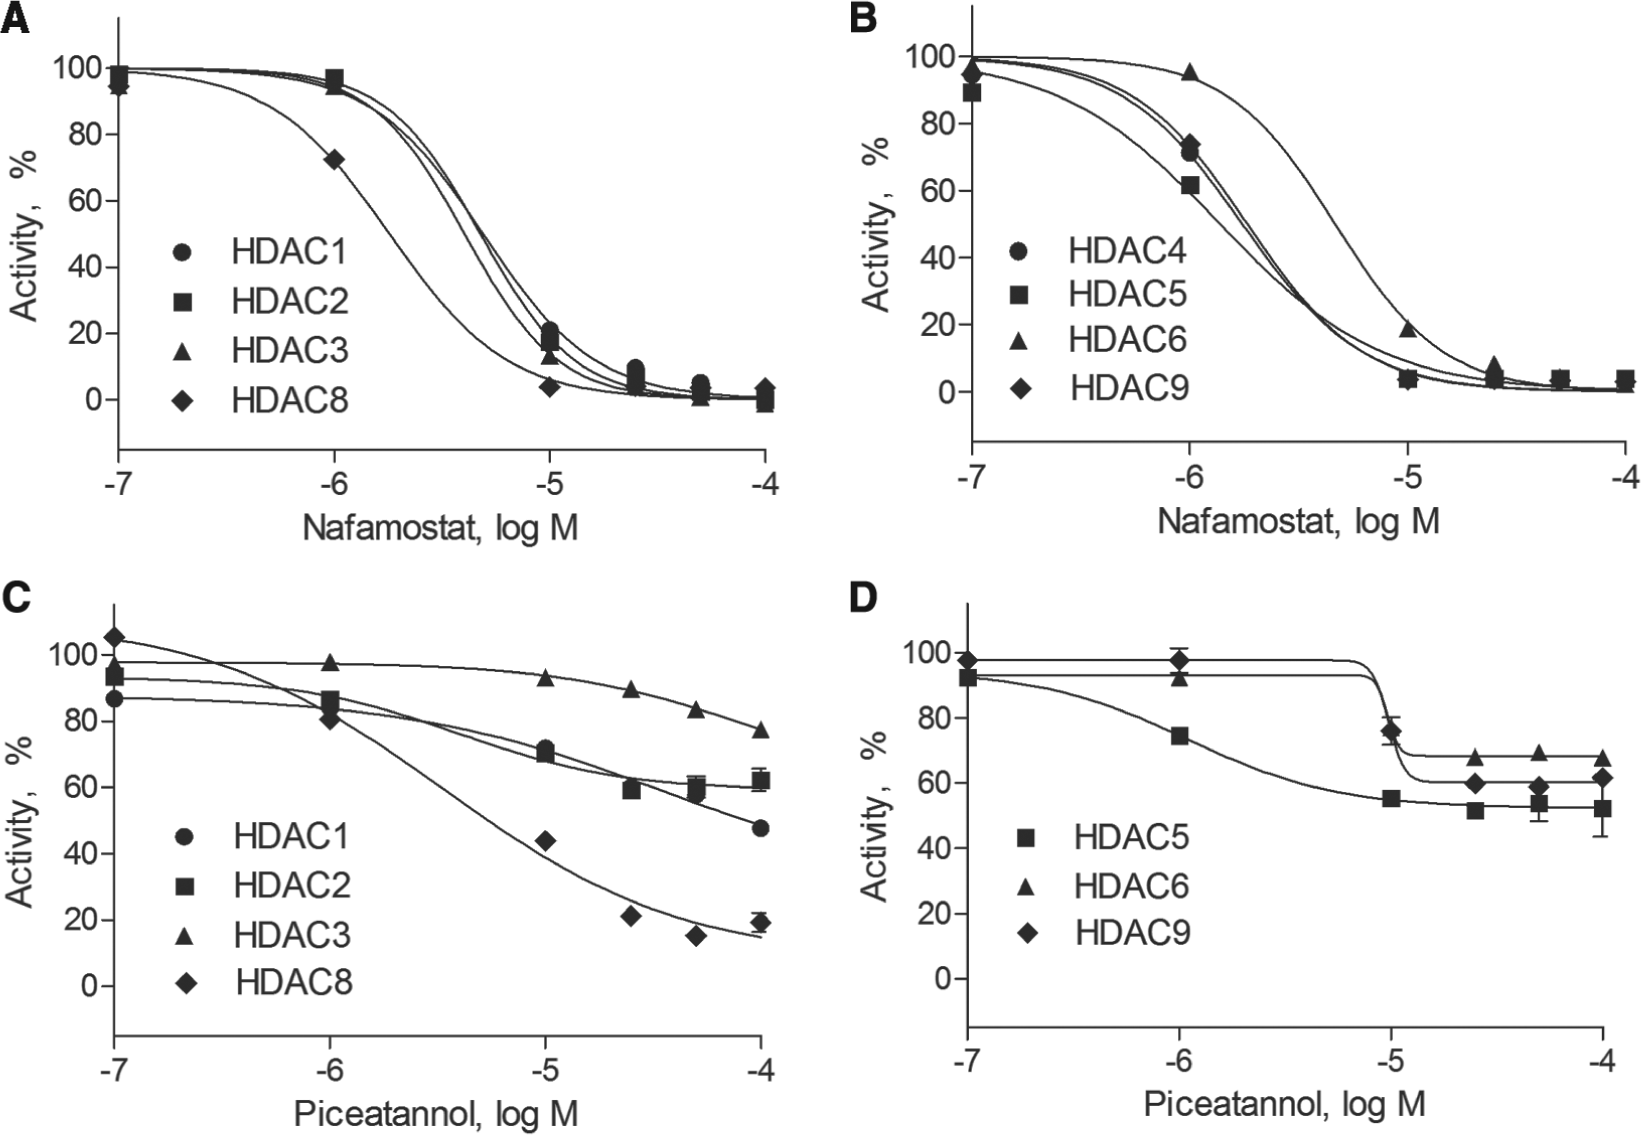
Confirmation of nafamostat and piceatannol identified by both cell-based and biochemical-based histone deacetylase (HDAC) assays. (
Discussion
In this study, we described a workflow for the identification of approved and investigational drugs that inhibit HDAC class I/II activity. The HDAC-Glo I/II assay was first developed as a biochemical, bioluminogenic HDAC activity assay that measures enzyme activity of individual class I and II HDAC isoforms. 6 We successfully optimized it to a cell-based assay in 1536-well formats to measure endogenous HDAC I/II activity in five human cell lines, including colon cancer HCT116 cells and human neural stem cells. All cell lines tested with the HDAC-Glo I/II assay yielded an excellent S/B ratio, CV, and Z′ factor values for HTS. The HDAC-Glo I/II assay in HCT116 and HEK239 cells identified several known HDAC class I and II inhibitors as shown in the validation results of the two epigenetic libraries, with a high correlation coefficient (R2 = 0.80) in the IC50 values of each cell line, respectively.
The HDAC-Glo I/II assay identified over 80% of known HDAC inhibitors from Cayman Chemical’s and SelleckChem’s epigenetic libraries. Most active compounds identified from the two libraries showed comparable potencies and efficacies in decreasing HDAC-Glo I/II signals in both HCT116 and HEK293 cells. Because the highest compound concentration tested in the HDAC-Glo I/II assay was 46 µM for the epigenetic libraries, the three known HDAC inhibitors with millimolar potencies—sodium butyrate, sodium phenylbutyrate, and valproic acid
15
—did not show concentration-dependent inhibition in the HCT116 and the HEK293 assays (
The qHTS results of the NPC library of approximately 2500 compounds demonstrate the potential of applying the HDAC-Glo I/II assay in screening large numbers of compounds. The HDAC-Glo I/II HCT116 assay identified a group of compounds as potential inhibitors of HDAC class I and/or II enzymes. As shown in the cherry-pick confirmation assay data ( Table 1 ), most of the HCT116-active compounds also reduced HDAC-Glo I/II signals in hNSCs without exerting apparent cytotoxicity to either cell lines after a 1-h compound treatment. All 15 compounds selected from the cherry-pick confirmation were also confirmed for their ability to decrease HDAC-Glo I/II signals in HCT116 cells ( Table 2 ). Moreover, the qHTS results showed that the cell-based HDAC-Glo assay can identify diverse chemical structural classes. In addition to hydroxamate-based HDAC inhibitors (e.g., trichostatin A and vorinostat), benzimidazoles (e.g., albendazole oxide and thiabendazole), guanidine acids (e.g., camostat and nafamostat), and stilbenes (e.g., piceatannol and resveratrol) also inhibited HDAC activity. It would be interesting to further characterize the structure-activity relationships (SARs) of these novel structural classes using the HDAC-Glo I/II assay and other secondary assays.
The fluorogenic HDAC biochemical assays were useful to confirm anti-HDAC activity and reveal isoform selectivity of the active compounds identified by the cell-based HDAC-Glo I/II assays. The fluorogenic assays were sensitive to the three known pan-HDAC inhibitors with submicromolar potencies—scriptaid, trichostatin A, and vorinostat—as shown by over 80% inhibitions at 20 µM against all class I and II HDAC enzymes. In general, the efficacy values at a 20-µM compound concentration were higher in the cell-based HDAC-Glo I/II assays than the isoform-specific biochemical assays, indicating potentially weaker IC50 values against individual HDAC isoforms (
Table 2
and
Fig. 3
). Several novel compounds such as ensulizole and febuxostat identified by the cell-based HDAC-Glo assay were selective to HDAC3. Interestingly, nafamostat inhibited HDAC activity more potently in the cell-based HDAC-Glo assays than the isoform-specific HDAC biochemical assays. On the contrary, HDAC inhibition by piceatannol was at least twofold more potent in the fluorogenic assays of HDAC1, HDAC5, and HDAC8 than the cell-based HDAC-Glo assays (
To conclude, the qHTS workflow described in this study is useful to rapidly identify compounds that inhibit endogenous class I and II HDACs in physiologically relevant cell backgrounds. We have shown that the HDAC-Glo I/II assay is suitable for primary screening of large chemical libraries in cell lines of interest. Compared to primary screening at a single concentration, the qHTS approach used in the current study has a great advantage in reducing false-positive and false-negative rates from the primary screening. The secondary assays provide additional mechanistic insights to HDAC functionalities, such as isoform selectivity. Because of the critical roles of HDACs in numerous diseases, we envision that the workflow described in our report will greatly accelerate the speed of drug discovery of HDAC inhibitors for cancer and neurodegenerative diseases.
Footnotes
Acknowledgements
We thank Danielle VanLeer and Paul Shinn for compound management, as well as Yiming Chen, Henry Zhu, and Kevin Kurtz for technical advice and biochemical profiling experiments.
Declaration of Conflicting Interests
The author(s) declared no potential conflicts of interest with respect to the research, authorship, and/or publication of this article.
Funding
The author(s) disclosed receipt of the following financial support for the research, authorship, and/or publication of this article: This work was supported by Intramural Research Program of the National Center for Advancing Translational Sciences (NCATS), National Institutes of Health (NIH), and the interagency agreement IAG #NTR 12003 from the National Institute of Environmental Health Sciences/Division of the National Toxicology Program to the NCATS/NIH.
References
Supplementary Material
Please find the following supplemental material available below.
For Open Access articles published under a Creative Commons License, all supplemental material carries the same license as the article it is associated with.
For non-Open Access articles published, all supplemental material carries a non-exclusive license, and permission requests for re-use of supplemental material or any part of supplemental material shall be sent directly to the copyright owner as specified in the copyright notice associated with the article.