
Abstract
N-methyl-D-aspartate receptors (NMDARs) are ionotropic glutamate receptors that play an important role in synaptic plasticity and learning and memory formation. Malfunctioning of NMDARs, in particular the reduction in NMDAR activity, is thought to be implicated in major neurological disorders. NMDAR positive allosteric modulators (PAMs) represent potential therapeutic interventions for restoring normal NMDAR function. We report a novel screening approach for identification and characterization of NMDAR-PAMs. The approach combines high-throughput fluorescence imaging with automated electrophysiological recording of glutamate-evoked responses in HEK-293 cells expressing NR1/NR2A NMDAR subunits. Initial high-throughput screening (HTS) of a chemical library containing >810,000 compounds using a calcium flux assay in 1536-well plate format identified a total of 864 NMDAR-PAMs. Concentration response determination in both calcium flux and automated electrophysiological assays found several novel chemical series with EC50 values between 0.49 and 10 µM. A small subset (six series) was selected and analyzed for pharmacological properties, subtype selectivity, mode of action, and activity at native NMDARs. Our approach demonstrates the successful application of HTS functional assays that led to identification of NMDAR-PAMs providing the foundation for further medicinal chemistry work that may lead to novel therapies for treatment of cognitive impairment associated with Alzheimer’s disease and schizophrenia.
Introduction
N-methyl-D-aspartate receptors (NMDARs) are an important group of ligand-gated ion channels within the large family of excitatory ionotropic glutamate receptors characterized by a specific molecular composition and having unique pharmacological and functional properties. 1 NMDARs are widely expressed in the central nervous system and are known to be associated with numerous physiological and pathological processes. The high permeability to calcium ions, modulation by magnesium, and membrane potential renders NMDARs essential in the induction of synaptic plasticity, a phenomenon believed to be the main cellular mechanism underlining learning and memory formation in the central nervous system.1,2
NMDAR hypofunction is hypothesized to be the main causative mechanism associated with cognitive impairment in schizophrenia. 3 In support of the above hypothesis, numerous studies have identified mutations in the NR2A and NR2B subunits in patients with various neurodevelopmental phenotypes: mental retardation, 4 epilepsy,4,5 and schizophrenia. 6 A reduction in the expression of NMDARs has also been reported in postmortem brain tissue from Alzheimer’s disease7,8 or in aged patients. 9 Additional demonstration of the NMDA hypofunction hypothesis comes from pharmacological studies in the human population. Drugs that inhibit the NMDARs (i.e., phencyclidine [PCP] and ketamine) are known cognitive disruptors. A single dose of ketamine administered to human volunteers produces cognitive deficits and marked psychotic effects.10,11
All of the above-referenced studies and other broader experimental and clinical data available in the literature substantiate the therapeutic hypothesis that enhancement or restoration of the normal NMDAR function would be beneficial for ameliorating the cognitive symptoms associated with Alzheimer’s disease and schizophrenia.
Most of the previous screening campaigns targeting NMDARs were aimed at identification of NMDA antagonists.12–15 Various methodologies were used for screening and characterization of the NMDA modulators, including radioligand binding assays, 12 calcium flux assays,13–15 and/or Xenopus laevis oocyte electrophysiology.16,17 By contrast, the search for NMDA potentiators appears to be sporadic, generally performed on a smaller scale, and linked sometimes with serendipitous discovery of potentiating properties of known molecules.17–19
Here we present the design and execution of a high-throughput screening (HTS) campaign aimed at identification of novel NMDAR potentiators by using functional screening assays. While the initial HTS was based on a calcium flux FLIPR 1536-well formatted assay, we subsequently enabled and confirmed the HTS output using a high-throughput patch-clamp assay. In addition to the HTS, we provide an example data package for demonstrating the mechanism of action and activity at native receptors of a representative compound discovered during this successful effort.
Materials and Methods
Compounds
The NMDA-selective antagonists Ro 25-6981 and NVP-AAM077, as well as the SGE-201 compounds, were synthesized internally. Compounds stock solutions were prepared in DMSO and diluted into assay buffer prior to the experiment.
Cells Lines
HEK-293 cells stably transfected with the GRIN1 (NM_ 007327.2) and GRIN2A (NM_000833.2) or GRIN2B (NM_ 000834.3) genes where used throughout this study. For simplicity, the old nomenclature for NMDARs is used when referring to the type of receptor subtype (i.e., GRIN1 = NR1, GRIN2A = NR2A, and GRIN2B = NR2B). The cell lines were obtained from ChanTest Co. (cat. CT6120 and CT6121, Cleveland, OH) for the NR1/NR2A and NR1/NR2B cell lines, respectively. Expression of a functional receptor is achieved upon tetracycline or doxycycline induction. Parental HEK-293 cells were used for counterscreen.
Cells were routinely cultured at 37 °C and 95% relative humidity. Unless otherwise indicated, all cell culture reagents were sourced through Life Technologies (Carlsbad, CA). Cells were cultured in DMEM, 10% TET-FBS, 20 mM HEPES, 500 μg/mL G418, 5 μg/mL blasticidin, and 100 μg/mL Zeocin.
For automated electrophysiology experiments, a further clonal selection on the NR2A cells from Chantest was performed in-house and the best expresser was further cotransfected with excitatory amino acid transporter 1 (EAAT-1).
FLIPR 1536-Well-Format Assay
Cultured cells were plated in assay media containing DMEM (no glutamine), 10% TET FBS, 20 mM HEPES, 0.5 μg/mL doxycycline, and 10 μM MK-801 in T-175 flasks for 24 h.
All assays were run in Corning 1536-well clear-bottom plates (part 7338, Corning, Inc., Corning, NY). Fluo-2 “no wash” calcium assay detection kits were used for all FLIPR assays (Teflabs, Austin, TX), which included addition of 250 mM probenecid (pH 8) (Sigma, St. Louis, MO) while reading on the fluorescence imaging plate reader (FLIPR, Molecular Devices, Sunnyvale, CA). To minimize glutamate activity prior to the actual read, the cells were incubated in the Fluo2 dye in the presence of 10 μM MK-801 in a tube for 1.5 h. This is followed by washing the cells in Hank’s balanced salt solution (HBSS), 20 mM HEPES, and 2.5 mM probenecid. The cells were resuspended in wash buffer and plated in the 1536-well plates at 5 × 10⁵ cells/mL. All additions of compound and controls were accomplished using a Kalypsys/GNF system 1536-well formatted pintool. The glutamate EC20 and positive allosteric modulator (PAM) controls were added by a separate integrated 1536 pintool mounted on the FLIPR Tetra. Cell and reagent additions were performed by a fully automated Kalypsys/GNF robotic screening platform at the Scripps Research Institute Molecular Screening Center (Jupiter, FL). The final HTS protocol is summarized in
The counterscreen utilized parental HEK cells using a standard FLIPR protocol to determine off-targets and artifacts of the assay. The cells were plated in 1536-well plates overnight at 2000 cells/well in assay media containing DMEM (no glutamine), 10% Tet FBS, and 20 mM HEPES. The next day, 2 μL Fluo2 dye was added to cells and incubated for 1 h at 37 °C. The compounds were transferred in the FLIPR Tetra at 50 nL and a baseline read was done. Following the baseline read, the PAM stimulus was added similar to the NMDA protocol, by transferring 50 nL ATP at EC20 along with controls.
Screening Data Acquisition, Normalization, Representation, and Analysis
Kinetic data were acquired by the FLIPR at the rate of 1 Hz. PAM mode kinetic data were saved as data files using the FLIPR software. Data were obtained by first taking a basal read for 5 s prior to compound addition (RAW1). After compound addition, the kinetic read was taken immediately following glutamate stimulus, or ATP in the counterscreen (RAW2). Each well output was calculated as RAW2/RAW1 (ratio). All data files were uploaded into the Scripps Institutional HTS database (Symyx Technologies, Santa Clara, CA) for plate QC and hit identification. Activity for the PAM mode was normalized on a per-plate basis using the following equation using the ratio of each well:
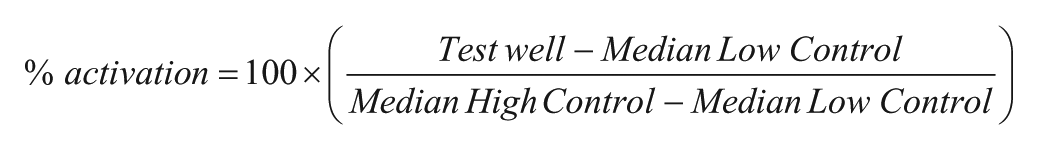
The test well refers to those that contain test compounds. The low-control wells contain glutamate at EC20. The high-control wells contain glutamate at EC100.
In each case, a Z′ value greater than 0.5 was required for a plate to be considered valid. During the primary screen, test compounds from the library were screened in singlicate at a final nominal test concentration of 9.6 µM (final DMSO concentration of 0.75%). For each mode, the hit cutoff used to qualify active compounds was calculated as the interval cutoff. Four values were calculated to determine an interval based cutoff: (1) the average percent activity of all high controls tested plus three times the standard deviation of the high controls, (2) the average percent activity of all low controls tested minus three times the standard deviation of the low controls, (3) the average percent activity of all compounds tested between 1 and 2, and (4) three times their standard deviation. The sum of two of these values, 3 and 4, was used as a cutoff parameter. Any compound that exhibited greater percent activity than the cutoff parameter was declared active.
The active compounds were tested in triplicate at the same single concentration as the primary screen. The counterscreen using parental HEK cells described was also tested in triplicate at a single concentration (9.9 µM). The compounds that were found active in the NMDA assay and inactive in the HEK parental cells were chosen for concentration–response curve determination. The concentration–response curves were run utilizing the same protocols, but the compounds were tested in triplicate at a 10-point 1:3 dilution starting at 96 µM concentration.
Concentration–response curves were fitted with adjustable baseline using Assay Explorer software (Symyx Technologies). The results of the HTS campaign are summarized in Figure 1D .
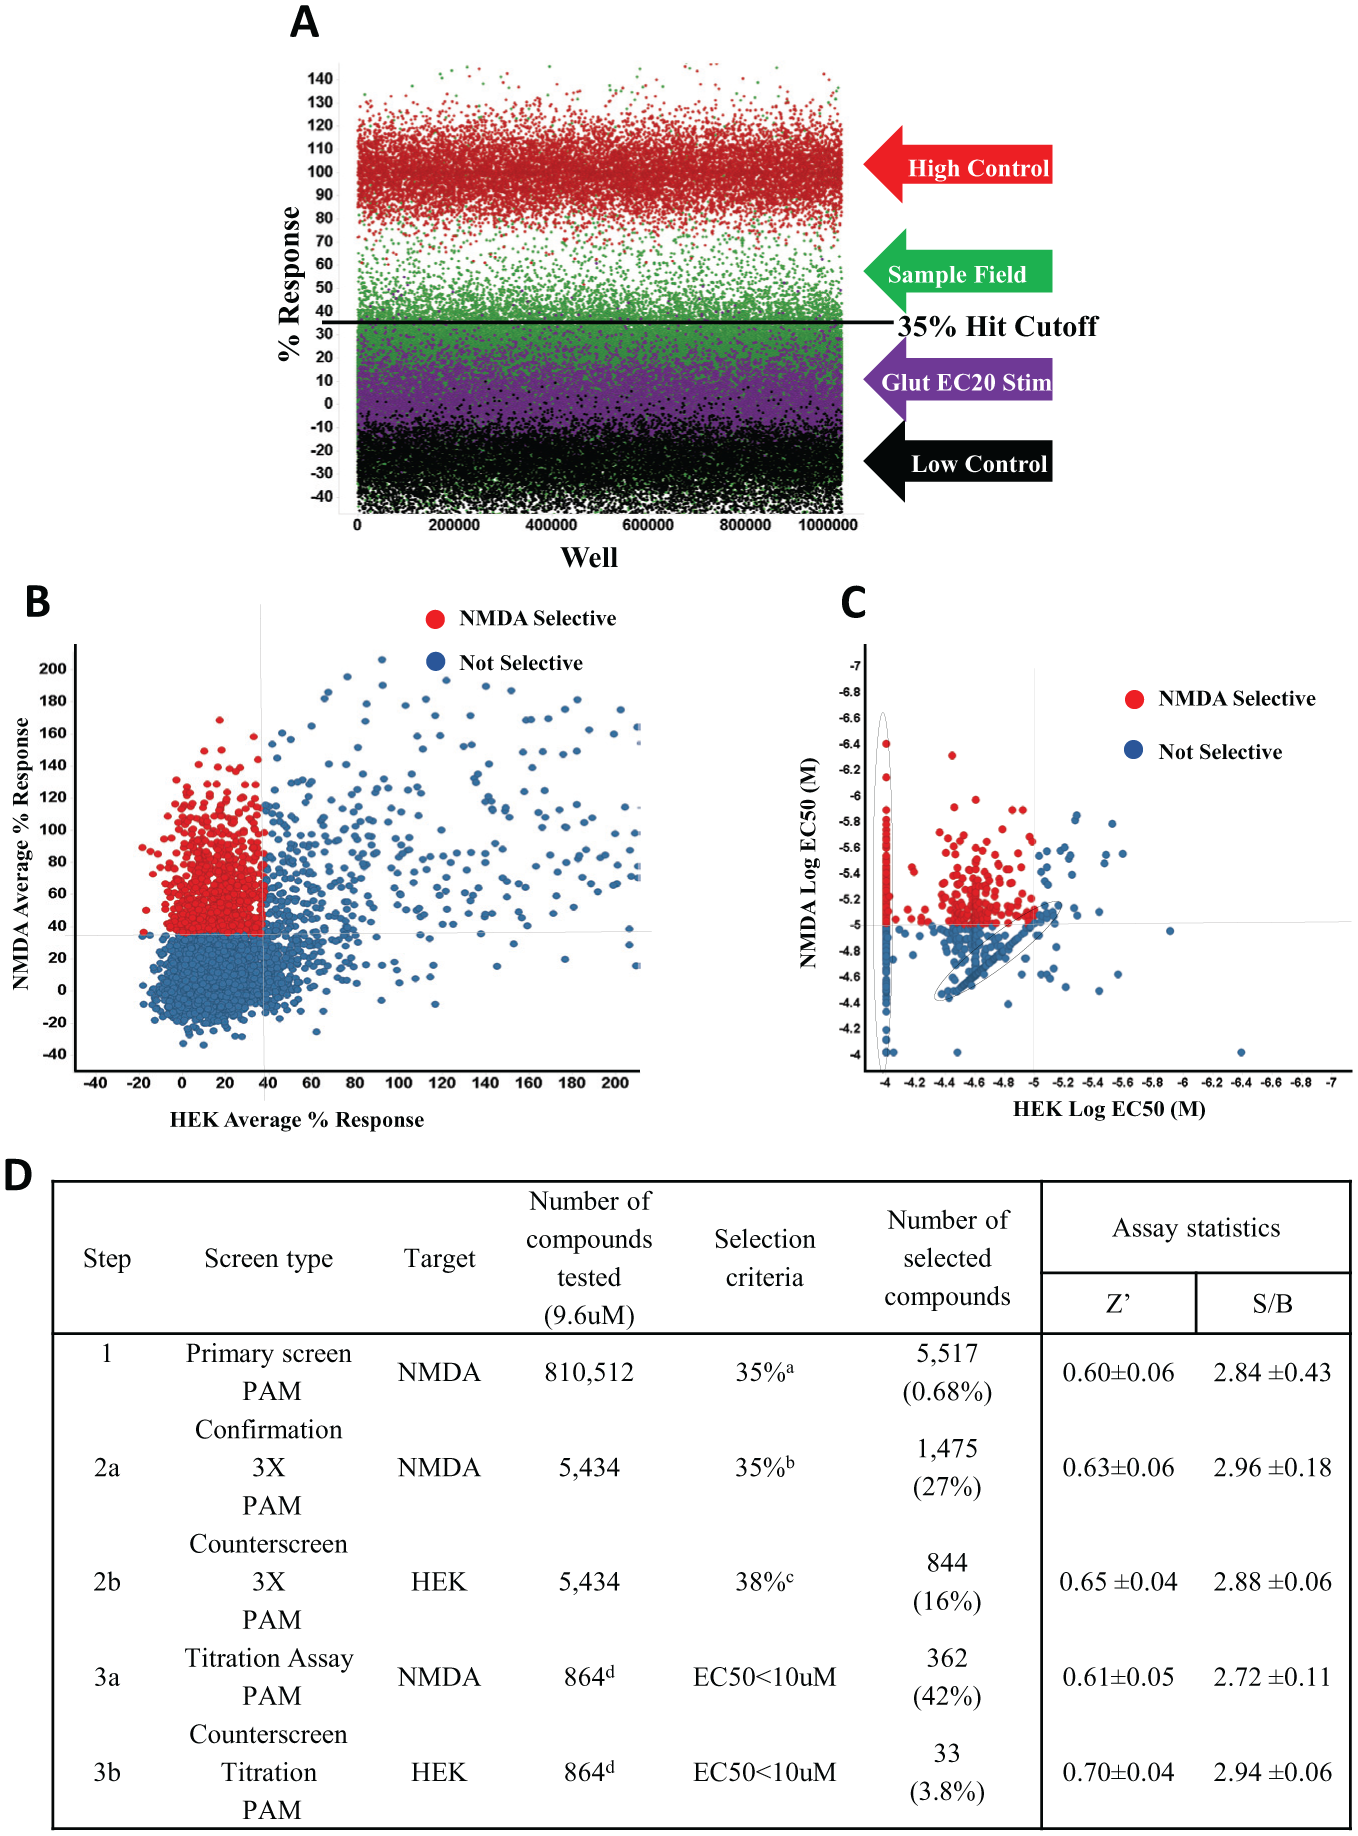
NMDA-PAM HTS campaign. A total of 810,512 compounds were tested at 9.6 µM nominal concentration in the NMDA potentiator HTS assay. (
FLIPR 384-Well-Format Assay
Cells were routinely grown as detailed above. Eighteen hours prior to the experiment, cells were harvested and seeded on poly-D-lys 384-well plates (Corning 356663) at a density of 30,000 cells/well using DMEM without glutamine (Sigma 5671), supplemented with 10% TET–fetal bovine serum (FBS, Sigma F2442), 20 mM HEPES, 100 units/mL penicillin, and 100 mg/mL streptomycin (Gibco, Carlsbad, CA). In order to prevent glutamate toxicity, cells were induced with 1 µg/mL doxycycline in the presence of 10 µM MK-801 (Sigma M107), both added to the previously described cell plating medium.
Calcium influx through the receptor was measured as relative light units (RLUs) using the FLIPR Tetra and the Fluo-4 NW Kit (Molecular Devices). On the day of the experiment, medium was removed and cells loaded with 20 µL of dye prepared in HBSS with Ca+2 and Mg+2 (Gibco 14025) with 20 mM Hepes, 2.5 mM probenecid (Molecular Probes P36400, Invitrogen, Grand Island, NY), and 10 µM MK-801. After 1 h of incubation at room temperature (RT), dye was removed and cells were gently washed with 20 µL of wash buffer composed of HBSS without Ca+2 and Mg+2 (Sigma H6648), 20 mM HEPES, and 5 mM probenecid (pH 7.1–7.2).
First Addition Plates or Compound Plates
Compounds in 10 mM DMSO stock were serially diluted 1:3 in DMSO using Corning 3657 plates and a Tecan Freedom Evo platform. Compounds were then further diluted 1:100 in assay buffer composed of HBSS without Ca+2 and Mg+2, 20 mM HEPES, and 0.06% BSA (Gibco 15260-037).
Second Addition Plate or Agonist Plate
Glutamate was prepared by diluting the appropriate amount from the original 100 mM stock (Tocris 0218, prepared in sodium hydroxide) into a glycine buffer composed of HBSS without Ca+2 and Mg+2, 20 mM HEPES, 6.25 mM calcium chloride (Sigma C5080), and 25 µM glycine (Sigma G8898). EC20 was used to test the potentiation profile of the compounds. EC20 and EC100 of glutamate were used as minimum and maximum response controls, respectively.
FLIPR Assay
Experiments were run adding first 10 µL from the first addition plate onto the cell plate (with 20 µL of buffer already in it) and then 20 µL from the second addition plate after a 3 min incubation. The response to the glutamate addition was monitored for another 3 min.
Data Analysis
The difference between the maximum and the minimum (max – min) fluorescence reached during the second read interval was used for data analysis. Data were normalized as described for the 1536 assay. EC50 and maximum stimulation values were determined from concentration–response curves at 10 distinct concentrations. The four-parameter logistic model was used to fit each data set.
Automated Patch-Clamp Assay
Automated electrophysiology experiments were performed by using the Ion Works Barracuda (IWB) system (Molecular Devices). Cells were cultured to approximately 70%–80% confluency, and on the day prior to the experiment, channel expression was induced with 10 ng/mL doxycyclin in the presence of 1 mM ketamine to reduce the glutamate toxicity. For cell isolation, the cells were rinsed twice with Dulbecco’s phosphate-buffered saline (D-PBS) without calcium and magnesium, followed by 5 min incubation in 3 mL of TrypLE. Ten milliliters of media supplemented with 0.1 mM AP5 was added, and cells were triturated and pelleted by centrifugation for 5 min at 1000 rpm. The supernatant was aspirated and the cells were resuspended in 5 mL external buffer containing 0.1 mM AP5.
The external solution used for the IWB recordings was HBSS supplemented with 20 mM HEPES and with pH adjusted to 7.4 using NaOH. The internal solution was (in micromoles): 90 K gluconate, 40 KCl, 3.2 MgCl2, 3.2 EGTA, and 5 HEPES, with pH adjusted to 7.2 using KOH. The perforation agent amphotericin B was prepared as a 28 mg/mL stock solution in DMSO on the day of the experiment and added to the internal solution at a concentration of 0.1 mg/mL.
IWB PPC plates were primed with intracellular and extracellular buffer, and 9 µL of cells (5 × 10⁶ cells/mL) was added to each well by the instrument. Just prior to cell addition, the solution in the plenum (intracellular solution) and in the wells (extracellular solution) was replaced with fresh solution. Electrical access was established by 8 min incubation with amphotericin B. The sampling rate throughout the voltage protocol was 1 kHz, and cells were voltage clamped at −70 mV. Compound was added during the first addition (10 µL at 2 µL/s) and agonist plus compound during the second addition (10 µL at 5 µL/s) after 2 min compound incubation.
Data acquisition and reduction were performed using the IWB software (version 2.0.2, Molecular Devices Corporation, Union City, CA). Data were corrected for leak current, and peak current amplitude was calculated by subtracting the average current before agonist addition from the peak current amplitude. Area under the curve (AUC) was calculated in IWB software by integration of initially 30 s after the agonist addition. GraphPad Prism 6.02 (GraphPad Software, San Diego, CA) was used for all further calculations. The concentration–response data were fit using the four-parameter Hill equation; the desensitization rates were fit to single exponentials. Data are reported as mean ± SEM unless otherwise specified.
Results
HTS Screening Campaign
The 384-well NMDA PAM assay was miniaturized to the 1536-well format, resulting in the methods described in
Following the completion of the HTS and further analysis by the chemistry team at Lilly, a set of 406 compounds were identified as actives and transferred to Lilly for further analysis. The follow-up activities at Lilly were aimed initially at (1) confirming the activity of the hits in a similar calcium flux assay (FLIPR 384-format assay) and (2) demonstration of activity in a high-throughput electrophysiological assay (IWB 384 assay).
FLIPR 384-Format Assay
The same stable cell line that was used for HTS at Scripps (NR1/NR2A) was also used to enable a calcium flux assay at Lilly. The initial assay optimization involved running concentration–response curves for the endogenous NMDAR agonist, glutamate. Figure 2A shows representative traces from an experiment where multiple replicates of a glutamate CRC were run in the same 384 plate. The average values and the fit data for this experiment are shown in Figure 2B . An EC50 value of 0.736 µM (n = 16) was obtained upon fitting the data with a four-parameter logistic model.
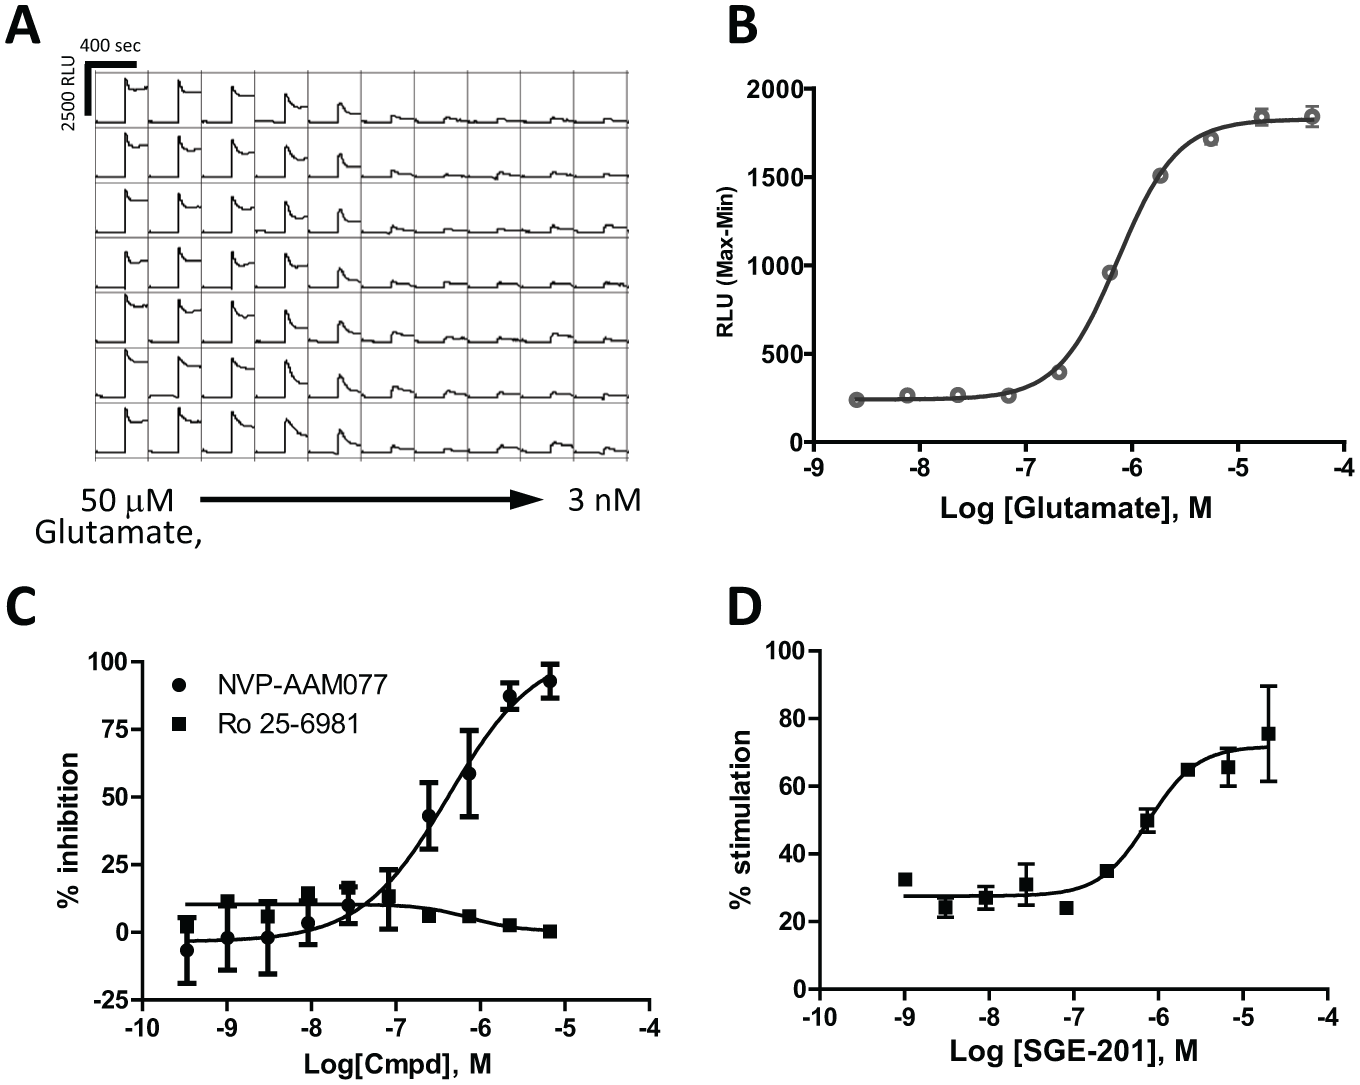
Pharmacological validation of the FLIPR 384 assay. (
Selective pharmacological tools were used for confirming expression of the correct subtype of NR1/NR2A and/or NR1/NR2B receptors in the two stable cell lines used for the follow-up work. Antagonists with selective profiles against the NR1/NR2A and NR1/NR2B were used for characterization of the cells: Ro 25-6981 was described as NR2B selective
1
and NVP-AAM077 with a preference for NR2A, although with activity against NR2B.
1
To test these antagonists, a third addition step was included in the FLIPR experiment in which glutamic acid at EC90 was added and responses measured during 150 s. During this last interval, max-min data were used for the antagonist data analysis. The data obtained for the two selective antagonists on the NR1/NR2A cell line are presented in
Figure 2C
. A summary of the results obtained with the two antagonists in this assay format, as well as in the other assays presented in this study, is shown in
To confirm that the final assay protocol described in the Materials and Methods section could detect known potentiators, we used a recently described NMDAR potentiator: SGE-201. 20 When tested in the presence of BSA (0.06%), this compound yielded an EC50 of 373 nM (±202, n = 5) and a maximum percent stimulation of 56 (±11, n = 5) ( Fig. 2D ). This potency correlates well with the published values of 0.11 µM in response to 10 µM NMDA, as tested in neonatal mouse hippocampal neurons using whole-cell patch-clamp electrophysiology. Similar results were obtained when this compound was tested against the NR1/NR2B subtype with an EC50 of 317 nM and a maximum percent stimulation of 55. Although this assay format can be run in the absence of BSA, we observed that it was required in order to obtain activity with SGE-201, probably due to its intrinsic lipophilic properties.
Ion Works Barracuda Assay
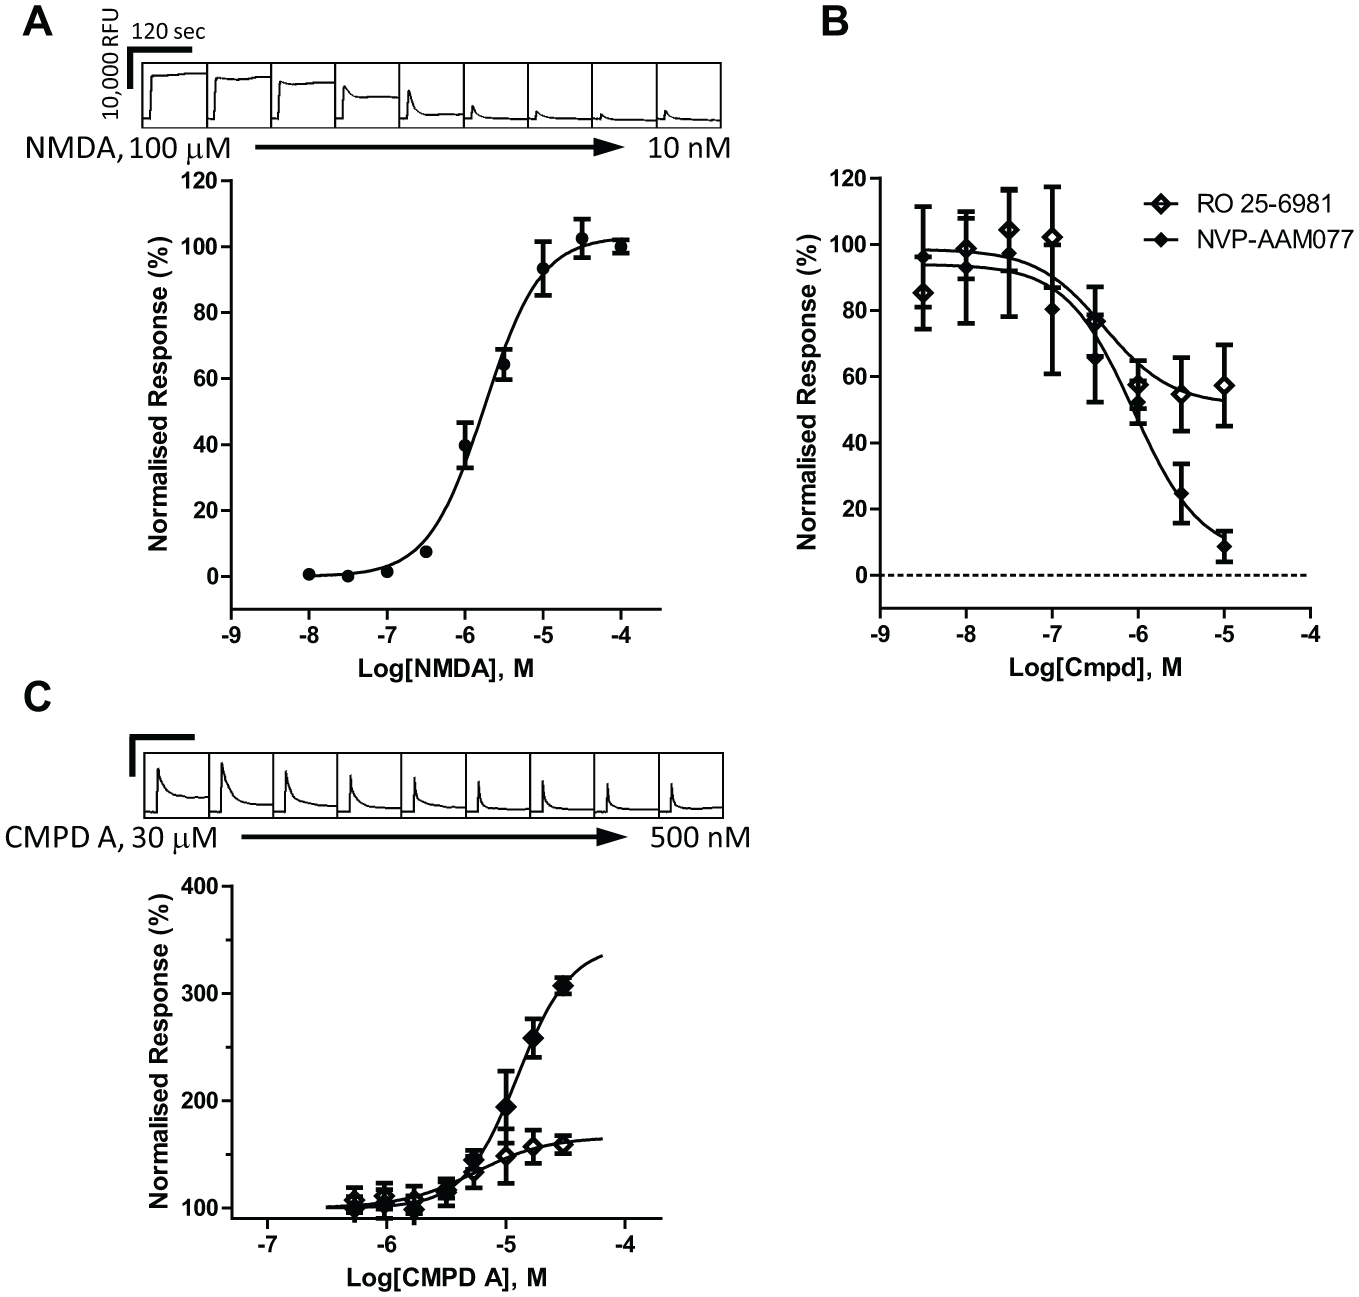
The initial screening and confirmation of activity were performed in an assay format based on indirect measurement of ion channel activation by detection of the influx of calcium ions. Although the specific activity of hits on NMDARs was confirmed by excluding the compounds that were active in the parental cell line, the best modality for confirming real pharmacological activity of a drug at an ion channel is measuring the flow of ions through the channel pore by using patch-clamp electrophysiology. For this purpose, we have enabled and pharmacologically validated a high-throughput patch-clamp assay by using the Ion Works Barracuda automated patch-clamp system. Following the protocols described above, we successfully managed to record robust and highly reproducible NMDAR currents in the NR1/NR2A cell line. Example traces for glutamate-induced currents are shown in
Figures 3A
and
5A
. The currents have a peak amplitude of 3.1 ± 0.2 nA (n = 16) and demonstrate the characteristic activation (t = 193 ± 21 ms, n = 22) and desensitization (t = 1053 ± 305 ms, n = 22) kinetics of NMDARs when recorded with slow-perfusion systems. The very fast peak response (with millisecond kinetics) specific to glutamate ionotropic receptors cannot be resolved in the current format of the assay.
Figure 3B
shows a typical concentration–response curve for glutamate recorded in the IWB assay (EC50 = 1.4 ± 0.3 µM, n = 8). Glutamate currents could be fully blocked by the NR2A-preferring NMDA antagonist NVP-AAM077, with an IC50 value of 0.09 µM (n = 8) (
Fig. 3C
,
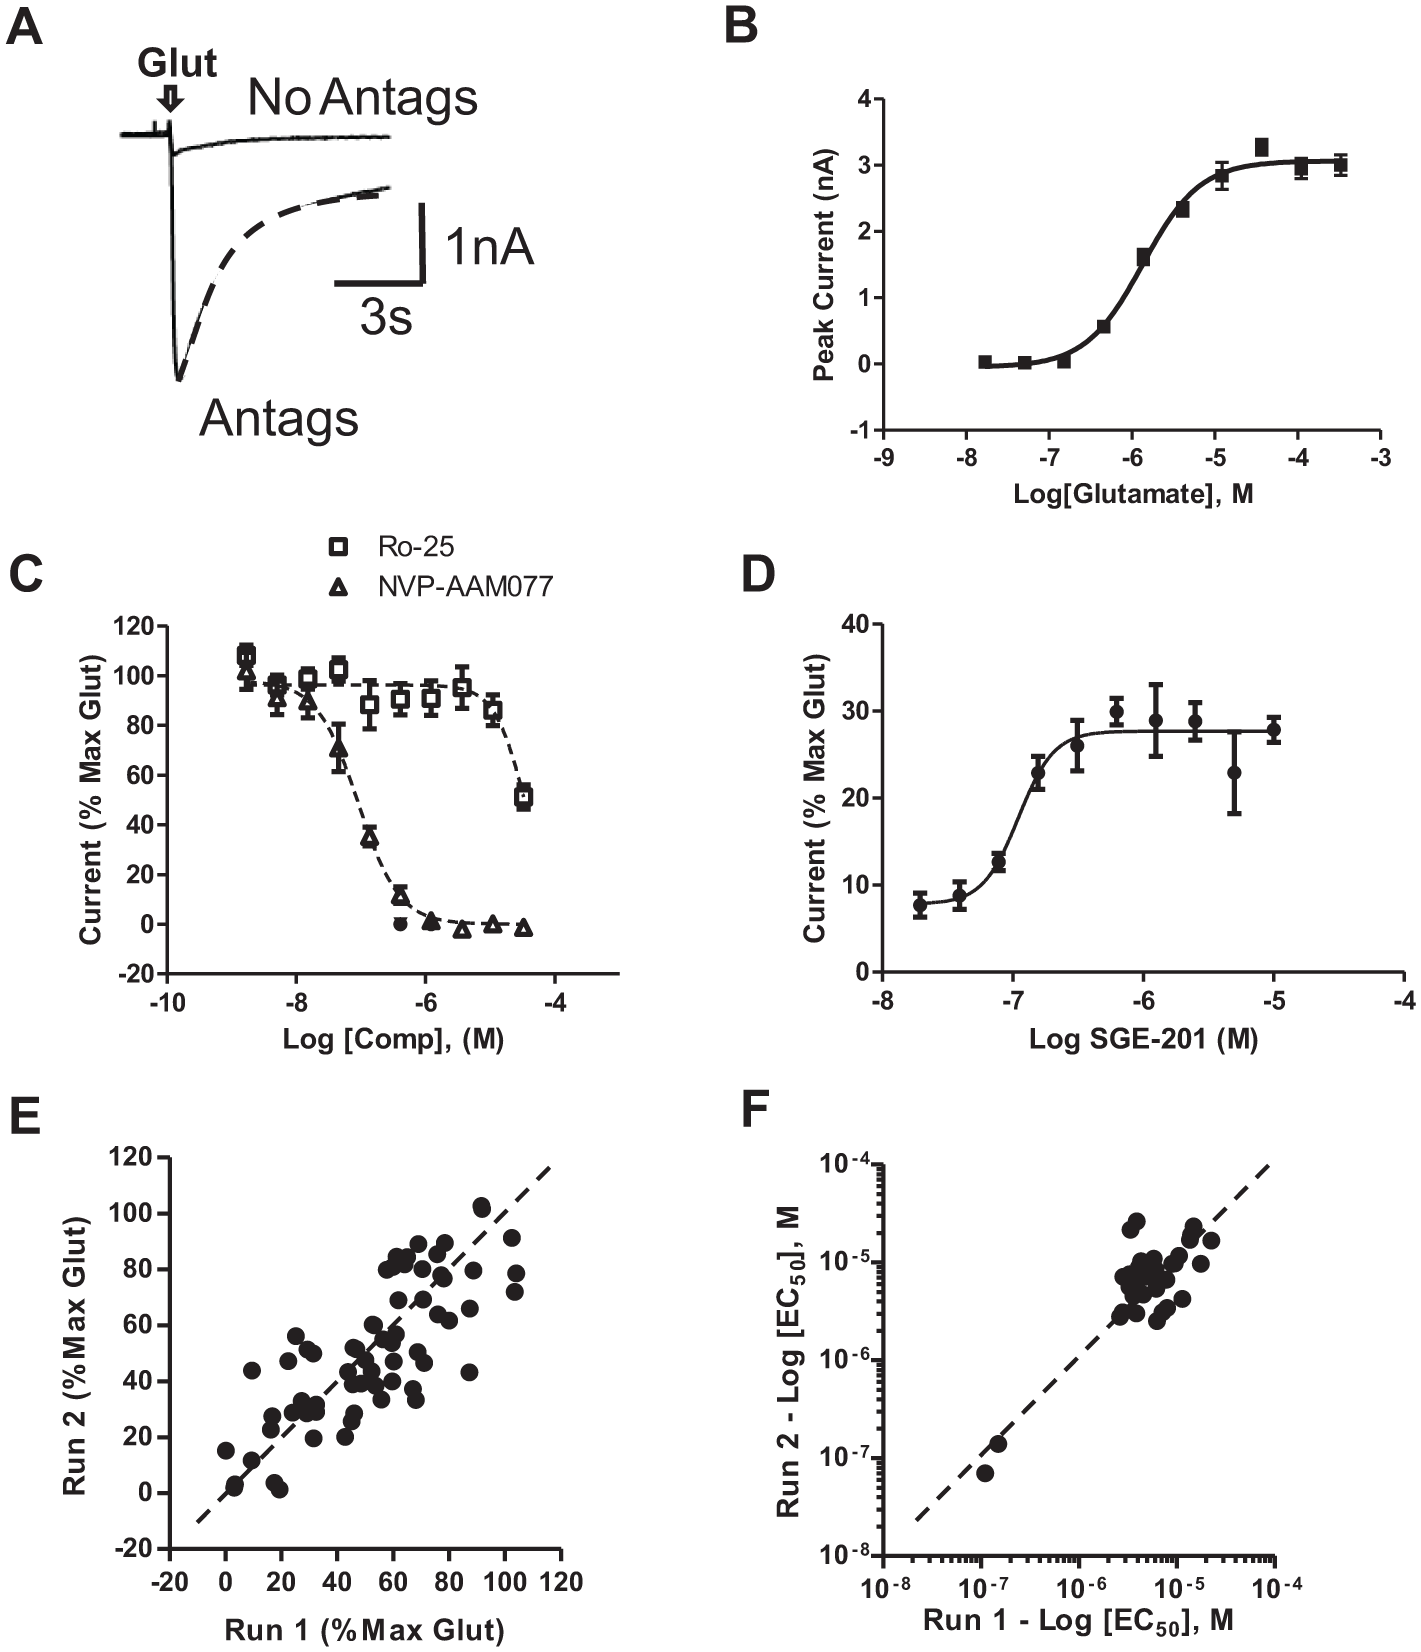
NMDAR currents recorded in PPC mode on Ion Works Barracuda. (
Hit Confirmation
A set of 406 hits selected from the initial HTS campaign were tested in CRC mode (10-point concentration) in both the FLIPR 384 (top concentration 20 µM) and IWB (top concentration 33 µM) assays. The results of this study are presented in Figure 4A–C . Only the compounds that showed an EC50 value of <20 µM for the FLIPR assay and <33 µM in the IWB assay (a total of 119 compounds) are represented on the scatterplot in Figure 4A . The majority of these compounds (83.2%—99 out of 119) have a rather low potency (EC50 > 3 µM). A second parameter that we considered in our effort to select the best compounds to take forward was the efficacy of potentiation. The frequency distribution of efficacy (maximum top stimulation percent) for the set of 119 compounds in Figure 4A is shown as histogram plots in Figure 4B for the FLIPR assay and Figure 4C for the IWB assay.
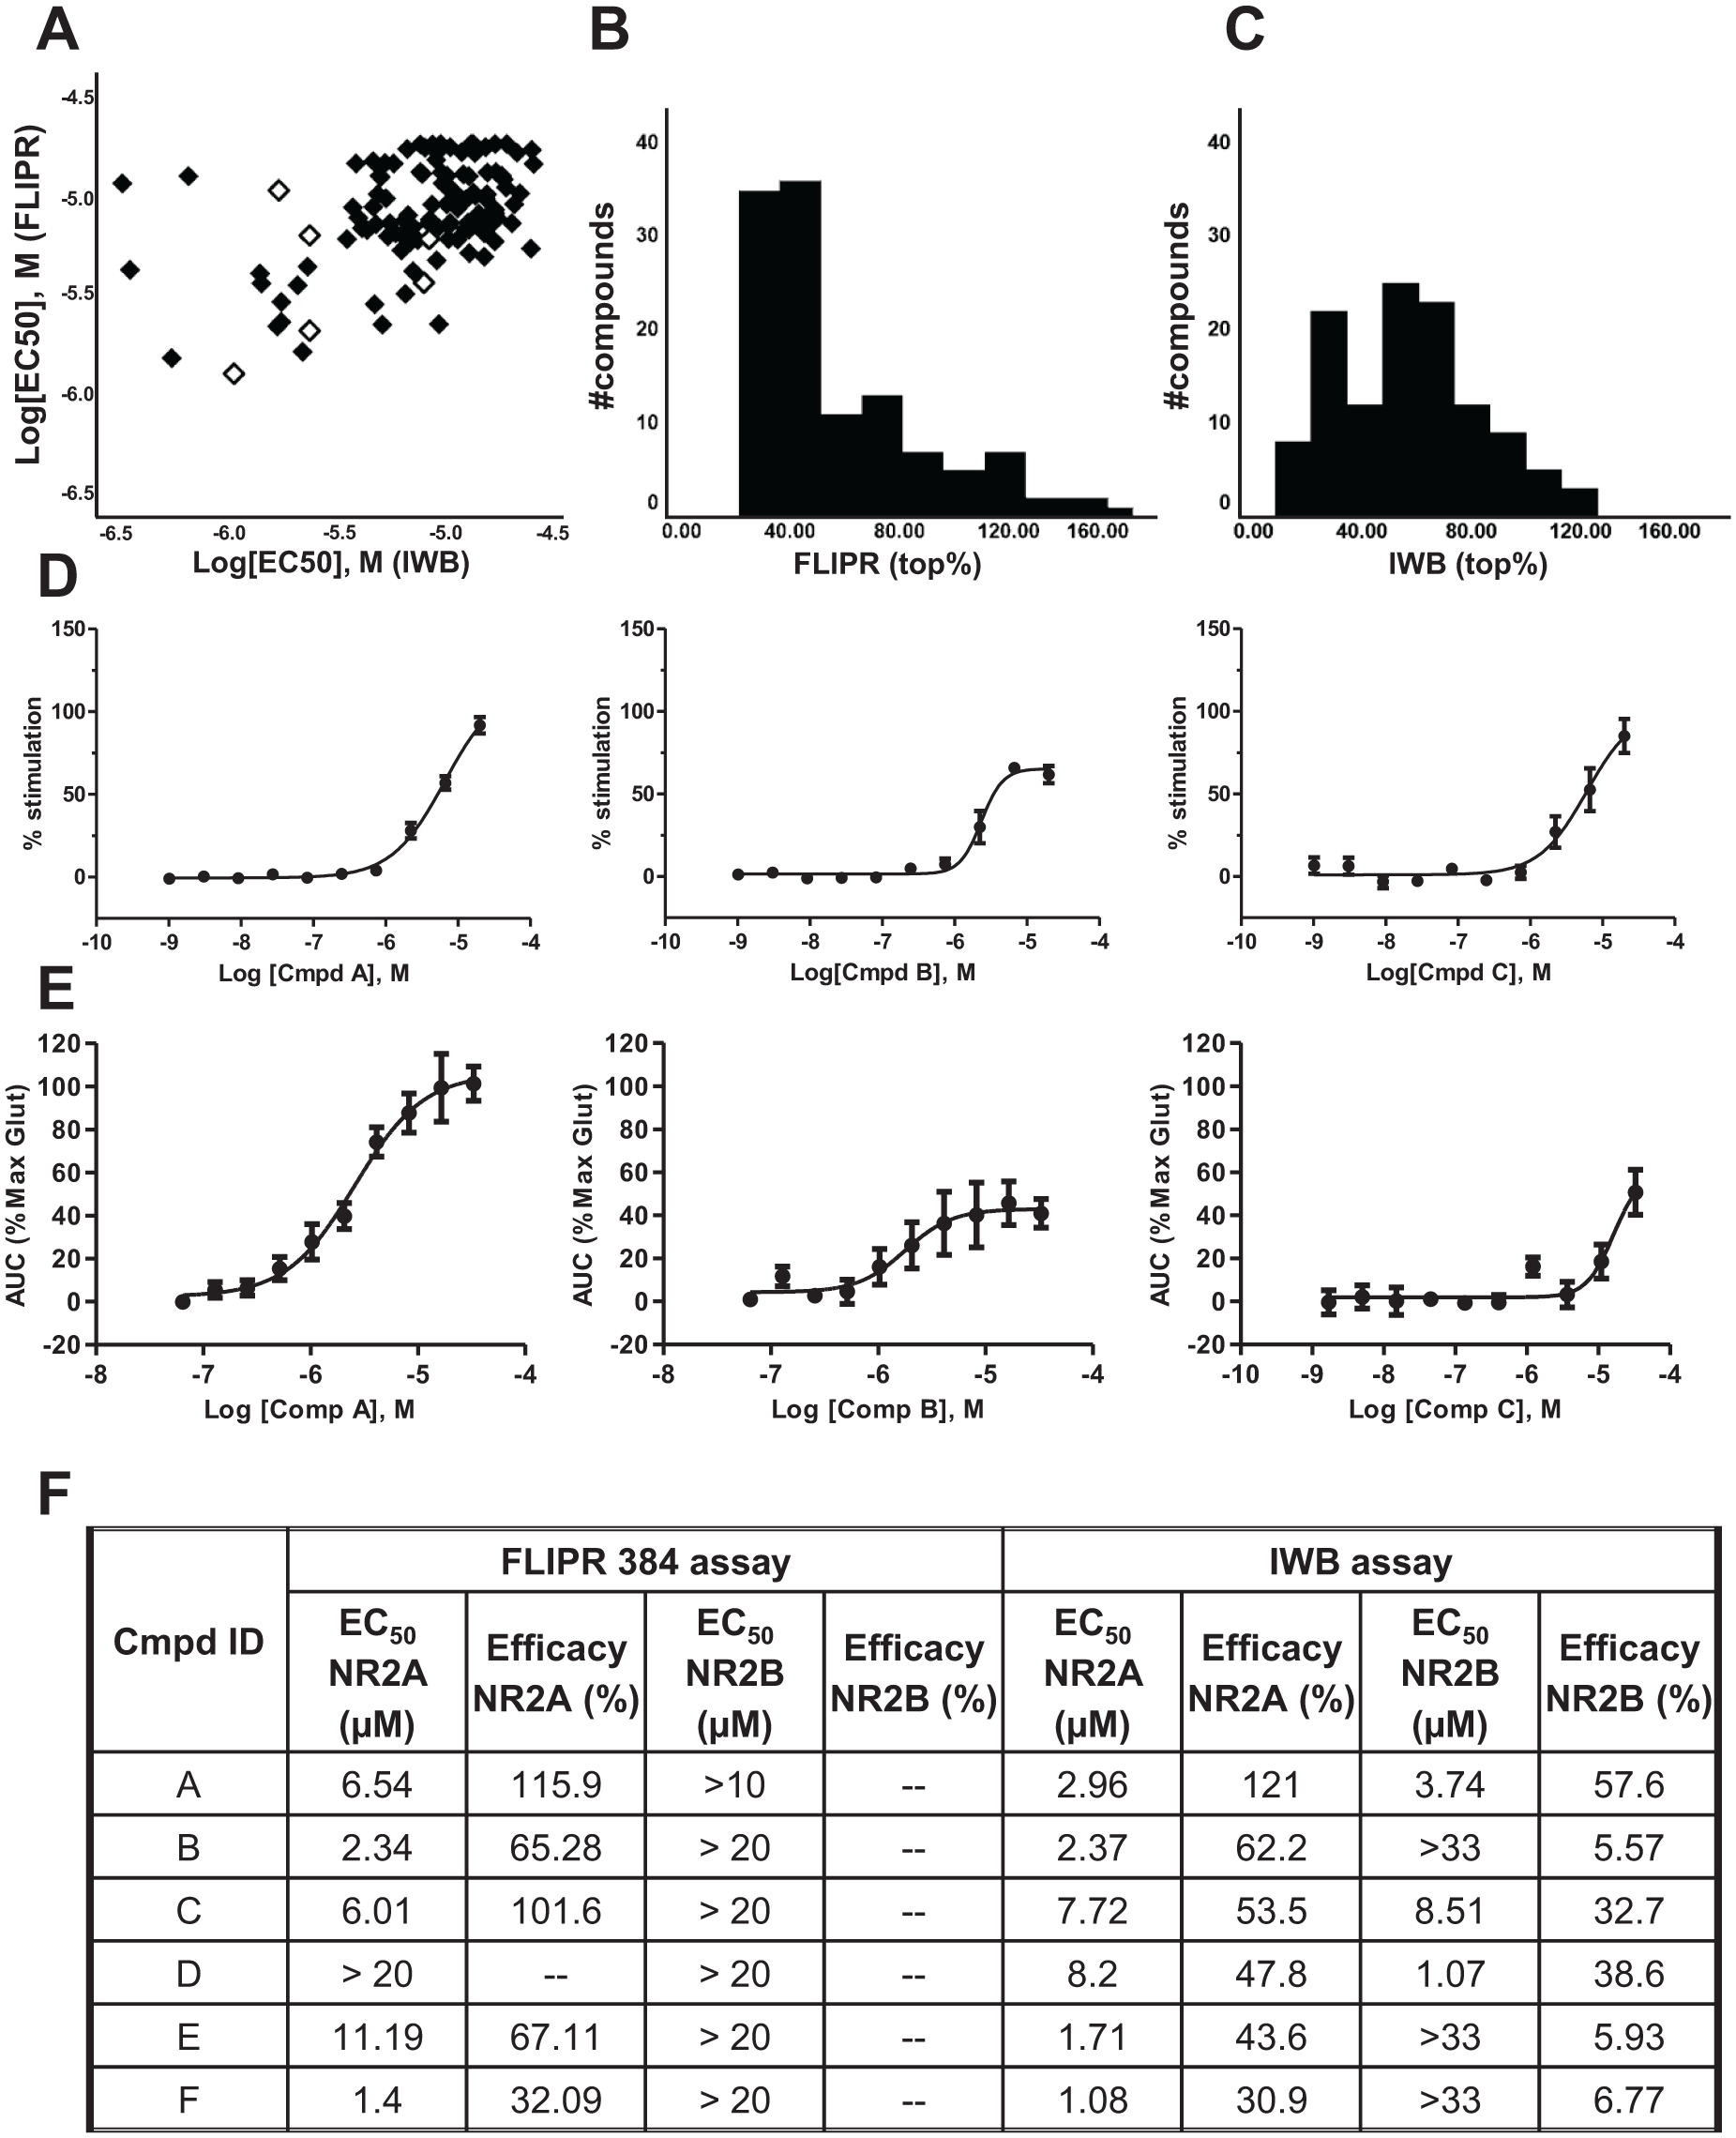
Confirmation of actives in FLIPR 384 and IWB assays. (
In order to select the compounds for progression to the next stage of the project, molecules were assessed according to extent of sp 3 carbon atom content (to avoid planar molecules and excess aromaticity). Additionally, pan-assay interference compounds (PAINs) and reactive chemotypes (alkyl halides, phenols, etc.) were removed from the collection. 21
At the same time, we decided to put additional emphasis on the electrophysiology data we obtained for these compounds (i.e., recorded in the IWB assay), as we believe these data relate better to the potentiation of the ion channel function.
By applying the above selection criteria, we chose a small set of compounds (six) with unique structural properties. The selected compounds are highlighted as open symbols in the scatterplot in Figure 4A . For three of these compounds (compounds A, B, and C), we show the CRC data plots obtained in the FLIPR and IWB assays on the NR1/NR2A cell lines ( Fig. 4D,E ). Summary data obtained for all six compounds are shown in Figure 4F for both the NR1/NR2A and NR1/NR2B cell lines.
Additional Characterization of Identified Potentiators
A secondary goal at this stage of the project was to better understand the mechanism of action of these novel NMDA potentiators, as well as confirmation of activity at native NMDARs.
To explore the mechanism of action for compound A, we conducted a set of experiments where both glutamate and compound A concentration responses were recorded in the matrix format in the IWB assay ( Fig. 5A ). Compound A shifted the concentration–response curve for glutamate (measured as AUC) toward lower concentrations. The EC50 for glutamate was 0.7 µM in the control buffer and 0.024 µM in the presence of 33 µM compound A ( Fig. 5B ). In addition to the observed increase in the potency of glutamate, compound A also increased the maximum glutamate response (162% of max glutamate AUC, n = 4). The potentiation of peak glutamate current amplitude was comparable with the EC50 for glutamate of 0.93 in the control buffer and 0.061 in the presence of 33 µM compound A. The increase in the maximum peak glutamate current was, however, less robust than the increase in AUC (110%, n = 4).
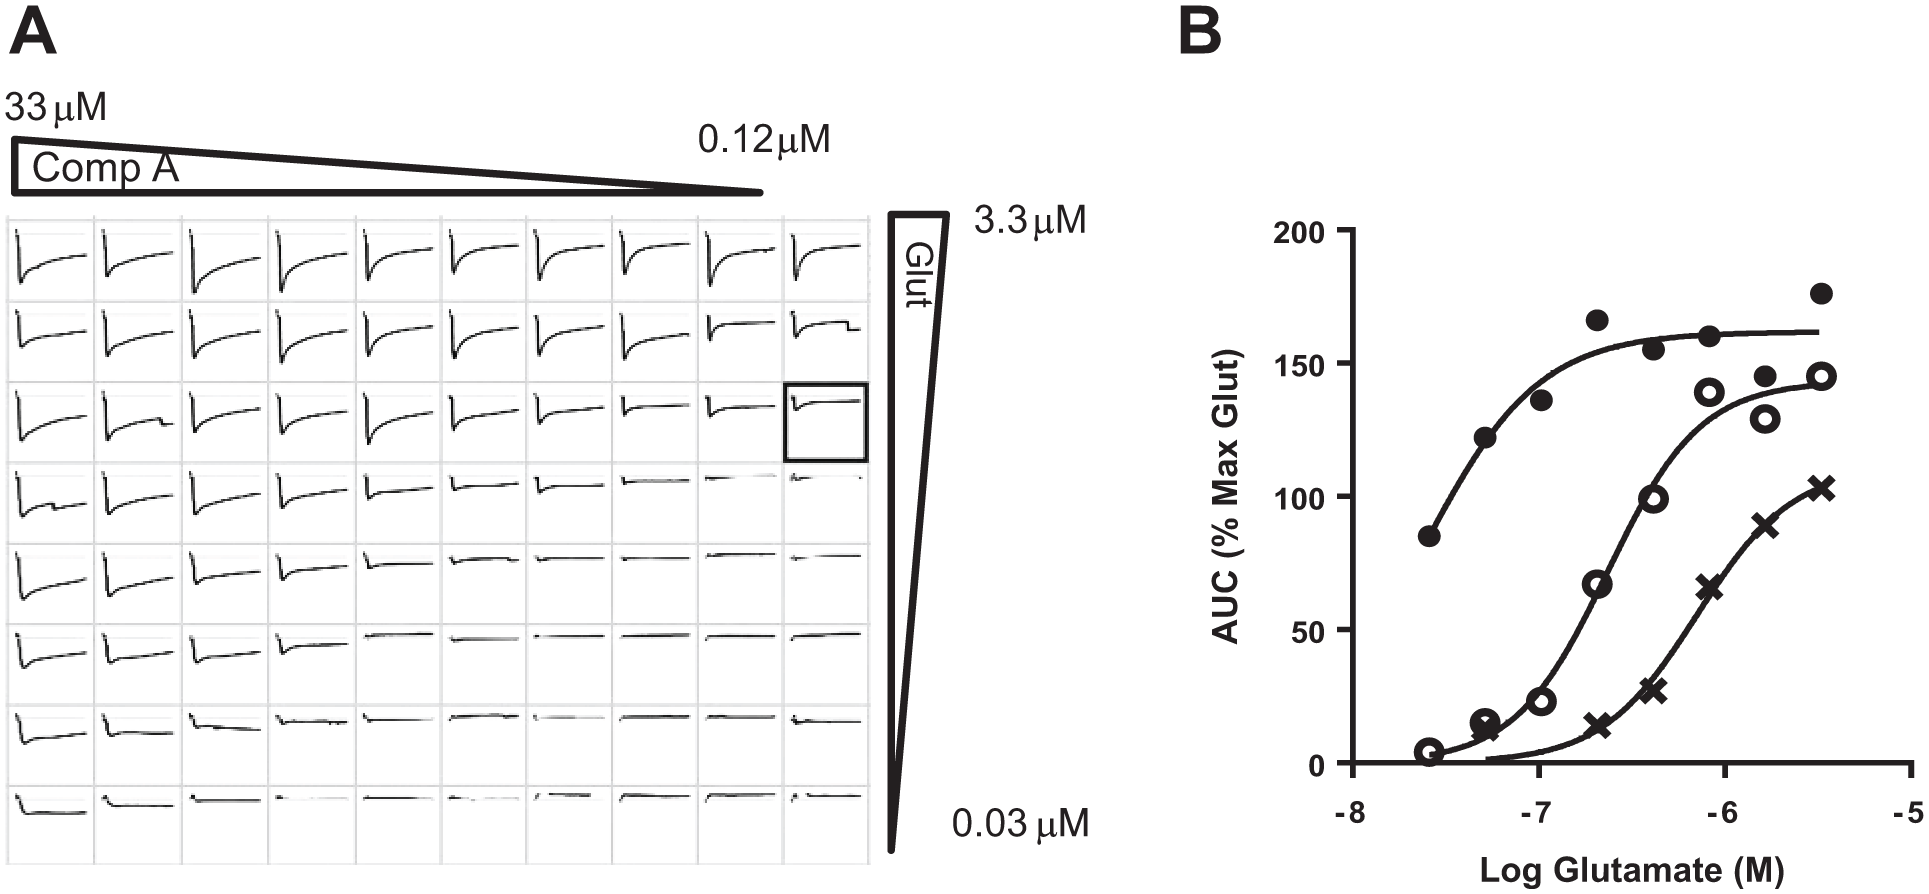
Curve shift analysis of glutamate concentration–response curve by compound A. (
We subsequently aimed to evaluate the activity of compound A at native NMDARs. For this purpose, we used embryonic rat cortical cultured neurons that are known to express at this developmental stage only NR1/NR2B receptors (see supplemental methods). NMDA-induced calcium flux was recorded in a FLIPR 96-well plate format under conditions that promoted NMDAR activation (0 Mg2+ buffer and 10 µM glycine). Representative traces for an NMDA concentration–response curve are shown in
Figure 6A
(top panel), with average data shown below as CRC fit data. The NMDA EC50 for this experiment was 1.78 µM (n = 6). To confirm the NMDAR-selective nature of the calcium flux recorded in this neuronal preparation, we demonstrated that NMDA-induced responses were blocked in a concentration-dependent manner by two selective NMDAR antagonists: RO-25-6981 and NVP-AAM077 (
Fig. 6B
). The activity determined for these two antagonists is presented in
Potentiation of native NMDARs by compound A. (
Discussion
The NMDAR hypofunction hypothesis of schizophrenia was proposed more than 20 years ago, 3 but unfortunately, other than the generation of a large amount of both preclinical and clinical data that used NMDA antagonists as pharmacological tools to model the functional NMDAR deficits, only small advances were made in the field. The major struggle resides in the discovery of novel molecular entities that can, directly or indirectly, enhance or restore NMDAR function, which would allow probing the clinical hypothesis.
In regard to the discovery of modulators that can directly enhance NMDAR function (i.e., potentiators or PAMs), only minor progress was made over the last two decades. Two classes of potentiators were described a long time ago and were thoroughly characterized by many research groups: pregnenolone sulfate and analogues18,22 and spermine. 19 Pregnenolone sulfate acts as a selective potentiator of the NR2A and NR2B subunits, while spermine shows a high selectivity for NR2B subunit–containing receptors. More recently, other classes of potentiators were described: 24-hydroxicholesterol and analogues, 20 carboxylated naphthalene and phenanthrene derivatives and coumarin derivatives,17,23 and a series of NR2C/NR2D-selective PAMs.24,25 All the compounds mentioned above have, in general, a poor ratio between the pharmacological potency/efficacy, on the one hand, and the central nervous system drug-like properties, on the other hand.
Hence, there is a major need for dedicated efforts for discovery of novel NMDA potentiators with improved properties that will allow the investigation of the primary therapeutic hypothesis.
We present the strategy we have used for performing an HTS screening campaign for identification of novel NMDA potentiators. A large library of compounds (~800,000) was screened using a functional assay based on calcium flux measurement in a cell line stably expressing human NR1/NR2A receptors. The assay was enabled and validated using a dedicated screening platform (FLIPR) running in the 1536 format. This format, combined with dedicated automation, allowed for completion of the primary screen in a record time of 2 weeks. The same assay was used for the confirmation of the hits and their counterscreening on the parental cell line in order to exclude compounds that caused nonspecific NMDA responses. The hits passing this filter were evaluated for activity as putative potentiators in a titration assay (CRC mode) performed again on both the NR1/NR2A cell line and the parental cell line.
The specific NMDA compounds identified at this stage were defined as the HTS screening output and were transferred for further analysis to the screening laboratories at Eli Lilly. Out of the total of 864 compounds tested in the titration assay, including the exclusion of the 33 compounds that were active on the parental cell line, the chemistry team at Eli Lilly performed a systematic analysis and decided to pursue a set of compounds beyond the potency criteria outlined in Figure 1D (i.e., EC50 < 10 µM). A total of 406 compounds were selected at this stage and were proposed for further testing at Lilly.
The set of 406 compounds were tested in parallel on the FLIPR 384 and the automated patch-clamp assays. One important aspect to highlight about the FLIPR calcium flux assays is their inability to provide a clear separation between the putative agonists and potentiators. Neither the FLIPR 1536 nor the FLIPR 384 format could distinguish between the two pharmacological classes. The reason behind this lies in the practical observation that HEK-293 cells continuously secrete in the culture media low concentrations of glutamate. The low glutamate concentration cannot cause the full activation of the receptor, but can reach levels that would produce a large calcium response in the presence of a highly efficacious potentiator. A test compound with these properties will have a profile similar to that of an NMDA agonist in these assays. This is further supported by the observation that some of the compounds that passed the titration and specificity assays at Scripps were identified upon inspection of their structure to be close analogues of glutamate and may be agonists.
While a few reports exist on the use of calcium flux assays for screening of NMDARs for identification of antagonists,13,14,24 we are not aware of similar HTS assays for potentiators. The major difficulty for a NDMAR-PAMs assay resides in the ability to control the endogenous production of glutamate by the NMDAR-expressing cells. We have specifically designed our FLIPR calcium flux assay to minimize glutamate release, in particular by removal of glutamine in the culture media and by optimization of liquid handling. We are also reporting here, for the first time, the enablement, validation, and application of a high-throughput patch-clamp assay for NMDARs by using the Ion Works Barracuda platform. The clear advantage of this method over the calcium flux assays resides in the ability to provide a direct and accurate measurement of the ion channel function, that is, the passing of cations through the channel pore.
While there was an apparent correlation between the FLIPR and IWB assays, we did encounter compounds that showed opposing results in the two assays. For example, compound D appeared inactive in the FLIPR calcium flux assay, but showed consistent data in the IWB assay (see Fig. 4F ). In general, the differential activity was observed with compounds that showed a small efficacy in both assays—hence the potential increased data variability. Another observation resulting from the evaluation of the activity of the six potentiators at the two NMDAR cell lines (NR1/NR2A and NR1/NR2B) is the apparent selectivity of some of these compounds ( Fig. 4F ). While the IWB assay data point to NR2A selectivity for only three out of the six compounds, the FLIPR assay shows lack of activity of all compounds at NR2B subunit-containing receptors. Further work will be required in order to understand the discrepancies between the two assays.
We are also showing for one of the compounds presented in Figure 4F (compound A) additional data that demonstrate the characteristic profile of an NMDAR potentiator. When tested in a classical curve shift experiment, compound A shifted the glutamate EC50 value to the left, that is, by increasing the NMDAR affinity for glutamate. A clear increase in maximal glutamate response at higher potentiator concentrations was also observed, but only when analyzing the AUC and not the peak amplitude of the ion channel currents. This increase can be explained by specific effects of compound A on receptor desensitization, as can be observed in the example traces shown Figure 5A . We have also confirmed activity of compound A at native NMDARs by showing a robust potentiation of NMDA-induced calcium fluxes in rat cortical neurons.
In summary, we have presented in this report a collaborative effort to complete an HTS campaign and the subsequent follow-up work that led to the successful identification of a series of NMDAR potentiators. The compounds identified here represent the groundwork for a subsequent effort that will look into further development of these molecular entities as novel drug therapies for treatment of cognitive impairment associated with schizophrenia and Alzheimer’s disease.
Footnotes
Acknowledgements
We gratefully acknowledge the contributions of Liz Folly for cell culture support and the Discovery Chemistry Synthesis Group at Eli Lilly for the synthesis of the tool compounds. We also thank Pierre Baillargeon and Lina Deluca at Scripps for their help with compound management.
Declaration of Conflicting Interests
The authors declared no potential conflicts of interest with respect to the research, authorship, and/or publication of this article.
Funding
The authors disclosed receipt of the following financial support for the research, authorship, and/or publication of this article: The work was supported by Eli Lilly and Company. Portions of this work were done at Scripps Florida as a collaborative agreement with Eli Lilly under a special funding proposal.
References
Supplementary Material
Please find the following supplemental material available below.
For Open Access articles published under a Creative Commons License, all supplemental material carries the same license as the article it is associated with.
For non-Open Access articles published, all supplemental material carries a non-exclusive license, and permission requests for re-use of supplemental material or any part of supplemental material shall be sent directly to the copyright owner as specified in the copyright notice associated with the article.