
Abstract
Glucose homeostasis is primarily controlled by two opposing hormones, insulin and glucagon, and diabetes results when insulin fails to inhibit glucagon action. Recent efforts to control glucagon in diabetes have focused on antagonizing the glucagon receptor, which is effective in lowering blood glucose levels but leads to hyperglucogonemia in rodents. An alternative strategy would be to control glucagon production with small molecules. In pursuit of this goal, we developed a homogeneous AlphaScreen assay for measuring glucagon in cell culture media and used this in a high-throughput screen to discover synthetic compounds that inhibited glucagon secretion from an alpha cell–like cell line. Some of these compounds inhibited transcription of the glucagon gene.
Introduction
Diabetes today affects hundreds of millions of people and is a leading cause of death.1,2 There are two forms of diabetes, type 1 (T1D), in which insulin-producing pancreatic beta cells are destroyed, and type 2 (T2D), in which the response to insulin is lost. Until recently, the major therapeutic efforts for controlling diabetes have focused on insulin replacement or sensitization, which prolongs life but largely fails to normalize glucose homeostasis.3,4 However, mice lacking the glucagon receptor do not develop diabetes even when endogenous insulin production is undetectable after beta cell destruction (T1D) or when crossed into genetic backgrounds that produce extreme T2D.5–7 Since hyperglucagonemia is present in every form of diabetes, 8 glucagon suppression or antagonism presents a possible target for managing the disease. 9 Inhibiting glucagon receptor expression with antisense RNA10,11 or antagonizing the glucagon receptor with chemicals12,13 or antibodies14–16 normalizes blood glucose in animals or humans with either T1D or T2D. However, rodents lacking the glucagon receptor develop alpha cell hyperplasia,17,18 and this also a concern for glucagon receptor antagonists. 9 As an alternative, we elected to treat the hyperglucagonemia of diabetes directly to control hyperglycemia.
Materials and Methods
Cell Culture and Compound Treatment
Mycoplasma-free InR1-G9 cells were cultured in either high-glucose (25 mM) DMEM media or RPMI 1640 media, both containing 10% (vol/vol) fetal bovine serum (FBS), 50 U/mL penicillin, 50 µg/mL streptomycin, and 1 mmol/L sodium pyruvate, and grown in a 37 °C incubator and humidified to 5% (vol/vol) CO2. For all experiments, only cells harvested from passages less than 25 were used. For AlphaScreen experiments, RPMI medium could not be used, as it contains high levels of biotin. For these experiments, InR1-G9 cells adapted to DMEM were seeded into a 384-well culture plate at a density of 10,000 cells per well in a volume of 30 µL with phenol red–free DMEM media. After a 2 h incubation at 37 °C, 0.3 µL of compound (5 µM, final concentration) in DMSO was added to the wells in a format of one compound per well.
AlphaScreen Assay
In this assay, streptavidin-coated donor beads (PerkinElmer, Waltham, MA; cat. 6760002) are mixed with glucagon biotinylated on its N-terminal portion and with protein A–coated acceptor beads (PerkinElmer cat. 6760137) bound to an antibody (30K) specific for the C-terminal portion of the hormone.19,20,28,29 The antibody binding to glucagon brings the beads together to generate a chemiluminescent signal when illuminated by red light. To detect glucagon in cell culture medium, the acceptor beads were mixed with antibody in phosphate-buffered saline (PBS) for 30 min and then incubated in the cell culture medium 30 min before addition of the biotinylated glucagon and donor beads. The nonbiotinylated glucagon in the culture medium will prevent the biotinylated glucagon from binding to the antibody, resulting in a reduction of chemiluminescence signal. Since the screen was designed to find inhibitors of glucagon secretion, compounds of interest would lower nonbiotinylated glucagon in the medium, resulting in a gain of signal. This avoids a major source of false positive artefacts, as compounds that absorb red light or that interfere nonspecifically with protein–protein interactions are a well-known problem for standard, loss-of-signal AlphaScreen assays. For the primary screen, each compound was run as a singlet. However, for compound confirmation, each compound was run in triplicate. Following compound addition, cells were grown for 20 h at 37 °C. Five microliters of a 1:10,000 dilution of a rabbit anti-glucagon antibody in PBS was added to each well, which was determined by titration to not saturate the amount of beads used. Following a 30 min incubation, 5 µL of AlphaLisa protein A–conjugated acceptor beads (PerkinElmer; 2 µg/mL final concentration) in detergent-free 25 mM HEPES, pH 7.4, was added to each well. After another 30 min incubation, 5 µL of biotinylated glucagon (AnaSpec, Fremont, CA; cat. 60274-1; 1 nmol/L final concentration) in 25 mM HEPES, pH 7.4, was added to each well and was allowed to incubate for an additional 60 min. Lastly, 5 µL of 80 µg/mL (8 µg/mL final concentration) of streptavidin-conjugated AlphaLisa donor beads in detergent-free 25 µL HEPES was added in subdued light, bringing the final volume in each well to 50 µL. Plates were incubated at room temperature and emission of light at 615 nm was measured 2 h later on an Envision plate reader (PerkinElmer). When applicable, triplicate values were averaged.
Compounds
For the primary screen, ~200,000 compounds from the University of Texas (UT) Southwestern compound library (visit http://www.utsouthwestern.edu/utsw/cda/dept24734/files/342125.html for details regarding the source of the chemicals) were screened. For compounds of interest that were reordered, compound identity and purity were confirmed by nuclear magnetic resonance (NMR) spectra.
High-Throughput Screen Plate Format
For the primary screen, compounds were assayed in a 384-well plate. The plate was set up with the positive controls in the first column, consisting of the beads, anti-glucagon antibody, and biotinylated glucagon. No cells were present in these wells, resulting in an uninhibited, maximum signal. The negative control consisted of the beads, anti-glucagon antibody, and biotinylated glucagon with 10,000 InR1-G9 cells per well and was located in the second column. The average value of the negative control represented the maximum inhibition from untreated cells. Individual compounds were placed in columns 3–22, allowing 320 compounds to be assayed per plate. Columns 23 and 24 were not used.
Cell Viability Assay
Following compound addition, cells were grown for 20 h at 37 °C. Media was removed by centrifuging inverted plates (30g for 1 min) and cell viability was measured using a CellTiter-Glo assay.
Gaussia Luciferase Assay
To identify compounds that blocked general protein secretion, InR1-G9 cells were transiently transfected using Lipofectamine LTX with a plasmid encoding the naturally secreted Gaussia luciferase under the control of a cytomegalovirus (CMV) promoter. 21 The transfected cells were seeded into culture plates and compounds were added as described above. After growing the cells in a 37 °C incubator for 20 h, the coelenterazine substrate of Gaussia luciferase was added and luminescence was recorded on an Envision plate reader (PerkinElmer). Samples were run in triplicate and values averaged.
PCR Assays
For qPCR, InR1-G9 cells were treated with compound according to the protocol for the AlphaScreen. After treatment with compounds, cells were washed and lysed using a FastLane Cell SYBR Green Kit (Qiagen, Valencia, CA). Quantitative real-time reverse transcriptase (RT) PCR was performed using gene-specific primers for glucagon (forward GATCATTCCCAGCTTCCCAG, reverse CTGGTAA AGGTCCCTTCAGC) and b-actin (forward ATCCACGAA ACTACCTTCAACTCCATC, reverse CATACTCCTGC TTGCTGATCCACATC) with the One Step RT-PCR Kit (Qiagen), according to the manufacturer’s instructions. The samples were incubated at 50 °C for 30 min and heated to 95 °C. The transcript was amplified using 40 cycles of 94 °C for 15 s, 55 °C for 30 s, and 72 °C for 30 s, followed by a final extension step at 72 °C for 10 min on an 7900HT Fast Real-Time PCR System (Applied Biosystems, Grand Island, NY). Relative transcript levels of target genes were normalized to GAPDH mRNA levels.
For RT-PCR, InR1-G9 cells were grown in RPMI media and treated for 24 h with either DMSO or 10 µM of compounds A or B. Then RNA was extracted using Qiagen RNeasy Mini Kit according to the manufacturer’s instructions. cDNA was produced by the ThermoScript RT-PCR System (Invitrogen, Grand Island, NY) from 100 ng of template RNA using random hexamer primer according to the manufacturer’s instructions. Two microliters of cDNA was used for PCR amplification reaction with GAPDH or glucagon gene-specific primers. Primers for GAPDH were (forward CAAGGTCATCCATGACAACTTTG, reverse GGC CATCCACAGTCTTCTG), and the primers for glucagon were as described above. The transcript was amplified by 35 cycles using 95 °C for 30 s, 55 °C for 30 s, and 72 °C for 35 s, followed by a final extension step at 72 °C for 10 min on a MiniCycler-TM PCR Machine (MJ Research, Hercules, CA). The PCR products were resolved on a 1.5% agarose gel and pictured using the BioRad Molecular GelDoc UV Imager. The PCR product for glucagon was sequenced by the UT Southwestern sequencing core facility and identified as coding for glucagon.
Electron Microscopy
InR1-G9 cell samples were processed by the UT Southwestern Electron Microscopy facility. The cells were trypsinized, centrifuged at 50g for 3 min, and fixed with 2.5% glutaraldehyde at room temperature for 2 h. The cell pellet was embedded in agarose, rinsed in 0.1 M cacodylate buffer, pH 7.4, and then fixed with 1% osmium with 0.8% ferricyanide, rinsed in cacodylate buffer, water rinsed, stained with 4% uranyl acetate in 50% ethanol, and dehydrated in an ethanol series (50%, 70%, 85%, 95%, 100%). The ethanol was replaced with propylene oxide and the sample was infiltrated with 1:1 propylene oxide and resin, infiltrated with 100% resin, and then the resin was allowed to polymerize overnight at 70 °C. Thin sections were cut with a Leica Ultracut E, mounted on grids, and imaged with a Jeol 1200 electron microscope.
Results
As a basis for establishing an assay for inhibitors of glucagon production, we examined several alpha cell–derived cell lines from mouse and hamster. Hamster InR1-G9, a glucagon-producing BK-virus immortalized cell line,22,23 retained normal glucagon responses to insulin and glucose. Although elevated glucose will inhibit glucagon secretion in intact islets due to the release of insulin, in isolated rat pancreatic alpha cells 24 or in a perfused pancreas from mouse treated with streptozotocin to destroy the beta cells, 16 a rise in glucose concentrations above normal stimulates glucagon release. We confirmed that InR1-G9 cells responded to insulin by decreasing glucagon secretion and to elevated glucose in the absence of insulin by increased glucagon secretion. 16 In addition, we examined InR1-G9 cells by transmission electron microscopy to confirm that they contained densely staining granules typical of regulated secretory granules, although InR1-G9 cells contained much fewer of these than reported for pancreatic alpha cells.
Development of a High-Throughput Screen for Chemical Inhibitors of Glucagon Secretion
We developed a high-throughput AlphaScreen assay to detect glucagon secreted by InR1-G9 cells. A schematic illustration of the AlphaScreen assay is shown in Figure 1A . In this assay, streptavidin-coated donor beads and protein A–coated acceptor beads bound to a glucagon antibody specific for the C-terminal portion of the hormone19,20 are brought into close proximity through the interaction with the peptide hormone glucagon that had been biotinylated on its N-terminus and/or lysine 12 (the only free amines in the hormone). When illuminated by red light, the donor and acceptor bound together generate a chemiluminescent signal of shorter wavelength. 25 To detect glucagon in cell culture medium, the acceptor bead with antibody bound was added to the medium in wells containing intact InR1-G9 cells (for 30 min) before addition of the biotinylated glucagon and donor. This allowed for the detection of free glucagon with high sensitivity, as the nonbiotinylated glucagon in the culture medium prevented the biotinylated glucagon from binding to the antibody, resulting in a reduction of chemiluminescence signal ( Fig. 1B ). The assay was linear for the concentrations of glucagon found in the culture medium of InR1-G9 cells (~100 pM). The assay was conducted in wells containing alpha cells secreting glucagon, producing a homogeneous assay amenable to high-throughput screening. Since the screen was designed to find inhibitors of glucagon secretion, compounds of interest would lower nonbiotinylated glucagon in the medium, resulting in a gain of signal.
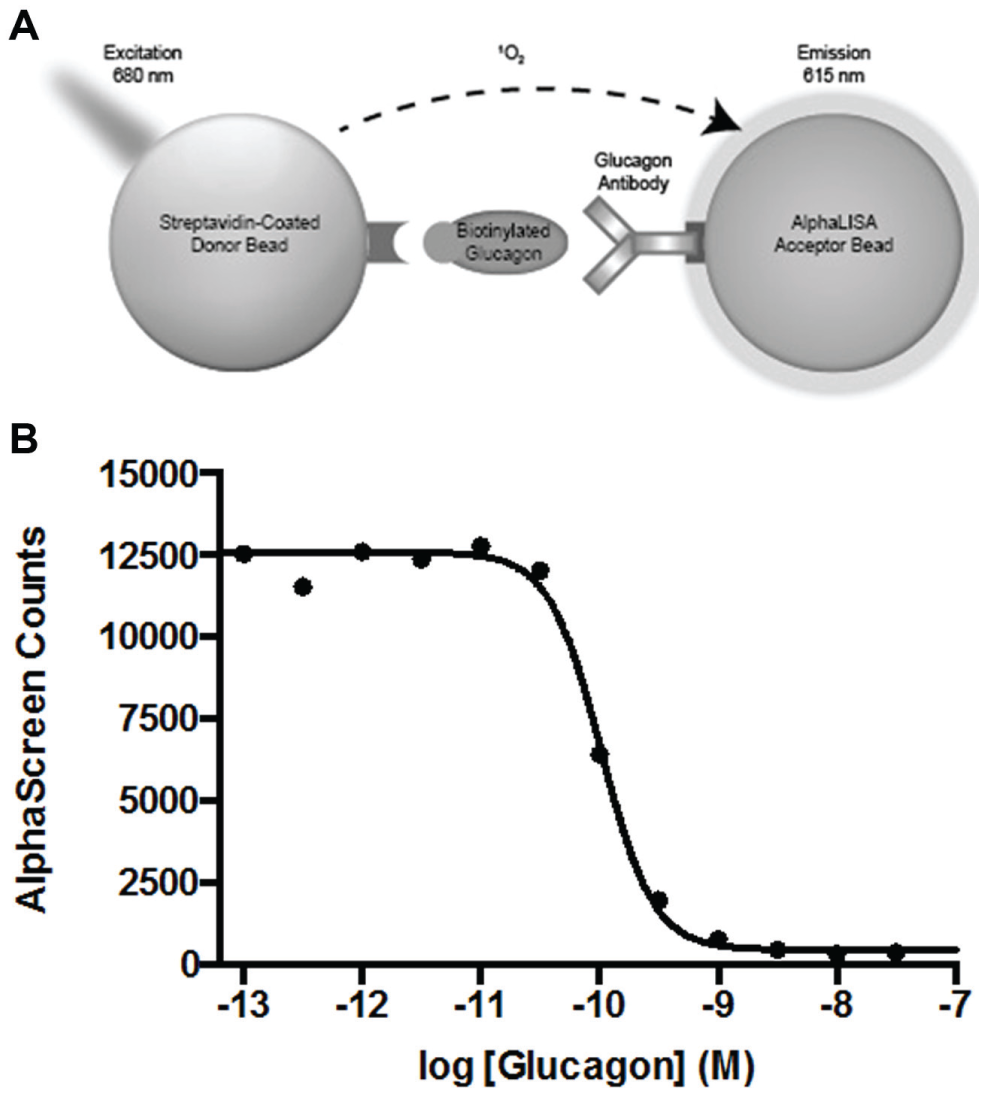
Schematic diagram of the AlphaScreen assay. (
High-Throughput Screen and Secondary Assays
We screened 198,080 synthetic chemicals of the UT Southwestern chemical library at a final concentration of 5 µM in 1% DMSO in a single-compound, single-well format with control wells containing the 1% DMSO on each plate. The majority of plates had Z′ > 0.45, and those with lower values (~5%) were repeated. Compounds of interest identified by this screen were subjected to the decision process shown in Figure 2A . We selected 1864 compounds with a standard deviation more than 3.5 compared to on-plate controls. Previous studies at UT Southwestern had documented the toxicity of each compound in the library to a number of different cancer and noncancer cell lines. 26 Using these data, we eliminated toxic compounds, leaving 1502 compounds of potential interest. We grouped the remaining potential inhibitors into 900 clusters based on their structural similarities using Pipeline Pilot. The most potent compounds from each cluster were selected for additional testing. After setting aside the less active analogues, 957 compounds remained.
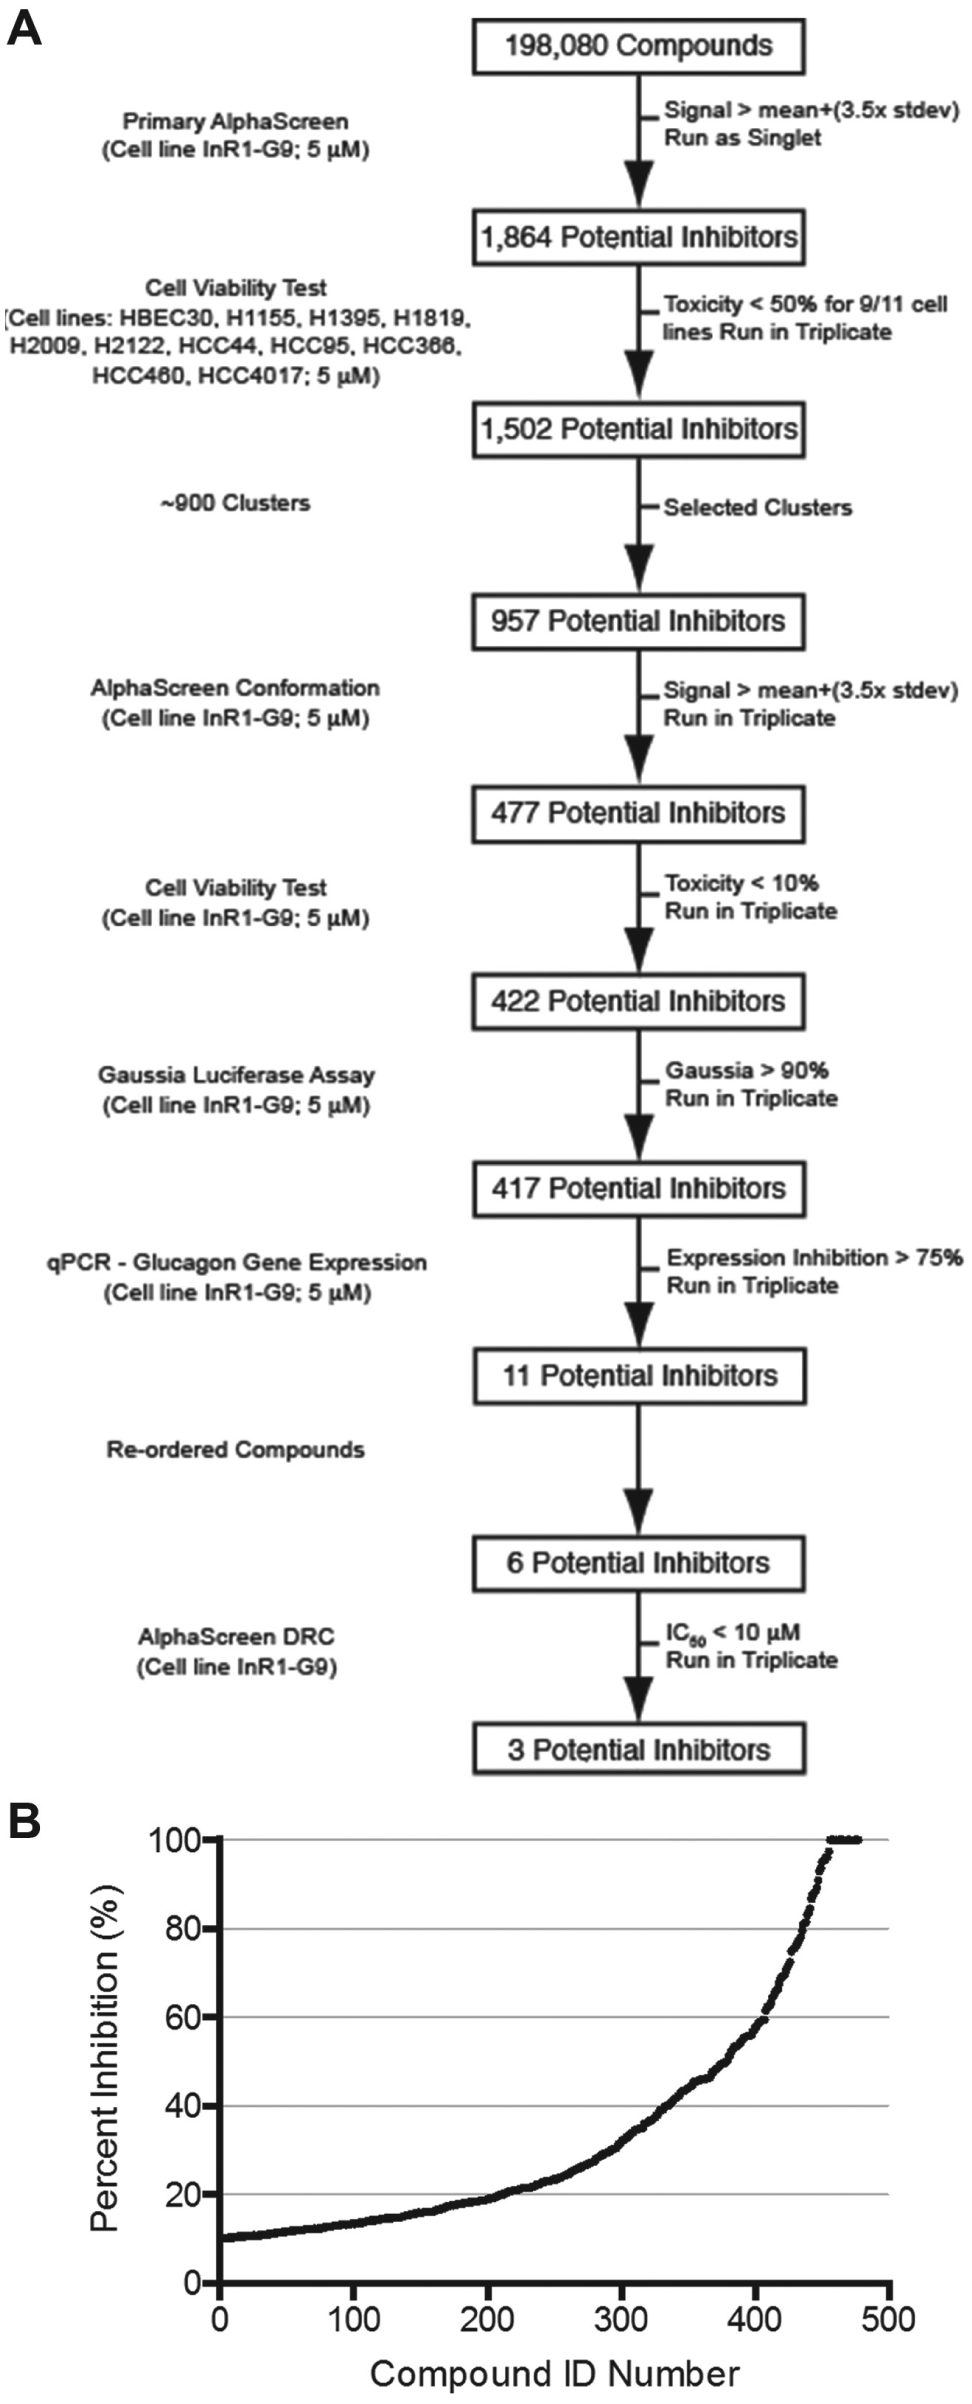
Decision tree. (
These compounds were rescreened in triplicate with the original AlphaScreen assay, and those with signals at least 3.5 standard deviations above the average from on-plate controls and that suppressed at least 10% of glucagon secretion were selected, resulting in 477 compounds ( Fig. 2B ).
The most likely class of false positive signals would arise from compound-induced toxicity. For this reason, cell viability was measured using CellTiter-Glo in the InR1-G9 cells. Compounds that resulted in greater than 10% toxicity were eliminated, leaving 422 compounds. Furthermore, compounds that inhibited general protein secretion could also result in false positives. Therefore, cells were transfected with a plasmid expressing Gaussia luciferase, which is a naturally secreted protein, 27 and compounds were assayed for their ability to inhibit secretion of the Gaussia luciferase. Of the 422 compounds tested, only five resulted in a reduction of greater than 20% of Gaussia luciferase in culture medium (3 standard deviations from the mean), leaving 417 compounds.
Compounds that Nonspecifically Increase the AlphaScreen Signal
In the process of confirming compounds that were active in the primary screen, we identified 17 compounds that elevated the AlphaScreen signal from 3- to 10-fold above that of the positive control (no glucagon inhibitor). These compounds probably brought the donor and acceptor beads together. Seven of these compounds shared the benzimidazole structure diagrammed in Figure 3 . Thus, gain-of-function AlphaScreen assays can be subject to false positive effects.
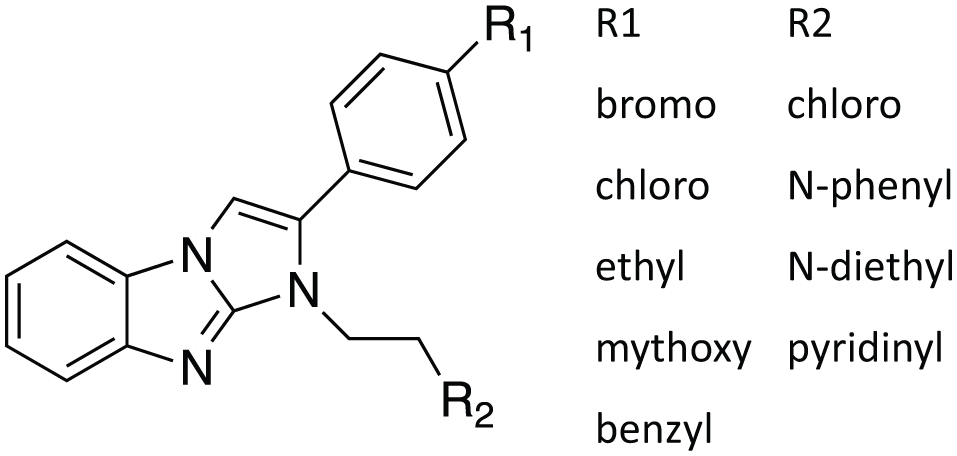
Benzimidazole compounds with the structure shown are nonspecific enhancers of the AlphaScreen signal.
qPCR
Because the biosynthetic machinery for processing preproglucagon and secretion of glucagon is shared with other peptide hormones, we chose to look for compounds that specifically inhibited transcription of the glucagon (GCG) gene. Among these would be inhibitors of the signal transduction pathways controlling GCG transcription, an arena of biology rich in druggable targets. We therefore investigated the effect of compounds of interest on GCG message levels by qPCR. To understand the temporal regulation of the GCG gene in InR1-G9 cells, we measured glucagon message over a period of 72 h after plating the cells. We observed a delay of 12 h where little glucagon message was made, followed by a subsequent rise in message levels peaking at around 24 h, after which glucagon message levels returned to basal levels by 72 h (
Fig. 4
). We took advantage of the cyclical nature of glucagon message to identify compounds that blocked the rise in GCG message at 24 h. The 417 compounds remaining in our screening funnel were tested by PCR in pools of 4 for inhibition of glucagon message production. Because the PCR method measures the ratio between the messages for glucagon and GAPDH, this experiment would simultaneously identify general inhibitors of transcription, which would reduce GAPDH levels. We identified 16 pools of compounds that increased the delta Ct of glucagon message greater than 1.3 without altering GAPDH (
Fig. 5A
). The individual compounds in these pools were then tested individually in triplicate, and 11 compounds were found to inhibit glucagon message by more than fourfold (
Fig. 5B
). Three of these 11 compounds had undesirable chemistry, and another 2 were unavailable for purchase from the supplier. The remaining six compounds were repurchased and dose–response curves were recorded in the original AlphaScreen assay and the best, compounds
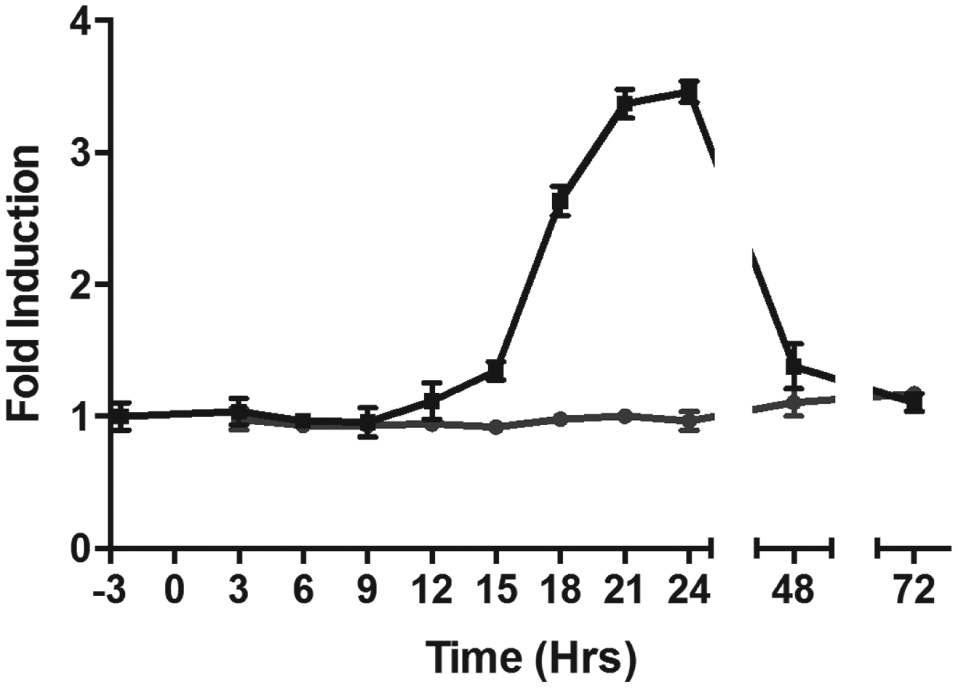
Time course of GCG message production. InR1-G9 cells were treated with the DMSO vehicle (black line, square symbols) or with glucagon inhibitor compound
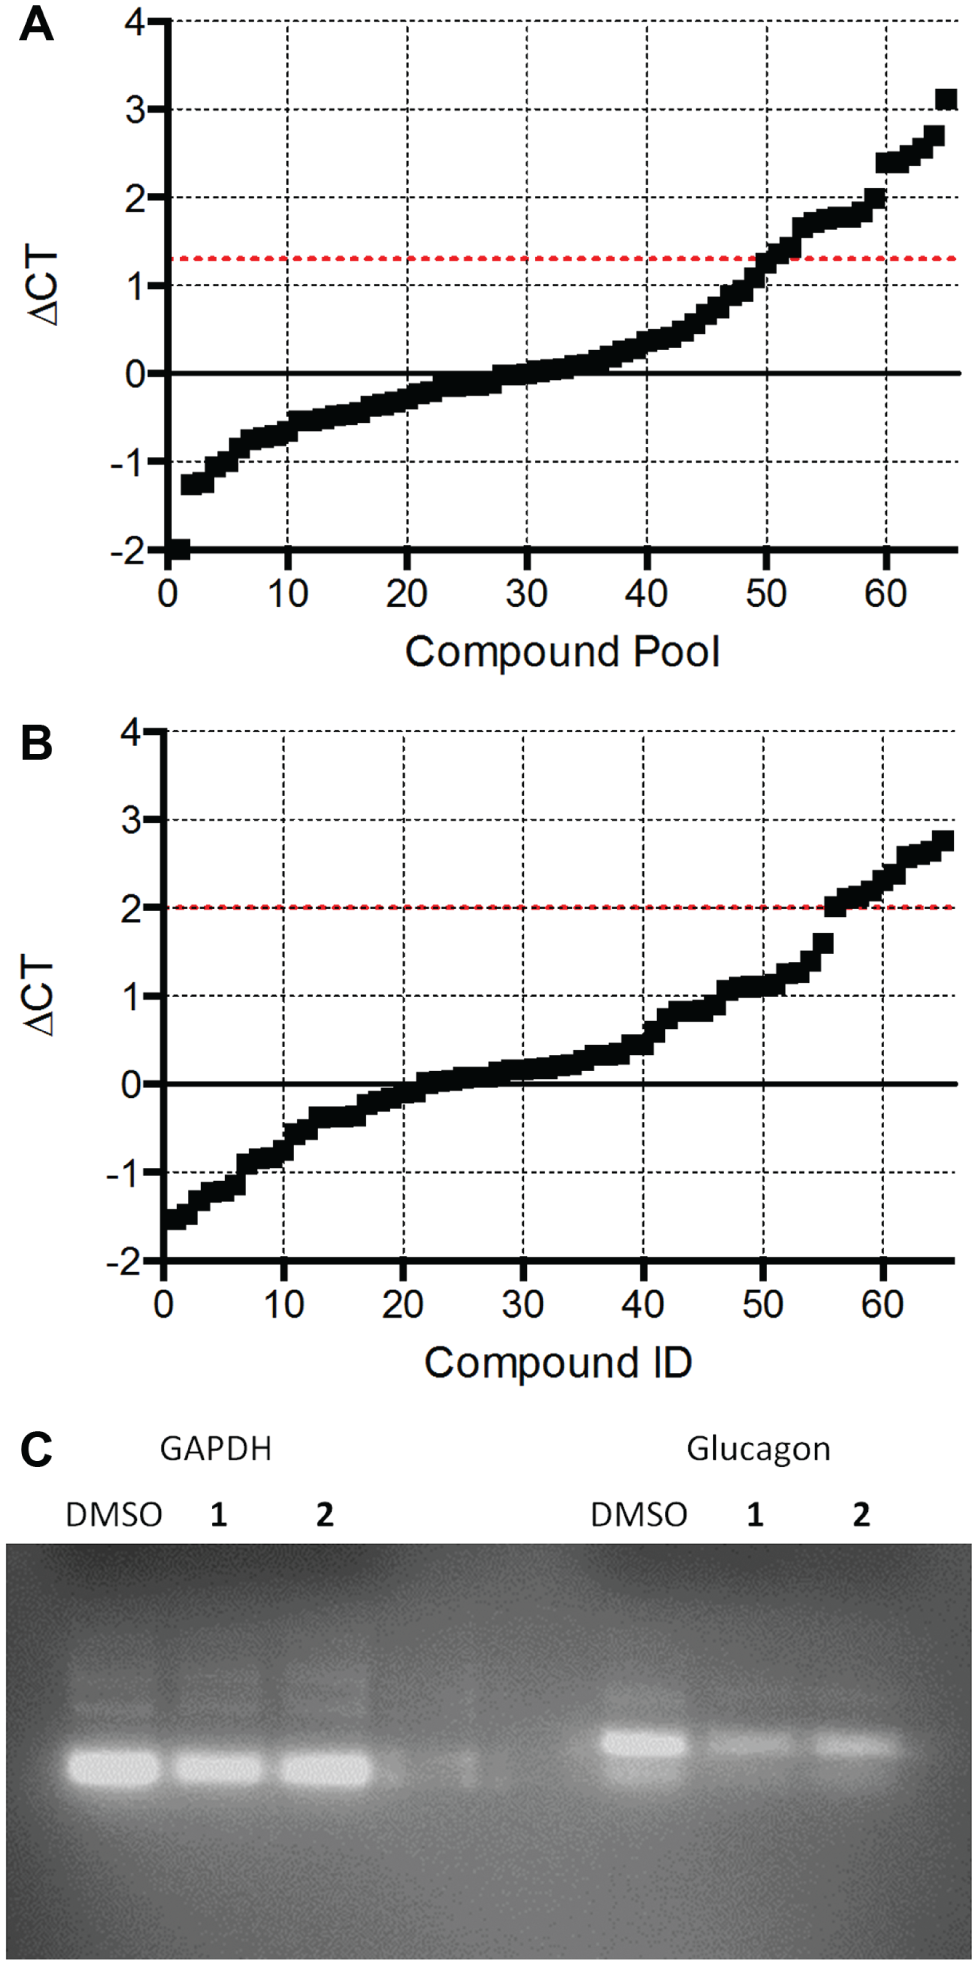
qPCR analysis of 417 compounds that inhibited glucagon secretion. (
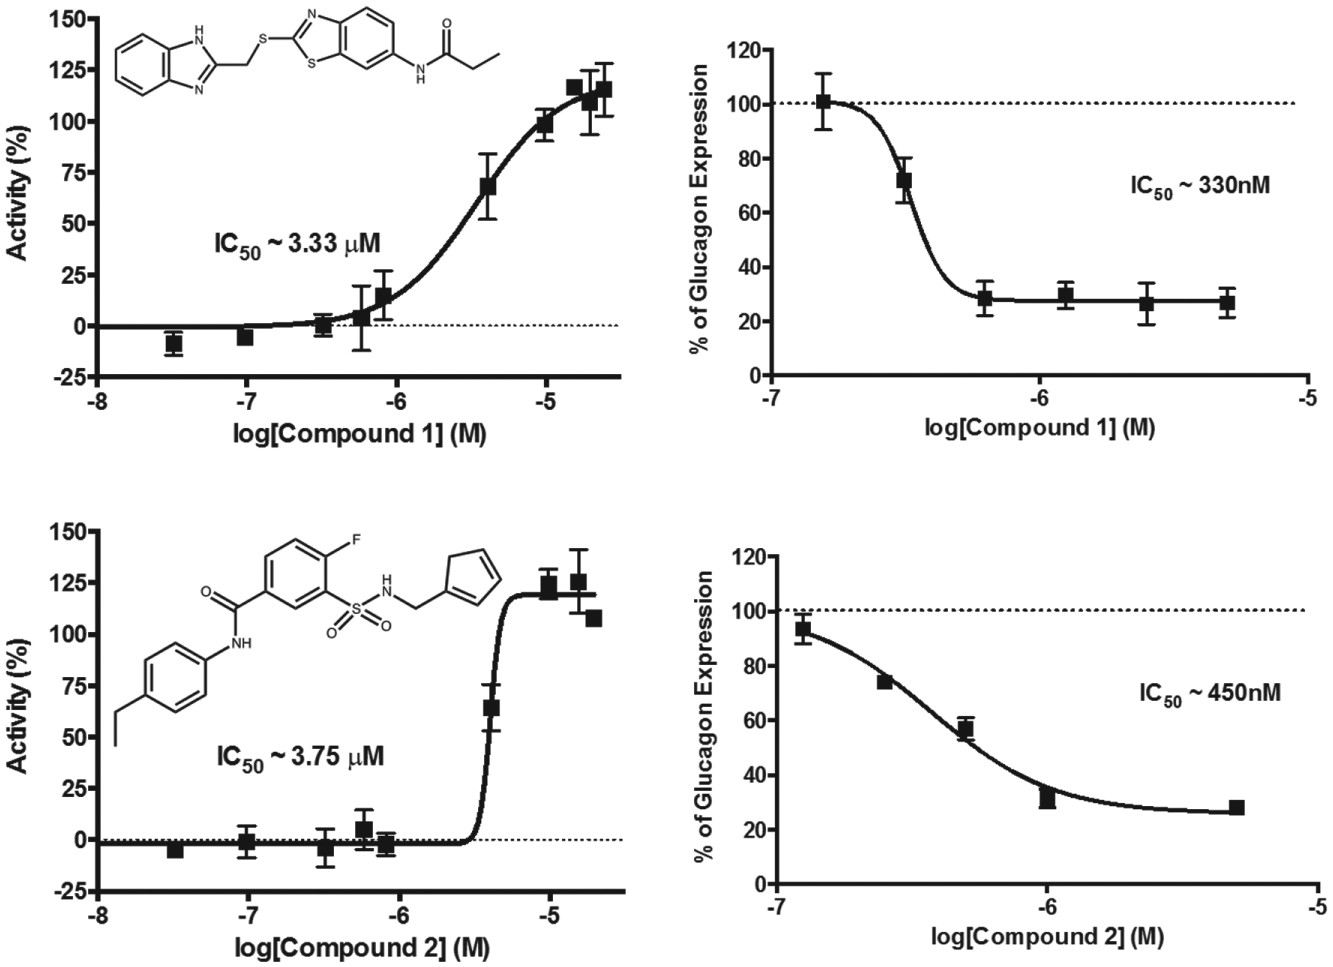
Two compounds were identified to have an IC50 in the AlphaScreen assay of less than 10 µM and less than 1 µM by qPCR. The left panels show dose–response curves for the AlphaScreen competition assay measuring glucagon secretion, and the right panels are dose–response curves measuring mRNA expression.
Discussion
Currently, several pharmaceutical companies have investigated small-molecule inhibitors of the glucagon receptor as approaches for treating the hyperglycemia of diabetes. In addition, an anti-glucagon receptor antibody has shown promise in preclinical animal models for normalizing blood glucose in models of T1D 16 and T2D. 15 A drawback of these approaches is that they attempt to correct a pathological condition (insulin lack or unresponsiveness) by creating a second pathology (glucagon receptor insensitivity). Since the underlying problem in diabetes is an imbalance of the ratio of insulin action to glucagon action, another approach is to suppress glucagon production in the absence of sufficient insulin action, to bring the ratio back into balance.
We report the development of an AlphaScreen assay for the discovery of novel small-molecule inhibitors of glucagon production. We identified 417 compounds that specifically lowered the amount of glucagon secreted into cell culture medium overnight, of which 11 acted by specifically suppressing the production of glucagon message RNA. One of the major advantages of the AlphaScreen assay compared to other technologies is the strong signal to background. This advantage allowed us to detect picomolar concentrations of glucagon in the culture media of wells containing intact cells. The assay was rapid, requiring a few hours. The sensitivity and quickness of the AlphaScreen technology allowed us to conduct a high-throughput screen of 198,080 compounds in a matter of weeks.
Footnotes
Acknowledgements
We thank the UT Southwestern Electron Microscopy facility for processing samples for electron microscopy and Iryna Zubovych for the RT-PCR experiment.
Declaration of Conflicting Interests
The authors declared no potential conflicts of interest with respect to the research, authorship, and/or publication of this article.
Funding
This work was supported by a research grant from Pfizer (R.H.U.) and by the Diane and Hal Brierley Chair in Biomedical Research (M.G.R.).