
Abstract
Lysine acetylation plays a critical role in cellular regulation and is implicated in human disease. Sirtuin deacetylases remove acetyl groups from modified lysine residues, and sirtuin 3 (SIRT3) has been identified as a target for cancer therapeutics. Robust and high-throughput screening methods for these targets will be important to the development of therapeutics. This article describes the use of self-assembled monolayer desorption/ionization mass spectrometry, or SAMDI-MS—a label-free drug discovery tool—to characterize SIRT3 activity and discover inhibitors. SAMDI-MS was used to analyze a peptide array having 361 distinct acetylated peptides to identify an active SIRT3 substrate (GYKAcRGC). This peptide was used in a screen of 100,000 small molecules to identify inhibitors of SIRT3. A total of 306 SIRT3 inhibitors were identified, with one compound, SDX-437, having an IC50 of 700 nM with >100-fold selectivity for SIRT3 over SIRT1.
Introduction
Lysine acetylation is an important posttranslational modification in the mammalian proteome because it serves to regulate metabolic pathways, chromatin structures, and transcriptional activity, thus contributing to diverse cellular processes, including transcription, cell cycle regulation, apoptosis, and senescence. 1 Human cells contain more than 20 distinct isoforms of lysine acetyltransferases (KATs) and 17 distinct isoforms of lysine deacetylases (KDACs), including both KDACs and sirtuins. Sirtuins (SIRTs) are a family of evolutionarily conserved, NAD+-dependent deacetylases that play an integral role in cellular maintenance. There are seven mammalian sirtuins (SIRT1 through SIRT7), each located in specific subcellular organelles. SIRT1, SIRT6, and SIRT7 are located in the nucleus; SIRT2 is in the cytosol; and SIRT3, SIRT4, and SIRT5 are localized to the mitochondria. 2 SIRT3 is the primary deacetylase in metabolic signaling pathways and has been implicated as a tumor promoter in certain cancer types, 2 thus making it a potential therapeutic target.
Traditional high-throughput screening (HTS) methods rely on radiolabels, antibodies, or fluorescence to measure protein activity. Although radiolabels are sensitive, they inherently pose a health risk, require special disposal, and are expensive. Common deacetylase assays monitor the acetylation state of a lysine residue in a peptide substrate through fluorescent labeling.3,4 Schwienhorst and coworkers developed a fluorescence assay based on peptides that incorporate a coumarin derivative on the carboxy side of the acetylated lysine, which can affect the enzyme–substrate specificity. 5 Nonnative substrates also preclude the inclusion of peptide sequences on the carboxy side of the acetylated lysine. Such fluorescence-based deacetylase assays are dependent on a subsequent proteolysis step using trypsin, and, therefore, this assay identifies false-positive results in the form of trypsin inhibitors that must be separately screened. The methods described here represent a significant development in a difficult bioanalytical challenge, but they lack the combination of ease of use and compatibility with inhibitor screening of compound libraries. More importantly, fluorescence-based assays were originally used to discover SIRT1 activators, which were later shown to be an artifact dependent on the presence of the fluorescent label. 6 The cost and time associated with this type of negative outcome are significant. In addition, fluorophores and antibodies require lengthy assay development, may interfere with enzyme activity, and are secondary reporters that may yield false positives. In fact, a recent study found false-positive rates as high as 80% in a 1-million-compound screen using fluorescence-based technologies. 7 Therefore, label-free drug discovery tools that eliminate these caveats and reduce the timeline to successful drug leads are crucial. Directly screening in a label-free format will not only reduce false positives but also provide key information about the analyte, such as molecular weight, purity, and degradation products.
The self-assembled monolayer desorption ionization (SAMDI) technology overcomes the limitations of labeled methodologies by combining mass spectrometry (MS) with defined surface chemistries. This approach uses self-assembled monolayers (SAMs) to capture the analyte combined with matrix-assisted laser desorption ionization time-of-flight (MALDI-TOF) MS to provide a quantitative, robust, label-free readout for screening enzyme activity in a 384-biochip format. The SAMs can be customized to use a variety of immobilization chemistries, including maleimide and azide (or alkyne) for covalent capture, and biotin for streptavidin–biotin capture.8–10 Monolayers specifically bind and capture the intended analytes, allowing for isolation of the analyte from 384 samples in parallel—by using the standard microtiter plates—and we are now transitioning to 1536-well plates. Furthermore, the intrinsic compatibility of SAMDI with essentially any enzyme activity (provided the activity results in a change in the molecular weight of the substrate) permits the screening of posttranslational modifications using peptide substrates. This includes monitoring the addition or loss of acetyl groups, thus making SAMDI an effective platform for studying SIRT3. In this study, we describe a label-free screen of 100,000 compounds to identify novel small-molecule SIRT3 inhibitors using SAMDI.
Materials and Methods
Reagents
Human SIRT1 and GST-tagged LSD1 were purchased from BPS Biosciences (San Diego, CA). The acetylated peptide library and NH2-GYKAcRGC-CONH2 (YKAcR; >95% purity) were synthesized at Peptide 2.0 (Chantilly, VA). H3K4Me2 peptide was purchased from Anaspec (Fremont, CA). Sodium chloride (NaCl), potassium chloride (KCl), magnesium chloride (MgCl2), Tween-20, bovine serum gelatin (BSG), dimethyl sulfoxide (DMSO), 4-(2-hydroxyethyl)-1-piperazineethanesulfonic acid (HEPES) pH 8.0, formic acid, sodium bicarbonate, suramin, and nicotinamide adenine dinucleotide (NAD+) were purchased from Sigma-Aldrich. A 100,000-compound library from Chembridge (San Diego, CA) was pooled into 8 compounds per well at 500 μM each.
SAMDI-MS
A total of 2.5 µL of reaction was transferred to 384 SAMDI biochip arrays presenting maleimide-terminated monolayers and incubated for 1 h in a humidified chamber for the capture of thiol-terminated peptides. Following incubation, the SAMDI biochip was washed with diH2O and air-dried. Next, 50 nL of 60 mg/mL of 2′, 4′, 6′-trihydroxyacetophenone monohydrate (THAP) in acetone was applied to each of the 384 spots in the array. All spots in the 384 SAMDI biochip array were analyzed using matrix-assisted laser desorption (AB Sciex MALDI-TOF/TOF 5800; Sciex, Framingham, MA) using 900 shots in reflector positive mode.
SIRT3 Expression, and Purification
SIRT3 (101-399 aa) was expressed in BL21 DE3 using a pTriEx-based expression vector. Cells were grown in 2XYT broth supplemented with 50 μg/mL carbenicillin at 37 °C until OD600 0.6. Protein expression was induced with 0.3 mM IPTG and incubated at 30 °C 240 rpm for 6 h. Cells were harvested by centrifugation and lysed using Bugbuster/Benzonase in 50 mM TRIS pH 8, 200 mM NaCl, 5 mM BME, 20 mM imidazole. His-tagged SIRT3 was purified using standard immobilized metal affinity chromatography. Eluted protein was filtered, concentrated, and buffer exchanged using a YM-10 Centricon (Millipore, Billerica, MA). The final storage buffer was 50 mM TRIS pH 8, 200 mM NaCl, 5 mM BME. Purified samples were analyzed by SDS-PAGE to reveal a 35.5 kDa band representing SIRT3 with purity >90%. Aliquots were frozen at −80 °C until further use.
Peptide Substrate Profiling
Peptide substrate profiling was performed in a solid-phase 384 SAMDI biochip array by pre-immobilizing peptides prior to reactions. A total of 361 peptides were synthesized in the format GXKAcZGC, where X and Z positions have any one of 19 amino acids (excluding cysteine). Peptides were immobilized onto maleimide-terminated self-assembled monolayers on 384 SAMDI biochips, through the C-terminal thiol, in 50 mM TRIS pH 8.0 for 1 h. Unbound peptide and buffer were washed away with 100% ethanol, diH2O, 100% ethanol, and dried with pressurized air. SIRT3 was prepared at 50 nM in reaction buffer consisting of 50 mM HEPES (pH 8.0), 137 mM NaCl, 2.7 mM KCl, 1.0 mM MgCl2, 0.002% Tween-20, 0.005% BSG, 2% DMSO in deionized ultrafiltered water (DIUF); and 2 μL dispensed onto surfaces using a Multidrop Combi (Thermo Scientific, Waltham, MA). Reactions were incubated for 1 h at 25 °C and stopped with an ethanol and diH2O wash of the full SAMDI plate. THAP was applied to the SAMDI plate and subsequently analyzed on the AB 5800 according to above.
Assay Development
Initial velocity and Km assays were carried out at 25 °C in 100 µL reactions: 90 µL enzyme and started with 10 µL peptide GYKAcRGC and NAD+. At each time point, 10 µL aliquots were stopped with 1 µL of 5% formic acid. Acidified assays were then neutralized with 1 µL of 10% sodium bicarbonate, and reactions analyzed using SAMDI-MS. Initial velocity versus enzyme concentration (V0 vs [E]) was determined for SIRT1 and SIRT3 with enzyme concentrations starting at 100 nM and serially diluted twofold to 1.56 nM with a fixed concentration of peptide GYKAcRGC and NAD+ at 10 µM and 200 µM, respectively. Reactions were stopped at 0, 5, 10, 15, 20, 30, 60, 90, and 120 min time points. Peptide GYKAcRGC Km was determined using peptide concentrations starting at 100 µM and serial diluted twofold to 0.39 µM with fixed concentration of enzyme and NAD+ at 5 nM and 200 µM, respectively. NAD+ Km was determined with concentrations starting at 1 mM and serial diluted twofold to 3.9 µM with fixed concentration of enzyme and peptide at 5 nM and 10 µM, respectively. Both peptide GYKAcRGC and NAD+ Km reactions were stopped at 0, 10, 20, 30, 40, 60, 90, and 120 min time points.
Data Analysis
Area under curves (AUCs) of peptide GYKAcRGC and deacetylated product (GYKRGC) were acquired using TOF/TOF Series Explorer V.4.1.0 (AB Sciex) for conversion calculation respective to each spectra using the relation AUCproduct / (AUCproduct + AUCsubstrate). A Z-factor was calculated to determine the statistical characteristic and quality of the high-throughput screen assays. 11 Enzymatic parameters such as initial velocity, Km, Vmax, and IC50 curves (4-parameter logistic model) were generated to understand Michaelis–Menten steady-state enzyme kinetics in Prism software (GraphPad Software, San Diego, CA). Peptide arrays were analyzed using Profiler, a custom software package for the analysis of active peptide substrates.
Screening for SIRT3 Inhibitors
A library of 100,000 compounds (Chembridge) in pools of 8 was screened against SIRT3 in 384-deep-well microplates (Greiner, Park Stonehouse, UK). A total of 320 compounds were screened per plate with 32 positive and 32 negative controls placed in the first two and last two columns (1, 2, 23, 24). Positive control wells contained reactions with 2% DMSO only, and negative control wells had no enzyme. Library screening and hit confirmation assays contained 10 µM of each compound pooled (a total of 8 compounds), 5 nM SIRT3, and a mixture of peptide GYKAcRGC and NAD+ at 10 µM and 200 µM, respectively. Compounds were transferred to 384 well plates using a PlateMate (Matrix Technologies, Maumee, OH) with a 384-channel dispensing head. SIRT3 was incubated with the compound and controls for 30 min before starting the reaction with peptide GYKAcRGC and NAD+ mixture. Reactions were carried out at 25 °C for 1 h, stopped with 0.5% formic acid, and neutralized with 1% sodium bicarbonate using Multidrop Combi Reagent Dispenser (Thermo Scientific). Reactions were analyzed as described above.
Cross-Screening
Hit compounds screened against LSD1 were assayed using the manufacturer’s suggested conditions (BPS Biosciences), with the exception that the substrate, a peptide spanning residues 1–21 of histone H3K4Me2 and containing a C-terminal biotin group (AnaSpec), was used at 250 nM—the experimentally determined Km (data not shown). The 50 µL reactions, containing 1.04 ng LSD1 or 200 pM, were initiated with the addition of the peptide substrate. The LSD1 reactions were incubated for 2 h, then stopped with 0.5% formic acid, and neutralized with 1% sodium bicarbonate. Next, peptide substrate/product was immobilized on biotin-presenting self-assembled monolayers coated with neutravidin, washed with diH2O, and analyzed as above. SIRT1 assays were performed at 25 nM SIRT1 using equivalent conditions to SIRT3 (10 µM GYKAcRGC peptide, 200 µM NAD+, 1 h reaction) and analyzed as described above. The Km/[S] for each peptide in the assays was 1–2.
Results and Discussion
SIRT3 acts on multiple acetylated substrates in vivo, but many of these are large proteins and not optimal for analysis by SAMDI. To identify a short peptide substrate, we prepared an array having 361 acetylated peptides six residues in length, and we used a SAMDI array to identify efficient substrates for SIRT3. The peptides have the sequence NH2-GXKAcZGC-CONH2, where the X- and Y-positions are variable and represent one of the 19 natural amino acids (all except cysteine). The terminal cysteine residues reacted with maleimide-terminated self-assembled monolayers ( Fig. 1A ) on a 384 SAMDI array, with spots in the standard geometry of a microtiter well plate. This covalent reaction allows peptides to be captured, while unreacted peptides and buffer components are washed away with a simple rinsing step. Next, we applied a solution of the SIRT3 enzyme in activity buffer to each spot in the array using Multidrop Combi. After 1 h, we stopped the reactions by rinsing the surfaces with ethanol and then water. Hence, each of the 384 samples was efficiently purified prior to MS by selectively binding to the maleimide surface. This purification step eliminates contaminants, including salts, which often negatively affect signal during MS. Finally, we applied matrix and analyzed the array by MALDI-TOF. We analyzed the raw spectra ( Fig 1B ) and determined % activity, or relative conversion to product, using a custom program that calculates the area under the curves for both the substrate and product. SIRT3 shows a strong preference for arginine, leucine, tryptophan, and tyrosine in the X-position and arginine or hydrophobic/aromatic residues in the Z-position. This is consistent with recent activity data using the SPOT assay format, 12 where the preferred substrates are (Y/H/R)-KAc-(K/W/R). Peptides with the highest level of deacetylation in the SAMDI assay (>90% conversion to the acetylated product) included GYKAcRGC and GRKAcRGC. We selected GYKAcRGC as the best substrate for follow-up assays due to overall activity, purity, and signal-to-noise in the SAMDI readout.
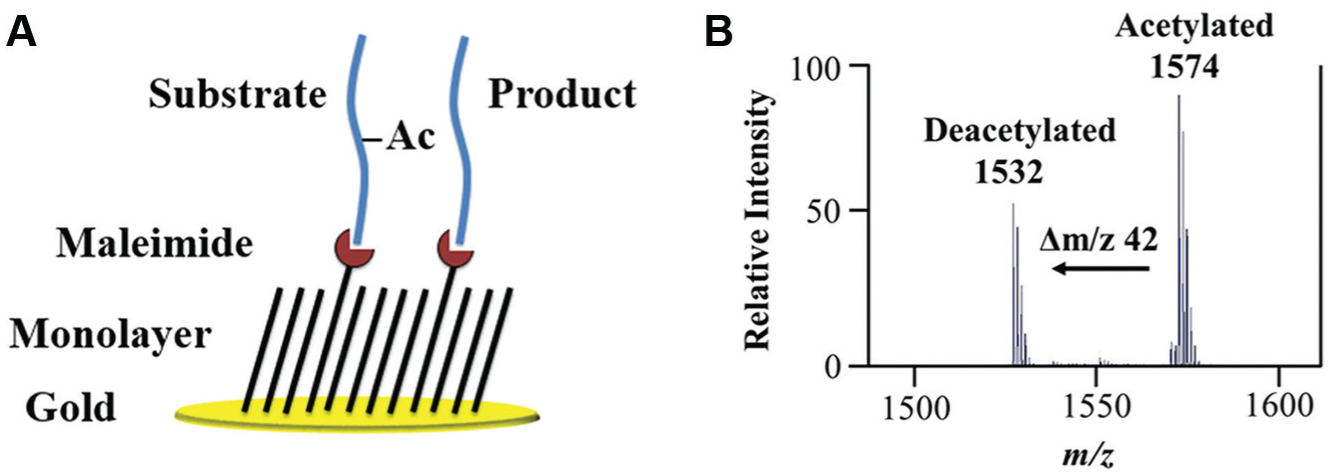
Self-assembled monolayer desorption/ionization (SAMDI) mass spectrometry. (
Using this GYKAcRGC peptide substrate, we developed assay conditions for SIRT3 that could be used in a screen of a small-molecule library. Unlike the peptide array experiment, which used a solid phase assay format, an ideal screen would use a homogenous assay based on a set of balanced conditions in which each substrate is present at a concentration near its Km, thus limiting the bias toward either competitive or uncompetitive inhibitors. Therefore, we determined the values of Km for the peptide and the NAD+ cofactor. Reactions containing enzyme (5 nM), peptide (100, 50, 25, 12.5, 6.25, 3.12, 1.56, 0.78, and 0.39 µM), and NAD+ (1000, 500, 250, 125, 62.5, 31.2, 15.6, 7.81, 3.90, 1.95, 0.97, 0.48, 0.24, 0.12, and 0.06 µM) were performed in a 384-well microtiter plate and then quenched by adding 5% formic acid. At a fixed NAD+ concentration of 500 µM, the peptide Km was 5.7 µM ( Fig. 2A ). Similarly, at a peptide concentration of 5.7 µM (corresponding to the Km for the peptide), the NAD+ Km was 180 µM ( Fig. 2B ). Using these balanced conditions for the peptide and NAD+ cofactor, we measured conversion at various enzyme concentrations (V0 vs. [E]) ( Fig. 2C ). The initial velocities were plotted and revealed a linear increase in activity up to 50 nM of the enzyme ( Fig. 2D ). Based on these results, we selected 5 nM of SIRT3 for 60 min for compound screening, thereby remaining at 30% conversion to product and in the linear activity range of the enzyme.
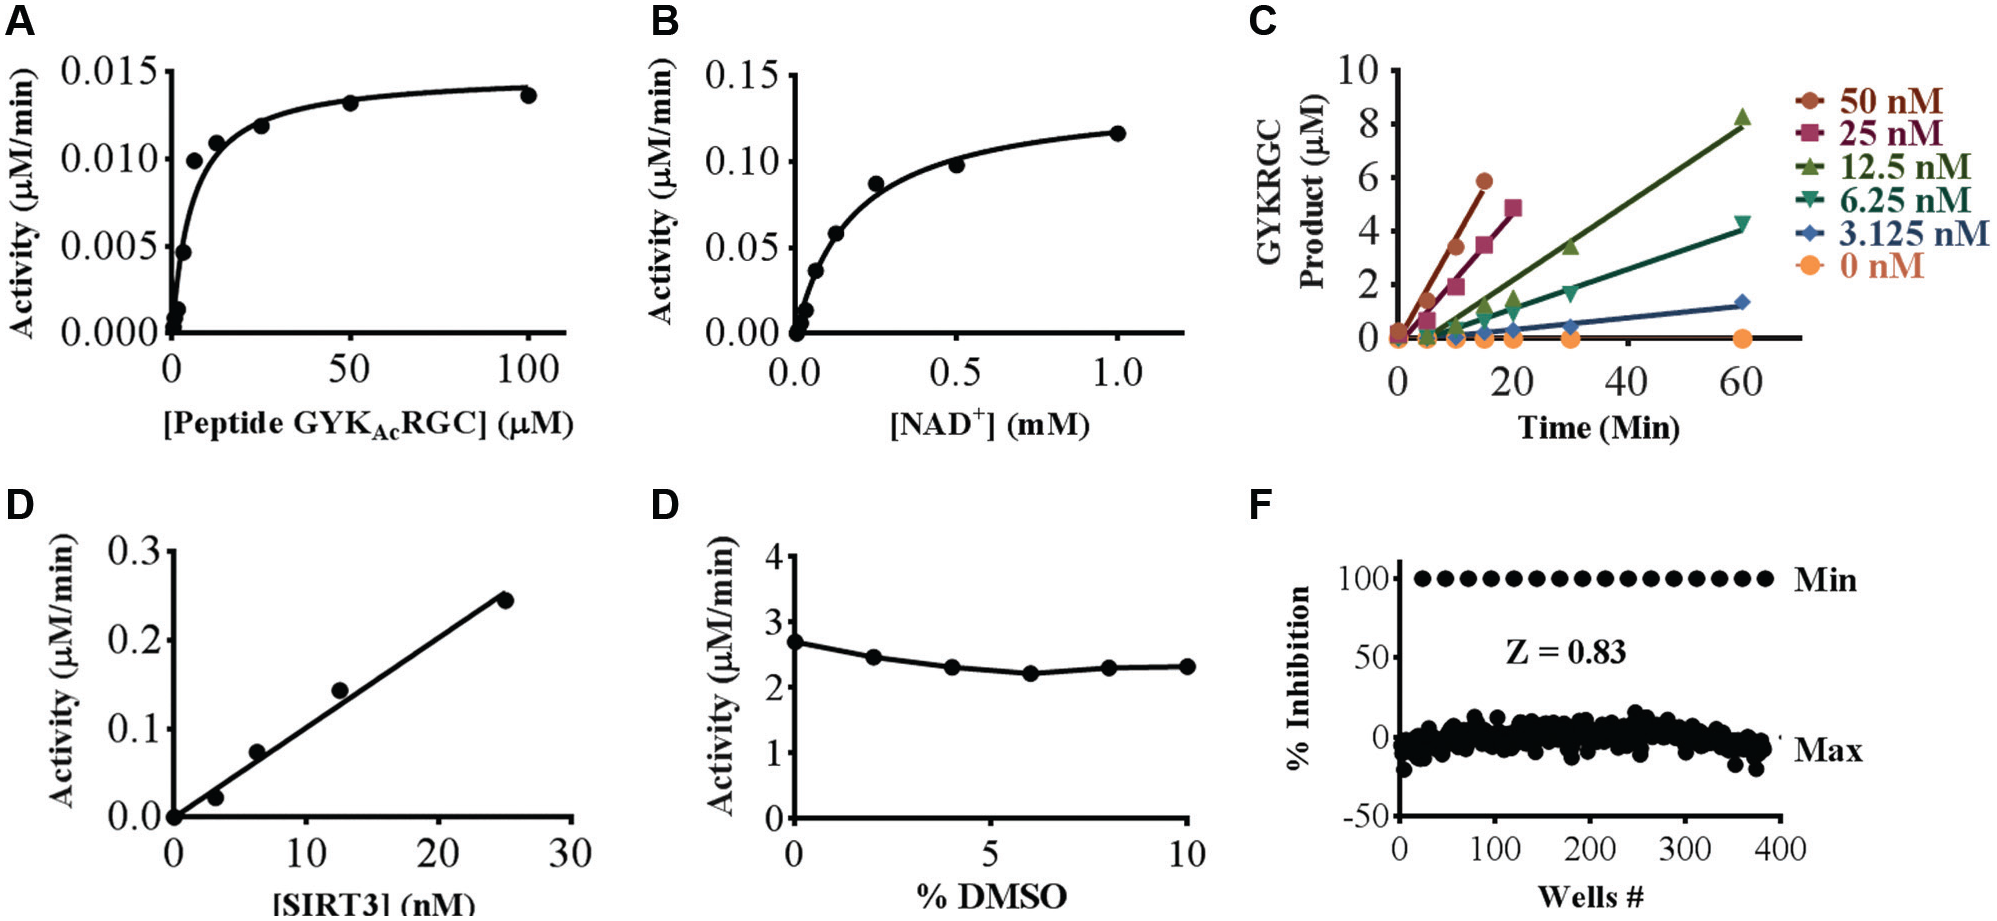
Sirtuin 3 (SIRT3) assay development. (A) Peptide GYKAcRGC Km and Vmax at 5.68 µM and 0.014 µM/min, respectively. (B) Coenzyme NAD+ Km and Vmax at 0.180 mM and 0.14 µM/min, respectively. (C) Plot of reaction velocities at 50, 25, 12.5, 6.25, 3.125, and 0 nM enzyme concentrations, measured as slopes of the product (µM/min). (D) Linearity of SIRT3 activity with a range of enzyme concentrations from 25 nM to 1.56 nM. (E) Stability of SIRT3 enzyme-catalyzed reactions in DMSO concentrations ranging from 0% to 10%. (F) Plate uniformity Z-factor of 0.83 with negative controls at an experimental 100% inhibition. The following experiments were done in triplicate: peptide GYKAcRGC Km, coenzyme NAD+ Km, enzyme velocity, and DMSO tolerance with error bars representing standard deviation.
We then tested SIRT3 activity for both DMSO tolerance and uniformity in the 384-well format. DMSO was tested from 0% to 10% to assess the effect on the enzyme activity. The presence of up to 10% DMSO in the reaction resulted in very little change in initial velocity ( Fig. 2E ). Logistically, the preferred DMSO concentration is 2%, which allows for a direct 1:50 dilution of the pooled compound library. With a fixed concentration of 2% DMSO, we ran the assay in a full 384-well microtiter plate with negative control wells that exclude enzyme in columns 23–24. The Z-factor for this plate was 0.83 ( Fig. 2F ), signifying a robust SIRT3 assay that can be translated into a high-throughput screen for enzyme inhibitors.
We used the optimized SIRT3 assay conditions to screen a 100,000 diverse compound library for modulators of the enzyme activity. To screen this library more efficiently, we combined the collections of compounds into pools of 8 per well. In the stocks of pooled compounds, each compound was present at a concentration of 500 µM in 100% DMSO. We plated 0.5 µL as a 50× into 24.5 µL of a reaction mixture in 384-well plates. The final concentration of each compound in the well was 10 µM, or 80 µM total pooled compounds. Consequently, we screened 40 384-well plates (a total of 12,800 compound wells) with appropriate positive and negative controls for determining Z’-factors. The screen was robust with Z’-factors ranging from 0.61 to 0.86 ( Fig. 3B ) and a mean Z’ of 0.75. We defined hits as compounds that displayed % inhibition greater than 65% inhibition, which was 2.3 standard deviations higher than the mean ( Fig. 3A ). The resulting was 4.5% of the pools, which was a manageable number to carry forward into confirming pool hits and identifying single-compound inhibitors. A total of 567 confirmed pooled hits, corresponding to 4558 compounds, were separated into single compounds per well and assayed at 10 µM final concentration ( Fig. 3C ). The 65% inhibition cutoff yielded a final hit rate of 482 compounds, or 0.48% of the initial library.
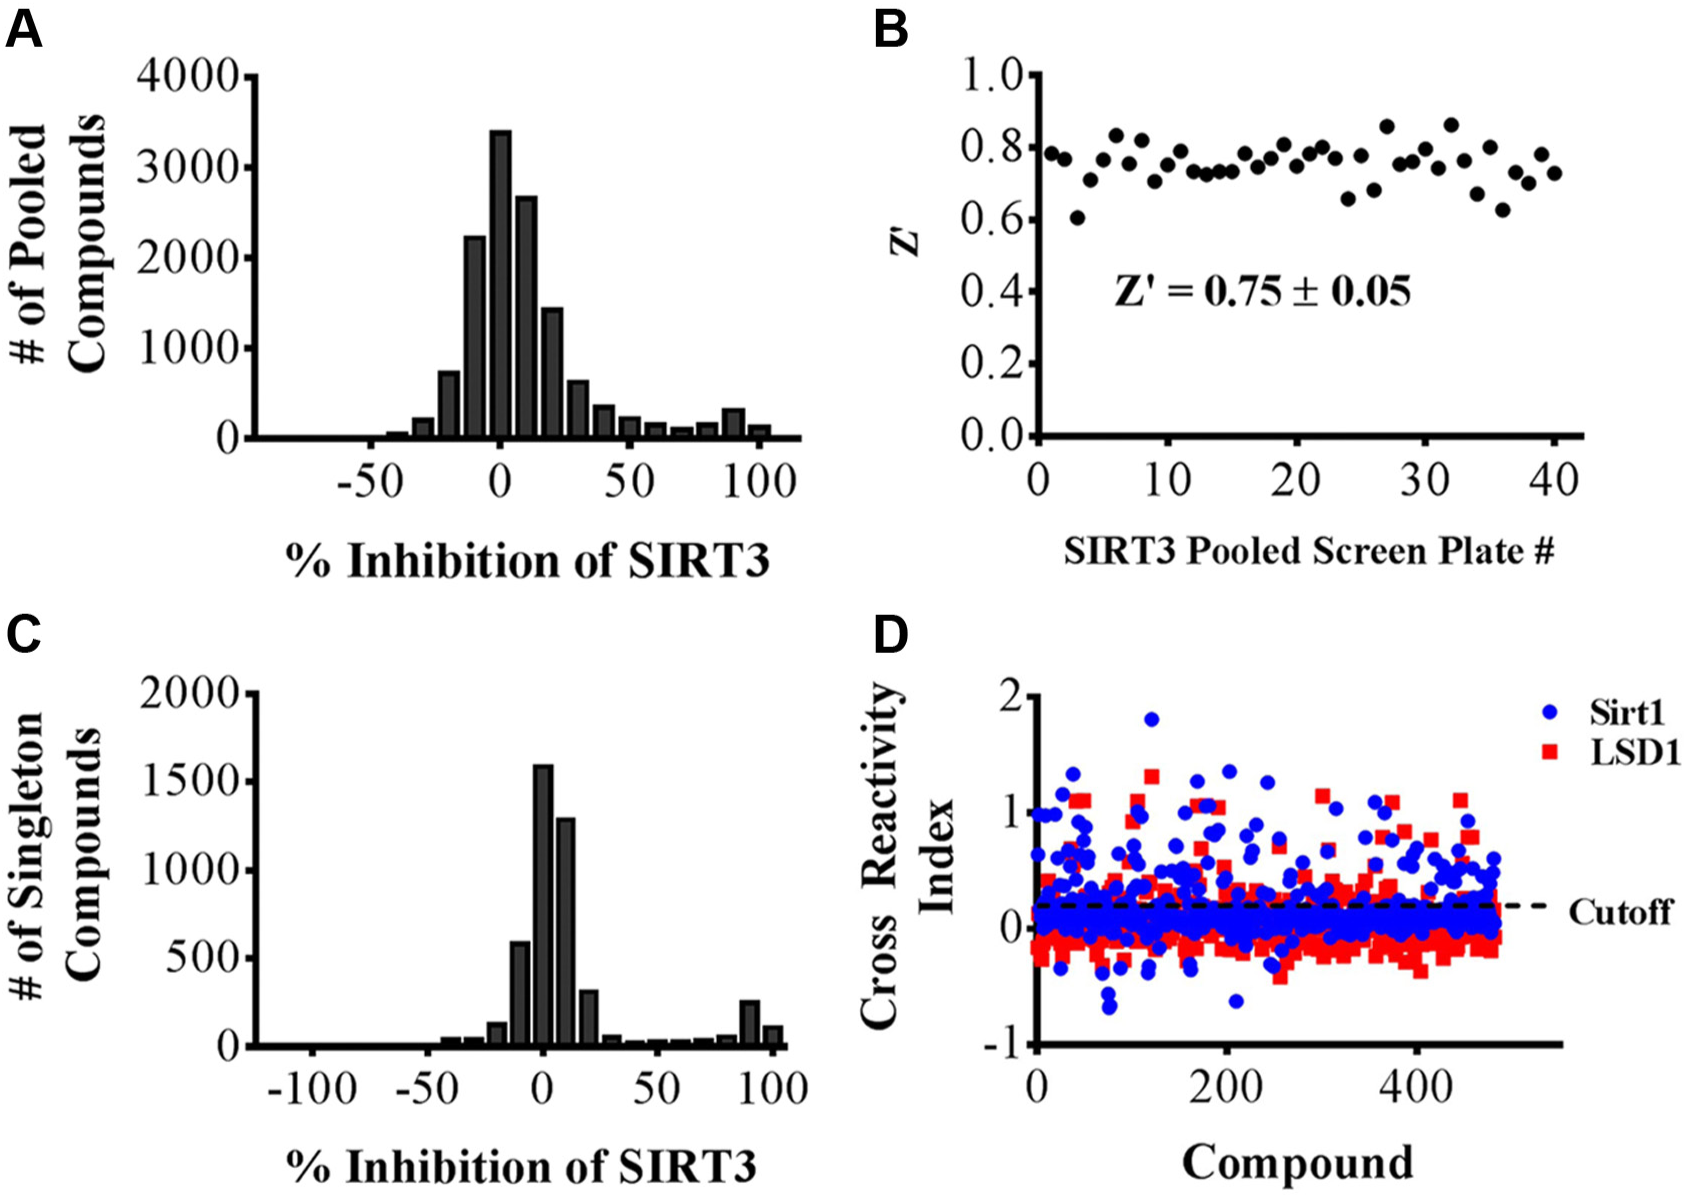
Sirtuin 3 (SIRT3) high-throughput screening (HTS) and hit validation. (A) Histogram of pooled compound wells (8 comp/well) vs. % inhibition of SIRT3 HTS. (B) A plot of Z’ values across 40 384-well plates in a SIRT3 HTS of 100,000 compounds. (C) Histogram of singleton compounds (deconvoluted pools) vs. % inhibition of SIRT3 confirmation screen. (D) Cross-reactivity index (CRI) vs. compound tested against SIRT1 and LSD1 with a 20% cross-reactivity cutoff.
Because we aimed to identify compounds that were selective for inhibiting SIRT3, we subsequently screened the 482 compounds identified above against two additional enzymes to determine cross-reactivity. We screened SIRT1 deacetylase, a member of the sirtuin family with 63% similarity to SIRT3; and LSD1 demethylase, which is unrelated to the deacetylases and uses FAD+ as a cofactor. We chose LSD1 to eliminate compounds that inhibit enzymes based on redox activity, because it has been recently shown that redox-active compounds are prevalent in diverse libraries. 13 Many of the compounds inhibited SIRT1 or LSD1 as well as SIRT3, and we took a semiquantitative approach to describing the initial selectivity of the inhibitors—the cross-reactivity index (CRI). We define the CRI of a compound as % inhibition of SIRT1 or LSD1 divided by % inhibition of SIRT3. Thus, a CRI of 1 (against, e.g., LSD1) inhibits SIRT3 and LSD1 equally and indicates 100% cross-reactivity, whereas a CRI of 0 indicates a compound that inhibits only SIRT3. This approach allowed us to eliminate compounds that do not inhibit SIRT3 specifically. The CRI values for all compounds are plotted in Figure 3D . We defined the cutoff for cross-reactivity of compounds to be 0.2, or 20%. With this, a total of 134 compounds were cross-reactive against SIRT1 and 88 against LSD1, resulting in 306 SIRT3 inhibitors and a final SIRT3 hit rate of 0.3%.
We identified 306 SIRT3 inhibitors in a 100,000 diverse compound screen. To validate our approach, we analyzed the 306 SIRT3 compounds and chose six molecules based on their size, reactivity, and pharmacophore-like properties. One of these molecules, SDX-437, exhibited an IC50 of 700 nM in the SIRT3 assay ( Fig. 4A ) with no inhibition observed with the SIRT1 specific inhibitor, suramin. Suramin has been shown to inhibit SIRT1 and SIRT5, 14 but isn’t active against SIRT3. We also tested SDX-437 in the SIRT1 assay, resulting in no inhibition when compared to suramin (IC50 = 62 nM; Fig. 4B ). These results suggest that SDX-437 is specific to SIRT3 and not SIRT1.
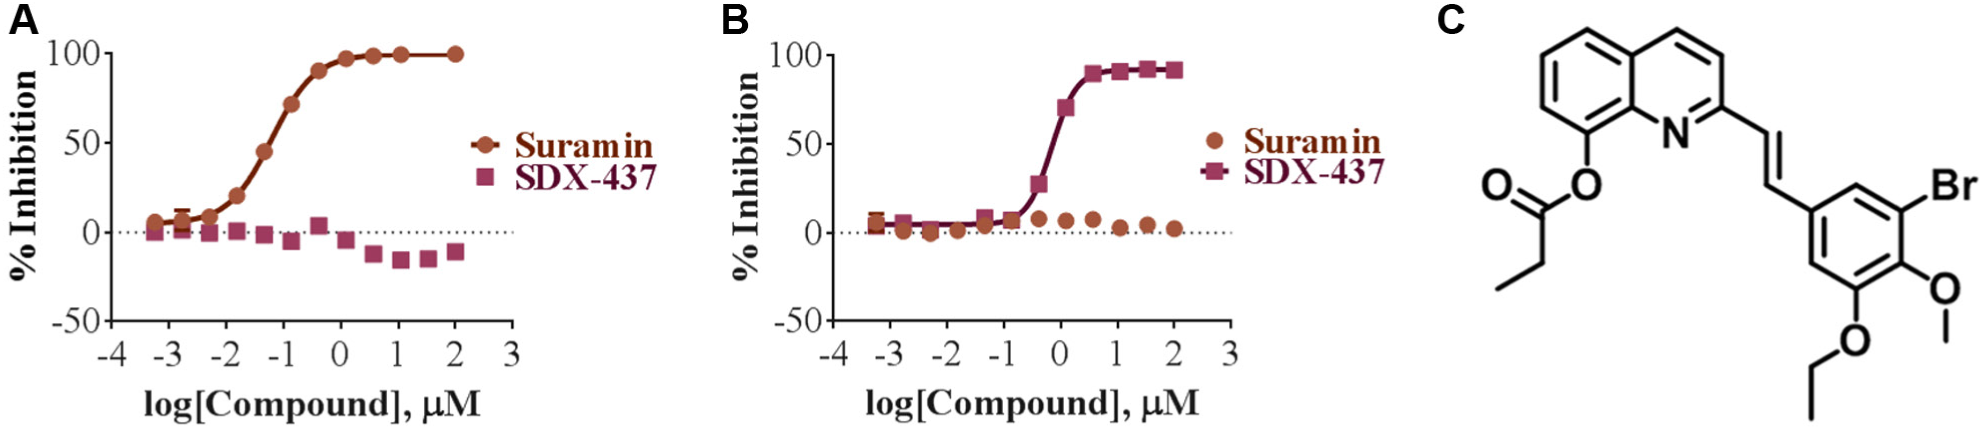
IC50 dose–response plot of sirtuin 1 (SIRT1) and SIRT3 inhibitors. (
There are few assay technologies available for HTS of deacetylase activity. The common formats include the protease-coupled Fluor de Lys (FdL) assay, 5 TR-FRET, 15 and RapidFire chromatography coupled with MS. 7 The FdL assay technology uses enzyme-linked detection of activity on a coumarin-labeled substrate and suffers from a high level of false positive or negatives if compounds interfere with detection. TR-FRET reduces the number of assay artifacts, but relies on antibodies for detection of the reaction product. MS provides the lowest level of assay artifacts, is quantitative, and does not require the use of a labeled substrate or product. In fact, MS was recently used as a secondary screen for hit confirmation of HTS TR-FRET assays of more than 3 million compounds. 7
In this study, we report a high-throughput, label-free approach for screening modulators of SIRT3 deacetylase activity using SAMDI-MS. The use of SAMDI to specifically capture peptide substrates to monolayers of alkanethiolates on gold eliminates the need for cumbersome solid phase extraction prior to MALDI-TOF MS. We used a SAMDI biochip format that allowed 384 samples to be purified simultaneously, permitting efficient screening of peptide substrates and enzyme modulators. We identified an optimized SIRT3 peptide substrate (GYKAcRGC) suitable for SAMDI that is both short and positively charged, thus allowing for efficient ionization and mass resolution by MALDI-TOF MS. These characteristics combined with superior activity, low cost of production, and compatibility with using low nanomolar concentrations of enzyme make it an ideal substrate for measuring SIRT3 deacetylation in vitro. Using this peptide, we used SAMDI-MS to quantitatively measure Km of both the substrate and NAD+ cofactor. The peptide Km of 5.7 µM of this natural peptide substrate compares well to the coumarin-labeled fluorescent substrate with a Km of 32 µM (Enzo Life Sciences, Farmingdale, NY). The Km of 180 µM for NAD+ cofactor, while the peptide substrate is at Km, also compares favorably to the recommended 500 µM in the commercial fluorescence assay. These Km values were used as the balanced conditions for the development of a highly sensitive deacetylase assay. The optimized SIRT3 assay was used to screen a pooled collection of 100,000 compounds, yielding an initial hit rate of 4%. The pooled hits were then assayed as singleton compounds using a consistent 65% inhibition cutoff, resulting in a hit rate of 0.48% for the screen, or 482 compounds. To address hit compound specificity, we cross-screened against the related SIRT1 deacetylase and an unrelated demethylase, LSD1. This step eliminated 176 compounds that were cross-reactive with either of these enzymes, reducing the hits to 306, or 0.3%.
We determined a substrate for SIRT3 by profiling the enzyme against a library of peptides with a fixed acetylated lysine. Using a SAMDI peptide array of 361 acetylated 6-mer peptides, we determined the substrate specificity and activity of SIRT3 deacetylase. This approach uses peptides that are immobilized prior to an enzymatic reaction, using only 2 µL of enzyme–buffer mixture per sample, and translating into less than 0.8 mL of reagents and efficient use of costly enzyme. The array data identify substrate preferences that provide information about SIRT3 substrate specificity. It is possible to expand the GYKAcRGC substrate beyond the core YKAcR sequence by randomizing the +2 and −2 positions, and, furthermore, to identify substrates with better Kcat and Km values and specificity compared with other deacetylases. Specific substrates could be useful tools for measuring SIRT3 endogenous deacetylase activity in cell lysates. This approach could also be expanded to all sirtuins for activity profiling and possibly using lysates of diseased and normal cells.
In summary, we demonstrated the utility of SAMDI to characterize SIRT3 deacetylase and discover a novel, specific inhibitor from a 100,000-compound library. We identified a SIRT3 inhibitor with sub-micromolar IC50 that exhibits a strong preference over the related SIRT1 and unrelated LSD1 demethylase. This compound, SDX-437, may be a useful tool compound for further study of SIRT3 activity.
Footnotes
Declaration of Conflicting Interests
The authors declared no potential conflicts of interest with respect to the research, authorship, and/or publication of this article.
Funding
This work was partially funded by Phase II SBIR award NSF10-607.