
Abstract
Fragile X syndrome (FXS) is the most common form of inherited mental retardation, and it is caused in most of cases by epigenetic silencing of the Fmr1 gene. Today, no specific therapy exists for FXS, and current treatments are only directed to improve behavioral symptoms. Neuronal progenitors derived from FXS patient induced pluripotent stem cells (iPSCs) represent a unique model to study the disease and develop assays for large-scale drug discovery screens since they conserve the Fmr1 gene silenced within the disease context. We have established a high-content imaging assay to run a large-scale phenotypic screen aimed to identify compounds that reactivate the silenced Fmr1 gene. A set of 50,000 compounds was tested, including modulators of several epigenetic targets. We describe an integrated drug discovery model comprising iPSC generation, culture scale-up, and quality control and screening with a very sensitive high-content imaging assay assisted by single-cell image analysis and multiparametric data analysis based on machine learning algorithms. The screening identified several compounds that induced a weak expression of fragile X mental retardation protein (FMRP) and thus sets the basis for further large-scale screens to find candidate drugs or targets tackling the underlying mechanism of FXS with potential for therapeutic intervention.
Introduction
Fragile X syndrome (FXS) is the most common form of inherited mental retardation associated with a large spectrum of different symptoms such as autism, intellectual disabilities, attention deficit, hyperactivity, and anxiety. Patients with FXS carry a CGG repeat expansion in the 5′ untranslated region (UTR) of the Fmr1 gene located in the X chromosome. This expansion causes DNA hypermethylation and subsequent translational silencing of the Fmr1 gene accompanied by lack of fragile X mental retardation protein (FMRP). 1 FMRP plays an important role as a synaptic regulator, and its absence results in the clinically observed symptoms in patients with FXS.2,3 Interestingly, rare individuals have been identified who carry >200 CGG repeat expansion without methylation and silencing (unmethylated full mutations or UFM), express FMRP (10%−60% of normal levels), and do not show the disease phenotype. 4 Therefore, tackling the underlying disease mechanism of FXS—namely, the silencing of Fmr1 and lack of FMRP—should lead to a better clinical outcome. This could complement drug discovery approaches that are directed to rescue the neuronal phenotype or the regulation of altered neurologic signaling pathways but do not affect the methylation status of Fmr1. 5
To study the disease, there are promising although limited animal models. 6 The Fmr1 knockout mouse shares anatomic and behavioral phenotypes with the human FXS and has contributed to the understanding of the neurobiology of the disease. 7 Although animal models allow the study of behavioral phenotypes, 8 mouse models with CGG repeat expansion knocked into Fmr1 do not methylate and silence the promoter, failing to recapitulate this aspect of the disease.9,10 Therefore, human-derived tissues are preferred to investigate the molecular mechanism of the disease and find therapeutic targets. Both human embryonic stem cells (ESCs) and induced pluripotent stem cells (iPSCs) have been used to model FXS,11–13 although there are critical differences among them. In ESCs, the Fmr1 gene is still expressed in undifferentiated cells and undergoes silencing upon differentiation, whereas in iPSCs, the Fmr1 gene remains silent also before differentiation. 14 Although FXS-iPSCs cannot mimic the silencing of Fmr1 that occurs during development, they are an useful model system for studying disease mechanisms and for drug screening approaches since they contain a silent Fmr1 locus in the context of the human disease. 15 However, working with scaled-up cultures of iPSC patient-derived cells represents a major challenge partially due to the high variation during differentiation resulting in heterogeneous neuronal cultures. 16 To date, control for the prominent heterogeneity of iPSC patient-derived cells continues to be the major limitation to standardize assays for high-throughput screening (HTS).
Drug discovery approaches have been successful in the past rescuing neuronal phenotypes in the context of FXS—namely, the regulation of altered neurologic signaling pathways. 17 In addition, FXS neurons are characterized for having a reduced density of postsynaptic dendrites; therefore, a number of assays have been developed in cellular models to detect either levels of synaptic proteins or neurite length. 18 However, these approaches do not directly measure the reactivation of Fmr1 but rather the downstream effects of the lack of FMRP; consequently, it would be desirable to develop high-throughput assays to identify compounds tackling the disease at the epigenetic level. The most promising route would be conducting lead-finding efforts using a relevant model in the context of FXS. Recently, Colak and colleagues 19 showed that initiation of Fmr1 silencing in human ESCs is mediated by Fmr1 messenger RNA (RNA) by hybridizing with the CGG repeat expansion of the Fmr1 gene to form an RNA-DNA duplex and described a compound that prevents it. With this approach, Fmr1 silencing is prevented, but once the Fmr1 gene is silenced, this approach fails to reactivate it since a different unknown mechanism maintains the gene silent.
Here, we present a large-scale compound screen designed to detect molecules that reactivate the silenced Fmr1 locus in FXS. We show the development and miniaturization of a high-content imaging assay to measure the expression of FMRP on FXS-iPSC patient-derived neuronal progenitors. This cellular model was established and characterized and is to date the most relevant to represent the epigenetic aspect of the human disease. The assay allows single-cell analysis and to capture the heterogeneity of the reactivation in the culture, as well as the cellular morphology and subcellular protein distribution. Multiparametric analysis of the data together with machine learning algorithms allowed a very sensitive detection of FMRP to capture the low reactivation sufficient for therapeutic use. We screened a 50,000-compound set with a robust and reproducible assay performance in 384-well plates, thus supporting the use of FXS-iPSC patient-derived cells as a disease model suitable for use in the HTS format for drug discovery applications.
Materials and Methods
Ethics Statement
Human skin-tissue was collected in an anonymized way as an extension of a previous study, 5 which was reviewed by the independent ethics committee or institutional review board for the centers involved as previously stated. Informed consent for the participation of the patients was obtained from their legal guardians and covered subsequent iPSC generation and screening.
Cell Reprogramming and Differentiation
Primary human dermal fibroblasts from neonatal (Invitrogen, Carlsbad, CA) or from 3-mm skin biopsies obtained from donors, isolated and cultured as described previously, 20 were used for reprogramming using Sendai virus with the help of the CytoTune-iPS reprogramming kit (Life Technologies, Carlsbad, CA) according to the standard protocol. Colonies with a hallmark of pluripotent morphology were readily visible between days 17 and 20 after transduction. These were picked and subcloned multiple times on plates coated with Matrigel (BD Biosciences, San Jose, CA) in mTeSR medium until Sendai virus RNA could no longer be detected and the morphology looked stable. Pluripotency was controlled by immunohistochemistry (IHC) with the following antibodies according to the instructions of the provider: Nanog (Santa Cruz Biotechnology, Dallas, TX), SSEA-1 (Millipore, Darmstadt, Germany), and SSEA-3 and SSEA-4 (Stemgent, Cambridge, MA), as well as by fluorescence-activated cell sorting (FACS) analyses with the Human Pluripotent Stem Cell Sorting and Analysis Kit (BD Biosciences) using Oct3/4, Sox2, Nanog, SSEA-3, and Tra1-81 as pluripotency markers and SSEA-1 as a differentiation marker following the protocols suggested by the provider. Karyotype analyses was performed by full-genome single-nucleotide polymorphism (SNP) analyses and showed a normal karyotype of the selected lines. Neuronal precursors were differentiated from iPSCs by using dual Smad inhibition as described earlier.21,22 Briefly, 105 undifferentiated human iPSCs (hiPSCs) were given to an ultra-low attachment 96-well in 0.1 mL neural induction medium (20% knockout-serum replacement; Invitrogen), 0.1 mM minimum essential medium (MEM) nonessential amino acids (Invitrogen), 0.1 mM 2-mercaptoethanol (Invitrogen), 75% Dulbecco’s modified Eagle’s medium (DMEM)/F11/GlutaMAX (Invitrogen/Gibco), penicillin/streptomycin, 10 ng/mL−1 basic human fibroblast growth factor (bhFGF) (1:1000; Invitrogen), 10 µM SB 431542 (1:1000) (Tocris, Bristol, UK), and 1 µM LDN 193189 (1:10,000) (Stemgent) with 10 µM Rock inhibitor to prevent apoptosis (Calbiochem, Darmstadt, Germany). Two days later, 0.1 mL of fresh induction media was added to the old one. The next day, 30 embryoid bodies (EBs) were transferred to a 35-mm Matrigel dish with induction media. At day 10, EBs were cleaned as well as possible to have only neuronal rosettes left. Then the plate was trypsinized and plated on a new 35-mm Matrigel plate in proliferation medium (DMEM/F12 with B27 and N2 supplements [Invitrogen] with 10 ng/mL−1 bhFGF and 10 ng/mL human epidermal growth factor [hEGF]) supplemented with 10 µM Rock inhibitor (Calbiochem). As soon as the plate was highly confluent, neuronal progenitor cells (NPCs) were split by trypsinization either on Matrigel plates for further amplification or frozen with 10% DMSO (vol/vol) at a concentration of 106 cells per vial and stored in liquid nitrogen.
Cell Characterization and Quality Control
Quality control of the NPC culture was performed by using CD24, CD184, and CD44 of the Human Neural Cell Sorting Kit (BD Biosciences) according to the suggested protocol of the provider. Fmr1 CGG repeat analysis was done by Southern blot and hybridization or PCR. For Southern blot, genomic DNA was digested with EcoRI and hybridized with the radioactively labeled StB12.13 probe as described previously. 23 For the PCR amplification of CGG repeats, the AmplideX Fmr1 PCR Kit (Asuragen, Austin, TX) was used with primers flanking the repeats. The PCR products were analyzed by gel electrophoresis as described before. 24 For the Fmr1 promoter, methylation analysis by bisulfite treatment and pyrosequencing were used, covering 22 CpGs of the promoter (assay ADS145) (EpigenDx, Hopkinton, MA). For mRNA quantification, total RNA was extracted with the RNeasy Mini Kit 74126 (Qiagen, Hilden, Germany) and quantified by quantitative PCR (qPCR) with the Fmr1 (Hs00924544_m1) and PPIB (Hs00168719_m1) TaqMan gene expression assays (Life Technologies).
Cell Culture and Scale-up
Cell culture flasks were first coated with Matrigel. A Matrigel stock was diluted in precooled DMEM/ F-12 + GlutaMAX (Invitrogen) at three times the recommended concentration from the manufacturer, and 8 mL of the solution was added to a T80 flask or 4 mL to T25. Matrigel was polymerized for 1 h at room temperature and stored at 4 °C. Cells were maintained in proliferation medium. Medium was changed every 3 to 4 days, and cells were split every 10 to 14 days. To split cells, these were washed with phosphate-buffered saline (PBS) without calcium and magnesium, and TrypLE was added for 5 minutes at 37 °C. Cells were resuspended in proliferation media containing 10 µM Rock inhibitor and seeded at a density of 30 million cells in a T80 flask previously coated with Matrigel. After 24 h, Rock inhibitor was washed out. For storage, cells were resuspended in fetal calf serum (FCS) containing 10% DMSO (vol/vol) and stored in liquid nitrogen. Populations were identified as following: NPCs (CD24+, CD44–, CD184+), neurons (CD24+, CD184–, CD44–), and glia (CD184+, CD44+) using the Human Neural Cell Sorting Kit (BD Biosciences). The cultures were then tested with the imaging assay for FMRP reactivation before using them for screening.
High-Content Imaging Assay
NPCs were plated in 384-well optical imaging, flat, clear-bottom, black microplates (Corning B.V. Life Sciences, Amsterdam, The Netherlands) previously covered with Matrigel at a density between 10,000 and 80,000 cells per well using an automated dispenser (Multidrop Combi; Thermo Scientific, Waltham, MA). Cells were incubated for 24 h at 37 °C and 5% CO2 to allow them to attach. The positive control was added manually from a 10-mM stock solution, prediluting it in medium, and several concentrations and incubation times were tested. For the immunostaining, cells were fixed with 4% paraformaldehyde for 15 min. With a plate washer (Power Washer 384; Tecan, San Jose, CA), cells underwent four washing cycles. Then, 10 µL of blocking solution (10% FCS, 0.1% Triton X-100 in PBS) was added for 30 min. The primary FMRP antibody (Santa Cruz Biotechnology) was added at 1:700 in blocking solution. After overnight incubation at 4 °C, cells were washed with PBS, and the secondary antibody (goat anti–mouse Alexa Fluor 488 labeled) (1:500), Hoechst (1:10,000) and CellMask Deep Red (1:5000) (Invitrogen) were added with 1% FCS in PBS and incubated for 60 min. Cells underwent four washing cycles with PBS and were stored at 4 °C until measurement.
Small Interfering RNA and Complementary DNA Transfection
For small interfering RNA (siRNA) transfection experiments, RNAiMAX (cat. no. 13778; Invitrogen) and OptiMEM (cat. no. 11058-021; Invitrogen) were used according to the manufacturer’s instructions. The siRNAs were from Qiagen: Allstars negative control (cat. no. 1027281), Allstars Hs cell death control (cat. no. 1027299), siDNMT1 (SI03081729), and siFMR1 (SI00031626). Other siRNA reagents for Fmr1 and DNMT1 were also evaluated (data not shown). For siRNA transfection experiments, cells were plated either in Lab-Tek II Chamber Slides (Nunc; Thermo Scientific) (2 × 10⁵ cells/well) or in 384-well plates (3000 cells/well). For the Fmr1 knockdown experiments, the cells were processed after 3 days. For the DNMT1 knockdown experiments, the cells were sensitized with 35 nM 5-Aza-2′-deoxycytidine, and cells were processed on day 4.
To express the complementary DNA (cDNA) of mCherry or mCherry fused to FMRP, the pcDNA3.1 expression vector was used. X-tremeGene HP (06366236001; Roche, Basel, Switzerland) was used to transiently transfect cDNA constructs according to the manufacturer’s recommendations. Immunofluorescence staining was performed as indicated above.
For the quantification of mRNA, cells in 384-well plates were lysed with the FastLane Cell Multiplex Kit (Qiagen). The Quantitect Multiplex RT-PCR Kit (Qiagen) and the ViiA 7 Real-Time PCR System (Life Technologies) were used with the probes for Fmr1 (FAM: Hs00924544_m1) and the housekeeping control PPIB (VIC: Hs00168719_m1).
Screening Protocol
For the primary screening, compounds were obtained in 2-mM solutions of 90% DMSO and plated on 384- or 1536-well plates. The latter were reformatted to 384-well assay plates using the Echo 550 Acoustic dispenser (Labcyte, Sunnyvale, CA). To do that, 60 nL of compound was transferred from 1536- to 384-well plates containing 20 µL of medium previously added with the Multidrop Combi (Thermo Scientific) (6-µM compound concentration, 0.27% DMSO). Alternatively, for mode of action (MoA) compounds, 90 nL of compounds was transferred from 1536- to 384-well plates containing 30 µL of media. From this solution, 10 µL of compound was added to cells seeded in 50 µL of media on assay plates with the Cybi-Well (Cybio, Jena, Germany), resulting in a 1-µM final compound concentration in 0.05% DMSO. The positive control (5-aza-2′-deoxycytidine) was received at a 10-mM solution in DMSO. A predilution in media was first prepared (6 µM), and then 30 µL was transferred to the compound plate, from which 10 µL was dispensed into the assay plate to a final concentration of 1 µM (column 24). Column 23 of the assay plate was filled with 0.05% DMSO (neutral control). Compound incubation and immunostaining were performed as described above. From the primary, 2099 compounds were selected for confirmation and were prediluted as indicated for the primary screen. Confirmation was performed with the same protocol as primary screening. For validation, 790 compounds were picked and delivered in 384-well plates in an eight-step dilution series and tested in quadruplicates. The compounds were diluted in 54 µL of media, resulting in concentrations from 180 µM to 0.06 µM and 1.6% DMSO. Then, 10 µL of prediluted compounds was added to the assay plate with the Cybi-Well, resulting in a final concentration range from 30 µM to 0.01 µM and 0.27% DMSO. 5-Aza-2′-deoxycytidine at 1 µM was used as an active control and 0.27% DMSO as a neutral control. The same immunostaining protocol was used for the primary screen.
High-Content Imaging and Image Analysis
During the screening, images were acquired with Opera QEHS imager (Perkin Elmer, Waltham, MA) after immunostaining. For validation, an additional image was acquired after compound incubation and before immunostaining to detect compound autofluorescence. One image, 1376 × 1024 µm in size, was acquired from each well using a 20× objective. Images for Hoechst, Alexa Fluor 488, and CellMask Red were acquired simultaneously. For image segmentation, the nuclei area was detected based on the Hoechst staining, and cytoplasm was detected based on CellMask Red. Different cellular regions were defined as follows: the nuclei area was detected based on the Hoechst staining, and the cytoplasm area was detected based on CellMask Red. In addition, we defined an area around the nucleus, named the “ring region,” that covers part of Golgi, and the “whole cell area,” which includes the nuclear and cytoplasm area. The intensity of the Alexa Fluor 488 signal was measured in the cytoplasm, ring region, nuclear area, and whole cell. In addition, the size of nuclei, the nuclear membrane, and the whole cell was determined, as well as the nuclear roundness. Data were exported as the average of the well and for individual cells.
Data Analysis
The single-cell data were also analyzed using the R statistics software (R Foundation for Statistical Computing, Vienna, Austria). Two types of analysis were considered; the single-sided Kolmogorov-Smirnov (KS) statistic, which considers only negative controls, and a random forest model, which considers both positive and negative controls. The single-sided KS statistic for all cells in the sample well was calculated in comparison to the combined population of cells in the neutral control well of the sample plate using R’s ks.test function. The D-value of the single-sided KS test gave the well summary Cyto_ks_less. This well summary readout is independent of the positive controls. The random forest model was trained based on the phenotype of the positive controls. This was done again using the R software in combination with the bigmemory and bigrf modules. For each plate, the single-cell descriptors were transformed by the empirical cumulative distribution function (ecdf) trained on the neutral obtained from the neutral DMSO controls. For each cell culture batch, a random forest model was trained separately based on these transformed descriptors. The cells of the active and neutral control wells were each split randomly into a training and an independent test set, using a ratio of 20% test and 80% training set cells. The training set was then used to train a random forest model to discriminate cells out of active control wells from those out of neutral control wells. For this, the bigrfc function with the number of trees set to 100 and all other optional parameters left at their default value was used. All single-cell descriptors described above were used as input descriptors in these models. The model returns for each cell whether it should be regarded as a neutral or an active control-like cell, allowing one to calculate the “fraction of responding cells” (“fresp”), that is, active control-like cells in each well. Based on the cells in the independent test set, a Z′ score was calculated.
After analysis, the following readouts were processed for plate pattern correction and data visualization using our in-house software Helios 25 : “Cyto. zscore,” “Cyto_ks_less,” and “fresp.” The following readouts were also considered for analysis: cell count and nuclear area. The percent activity of a sample, defined as the percent FMRP intensity in the cytoplasm per well, was calculated by normalizing the value to the controls in Helios using equation (1):
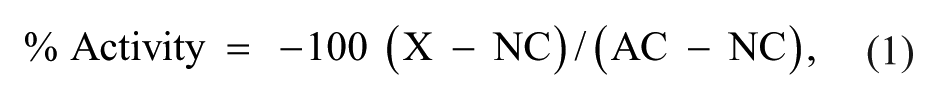
where X represents average FMRP intensity per well, NC represents the average FMRP intensity for the neutral control (DMSO) and AC represents the average FMRP intensity for the active control (1 µM 5-aza-2′-deoxycytidine). The robust Z′ was used to assess assay quality throughout screening, and Z′ values were used during assay development.
Statistical analysis was performed with OriginPro 9.1 software (OriginLab, Northampton, MA). Data were assessed for significance by the two-sample t test. Results were considered statistically significant for p values <0.05.
Results and Discussion
To establish a cellular model for screening, we first derived FXS and wild-type neuronal progenitors from primary patient material. To do this, fibroblasts were reprogramed into iPSCs (
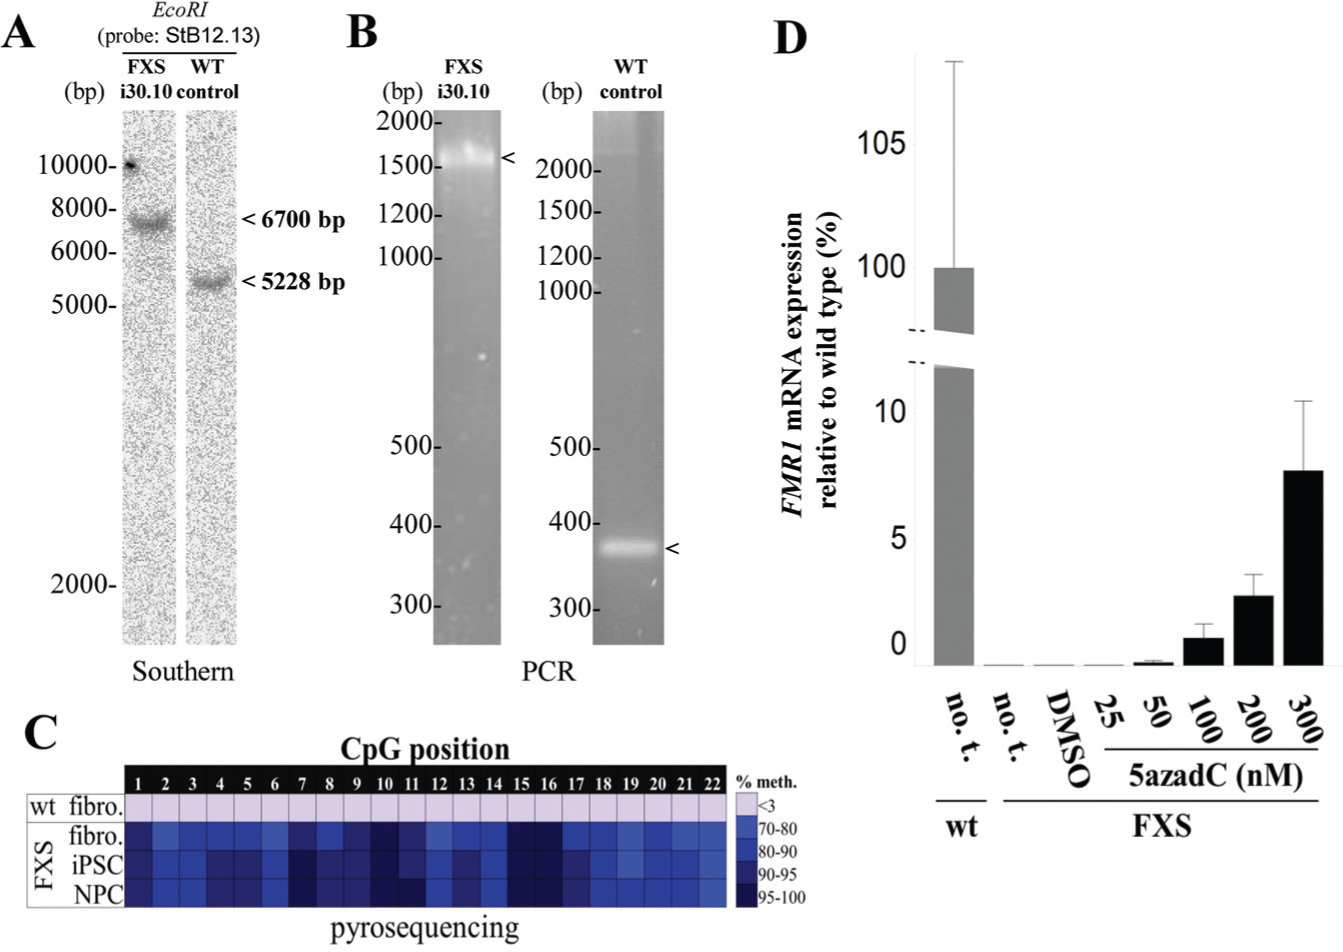
CGG repeat and methylation analysis of Fmr1 in fragile X syndrome (FXS) and wild-type control cells. (
After establishing the cellular model, we evaluated the feasibility of using these cells to run a phenotypic assay in high-throughput format for screening. First, we assessed the possibility of seeding NPCs on 384-well plates and their compatibility with automated systems. We tested different plate coatings and seeded several cell densities to evaluate cell viability and progenitor status. Among the coatings, Matrigel gave the best results in terms of cell attachment and imaging properties. Regarding cell densities, 20,000 cells per well seemed to be the optimal density to conserve the progenitor status of the cells and at the same time show a homogeneous distribution of cells in the well to facilitate image analysis. Too dense populations tended to form clumps difficult to analyze, and too low densities showed a tendency to differentiate into other cell types.
We then focused on the establishment of an end-point imaging assay based on immunostaining to capture the reactivation of the Fmr1 gene in the FXS line by measuring the expression of the gene product FMRP. For that, we used a specific anti-FMRP antibody that we validated for immunostaining by knocking down Fmr1 with siRNA transfection on wild-type cells, leading to a decreased FMRP staining. In addition, we transfected a mCherry-FMRP DNA construct in FXS cells, resulting in specific staining of transfected cells (
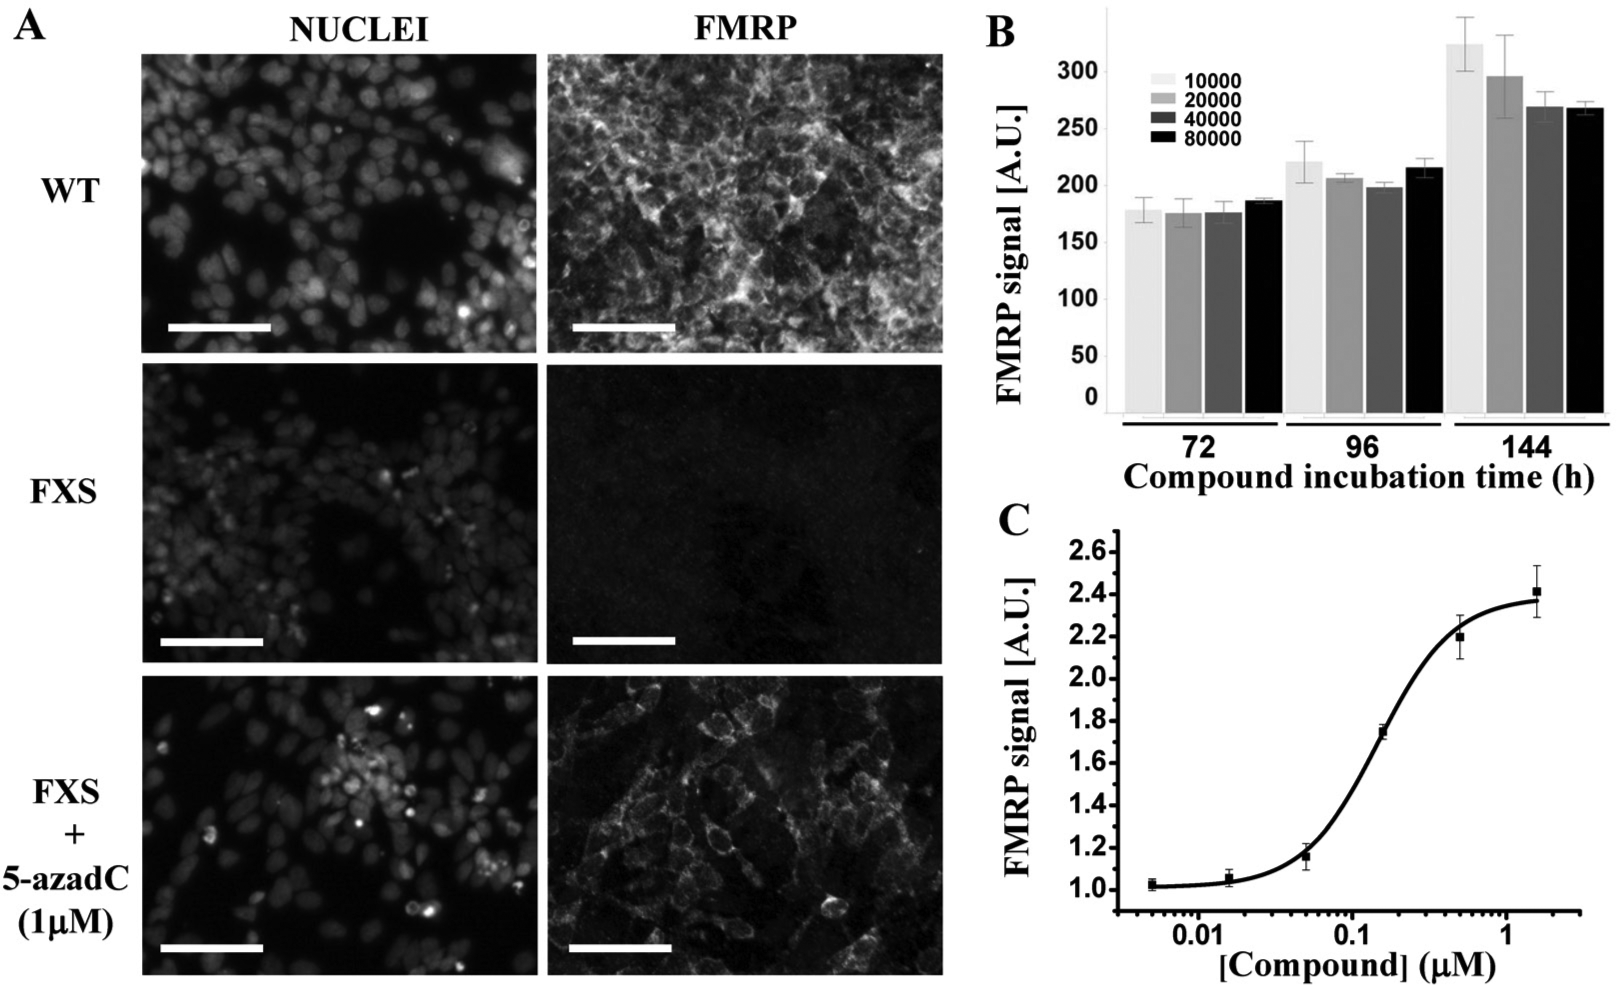
High-content assay development. (
We then established a workflow to perform a pilot screen and thus assess the feasibility of running the assay in a high-throughput format as a preface for a larger screen (
Fig. 3A
). To prepare for the large compound screen, we had to scale up the cell culture of neuronal precursors. Generally, NPCs are cultured on 6-cm dishes, but for our purposes, we had to transfer the culture to flasks. The scale-up of the culture presented several technical challenges, mainly regarding the maintenance of the progenitor status of the cells. To overcome this challenge, it was critical to maintain cells highly confluent and to monitor regularly the differentiation status. The latter was done via FACS analysis to detect several cell-surface markers of neuronal populations such as CD24, CD184, and CD44
27
or by imaging to detect the expression of FMRP after 5-aza-2′-deoxycytidine addition, which only occurs in dividing but not in differentiated cells. We used the FACS analysis to monitor the homogeneity of our cultures (
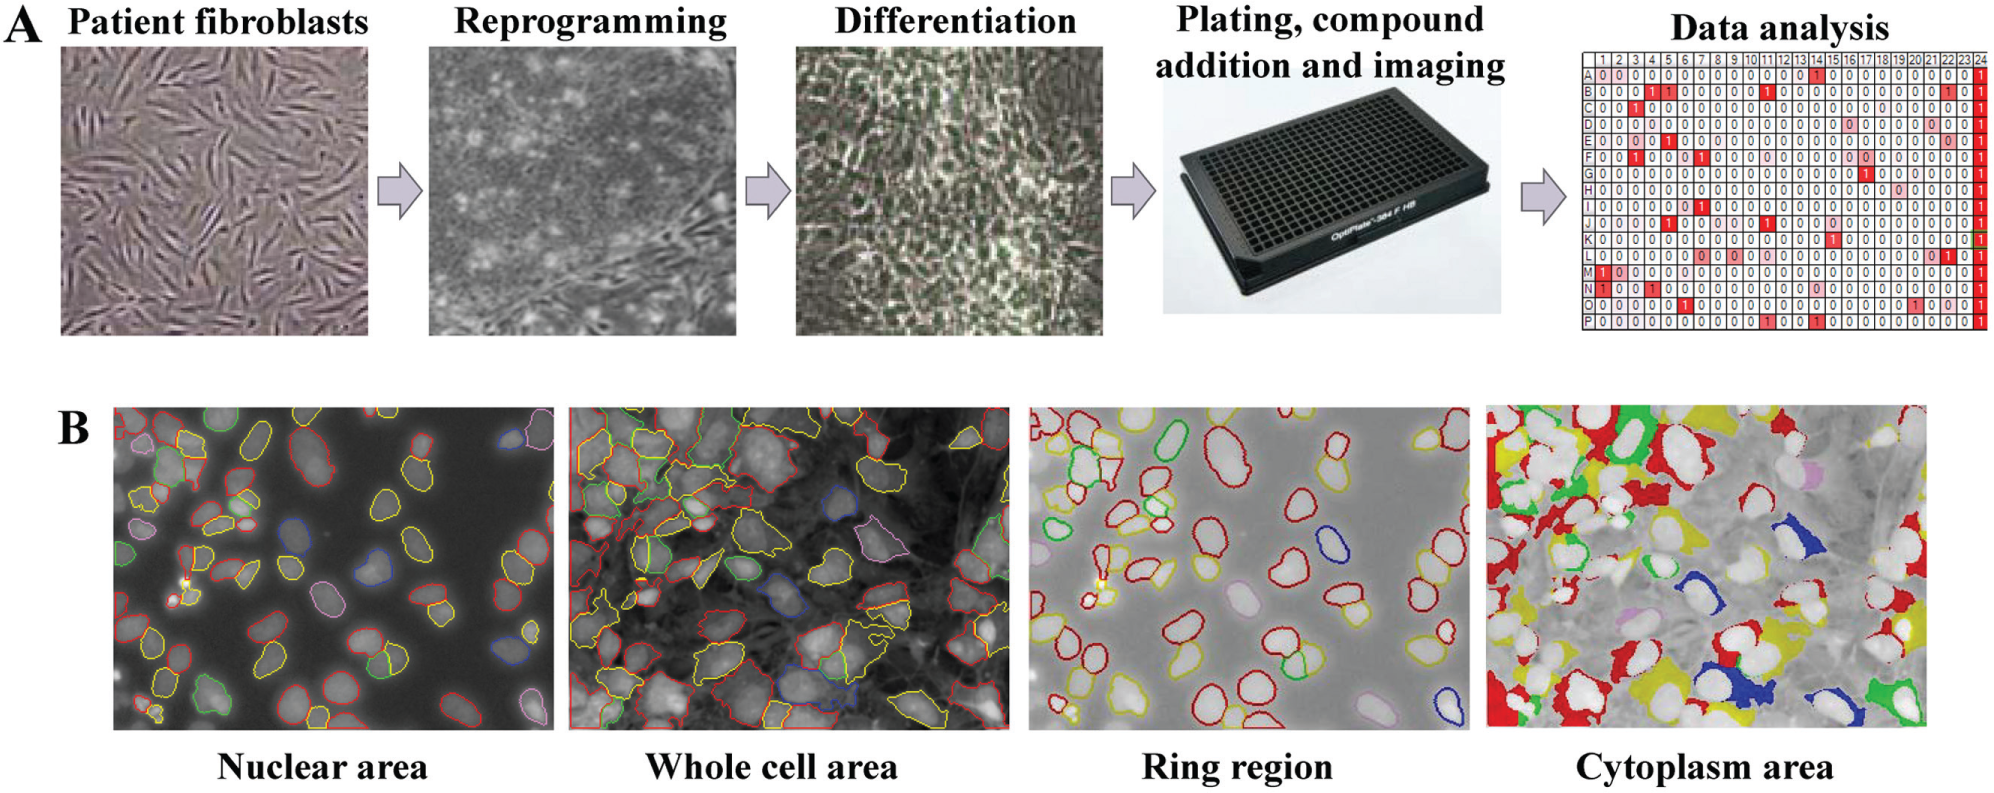
High-throughput screening workflow and image analysis. (
Increase of FMRP expression is regarded the most significant readout for the expected phenotype. During assay development, we quantified the average increase of FMRP on the well. However, in some instances, only a subpopulation of cells seemed to respond upon compound incubation. This heterogeneous response can turn the averaging of FMRP expression over the whole cell population into a nonrepresentative readout. Therefore, we developed two algorithms based on multiparametric analysis for analyzing single-cell data. One algorithm is based on the KS statistic and looks at the distribution of the response in the well compared with the negative control, and the second uses random forest analysis and machine learning algorithms to provide the fraction of responding cells. Apart from considering the heterogeneous response, single-cell analysis also provides a very sensitive readout to identify weak hits. The pilot screen was very successful with good statistical parameters (Z′ = 0.8 for the fraction of responding cells readout and Z′ = 0.4 for the KS readout).
Consequently, we initiated a high-throughput screen with a set of 50,000 compounds at a single concentration (1 µM) with the goal to identify molecules that will restore FMRP expression. Since we included a set of chemical probes with known mode of action (7%), such a phenotypic assay could potentially identify novel targets as well. Among them, we selected compounds covering epigenetic targets and several nodes of the FMRP pathway. In addition, we also included molecules covering a broad chemical space and biological diversity (46%) and a set of randomly selected compounds from our internal archive (47%). The screen was divided into two batches (batches 2 and 3) due to cell availability. The different batches showed a significant separation between positive and negative controls for both of our main readouts, allowing the selection of hits; however, there was certain variability due to the heterogeneity in the progenitor status of the cells. Overall, the number of samples with FMRP values close to the positive control was relatively low, which allowed us to be very inclusive during hit selection and nominate as hits all molecules inducing a response significantly higher than the signal of the negative control (>3 SD) ( Fig. 4A,B ). As expected, data analysis using KS and random forest led to two hit lists, which did not totally overlap since each method analyzes slightly different phenotypes. Random forest analysis was more sensitive than KS ( Fig. 4C ), but 5-aza-2′-deoxycytidine could be detected as a hit with both methods.
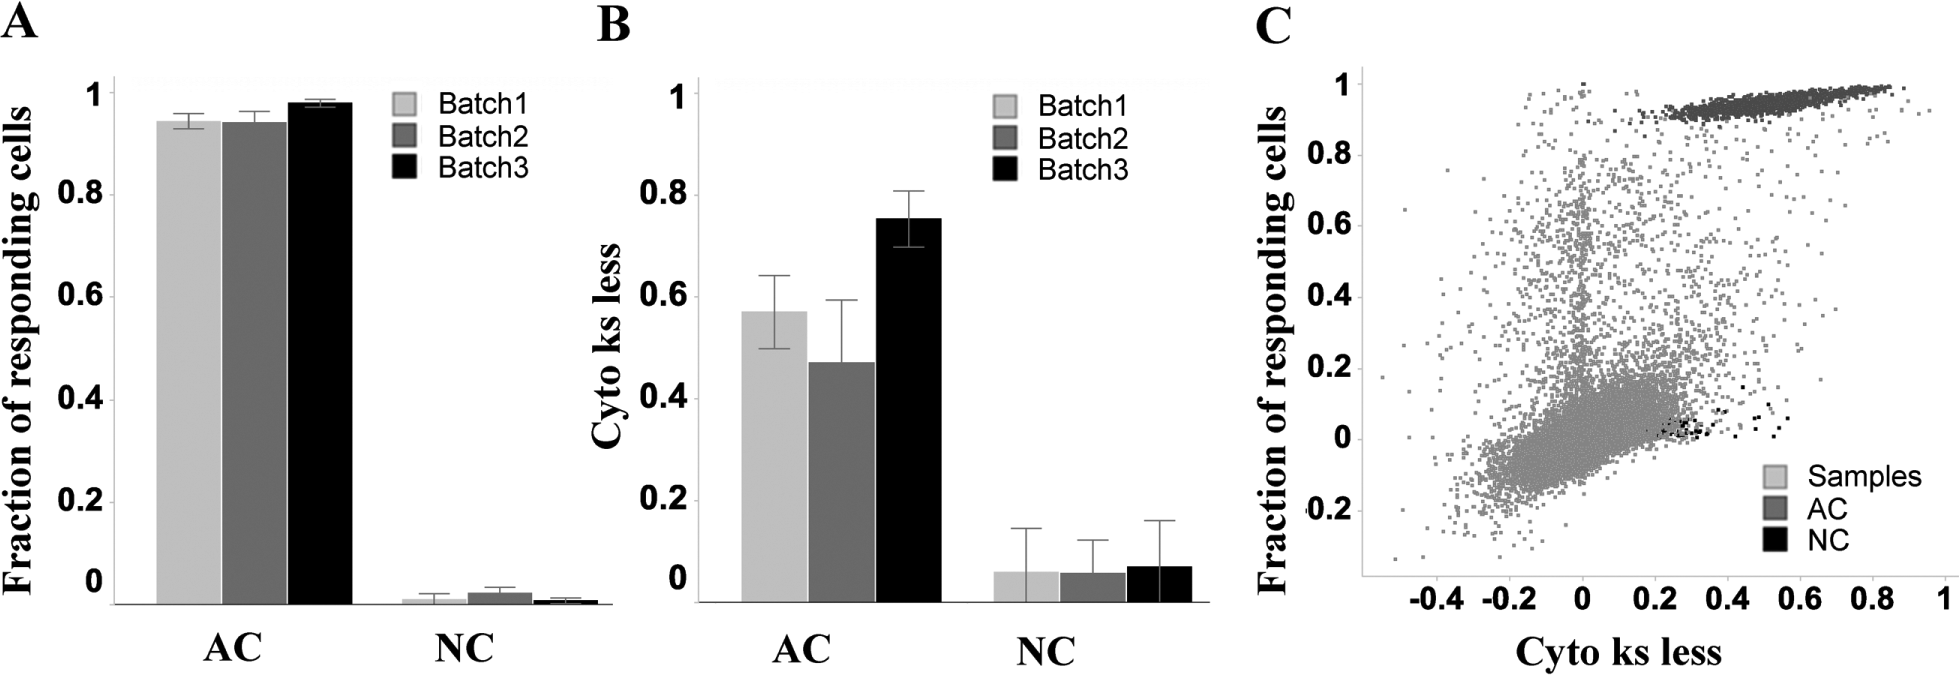
Compound screen. Compounds were tested at a 1-µM concentration on three different screening batches. A clear separation could be observed between the fragile X mental retardation protein (FMRP) values of active and neutral controls for all batches. (
Combining both analyses, we identified 2099 compounds that induced a small FMRP signal increase. After confirmation, 790 were chosen to be tested in an 8-point dose response. The hit rates of the different sets were 2.8% in the MoA set, 1.1% in the random set, and 1.5% in the chemical diversity and cellular activity. We suspect that the hit rate in the MoA set is larger than in other sets due to the enrichment on cellular active compounds. The data were analyzed as described for the large screen. In addition, we performed a counterassay to eliminate artifacts that originated from the fluorescence of compounds. We then represented FMRP expression versus cell toxicity, as measured by the number of detected nuclei in the well for all samples. As shown in Figure 5A , there was a great correlation between both values. This is not surprising since epigenetic modulation, which is our first mode-of-action hypothesis, could have pleiotropic effects by hitting general mechanisms important for transcriptional regulation. 28 Among the samples, 5-aza-2′-deoxycytidine was included and showed the expected dose response both for FMRP expression and for toxicity, thus proving the validity of the screen ( Fig. 5B,C ).
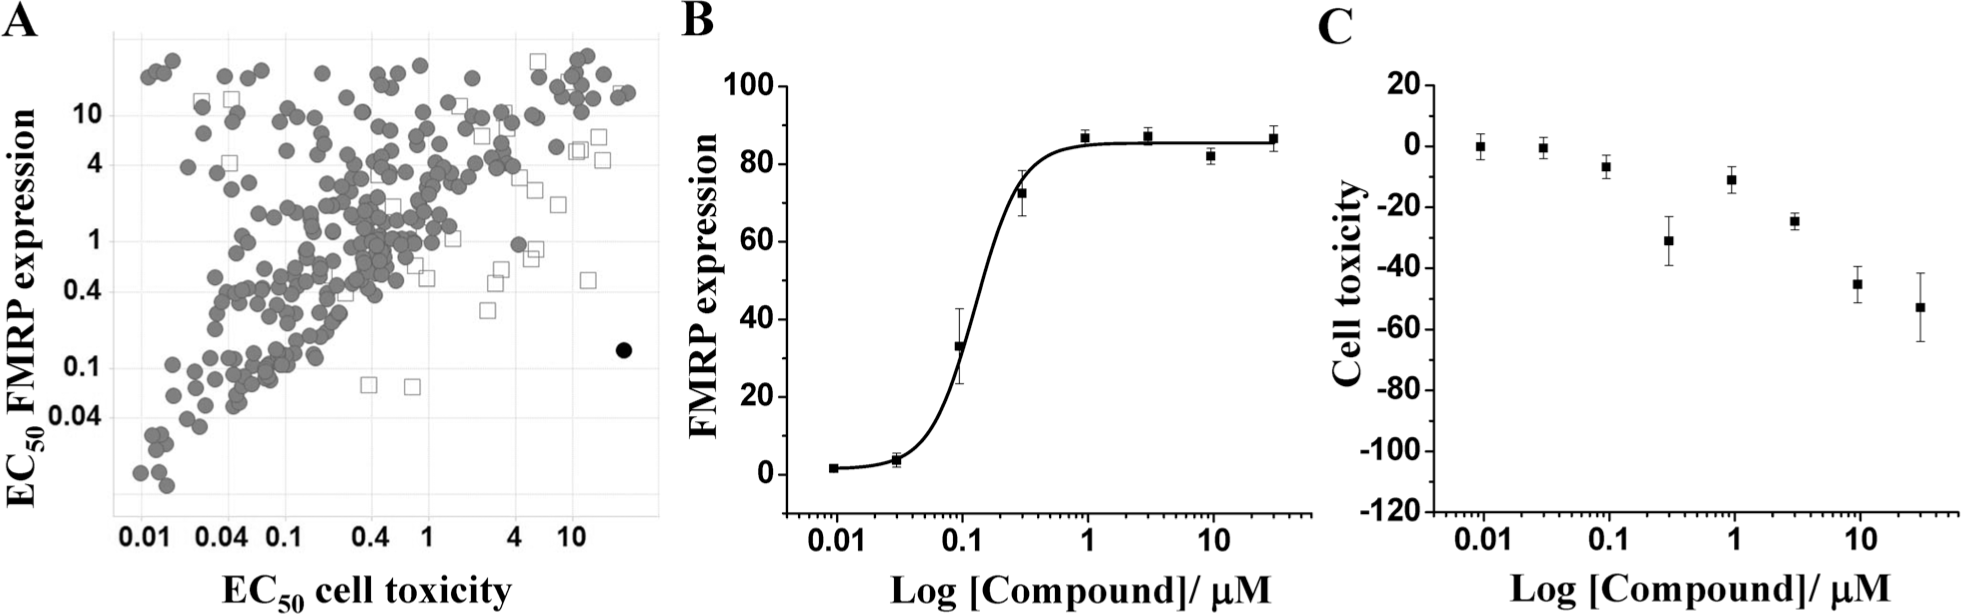
Validation of hits in dose response. Compounds were tested in 8-point dose response, and fragile X mental retardation protein (FMRP) reactivation and cell toxicity were measured. (
The most interesting compounds are those that induce FMRP expression localized in the cytoplasm and whose EC50 of toxicity is higher than the EC50 of FMRP expression (i.e., FMRP expression is induced earlier than toxicity). Fluorescent compounds were excluded from this selection. A small set of compounds fulfilled these criteria, and some examples are shown in
Figure 6
and
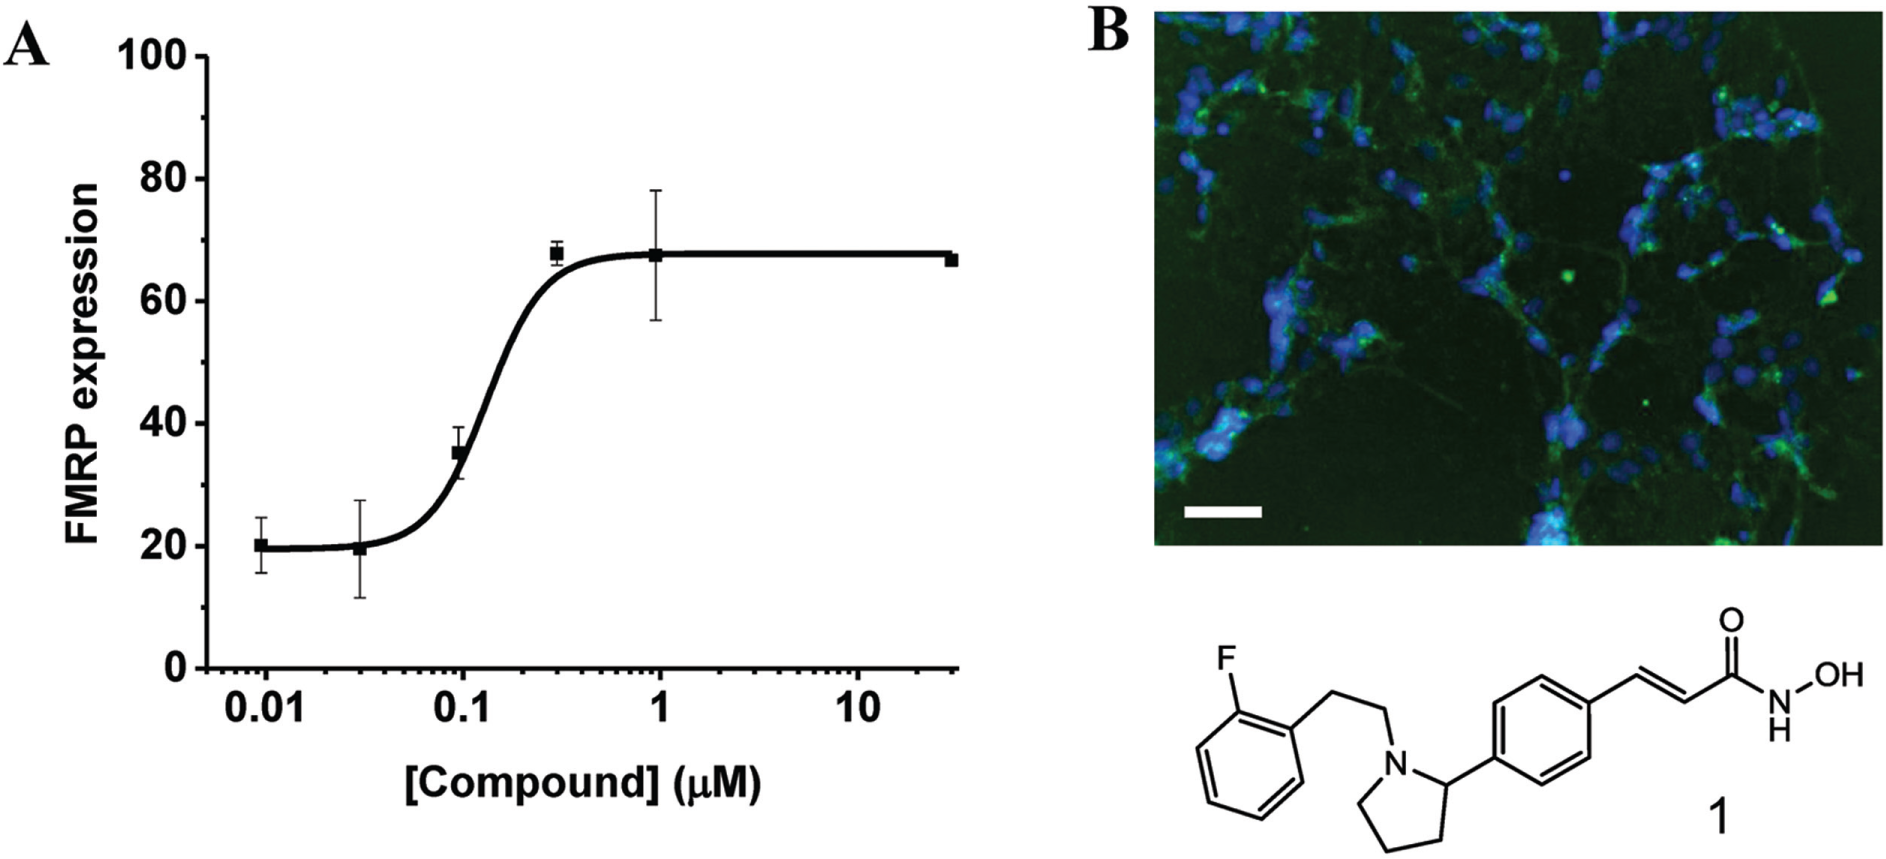
Compound inducing fragile X mental retardation protein (FMRP) expression. (
In summary, we have shown how phenotypic screening using iPSC patient-derived neuronal progenitors is a feasible and valuable approach to perform drug discovery efforts integrating human genetic disease. Particularly, in the context of the FXS, the fact that iPSC-derived neuronal precursors retain epigenetic memory makes them a perfect model to study epigenetic diseases.
Since the main consequence of the lack of FMRP in FXS is synaptic defects, we used a cellular model that focused on neuronal cells that represent well the human disease and its context with a gene expression pattern and proteome similar to neurons in the brain. This is particularly important since there is no known target that modulates FMRP expression, and hits identified in other cellular models could be misleading. Within the neuronal cells, we used NPCs. These cells have the property to divide, which was a key feature for our screening since the only tool compound we could identify to be used as positive control, the DNMT1 inhibitor, needs DNA replication to reactivate FMRP expression. Screening in fully differentiated neurons could represent even better the effect that compounds might have in vivo. Although the latter is not possible using our tool compound, it would be beneficial to use differentiated neurons in a secondary assay to assess the effect of hits in these cells.
The development of an optimized high-content imaging assay compatible with an HTS workflow allowed the screening of 50,000 compounds, and the same setup could be used for running genetic screens. The use of human iPSCs for drug discovery has been an important goal since they were generated. The many challenges that need to be overcome to run a large-scale compound screen with iPSC-derived cells have hampered so far the broad applicability of the technology. As a consequence, only few medium-throughput screens have been published in recent years. 12 Here, we have shown the feasibility of scaling up a culture of iPSCs, and we have highlighted the activities required to deal with some of the challenges and to establish a workflow amenable to HTS. Among them, a quality control system was crucial to avoid working with undesirable cellular populations. Regarding the imaging assay, image and data analysis were critical for the sensitive detection of weak hits. The ability to create FXS NPC lines from different patients will allow in the future the testing of the hits in a different patient background to rule out a donor-specific effect.
Altogether, this work shows the feasibility of using FXS patient-derived NPCs in lead finding and opens doors to the search of new ways of therapeutic intervention in FXS.
Footnotes
Acknowledgements
The authors thank Xian Zhang for his help with image analysis; Isabelle Claerr and Vincent Unterreiner for assistance with image acquisition; Yannick Gautier, Herve Mees, Rina Yamamoto, and Gilles Weinzaepflen for their support with compound management; Caroline Boesch for compound QC; Matthias Frederiksen and Juerg Hunziker for contributions to compound selection; and Christian Parker and Paolo Di Giorgio for help with assay development.
Declaration of Conflicting Interests
The authors declared no potential conflicts of interest with respect to the research, authorship, and/or publication of this article.
Funding
The authors received no financial support for the research, authorship, and/or publication of this article.
References
Supplementary Material
Please find the following supplemental material available below.
For Open Access articles published under a Creative Commons License, all supplemental material carries the same license as the article it is associated with.
For non-Open Access articles published, all supplemental material carries a non-exclusive license, and permission requests for re-use of supplemental material or any part of supplemental material shall be sent directly to the copyright owner as specified in the copyright notice associated with the article.