
Abstract
Carboxyl-terminal binding protein (CtBP) is a transcriptional corepressor that suppresses multiple proapoptotic and epithelial genes. CtBP is overexpressed in many human cancers, and its overexpression increases stem cell–like features, epithelial-mesenchymal transition, and cancer cell survival. Knockdown of CtBP also increases apoptosis independent of p53 in cell culture. Therefore, targeting CtBP with small molecules that disrupt its interaction with transcription factor partners may be an effective cancer therapy. To elicit its corepressing effect, CtBP binds to a conserved peptide motif in each transcription factor partner. We developed an AlphaScreen high-throughput screening assay to monitor the interaction between CtBP and E1A (which mimics the interaction between CtBP and its transcriptional partners). We screened the LOPAC library of 1280 bioactive compounds and identified NSC95397, which inhibits the CtBP-E1A interaction (IC50 = 2.9 µM). The inhibitory activity of NSC95397 was confirmed using two secondary assays and a counterscreen. NSC95397 also behaved as a weak substrate of CtBP dehydrogenase activity and did not inhibit another dehydrogenase, lactase dehydrogenase. Finally, NSC95397 was able to disrupt CtBP-mediated transcriptional repression of a target gene. These studies present a new possibility for the development of a therapeutic agent targeting tumors through disrupting the CtBP transcriptional complex.
Introduction
The C-terminal binding proteins (CtBPs) were originally identified through their ability to bind to the C-terminus of the adenovirus protein, E1A. CtBPs were later determined to be NADH-dependent corepressors that interact with many transcription factors to direct numerous developmental and oncogenic processes. 1 Mammalian CtBPs contain two family members, CtBP1 and 2, that display both unique and redundant roles in several developmental processes. 2 Because CtBP1 is more extensively investigated, we primarily focused on CtBP1 in our studies. The inherent ability of CtBP to control developmentally regulated genes necessary for processes in tissue development, such as the epithelial to mesenchymal transition (EMT), suggests CtBP overexpression could play a role in both tumorigenesis and tumor progression. This role is supported by studies showing a correlation between CtBP expression and human malignancies. Overexpression of CtBP is observed in a number of cancers, including prostate, 3 ovarian, 4 colon, 5 melanomas, 6 and breast cancers. 7 The overexpression of CtBP suppresses the expression of both epithelial and proapoptotic genes, 8 consistent with its ability to promote a broad range of tumorigenic phenotypes, including cell survival, proliferation, migration/invasion, and EMT.9–11 Recently, using a combination of chromatin immunoprecipitation and next-generation sequencing (ChIP-seq), Di and colleagues 12 identified and classified an extensive list of CtBP target genes into three major groups that can influence genome stability, epithelial differentiation, or stem cell–like self-renewal and pluripotency. This is of note because each of these pathways can lead to aggressive forms of cancer through the promotion of uncontrolled proliferation, drug resistance, invasion, and metastasis.
CtBP exerts its influence over gene expression through its interaction with transcription factors to create a transcriptional repression complex. CtBP binds to protein partners (including E1A and transcription factors) through a conserved PXDLS motif first identified in adenovirus E1A, uniting DNA-binding transcriptional factors with chromatin-modifying proteins to suppress gene transcription. 13 Furthermore, single amino acid mutations in this binding sequence or the CtBP-binding cleft can appreciably alter binding and subsequent gene repression.14,15
CtBP is a unique transcriptional corepressor, given that it contains a D-isomer 2-hydoxyacid dehydrogenase domain that uses coenzyme NADH/NAD+ to reduce or oxidize substrates. 16 The binding of the coenzyme nicotinamide adenine dinucleotide (NAD+) or NADH induces dimerization and the transcriptional repressor activity of CtBP. However, NADH binds with a 100-fold higher affinity than NAD+ 17 and is much more effective in stimulating CtBP binding to its transcriptional partners. 18 This differential affinity may also be used by CtBP to respond to the redox state of the cell, linking the cellular NADH concentration and transcriptional activity of CtBP. 17
To date, two known molecules are able to reverse CtBP-mediated transcription repression: 4-methylthio-2-oxobutanoic acid (MTOB), a methionine salvage pathway intermediate, 16 and CP61, a synthetic cyclic peptide designed to disrupt CtBP dimerization. 19 CP61 inhibits the homodimerization of CtBP2 with an IC50 of 19 ± 4 µM but requires fusion to a cell-penetrating peptide for cell entry. 19 MTOB is a weak substrate for the dehydrogenase domain of CtBP with a maximum activity of approximately 100 nmol/min/mg protein. 16 Treatment with high concentrations (4 and 10 mM) of MTOB can prevent the recruitment of CtBPs to target promoters and antagonize CtBP transcriptional regulation.12,20 For example, in HCT116 colon cancer cells, MTOB can induce apoptosis through eviction of CtBP from the Bik promoter. 20 In addition, MTOB can shift breast cancer cells from a more mesenchymal to epithelial phenotype by preventing CtBP localization to target promoters. 12 Although high MTOB concentrations (mM) are required for inhibition of CtBP transcriptional repression, MTOB’s clear antitumorigenic effect on cancer cells provides a proof of principle that small molecules could be developed to treat cancer regulated by CtBP activity.
Taken together, these findings provide substantial evidence that pharmacological targeting of CtBP may be a feasible strategy for the therapeutic intervention of multiple cancer types. Molecules capable of disrupting the protein-protein interaction between CtBP and its transcriptional partners could not only act as a starting point for the development of novel therapeutic agents but also serve as chemical tools to understand the role of CtBP and its transcription factor partners in cancer biology. We report in this article the implementation of the AlphaScreen assay to screen a small library of pharmacologically active small molecules to identify a compound capable of disrupting the interaction between CtBP1 and E1A. Using this technique, we discovered NSC95397 is able to specifically perturb the CtBP1-E1A interaction. Our experimental approach provides a foundation to systematically screen larger compound libraries and identify small-molecule inhibitors that can disrupt CtBP-mediated transcriptional repression in tumor cells.
Materials and Methods
Protein Expression and Purification
CtBP1 was subcloned into the pET28a vector and expressed in the BL21(DE3) Escherichia coli strain (EMD Biosciences, Darmstadt, Germany) and purified from the bacterial lysate using Ni-Sepharose HP resin (GE Healthcare, Little Chalfont, Buckinghamshire, UK). Eluate from the Ni resin was further purified on a Superdex 200 size exclusion column (GE Healthcare). Adenovirus 5 E1A was subcloned into the pGEX-KG vector and transformed into DH5α E. coli strain (Life Technologies, Carlsbad, CA). GST-fused E1A was first purified using Glutathione Sepharose 4B resin (GE Healthcare), then on a Superdex 200 size exclusion column (GE Healthcare). Both purified proteins were concentrated, aliquoted, and stored at −80 °C in lysis buffer (100 mM Tris [pH 8.0], 250 mM NaCl, 5% glycerol, and 1 mM dithiothreitol).
AlphaScreen Assays
The AlphaScreen protocol from the manufacturer (PerkinElmer, Waltham, MA) was followed unless otherwise specified. Assay development and optimization were carried out in white 384-well plates (PerkinElmer), and all incubation steps were carried out at 25 °C in assay buffer (50 mM Tris [pH 8.0], 250 mM NaCl, 0.05% bovine serum albumin [BSA], and 0.02% Tween-20). A 6xHis-CtBP1/GST-E1A concentration matrix was set up at 25 µL per well in assay buffer as follows: 7.5 µL of each protein solution (final concentration in assay ranging from 25 to 250 nM) was combined with 10 µL AlphaScreen beads (10 ng/ul final concentration for each of the donor and acceptor beads) and incubated at 25 °C for 2 h. The assay plate was read in an EnVision Multilabel Reader (PerkinElmer) in AlphaScreen detection mode. From this matrix, the apparent dissociation constant (Kd) was determined at 25 nM of E1A with GraphPad Prism software (GraphPad Software, La Jolla, CA) using a single-site binding (hyperbola) curve fit.
Unlabeled E1A peptide (EPGQPLDLSCQRPR) (Abgent, San Diego, CA) of varying concentrations (25 nM–250 µM) was used to compete with E1A in an AlphaScreen assay containing 125 nM 6xHis-CtBP1 and 125 nM GST-E1A. The IC50 value of the peptide was determined by GraphPad Prism.
A counterscreen AlphaScreen assay using 200 nM 6x-His Eya2 and GST-Six1 transcription factors was used to identify nonspecific compounds. NSC95397 (Sigma-Aldrich, St. Louis, MO) or other compounds were added in increasing concentrations of 20 nM to 50 µM, and the remainder of the assay was carried out identically to the CtBP1-E1A AlphaScreen.
Miniaturization of AlphaScreen Assay for High-Throughput Screening
The AlphaScreen CtBP1/E1A binding assay was adapted to the 1536-well microplate format for quantitative high-throughput screening (qHTS). The optimized protocol was as follows: 4 µL protein mixture solution (final concentration of 25 nM GST-E1A + 25 nM His-tagged CtBP1) in assay buffer (50 mM Tris [pH 7.5], 250 mM NaCl, 0.05% BSA, 0.02% Tween, and 1 mM tris(2-carboxyethyl)phosphine [TCEP]) was added to each well of an Aurora 1536-well high-base, white, solid-bottom microtiter plate (Brooks Automation, Chelmsford, MA), using a BioRAPTR Flying Reagent Dispenser (Aurora Discovery, San Diego, CA). Compounds and controls were dissolved in DMSO and 23 nL was pin-transferred with a PinTool transfer instrument (Kalypsys, San Diego, CA), and solution was incubated for 2 h at room temperature. Then, 1 µL of 5× AlphaScreen bead mixture (20 µg/mL glutathione-linked donor beads + 20 µg/mL nickel-chelated acceptor beads) in assay buffer was dispensed with a BioRAPTR Flying Reagent Dispenser (Aurora Discovery), solution was incubated for 1 h at room temperature in the dark, and signal was measured in the AlphaScreen mode on the EnVision plate reader (PerkinElmer).
qHTS of the LOPAC Collection: Data Analysis and Hit Selection
The LOPAC library (Sigma-Aldrich), containing 1280 compounds with known pharmacological activities, was screened using the CtBP1/E1A AlphaScreen assay. Compounds were tested in interplate dose responses 21 as follows: highest concentration of compounds in source plates was 10 mM, and seven doses were tested with 1:5 dilutions. Then, 23 nL of compounds was pin-transferred for a final concentration range of 46 µM to 2.9 nM. Columns 1 to 4 were used for controls and columns 5 to 45 contained compounds to screen. Column 1 contained detection reagents and buffer without CtBP1 or E1A, column 2 contained a dose response of the E1A 14-mer peptide as a competitor, column 3 contained all reagents, and column 4 contained the E1A 14-mer peptide at IC100 (125 µM). Data normalization, correction, and fitting of concentration-response curves were performed as previously described. 22 Briefly, raw results for each titration point were first normalized relative to the median of column 3 as high signal (100% signal) and the median of column 1 as low signal (0% signal) and then corrected by applying a pattern correction algorithm using compound-free control plates (DMSO plates) to minimize the dispense and reading errors. Concentration-response titration points for each compound were fitted to the Hill equation, yielding concentrations of half-maximal inhibition (IC50) and maximal response (efficacy) values. Concentration-response curves were classified into four major classes using the set of criteria as described in Inglese et al. 21 Briefly, a curve response class was classified as −1.1 if it exhibited well-defined upper and lower asymptotes, with a good fit to the observed data points (R2 > 0.9) and an efficacy greater than 80%. A class −2.1 dose-response curve was similar to a −1.1 curve but exhibited only one well-defined asymptote. A curve that exhibited weaker efficacy (between 30% and 80%) was classified as a −1.2 or a −2.2 if it had two asymptotes or one asymptote, respectively. A class 3 curve was one that was poorly fit or exhibited activity only at the highest concentration, thus representing inconclusive activity, and a class 4 was assigned to those cases in which there was no dose response and considered inactive.
Fluorescence Polarization Assay
The fluorescent polarization assays (50 µL) were carried out in black 96-well plates (PerkinElmer). The assay was performed in 50 mM Tris-HCl (pH 8.0), 250 mM NaCl, 0.05% BSA, and 0.02% Tween-20 and contained 3 µM CtBP1 and 5 nM FITC-labeled E1A 14-mer peptide (EPGQPLDLSCQRPR) (Abgent). The assay plate was incubated for 2 h at 25 °C while gently rocking. The polarization value of free or bound peptide was determined using the EnVision plate reader (PerkinElmer). For validation of hits identified in the AlphaScreen assay, the compounds were screened in a dose-dependent manner from concentrations of 100 nM to 100 µM in triplicate. Data analysis was performed using GraphPad Prism software.
Competitive Enzyme-Linked Immunosorbent Assay
The competitive enzyme-linked immunosorbent assay (ELISA) was carried out in medium binding 96-well plates (Corning Costar, Tewksbury, MA). The plate was coated with CtBP1 in 50 mM Tris (pH 8.0) and 250 mM NaCl for 1 h at 25 °C. Plates were washed with Tween 20, phosphate-buffered saline (TPBS) and then blocked using 1% BSA in 0.05% Tween-20 in binding buffer (50 mM Tris [pH 8.0], 250 mM NaCl, and 1 mM TCEP) for 1 h at 25 °C. Plates were washed and then incubated with GST-E1A in the presence or absence of 50 µM hit compounds in triplicate for 1 h at 25 °C. Plates were washed and incubated with 1:1500 rabbit anti-GST antibody (generated by Dr. Qinghong Zhang’s laboratory) and incubated for 1 h at 25 °C. Plates were washed and incubated with 1:2500 goat–anti-rabbit antibody (Santa Cruz Biotechnology, Santa Cruz, CA) and incubated for 1 h at 25 °C. Plates were washed, incubated with ABTS buffer (Thermo Scientific, Rockford, IL), and read using the Spectramax Plus absorbance microplate reader (Molecular Devices, Sunnyvale, CA). Data analysis was carried out using GraphPad Prism software.
Enzymatic Assays
The reduction of MTOB (Sigma-Aldrich) and NSC95397 (Sigma-Aldrich) by CtBP1 was analyzed spectrophotometrically by monitoring the disappearance of NADH absorbance at 340 nm using the Spectramax Plus absorbance cuvette reader. Assays were conducted in reaction mixtures (100 µL) containing phosphate-buffered saline (PBS), 2 µM CtBP1, and 100 µM NADH after a 2-min incubation at 30 °C.
The enzymatic assay of lactate dehydrogenase was carried out with 5 nM lactate dehydrogenase (Sigma-Aldrich) and incubated with 5 µM pyruvate or varying concentrations of NSC93397 in PBS with 100 µM NADH for 1 min at 30 °C. The consumption of NADH was then monitored spectrophotometrically at 340 nm.
Luciferase Assay
H1299 cells were seeded onto 96-well plates at 2000 cells/well and allowed to adhere overnight. Cells were then transfected with either 10 ng/well Renilla luciferase and 30 ng/well pGL3-E-cadherin promoter or 14 ng/well Renilla luciferase, 60 ng/well pGL3-MEF3 promoter, 40 ng/well Six1, and 30 ng/well Eya2 using FuGENE 6 (Roche Applied Science, Penzberg, Germany) transfection reagent. After 10 h, the cells were treated with NSC95397 at varying concentrations and incubated for an additional 18 h. Cells were lysed with passive lysis buffer, and the resulting extracts were analyzed for Firefly and Renilla luciferase activities using the Dual-Luciferase Reporter System (Promega, Madison, WI). The Firefly luciferase activity was normalized to the activity of the constitutively expressed Renilla luciferase to account for differences in cell numbers and transfection efficiencies.
Results
Characterization and Optimization of the AlphaScreen Assay
To monitor CtBP1’s ability to interact with its protein partners, we developed an AlphaScreen assay that is easily automatable for HTS. 23 It has been used successfully by several laboratories to identify inhibitors of protein-protein interactions. 23 Because the interaction between human CtBP1 and the adenovirus 5 (Ad5) E1A has been well characterized, we chose to use E1A as the representative protein partner for CtBP1 in the AlphaScreen assay. CtBP1 was expressed and purified with a His6 tag for binding on Ni2+-chelated acceptor beads, while E1A was expressed and purified as a GST-fusion protein for immobilization on GSH-linked donor beads. To determine the sensitivity and the optimal protein concentrations needed for the AlphaScreen binding reaction, we performed a cross-titration of both proteins in a 384-well plate ( Fig. 1A ). For subsequent assays, we decided to use 125 nM GST-E1A, 125 nM His6-CtBP1, and 10ug/ml of each AlphaScreen bead, which provided a signal close to the maximum. In addition, from the concentration titration of E1A into 25 nM CtBP1, we determined the binding affinity of the CtBP1-Ad5 E1A interaction to be approximately 87.3 ± 21.7 nM. To confirm the AlphaScreen signal was dependent on the specific interaction between the two proteins, we titrated in increasing concentrations of an E1A peptide containing the conserved PXDLS CtBP1-binding motif, EPGQPLDLSCQRPR. Using this E1A peptide, we were able to fully disrupt the protein interaction and determine the IC50 for the peptide to be 20.9 ± 1.1 µM ( Fig. 1B ), similar to the value previously reported by Zhang et al. 24 of 12 µM.
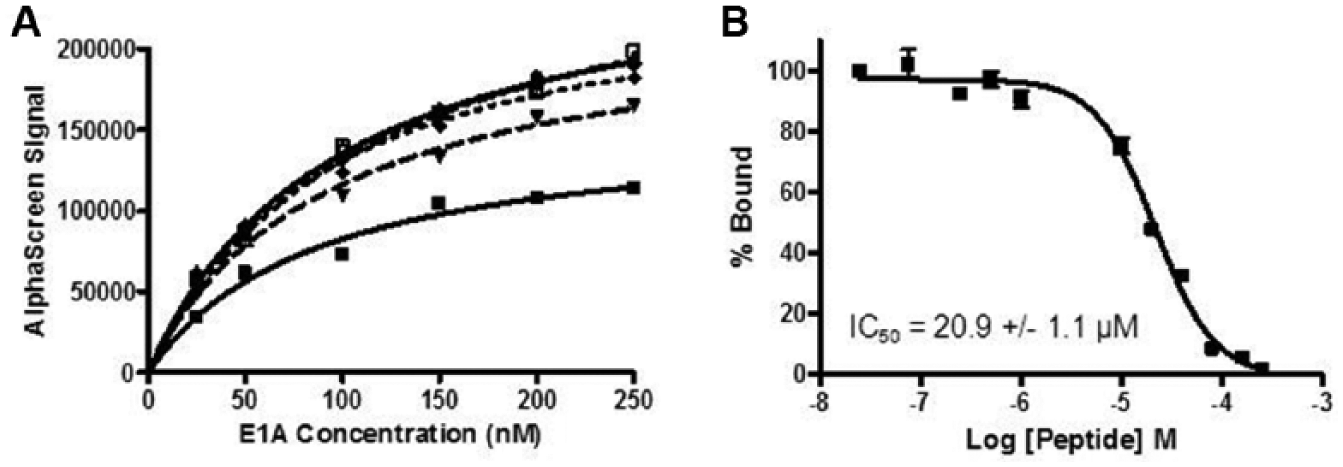
The CtBP1-E1A interaction can be monitored using an AlphaScreen assay. (
Primary Screening of the LOPAC Library Identified Inhibitors of the CtBP1-E1A Interaction
The CtBP1-E1A AlphaScreen assay was miniaturized to 5 µL/well in 1536-well plates, and the LOPAC library (1280 pharmacologically active compounds) was screened for compounds that disrupt the CtBP1-E1A interaction. The Z′ factor and signal-to-background (S/B) ratios of the screen were >0.5 and >5-fold for each plate ( Fig. 2A ), indicating that the assay is suitable for HTS. The LOPAC library was screened at seven concentrations ranging from 46 µM to 2.9 nM, at 1:5 dilutions. From this screen, seven compounds were identified as primary hits with a selection criterion of curve response class (CRC) being 1.1, IC50 <5 µM, and maximal inhibition of >80% ( Fig. 2B ).
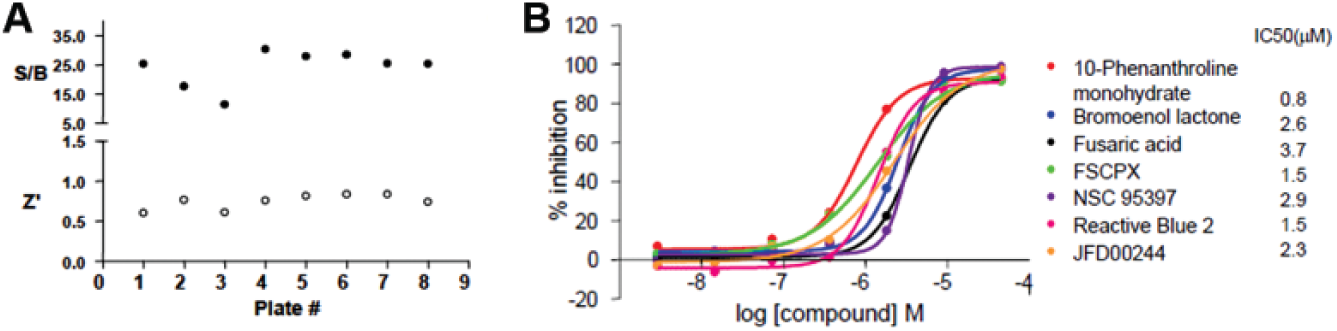
A pilot screen of 1280 compounds from the LOPAC library using the AlphaScreen assay identified seven primary hits. The LOPAC library was screened using the CtBP1-E1A AlphaScreen 1536-well assay protocol described in the Materials and Methods section. The screen included a total of eight assay plates, one in which plain DMSO was added and seven in which the compounds from the LOPAC collection were added in an interplate-dose response manner (seven doses starting at 40 µM and then 5-fold dilutions). (
NSC95397 Is Confirmed to Be an Inhibitor of CtBP1-E1A with Secondary and Counterscreen Assays
The AlphaScreen assay tends to generate a significant number of false-positive hits (e.g., compounds that absorb at the AlphaScreen emission wavelength or chelate nickel). Therefore, it is important to further validate hits identified in the screen. We used two strategies to discern authentic hits within the seven compounds identified in the primary screen. First, we tested all compounds in a counterscreen using an AlphaScreen assay monitoring the interaction between two unrelated proteins, SIX1 and EYA2. Small molecules that inhibit this unrelated interaction either interfere with the generation of the signal or nonspecifically disrupt protein interactions and therefore are not true inhibitors of the CtBP1 interaction. Four compounds (10-phenanthroline monohydrate, bromoenol lactone, reactive blue 2, and JFD00244) efficiently inhibited the SIX1-EYA2 interaction and therefore are likely false positives. Three compounds—FSCPX, fusaric acid, and NSC95397 (2,3-Bis[2-hydroxyethyl)thio]-1,4-napthoquinone) ( Fig. 3A )—did not inhibit the unrelated SIX1-EYA2 interaction ( Fig. 3B shows the result for NSC95397), demonstrating specificity against CtBP1.
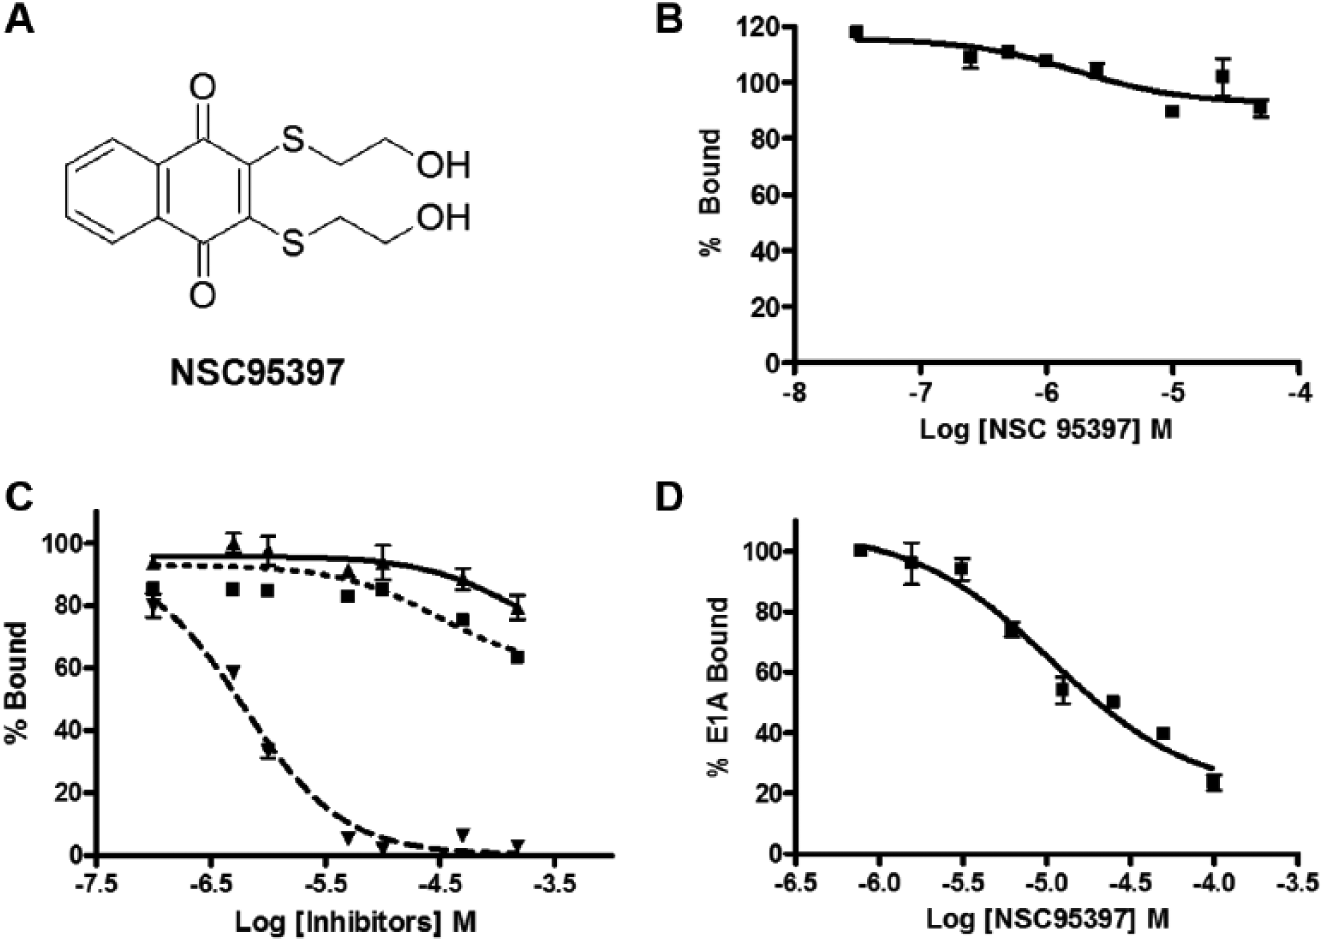
NSC95397 is confirmed in secondary and counterscreen assays. (
Second, we screened the three specific hits that do not inhibit the SIX1-EYA2 interaction in two secondary assays, a fluorescence polarization assay and a competitive ELISA. In the fluorescence polarization assay, the polarization value of the fluorescein-labeled 14-mer E1A peptide was used to monitor CtBP1 binding. The advantage of this assay is its ability to monitor the direct interaction between CtBP1 and the short conserved binding motif found in CtBP1 binding partners. This will eliminate any compounds that disrupt the CtBP1-E1A interaction by binding to E1A. This assay confirmed NSC95397 as an inhibitor of the CtBP1-peptide interaction with an IC50 value of 0.61 ± 0.12 µM. However, the remaining two compounds, fusaric acid and FSCPX, were unable to disrupt the CtBP1-peptide interaction in the fluorescence polarization assay ( Fig. 3C ). NSC95397 was further confirmed using a competitive ELISA, in which CtBP1 was coated on a 96-well medium-binding assay plate and then GST-fused E1A was added with increasing concentrations of NSC95397. After a brief wash step to remove unbound E1A, the remaining GST-E1A was detected using an anti-GST antibody. NSC95397 can disrupt the protein interaction in the competitive ELISA with an IC50 value of 10.0 ± 1.3 µM ( Fig. 3D ). The above experiments demonstrate that NSC95397 is able to specifically disrupt the CtBP1-E1A interaction in multiple assays.
NSC95397 Is a Weak Substrate of CtBP1 and Does Not Inhibit Lactase Dehydrogenase
Currently, there are only two molecules known to disrupt CtBP1-mediated repression: MTOB, an intermediate in the methionine salvage pathway, 16 and CP61, a cyclic peptide capable of disrupting CtBP1 dimerization. 19 CtBP1 is capable of reducing MTOB through the oxidation of NADH to NAD+, with a maximum activity of approximately 91.0 ± 1.9 nmol/min/mg protein. 16 The ability of MTOB to serve as a substrate of CtBP1, which leads to NADH to NAD+ conversion, was thought to be one possible mechanism of inhibition. 25 To determine if NSC95397 is also a substrate of CtBP1, we performed an enzymatic assay monitoring the levels of NADH using its characteristic absorption at 340 nm with increasing concentrations of NSC95397 or MTOB. From this experiment, we determined that NSC95397 is a weaker substrate of CtBP1 than MTOB, with a maximal activity of 28.5 ± 4.9 nmol/min/mg protein ( Fig. 4A ).
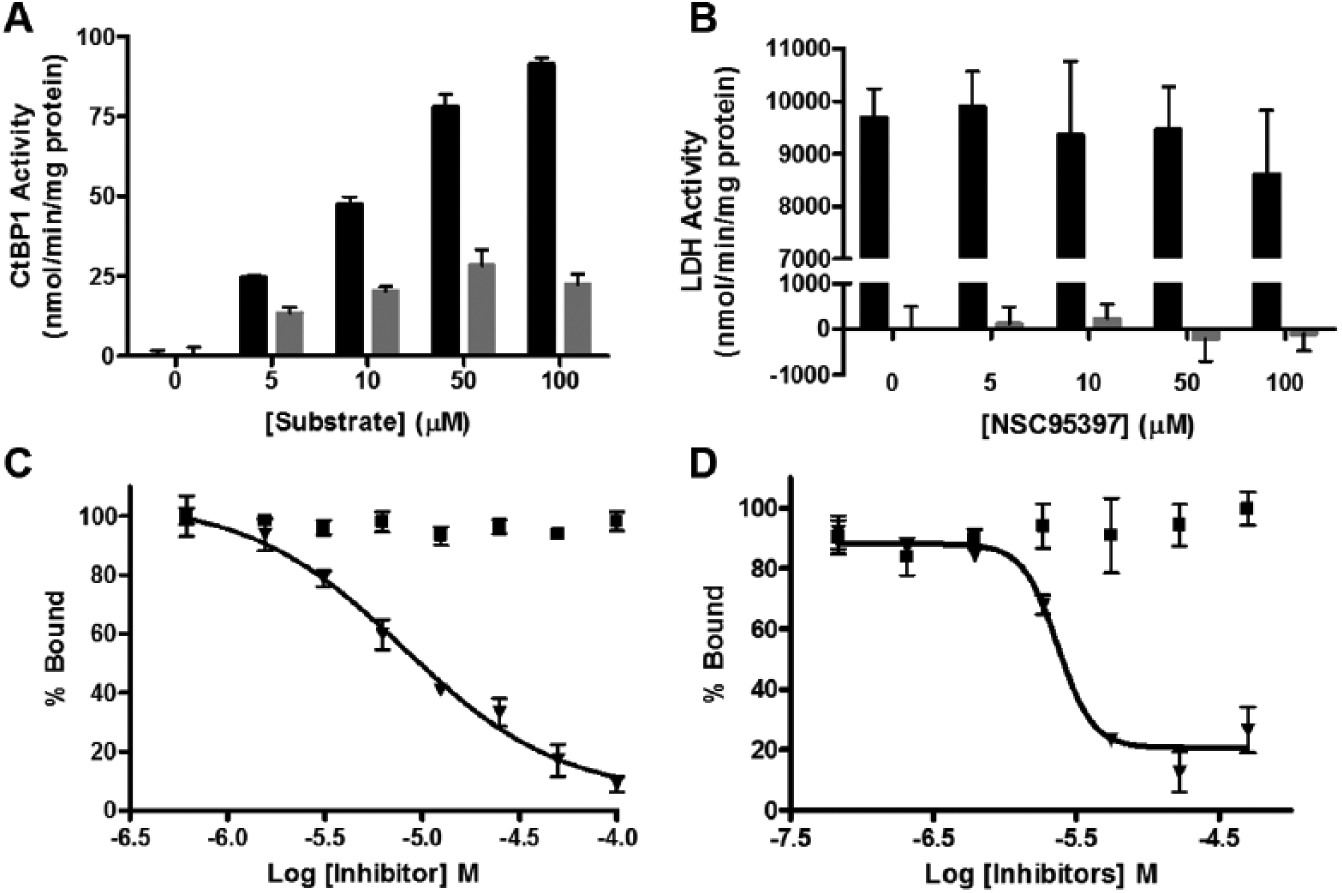
NSC95397 is a weak substrate for CtBP1 and does not inhibit other cellular dehydrogenases. (
We also demonstrated that NSC95397 does not act as a substrate for an additional NADH-dependent dehydrogenase enzyme, lactase dehydrogenase (LDH). LDH, which is not known to be involved in transcriptional regulation, is efficient at reducing pyruvate in a NADH-dependent manner. In this experiment, we did not detect a significant loss in NADH levels after the addition of increasing concentrations of NSC95397, suggesting LDH is unable to reduce NSC95397. In contrast, LDH reduces its natural substrate pyruvate with an extremely high activity of 9680 ± 558 nmol/min/mg protein ( Fig. 4B ). Finally, when up to 100 µM NSC95397 was added at the same time as pyruvate in the enzymatic reaction, we were unable to detect any inhibition of pyruvate reduction by LDH, suggesting that NSC95397 does not act as either a NADH or substrate mimetic and will likely not inhibit other cellular dehydrogenases.
NSC95397 Is Unlikely to Disrupt the CtBP1-E1A Interaction by Serving as a CtBP1 Substrate
Because the oxidation of NADH to NAD+ has been shown to decrease CtBP1’s affinity for E1A, it is possible that the reduction of a substrate and conversion of NADH to NAD+ could disrupt the CtBP1-E1A interaction, which is one proposed mechanism of action for MTOB. 25 However, the effect of MTOB on the CtBP-E1A interaction has never been directly evaluated. We demonstrated that MTOB was unable to inhibit the protein interaction at high concentrations (100 µM) in both the AlphaScreen and fluorescence polarization assays, in contrast to NSC95397, which efficiently inhibits the CtBP1-E1A interaction in this concentration range ( Fig. 4C ). Considering that NSC95397 is a weaker substrate than MTOB, the inhibition of CtBP1-E1A is unlikely due to the ability of NSC95397 to act as a substrate of CtBP1.
NSC95397 Releases CtBP-Mediated Repression of Target Genes
To assess if NSC95397 is capable of entering into cells and disrupting the CtBP1 transcriptional complex, we carried out a luciferase reporter assay to evaluate the effect of NSC95397 on CtBP1-mediated repression of target genes. A reporter plasmid carrying the E-cadherin promoter, a known direct target of CtBP1-mediated transcription repression, 8 was transfected into H1299 non–small cell lung carcinoma cells expressing endogenous CtBP1. Luciferase expression levels increased with increasing concentrations of NSC95397 when normalized to a control Renilla expression vector, indicating a reversal in the repression of the E-cadherin promoter ( Fig. 5A ).
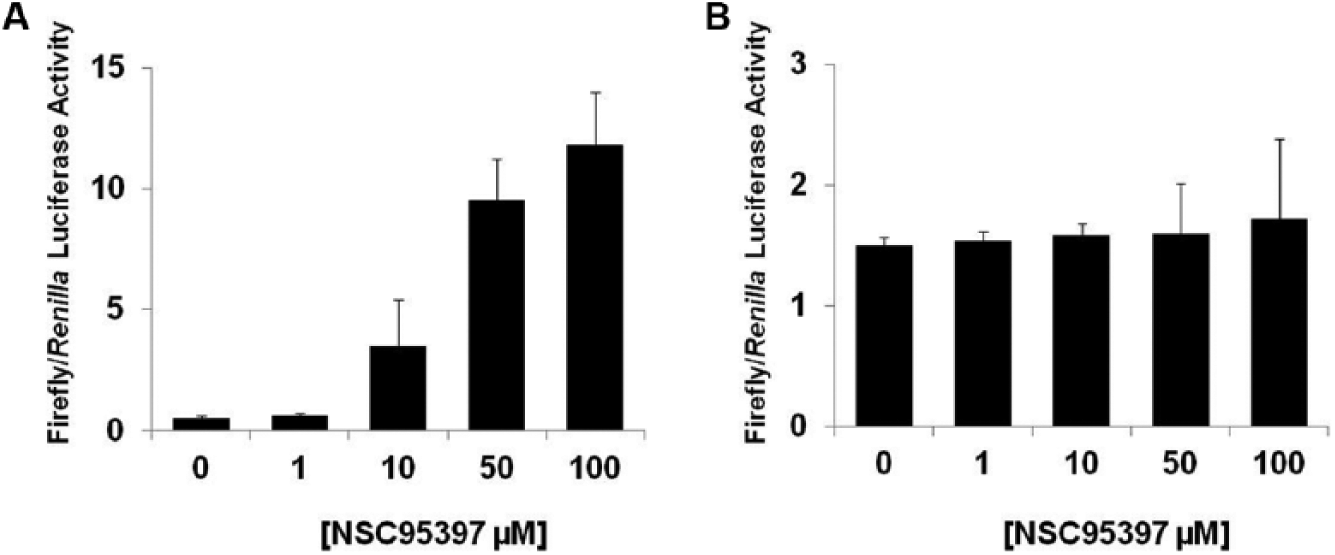
NSC95397 releases CtBP1-mediated transcriptional repression of the E-cadherin promoter in a luciferase assay. (
To assess the specificity of the release of transcription suppression by NSC95397, an additional reporter plasmid carrying an unrelated MEF3 promoter, a known direct target of the SIX1 transcriptional complex,
26
was transfected into H1299 cells. There was a dramatic increase of luciferase activity when cells were transfected with the MEF3 reporter (alone or cotransfection with SIX1 and its coactivator EYA2) compared with cells without the reporter (
Discussion
The interaction between CtBP and transcription factors is required for the suppression of many genes involved in cellular activities important for both development and oncogenesis. In most adult tissues, CtBP expression is low and overexpressed in multiple types of cancer.3–6 Disruption of CtBP-mediated gene repression could be an effective approach to treat cancer. Therefore, we developed an AlphaScreen assay to identify compounds that can disrupt binding between CtBP1 and a representative protein partner, adenovirus 5 E1A. We demonstrated that the AlphaScreen assay is an effective approach to monitor the CtPB1-E1A interaction in an HTS format. We confirmed the feasibility of the assay by screening 1280 pharmacologically active compounds from the LOPAC library. Using a combination of a counterscreen and two independent secondary assays, we validated NSC95397 as an inhibitor of the CtBP1-E1A complex.
MTOB, an intermediate in the methionine salvage pathway, is a known CtBP substrate and, at high concentrations, can reverse the repression of numerous tumor suppressor pathways.7,12,20 Straza et al. 20 demonstrated reversal of Bik repression, a known CtBP target, coinciding with a decrease in both CtBP1 and 2 occupancy on the Bik promoter after treatment with 4 mM MTOB in colon cancer. Di et al. 12 screened 30 CtBP1 and 2 target genes in two breast cancer cell lines and saw significant derepression and reduction in promoter occupancy after treatment with 10 mM MTOB. Although the exact mechanism of action is unknown, the evidence that MTOB is capable of reversing CtBP-mediated repression suggests that targeting CtBP using small molecules is a viable therapeutic strategy. However, for practical purposes, additional compounds with higher potency need to be identified.
One possible mechanism of action proposed for MTOB is that it acts as a substrate for CtBP and drives the conversion of NADH to NAD+, which consequently reduces the binding of CtBP to its transcription factor partners. 25 MTOB is a weak substrate of CtBP, which may explain the high concentration of MTOB needed to achieve inhibition. We demonstrated that NSC95397 is an even weaker substrate of CtBP1 than MTOB. In addition, in the concentration range from 1.6 to 100 µM, NSC95397 was able to disrupt the interaction between CtBP1 and E1A, while MTOB was unable to affect the protein interaction. This suggests that although NSC95397 is a weak substrate of CtBP1, its mechanism of action as a protein interaction inhibitor is likely separate from its role as a substrate, and it disrupts CtBP1-binding partner interaction in a manner distinct from MTOB. Recently, the crystal structure of CtBP1 and 2 in complex with MTOB has been solved. 25 The co-crystal structures showed no significant change in the overall tertiary and quaternary conformation of both CtBP proteins, suggesting MTOB must work through a mechanism other than an induced conformational change. However, because NSC95397 is larger than MTOB, it is possible that NSC95397 may induce a conformational change that locks CtBP1 in a conformation preventing CtBP1 from binding to transcription factors. Alternatively, NSC95397 may bind to the surface groove on CtBP1 that accommodates the conserved binding motif, directly interfering with the interaction between CtBP1 and its binding partner.
NSC95397 has demonstrated specificity toward the CtBP1-E1A interaction in vitro. When the compound was tested in similar conditions in a counterscreen assay against an unrelated protein-protein interaction, we did not detect a loss of AlphaScreen signal. In addition, NSC95397 was unable to inhibit another dehydrogenase, LDH, providing further evidence supporting its specificity for CtBP1. However, NSC95397 has been shown to have other activities, being a known inhibitor of cdc25 phosphatase activity 28 and spliceosomal activity. 29 For NSC95397 to be a useful CtBP inhibitor as a chemical probe or therapeutic agent, future effort will be needed to improve the potency and specificity of the compound.
Due to the multiple activities of NSC95397, a luciferase reporter assay using a CtBP-specific promoter is the best way to evaluate the specific cellular effect of NSC95397 on CtBP function. We demonstrated that NSC95397 can reverse CtBP-mediated transcriptional repression of the E-cadherin promoter in H1299 small cell lung carcinoma cells but has no effect on an unrelated MEF3 promoter, using a luciferase reporter assay, indicating that the compound can enter cells and selectively inhibit the CtBP-transcription factor interaction. In addition, this compound has been tested in a National Cancer Institute (NCI) 60 tumor-cell panel with an average GI50 over all cell lines of 1.04 µM (http://dtp.nci.nih.gov/) (H1299 is not one of the NCI 60 cell lines and is more resistant to NSC95397-induced cytotoxicity in our observation). Considering that NSC95397 also targets cdc25 28 and the spliceosome, 29 the cytotoxic effect of NSC95397 in these cells could come from inhibition of multiple pathways by the compound.
In summary, we developed a high-throughput screen using the AlphaScreen assay and applied it to screen a small-molecule library for potential inhibitors of CtBP-mediated transcriptional repression. We identified NSC95397 as a potential lead compound. Although NSC95397 is known to have other activities, including inhibition of cdc25 28 and the spliceosome, 29 it also clearly inhibits the CtBP-transcription factor interaction both in vitro and in a luciferase assay using a CtBP-specific promoter. Importantly, the results demonstrate the suitability of this assay for larger HTS campaigns. Future efforts will be focused on identifying more potent inhibitors with a much larger collection of compounds and further exploring the mechanism of action of the lead identified in this report, which can facilitate optimization of the compound potency and specificity through medicinal chemistry efforts.
Footnotes
Acknowledgements
We thank Drs Aaron Patrick and Heide Ford for providing the GST-Six1 expression plasmid, Dr Brian Reid at the High Throughput Screening Core, and Shaun Beavers at the Biophysics Core at the University of Colorado Anschutz Medical Campus for technical help.
Declaration of Conflicting Interests
The authors declared no potential conflicts of interest with respect to the research, authorship, and/or publication of this article.
Funding
The authors disclosed receipt of the following financial support for the research, authorship, and/or publication of this article: This research was supported by a grant NIH R03DA033982 a pilot grant from the NIH/NCRR Colorado CTSI grant UL1 RR025780, and a pilot grant from Golfers Against Cancer Foundation to R.Z. and Q.Z., as well as grant U54 MH084681 to the National Center for Advancing Translational Sciences (NCATS) from the NIH Common Fund Molecular Libraries and Imaging Program.
References
Supplementary Material
Please find the following supplemental material available below.
For Open Access articles published under a Creative Commons License, all supplemental material carries the same license as the article it is associated with.
For non-Open Access articles published, all supplemental material carries a non-exclusive license, and permission requests for re-use of supplemental material or any part of supplemental material shall be sent directly to the copyright owner as specified in the copyright notice associated with the article.