
Abstract
In the early stages of the drug discovery process, evaluation of the drug metabolism and physicochemical properties of new chemical entities is crucial to prioritize those candidates displaying a better profile for further development. In terms of metabolism, drug–drug interactions mediated through CYP450 inhibition are a significant safety concern, and therefore the effect of new candidate drugs on CYP450 activity should be screened early. In the initial stages of drug discovery, when physicochemical properties such as aqueous solubility have not been optimized yet, there might be a large number of candidate compounds showing artificially low CYP450 inhibition, and consequently potential drug–drug interaction toxicity might be overlooked. In this work, we present a novel in vitro approach for simultaneous evaluation of CYP3A4 inhibition potential and kinetic aqueous solubility (NIVA-CYPI-KS). This new methodology is based on fluorogenic CYP450 activities and turbidimetric measurements for compound solubility, and it provides a significant improvement in the use of resources and a better understanding of CYP450 inhibition data.
Introduction
Drug discovery is a long, intensive, and expensive process, and there is tremendous pressure to maximize efficiency and minimize the time it takes to discover and bring a drug to the market. To do this, it is necessary to identify steps in the discovery and development process when changes can be made to increase efficiency and save time. 1 In this regard, drug metabolism assessment represents an essential stage of the process, whose main goal is the multiparameter optimization of candidate compounds for interaction with the desired target and minimal off-target activities, while imparting drug-like properties on the candidate compounds. 2 Within drug metabolism, drug–drug interactions (DDIs) remain a major regulatory hurdle that can lead to early termination of development, refusal of approval, prescribing restrictions, or the withdrawal of the drugs from the market. Cytochromes P450 are recognized as playing an important role in clinically relevant drug–drug interactions. as a result of which new chemical entities are typically subjected to high-throughput CYP inhibition screening.2–4 The inhibition of metabolism by cytochrome P450 enzymes is a principal mechanism for such interactions. It is well established that appropriate in vitro assays are useful predictors of the potential for in vivo interactions and represent an important experimental approach in drug development. In vitro drug interaction data can be used in guiding the design of clinical drug interaction studies, or, when no effect is observed in vitro, the data can be used in place of an in vivo study to claim that no interaction will occur in vivo. In the most frequently applied high-throughput method, CYP450 activity from recombinant enzymes 5 results in oxidation of a pro-fluorescent molecule that then breaks down to give a fluorescent product (usually, a hydroxycoumarin, fluorescein, or resorufin analog) that can then be detected directly using a fluorescence plate reader. This method has the advantage of being a fast and cost-effective way of performing thousands of IC50 determinations per year.3,5 One of the limitations of this approach is that measurements can be subject to interference from test inhibitors that either are fluorescent or cause fluorescence quenching. Although these effects are sometimes observed, however, in practice their frequency is usually acceptably low. These systems investigate the potential of test compounds to inhibit the metabolism of a probe substrate by the main CYP450 isoforms providing, as a final outcome, the concentration of a test compound causing 50% inhibition (IC50) of the probe substrate metabolism, which is deemed sufficient for ranking and selection purposes in early discovery screening. 2 The general routine in such early-screening assays is to perform a serial dilution of the test compounds in DMSO (or another organic solvent) from library stock solutions to maximize the chance for the test compounds to be in solution before being added to the incubation mixture, to be as independent as possible from the other measurements. Nevertheless, the highly lipophilic nature of many early lead compounds results in frequent solubility problems when test compounds are dispensed into aqueous solutions. It is therefore important to consider the effect of test compound precipitation after addition to the incubation mixture. 3 At this point, it is worth remembering that the term molecular obesity 6 is introduced to describe the general tendency among drug discovery settings to build potency into molecules by the use of lipophilicity, which leads to drug candidates with low aqueous solubility. This trend toward lower solubility compounds was attributed to the introduction of high-throughput screening (HTS) and combinatorial chemistry as well as new targets requiring more lipophilic molecules for efficient target affinity. As a result, the limited solubility of compounds can interfere with the results of biological screening because it may lead to the precipitation or aggregation of compounds, causing underestimated activity, reduced HTS hit rates, variable data, an inaccurate structure–activity relationship (SAR), discrepancies between enzyme and cell assays, and inaccurate in vitro ADME–Tox testing.7,8 Thus, solubility should be tested under assay conditions either before or in parallel to biological screening. 9 The determination of aqueous solubility in the majority of drug discovery settings is commonly conducted by means of a kinetic solubility (KS) HTS. Typically, small volumes of the stock solution are added incrementally to the aqueous (buffered) solution of interest until the solubility limit is reached. 7 The resulting precipitation is detected optically, and the kinetic solubility is defined as the concentration preceding the point at which precipitation occurs. In summary, kinetic solubility assays are appropriate for solubility screening up to lead optimization. Assays have minimal compound requirements, are fast, are suitable for HTS, and cover the required concentration range in assays used in early discovery.
Both CYP450 inhibition potential and aqueous solubility are compound properties routinely determined for candidate optimization using HTS in separate in vitro models, and that means parallel consumption of time, staff resources, and materials such as reagents, plates, or liquid-handling station consumables. Furthermore, and more importantly, data generation and management are usually performed at very different timeframes, which may result in a more difficult integration of the final outcome of both determinations.
In the present study, we show a novel in vitro approach for simultaneous evaluation of CYP3A4 inhibition potential and kinetic aqueous solubility (NIVA-CYPI-KS) using fluorogenic substrate and turbidimetric or kinetic measurements, respectively. This new strategy results in a significant reduction in resource spending because the consumption of time, staff availability, material, and instrumentation hardly increases at all in comparison to the individual performance of a separate in vitro model for the evaluation of CYP450 inhibition. Furthermore, the sequential data acquisition within a short period of time from CYP450 inhibition and solubility readouts enables the integration and synchronization of data management that eventually provide a better understanding of CYP450 inhibition data according to a real situation of test compounds in assay solution ( Fig. 1 ). To establish the suitability of this NIVA-CYPI-KS, we selected a set of 11 commercial compounds with reported data as potential CYP3A4 inhibitors, and we simultaneously evaluated their potential and aqueous solubility, using both the NIVA-CYPI-KS and separate conventional methodologies. Our data showed that the NIVA-CYPI-KS delivers very similar results to those obtained with separate methodologies, which allowed the correct categorization (according to published results) of all test compounds in terms of CYP450 inhibitory potential and solubility category.
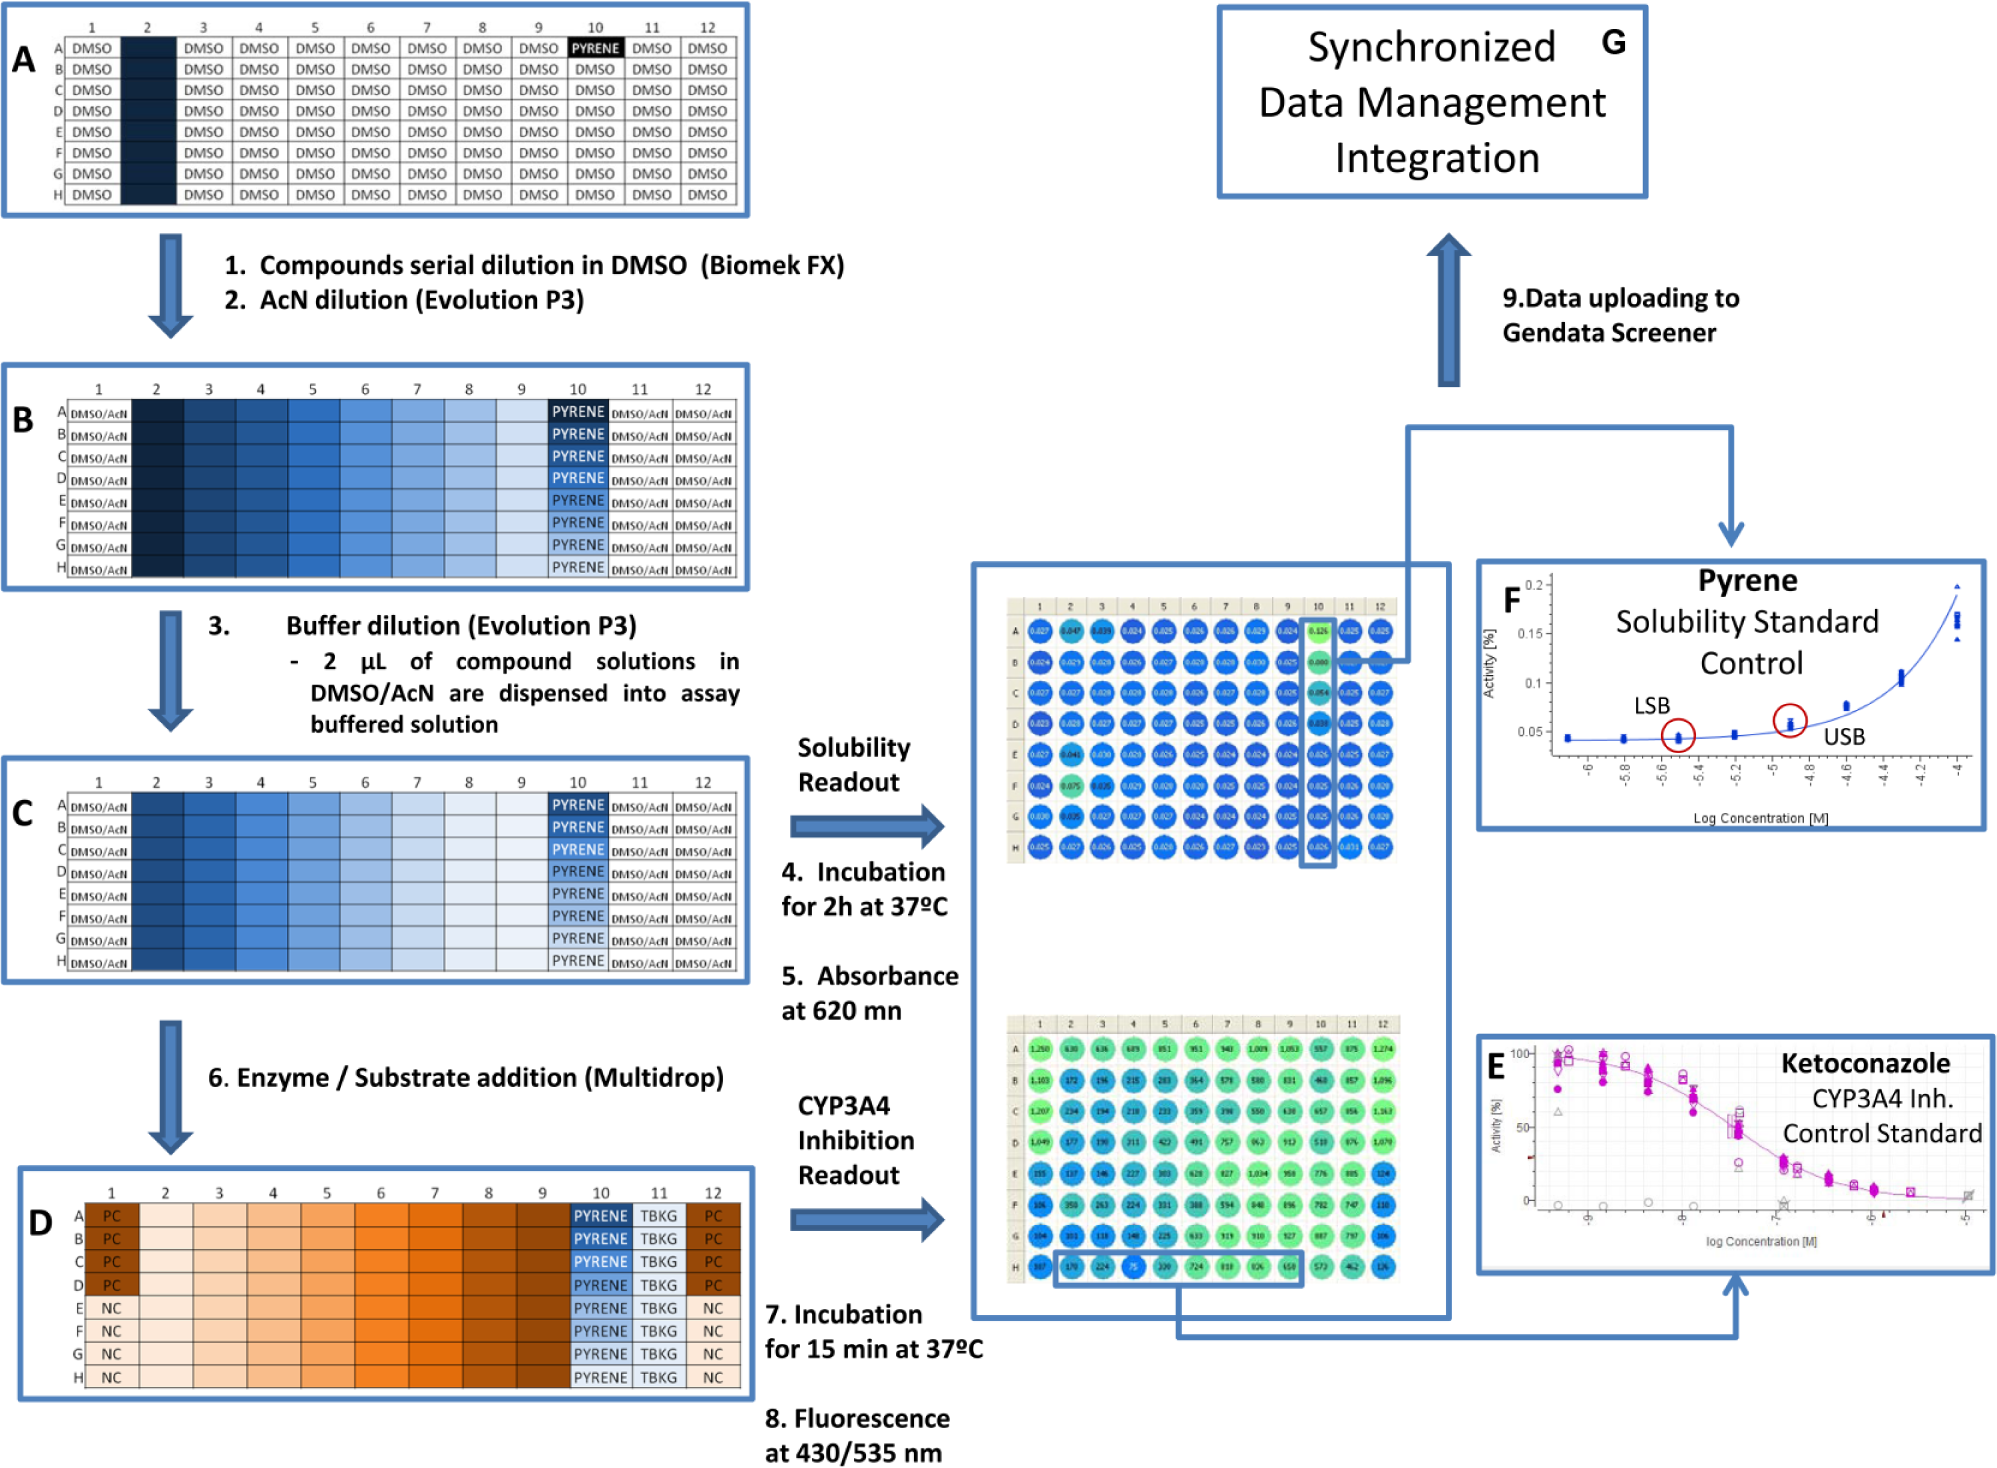
Assay scheme for a novel in vitro approach for simultaneous evaluation of CYP3A4 inhibition and kinetic aqueous solubility (NIVA-CYPI-KS). (
In addition, five lead compounds from in-house research were tested in the NIVA-CYPI-KS to assess the potential benefits of this new approach. In this case, the synchronized integration of results revealed the huge impact that compound concentrations displaying solubility issues may have in IC50 calculation for the evaluation of CYP3A4 inhibition.
Materials and Methods
Compounds and Reagents
Nicotinamide adenine dinucleotide phosphate (NADP) sodium salt, glucose-6-phosphate monosodium salt, glucose-6-phosphate dehydrogenase, potassium phosphate buffer, and magnesium chloride were obtained from Sigma Aldrich (St. Louis, MO). The CYP3A4 nonfluorescent probe substrate 7-benzyloxy-4-(trifluoromethyl) coumarin (BFC) and its corresponding fluorescent reaction product were obtained from Gentest Corporation (Woburn, MA). Human recombinant c-DNA expressed CYP3A4 at 1 nmol/ml was obtained from Gentest Corporation. Lead compounds evaluated in this work were obtained from Fundación MEDINA (Granada, Spain).The commercial compounds evaluated in this work (erythromycin, verapamil, ethynilestradiol, miconazole, bromoergocriptine, nicardipine, clotrimazole, itraconazole, roxythromycin, cimetidine, nifedipine, and ketoconazole) were obtained from Sigma Aldrich.
Test Compound Preparation
For CYP3A4 inhibition evaluation in the conventional separate model and also for the simultaneous evaluation of CYP3A4 inhibition and solubility using the NIVA-CYPI-KS, we used the same solutions of commercial compounds that were prepared as follows: Test compounds were provided in powder form and dissolved in 100% DMSO at 25 mM in 96-well plates. Serial dilutions of test compounds in 100% DMSO were carried out on a Biomek FX workstation coupled with a stacker carrousel (Beckman Coulter Inc., Brea, CA). Considering their previously reported CYP3A4 inhibition potential, commercial compounds were prepared at different initial concentrations and dilution factors to optimize their IC50 calculation from a titration curve with eight concentration levels ( Fig. 1A ). Diluted compounds in 100% DMSO (35 µL) were combined with acetonitrile (65 µL) into 96-well microtiter plates (AB-0765, Thermo, Waltham, MA) by a PerkinElmer Evolution P3 liquid-dispensing instrument (Waltham, MA) to minimize the DMSO final content in enzyme incubations ( Fig. 1B ). Regarding the drug discovery compounds from FUNDACIÓN MEDINA research programs, they were also prepared at 25 mM stock solution from pure powder material. Stock solutions were one-half serially diluted in DMSO to achieve titration curves comprising eight concentration levels. Further dilutions with AcN of these DMSO solutions were carried out as previously described in this section for commercial compounds. Therefore, the concentration levels of drug discovery compounds in the novel approach experiments ranged from 86 to 0.65 µM.
All compounds (commercial and Fundación MEDINA) were tested in triplicate in every methodology studied.
Conventional Separate In Vitro Model for CYP Inhibition Evaluation (CSIVM-CYPI)
Before CYP inhibition reactions, reaction times and microsomal protein concentrations were verified to be within the limits of kinetic linearity (data not shown). Probe substrate concentrations selected for these determinations were approximately equal to the apparent reaction, Km 10 . CYP3A4 inhibition studies were conducted by quantification of nonfluorescent substrate (BFC) transformation to a fluorescent product, which is mediated by CYP3A4. Incubation mixtures were prepared with the following: CYP3A4 enzyme, substrate, and potassium phosphate buffer (pH 7.4) were prepared with the following final concentrations: CYP3A4, 25 pmol/mL, 20 µM BFC in 175 µM potassium phosphate buffer. Test compounds dissolved in DMSO–AcN (35:65) (v/v) (2 µL) were transferred into black 96-well plates with a clear flat bottom (3650 Corning, Corning, Tewksbury, MA) containing an NADPH generating system (1.33 mM NADP, 3.54 mM glucose-6-phosphate, 0.4 U/ml glucose-6-phosphate, and 3.3 mM MgCl2) in a potassium phosphate buffer (pH 7.4; 98 µL) using a PerkinElmer Evolution P3 liquid-handling station. Reactions were initiated by the addition of enzyme–substrate buffered solution (100 µL) using a Thermo Multidrop Combi liquid dispenser (Waltham, MA). Reaction mixtures were incubated with shaking for 15 min at 37 °C. Reactions were terminated with the addition of 75 µl of a STOP solution of AcN containing 0.5 M Tris base. Then, fluorescence was determined using 430 nm as excitation wavelengths and 535 nm as emission wavelengths in a PerkinElmer EnVision multilabel reader. Fluorescence signals were used to estimate IC50 as described in the Data Management and Data Analysis section. Regarding the experimental design of incubation plates, eight positive controls (no inhibitor incubations) were included in each assay plate to assess the maximum amount of fluorescent product formed, and, conversely, eight negative controls (no NADP incubations) were included to assess the contribution of assay reagents to fluorescent readout in each assay plate. Control incubations for fluorescent interference and quenching interference were carried out for each test compound in separate assay plates, containing test compound at maximum dose, recombinant enzyme, and no substrate.
Conventional Separate In Vitro Model for Kinetic Solubility Evaluation (CSIVM-KS)
The kinetic solubility assay was conducted in 96-well, flat-bottom, transparent polystyrene plates (Costar 9018, Corning). Six one-half serial dilutions of an initial 10 mM test compound solution were prepared in DMSO. As currently practiced, 2 µL of a concentrated stock solution of the test compound in DMSO is added to 198 µL of 100 mM potassium phosphate buffer (pH 7.4) solution to give a final DMSO concentration of 1% in each well and a final test compound concentration range between 3.12 µM and 100 µM. Three replicates of each test compound were prepared per concentration. After a 2 h incubation period, to avoid missing slow precipitation that might affect the outcome of a biochemical experiment, the absorbance is measured at 620 nm by an EnVision multilabel plate reader. The kinetic solubility is estimated from the concentration of test compound that produced an increase in absorbance higher than the background levels (typically, 1% DMSO in buffer).
Novel In Vitro Approach for Simultaneous CYP Inhibition and Turbidimetric Solubility Evaluation (NIVA-CYPI-KS)
The experiments for simultaneous determination of CYP3A4 inhibition and aqueous solubility were conducted at 37 °C using 96-well, flat-bottom, polystyrene plates that were white with a clear bottom (Costar 3632, Corning). Incubation mixtures containing CYP3A4 protein, substrate, and potassium phosphate buffer (pH 7.4) were carried out at the same reagent concentrations and kinetic conditions as the CSIVM-CYPI experiment described in this article. Test compounds dissolved in DMSO–AcN (35:65) (v/v) (2 µL) were combined with a 180 µL potassium phosphate buffer (pH 7.4) using an Evolution P3 liquid-handling station ( Fig. 1C ). Then, the plates were incubated for 2 h at 37 °C to allow slow compound precipitation. Thereafter, absorbance was measured at 620 nm by an EnVision multilabel plate reader. Absorbance signals were used to determine compound solubility limits. After that, 10 µl NADP–cofactors buffered solution and 10 µL of enzyme–substrate buffered solution were dispensed using a Multidrop liquid dispenser to trigger the enzymatic reaction ( Fig. 1D ). Plates were incubated at 37 °C for 15 min. Reactions were terminated with the addition of 75 µl of a STOP solution of AcN containing 0.5 M Tris base using a Multidrop liquid dispenser. Then, fluorescence was determined using 430 nm as excitation wavelengths and 535 nm as emission wavelengths by an EnVision multilabel plate reader. Fluorescent signals were used to estimate IC50 values. Eight positive control (no inhibitor incubations) wells to assess the maximum amount of fluorescent product formed were included in each assay plate. Eight negative controls (no NADP incubations) to assess the contribution of assay reagents to fluorescent readout were included in each assay plate. In addition, eight absorbance background control levels for turbidimetric assessment [potassium phosphate buffer at pH 7.4 and 2 µL DMSO–AcN (35:65) (v/v)] were included in each plate. Pyrene was used as the standard control for precipitation in turbidimetric kinetic solubility determination.
Data Management and Data Analysis and Calculations for NIVA-CYPI-KS
Two main calculations lie at the core of the present work: One is the calculation of the IC50 parameters from the fluorescence layer, and the other is the calculation of solubility parameters from the absorbance values. All calculations of IC50 values and solubility limits were performed using the GeneData Screener application software. In the case of the NIVA-CYPI-KS, this software tool was configured to integrate two different measured layers (absorbance at 620 nm before starting enzymatic reaction and fluorescence at final enzymatic incubation time) in a single graphical user interface (GUI) for each 96-well plate, enabling the simultaneous synchronization and visualization of the CYP3A4 inhibition and aqueous solubility data.
CYP3A4 inhibition IC50 calculation
The equation used for normalization for CYP inhibition data is as follows:

where %PC is the percentage of remaining activity at a particular concentration after normalization, NC is the median of the measured signal values for the negative control wells on a plate, PC is the median of the measured signal values for the positive control wells on a plate, and x is the measured raw signal value of a well. The normalized data were fitted by the smart engine embedded in the core of the GeneData Screener using a four-parameter logistic fit to determine the IC50.
Assay correlations (r2) were evaluated from best-fit linear regression analysis using log IC50 values with Microsoft XLFit version 4.0. General DDI risk binning is based on the criteria of IC50 < 1 μM (high risk), 1 μM > IC50 <10 μM (medium risk), or IC50 >10 μM (low risk).
Kinetic or turbidimetric solubility limits calculation
As described in the Conventional Separate In Vitro Model for Kinetic Solubility Evaluation (CSIVM-KS) section, turbidimetric solubility is generally assessed in terms of upper and lower bounds. These two values should be deduced in a straightforward way from the absorbance measurements versus compound concentration curve along with the values from the turbidimetric absorbance background controls (TBKGs) that set the baseline for calculating the two bounds. Intuitively, the curve is flat at lower concentrations and lies at the same level as that of the TBKG controls, but it starts to rise at some point when moving toward higher concentration levels. This raising point, or elbow, is the one that defines the region where the lower and upper bounds are. To find this point in the curve, the tool combines two different approaches, taking advantage of the information provided by the TBKG wells along with the shape of the curve. For the first approach, the tool calculates a sort of Z 11 score for each compound concentration from their respective raw absorbance data, which consist of the subtraction of the TBGK median values plus three times the standard deviation of them.
A new data layer is created with this value, and, in principle, the first point that meets the condition Zscore > 0 when moving from lower to higher concentrations will indicate where the curve elbow is. The addition of the three times the standard deviation ensures that the system discards the random fluctuations or experimental error from the calculation. In any case, a greater fluctuation may sometime appear that makes this approach (on its own) fail in a small percentage of cases because it misinterprets a raising slope as a small maximum. To overcome this limitation, a second approach was introduced that calculates two slopes at any point in the curve by making the subtraction part of each point with the closest right-left neighborhood (S0) and also taking into account the nearest right point slope (
According to the KS classification bands established by Rogge and Taft, 12 compounds can be categorized according to their KS into acceptable KS (>50 µM), marginal solubility (12–50 µM), and unacceptable solubility (<12 µM).
Kinetic solubility and CYP inhibition data integration
Because the fluorescence and absorbance readings obtained when using the NIVA-CYPI-KS are stored in different files, although they are read in the same reader, an automated tool was developed to unify both readings and incorporate them into the GeneData Screener system for further processing. The GeneData Screener application allows the user to assign to every well in a plate as many different values as needed, no matter whether they are raw or calculated data. Any kind of calculation can be defined as well in these logical structures called layers. This is one of the most important features that allowed us to integrate data from different evaluations in a single GUI. This facilitates the use of the linked values to accomplish operations such as flagging, ranking, filtering, masking, and more on the samples, based on those single values or any other logical ensemble. In any case, any change based on any layer’s value is automatically reflected in any other layer (if any point in the solubility curve is masked, this will be masked automatically in the CYP3A4 inhibition dose–response curve as well). The linked data are transferred to a corporate database, where they can be followed up or used in subsequent experiments.
Results and Discussion
To assess the usefulness of this NIVA-CYPI-KS, 10 commercial compounds with previously described IC50 values (from very potent inhibitors such as ketoconazole to moderate-weak inhibitors such as cimetidine) and water solubility (from highly soluble compounds such as erythromycin to poorly soluble compounds such as ketoconazole) were selected for parallel evaluation in the NIVA-CYPI-KS, CSIVM-CYPI, and CSIVM-KS. Consequently, 12 microtiter 96-well plates containing three replicates of each compound were assayed in each methodology under study.
Analysis of the CYP Inhibition Assays
The assay performance for CYP34A4 inhibition experiments was assessed using a robust statistic parameter, Z’ factor (Z’) 11 , which displayed values of 0.76 for CSIVM-CYPI and 0.87 for the NIVA-CYPI-KS. These results allow it to be established that the evaluation of CYP3A4 inhibition was carried out at optimal sensibility and reproducibility, for either the NIVA-CYPI-KS or separate CSIVM-CYPI ( Table 1 ). These findings were confirmed in the analysis of the dose–response curves generated for the selected molecules in each in vitro model. Especially in the case of ketoconazole, an antifungal drug and also a well-known potent CYP3A4 inhibitor in humans that is widely used in vitro as a selective CYP3A4 inhibitor at low concentrations 4 ( Fig. 1E ), the results obtained were very similar regardless of the methodology and in line with data from earlier investigations 13 ( Table 1 ). The rest of the molecules under evaluation for CYP3A4 inhibition also rendered very similar IC50 values as reflected in the linear regression analysis, which yielded a r2 value of 0.9622 ( Fig. 2 ). In all cases, the exhibited differences were lower than threefold independently of the methodology; and, what is more important, none of the molecules considered were misclassified in terms of inhibitor category according to the information from related literature ( Table 1 ). These results perfectly match our expectations because the main experimental differences between the NIVA-CYPI-KS and CSIVM-CYPI are the reagent stock concentrations, the reagent dispensing volumes, and the reagent addition order, whereas other experimental conditions remained the same. In contrast with CSIVM-CYPI, in which serial dilutions of test compounds in organic solvents are dispensed into a buffered prewarmed solution containing NADPH regenerating system and representing one-half of the final incubation volume, for the NIVA-CYPI-KS, test compound dilutions in organic solvent are dispensed into a buffered solution representing 90% of the final incubation volume, and the initiation of reaction is achieved by the addition of separate solutions of enzyme–substrate and the NADP regenerating system. This order of addition enables us to assess the compound solubility just before triggering the enzymatic reaction very close to the final assay concentration. Although this dispensing procedure means one more pipetting step in comparison with commonly practiced CYP450 inhibition procedures, it does not really represent an increase in the final turnaround time, reproducibility, or accuracy of the global assay performance for an eight-channel reagent dispenser such as Thermo Multidrop Combi. The concentration of enzyme–substrate and NADP regeneration system solutions required in NIVA-CYPI-KS should have very little effect on IC50 values because final reagents concentrations remain the same. Therefore, we can assume that the small IC50 variation observed among methodologies (less than threefold) might be due to minor changes in the assay conditions (including incubation temperature, minute changes in the pH of a buffer, etc.), which matches perfectly with the interday variation typically observed in a biological assay. 14
Summary of IC50 Values and Solubility Limits Obtained for Commercial Compounds Using NIVA-CYPI-KS vs CSIVM-CYPI or CSIVM-KS.
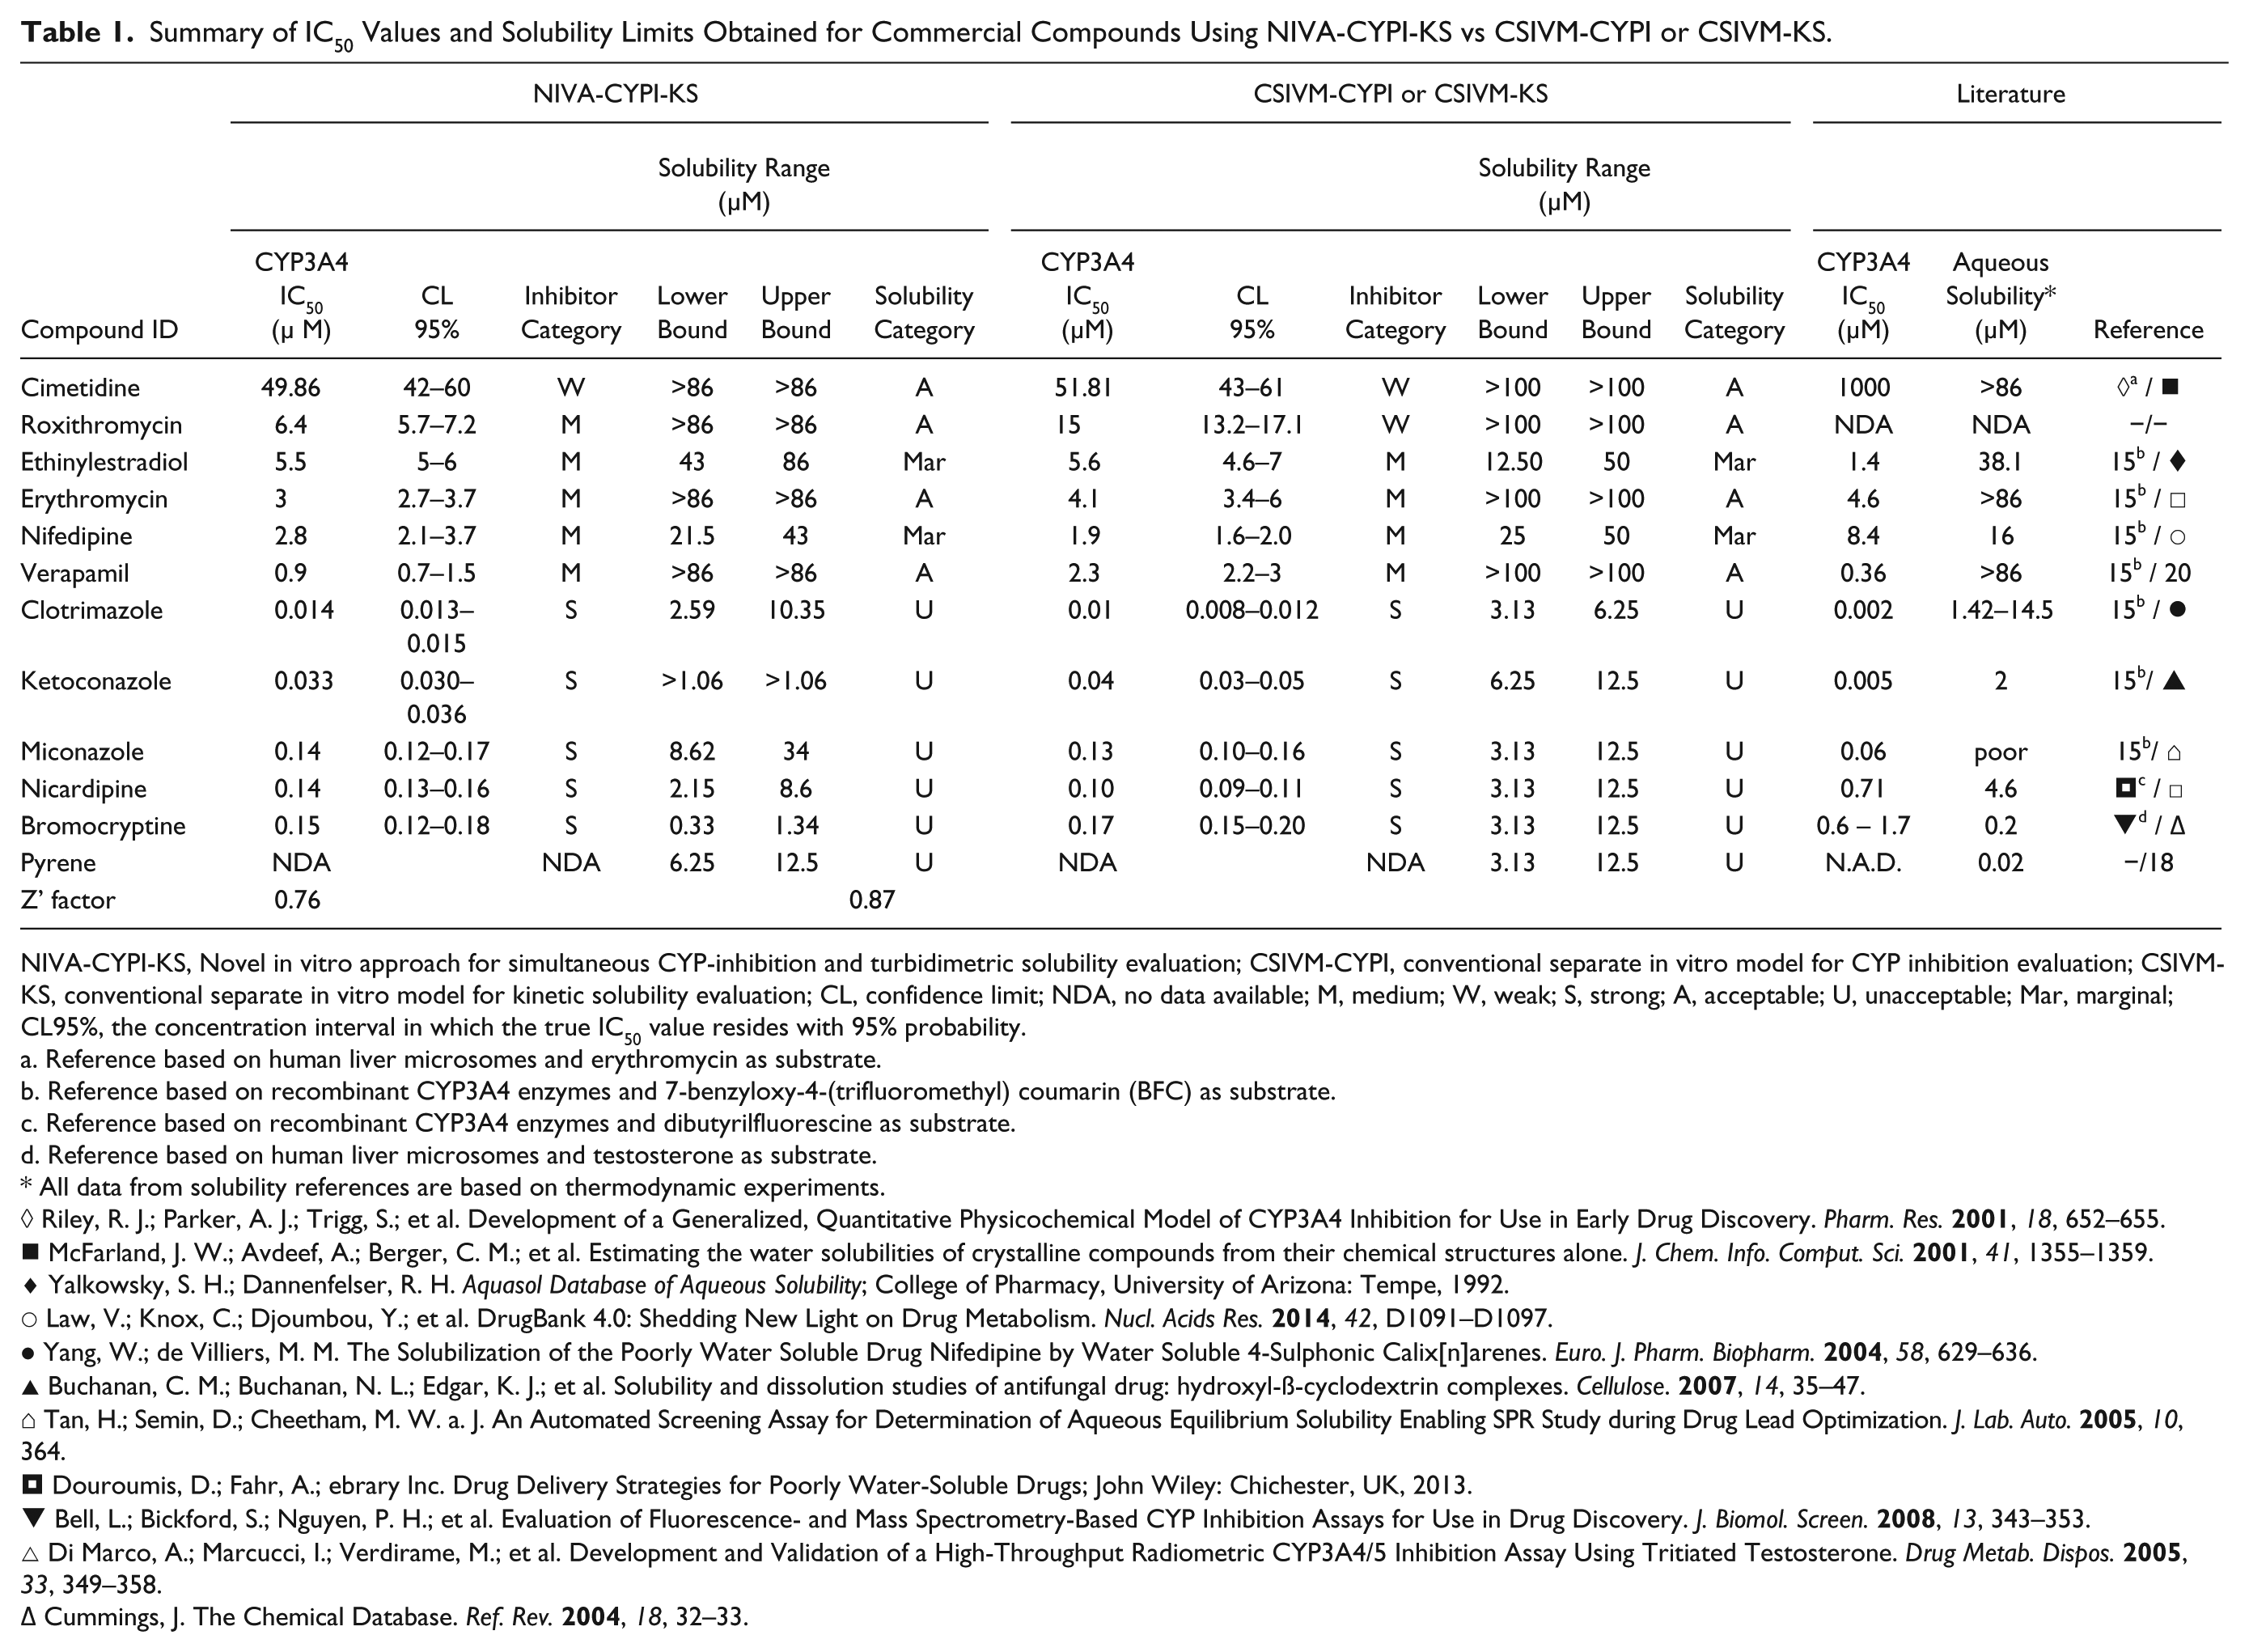
NIVA-CYPI-KS, Novel in vitro approach for simultaneous CYP-inhibition and turbidimetric solubility evaluation; CSIVM-CYPI, conventional separate in vitro model for CYP inhibition evaluation; CSIVM-KS, conventional separate in vitro model for kinetic solubility evaluation; CL, confidence limit; NDA, no data available; M, medium; W, weak; S, strong; A, acceptable; U, unacceptable; Mar, marginal; CL95%, the concentration interval in which the true IC50 value resides with 95% probability.
Reference based on human liver microsomes and erythromycin as substrate.
Reference based on recombinant CYP3A4 enzymes and 7-benzyloxy-4-(trifluoromethyl) coumarin (BFC) as substrate.
Reference based on recombinant CYP3A4 enzymes and dibutyrilfluorescine as substrate.
Reference based on human liver microsomes and testosterone as substrate.
All data from solubility references are based on thermodynamic experiments.
Riley, R. J.; Parker, A. J.; Trigg, S.; et al. Development of a Generalized, Quantitative Physicochemical Model of CYP3A4 Inhibition for Use in Early Drug Discovery. Pharm. Res.
McFarland, J. W.; Avdeef, A.; Berger, C. M.; et al. Estimating the water solubilities of crystalline compounds from their chemical structures alone. J. Chem. Info. Comput. Sci.
Yalkowsky, S. H.; Dannenfelser, R. H. Aquasol Database of Aqueous Solubility; College of Pharmacy, University of Arizona: Tempe, 1992.
Law, V.; Knox, C.; Djoumbou, Y.; et al. DrugBank 4.0: Shedding New Light on Drug Metabolism. Nucl. Acids Res.
Yang, W.; de Villiers, M. M. The Solubilization of the Poorly Water Soluble Drug Nifedipine by Water Soluble 4-Sulphonic Calix[n]arenes. Euro. J. Pharm. Biopharm.
Buchanan, C. M.; Buchanan, N. L.; Edgar, K. J.; et al. Solubility and dissolution studies of antifungal drug: hydroxyl-ß-cyclodextrin complexes. Cellulose.
Tan, H.; Semin, D.; Cheetham, M. W. a. J. An Automated Screening Assay for Determination of Aqueous Equilibrium Solubility Enabling SPR Study during Drug Lead Optimization. J. Lab. Auto.
 Douroumis, D.; Fahr, A.; ebrary Inc. Drug Delivery Strategies for Poorly Water-Soluble Drugs; John Wiley: Chichester, UK, 2013.
Bell, L.; Bickford, S.; Nguyen, P. H.; et al. Evaluation of Fluorescence- and Mass Spectrometry-Based CYP Inhibition Assays for Use in Drug Discovery. J. Biomol. Screen.
Di Marco, A.; Marcucci, I.; Verdirame, M.; et al. Development and Validation of a High-Throughput Radiometric CYP3A4/5 Inhibition Assay Using Tritiated Testosterone. Drug Metab. Dispos.
Cummings, J. The Chemical Database. Ref. Rev.
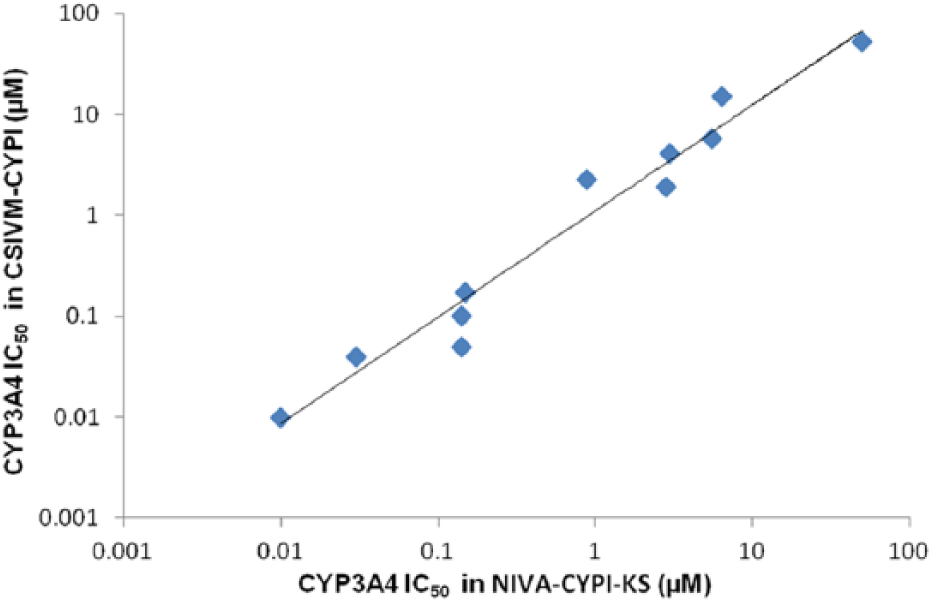
Comparison of CYP3A4 IC50 values obtained for commercial compounds between a conventional separate in vitro model for CYP inhibition evaluation (CSIVM-CYPI) and the novel in vitro approach for simultaneous evaluation of CYP3A4 inhibition potential and kinetic aqueous solubility (NIVA-CYPI-KS).
Neither the commercial compounds nor the lead compounds used in this study displayed fluorescent or quenching interference.
Analysis of the Solubility Assays
Analogously, the analysis of solubility limits obtained in each methodology revealed very similar data in both cases (NIVA-CYPI-KS vs CSIVM-KS), that is, all of the compounds were classified in the same solubility categories in both methods and were in good agreement with the results retrieved from related literature ( Table 1 ). The main differential factors between the procedures to determine KS discussed in this study are final test compound concentration and final content of DMSO. Other critical conditions such as buffer system and incubation time were maintained the same in both procedures, and therefore their contribution to interassay variability must be minimal. The ratio between the final concentration of test compound in the NIVA-CYPI-KS and the CSIVM-KS has been determined as 1.1, and consequently the effect from this factor on the final results is expected to be very low. Conversely, the lower content of DMSO required in NIVA-CYPI-KS to minimize its inhibitory effect in CYP3A4 activity 15 might lead to worse prevention of precipitation because the role of DMSO as a co-solvent has been previously described. This solubility enhancement by DMSO, which can be dramatic, is highly compound specific7,16,17 and hardly predictable. When DMSO concentration is kept to an absolute minimum (≤ 1%), however, the potential co-solvent effects are reduced, achieving better correlations with thermodynamic methods. 7 (Kinetic assessment typically evaluates the solubility of a compound already fully dissolved in an organic solvent. It does not allow for equilibrium to be reached between a dissolved compound and solid compound. Thermodynamic assessment evaluates the solubility of solid crystalline material in aqueous solvent as a saturated solution in equilibrium. From the presence of DMSO, it is expected that solubility obtained from kinetic methods generally yields results that are higher than solubility as determined by thermodynamic methods. The relevance of thermodynamic solubility is less useful in drug discovery because it is not common for early in vitro screens to start with solid material. The importance of thermodynamic assessment is greater in late discovery or early development, when it is used to confirm earlier kinetic solubility results, rule out potential artifacts, and generate high-quality solubility data using crystalline material.) Taking into consideration this general rule, a moderate deviation toward higher solubility limits might be expected in lipophilic compounds from CSIVM-KS in which DMSO content represents 1% of the final volume, in contrast with the NIVA-CYPI-KS (0.35% final content of DMSO). Pyrene, a polycyclic aromatic compound with very low water solubility, 18 was used to assess the effect of DMSO content in turbidimetric solubility measurements ( Fig. 1F ). As shown in Table 1 , the lowest concentration of pyrene displaying absorbance with intensity higher than the background signal (upper solubility bound) was determined in 12.5 µM for the two methodologies under study. In addition, the raw absorbance values of pyrene at 12.5 µM and the background controls (buffer and DMSO:AcN for NIVA-CYPI-KS, and buffer and DMSO for CSIVM-KS) were very similar in both determinations; hence, and from the upper solubility limits determined for the rest of the compounds, we can assume that the different contents of DMSO used in this work have very little effect in the solvation of compounds.
Replacement of DMSO by other co-solvents, such as AcN with lower ultraviolet (UV) absorption in the low-UV range, causes similar problems in terms of enhancing solubility; 7 hence, while keeping the total amount of organic solvent at 1%, no significant differences should be expected among methodologies for most compounds. Therefore, the effect of organic solvents should not be overemphasized because, even for DMSO concentrations as high as 5%, this effect produces an increase in solubility that is lower than one order of magnitude. We observed a major difference only in the upper solubility limit for bromocryptine. In this case, the compound displayed a 10-fold higher solubility limit in the presence of DMSO at 1%. Bromocriptine is an ergoloid-based drug similar to ergotamine and ergonovine, which have been previously described as extremely lipophilic 19 and soluble in DMSO (50 mg/ml). 20 Thus, bromocriptine might be more sensitive to the higher content DMSO, enabling an increase in the solubility limits. According to the upper solubility determined for pyrene using NIVA-CYPI-KS (12 µM) and considering the reported aqueous solubility by thermodynamic methods for pyrene (0.02 µM), we can assume a detection limit for turbidimetric measurements in NIVA-CYPI-KS in the range of 1 to 10 µM depending on the compound, which is perfectly in line with previously published reports, 7 and it is appropriate for solubility screening because it covers the required concentration levels in the assays used in early discovery. Even though the dilution pattern considered for commercial compounds in either CSIVM-KS or NIVA-CYPI-KS was one-half in most cases, for some compounds, the replicates at some concentration levels were scattered either just lower or just higher than the background threshold. This is taking place for concentration values really close to the solubility limit. In such situations, the algorithm calculation was configured to set the upper and lower bounds at concentrations at which absorbance values were clearly higher or lower than the background threshold. Although this approach might enhance the solubility range between upper and lower bounds and makes difficult the classification in solubility categories, it delivers more reproducible data. The close examination of absorbance values in the upper and lower solubility bounds enables the solubility limit to be predicted and therefore the correct classification to be determined.
From these results, we can conclude that NIVA-CYPI-KS enables us to monitor aqueous solubility and CYP3A4 inhibition using a unique experiment performance without compromising data quality. The present NIVA-CYPI-KS offers many advantages by conducting two assays in a single experiment, such as significant decreases in the amount of reagents, test compounds, materials necessary for experiments, as well as turnaround time, compared to previously published separate methods for the evaluation of cytochrome P450 activity and aqueous solubility. In addition, this NIVA-CYPI-KS is also readily compatible with automation because experiments have been performed successfully in 96-well plates using liquid handlers, an automated workstation, and autosamplers. In terms of data management, the data acquisition for solubility and CYP3A4 inhibition, achieved within a short timeframe using NIVA-CYPI-KS, allows the effective analysis and interpretation of CYP3A4 inhibition data taking into account the real compound situation in the assay solution. The solubility of drug candidates is very important because it affects gastrointestinal absorption of oral drugs. High potency and permeability can somewhat overcome solubility issues, but at the expense of increased cost and delays, and no guarantee of success. Low solubility can lead to a number of problems downstream (poor oral bioavailability, a lack of efficacy, an abnormal PK profile, intersubject and interspecies variation, problematic formulations, the toxicity of vehicles, a prodrug approach, an expensive and prolonged development, and burdens to patients such as multiple doses daily). Another critical issue is that low solubility might lead to erratic assay results in vitro, including erroneous SARs, discrepancies between biochemical and cell-based assays, artificially low potency, a low HTS hit rate, underestimated toxicity (e.g., CYP inhibition or hERG blockage), and, ultimately, an inability to measure critical properties (e.g., membrane permeability, and chemical and metabolic stability). Frequently, solubility issues are deferred for correction during development by using novel formulations or delivery systems. This greatly increases the risk of project completion, however, because solubility issues might prove to be intractable. Early warning of the problem allows reacting and starting formulation efforts to prevent a formulation from becoming a critical issue later on. Measurement of solubility from the early discovery level allows the selection and optimization of compounds for improved solubility. This greatly enhances the prospects for success of a development candidate. This NIVA-CYPI-KS enables eight individual compounds to be assessed in dose–response format with up to eight concentrations each. Strategies, such as single concentration to IC50 projection, 21 might be considered to increase throughput after an extensive validation study. The use of 384-well plates was also evaluated. It did not yield homogeneous suspension of the incubation components, however. Further investigation into the use of alternative shakers, mixing speed, and other conditions is needed to achieve stable suspensions of the incubation matrix in a 384-well plate comparable with that achieved in a 96-deep-well plate. For all of the above-mentioned reasons, this NIVA-CYPI-KS represents an improvement not only in terms of resource savings but also in final results interpretation because the previously described ability to review simultaneously the readouts for solubility and CYP3A4 inhibition through the GUI of GeneData Screener enables one to identify those compound concentrations displaying solubility issues and the subsequent rejection of corresponding data points for IC50 calculation because, especially in the case of moderate and strong inhibitors, this data points might affect dose–response curve fitting and consequently the calculated IC50 value.
Application of the NIVA-CYPI-KS to Lead Compounds
To illustrate this situation, five drug discovery compounds from different FUNDACIÓN MEDINA research programs that had been previously tested for the evaluation of CYP3A4 inhibition using CSIVM-CYPI were selected due to the partial inhibition profile observed from their respective dose–response curves. The results obtained from the reevaluation of these selected compounds using NIVA-CYPI-KS revealed that all the data points showing a partial inhibition profile displayed absorbance values higher than the organic solvent–buffer control and consequently could be identified as presenting solubility issues ( Fig. 3 ). These data points were masked in the absorbance solubility layer in the GeneData Screener GUI and afterward synchronized with the corresponding CYP3A4 inhibition layer. As a result, these activity data points coming from compound concentrations in buffer solution showing absorbance values higher than buffer DMSO controls were not taken into account by the GeneData Screener fitting engine. After masking concentration points displaying solubility issues, the IC50 value was calculated by extrapolation from curve fitting using the Hill equation and assuming the plateau values to be 0% and 100% at an infinite concentration of test compound and at zero concentration, respectively. This way, the IC50 rendered lower values (at least 17-fold) than those obtained from full dose–response curves, considering all activity data points ( Table 2 ). Interestingly, the five drug discovery compounds considered for this study displayed turbidimetric solubility limits lower than 50 µM ( Table 2 ), which represents a higher risk of developing artificially low inhibition of CYP450, as we described in a previous work undertaken to assess how compound aqueous solubility contributes to the lack of correlation observed in different in vitro models commonly used in CYP450 inhibition assessment. 22 Thus, we have demonstrated that by using this novel approach, it is a very useful procedure for identifying drug candidates with artificially low CYP3A4 inhibition potential due to solubility issues.
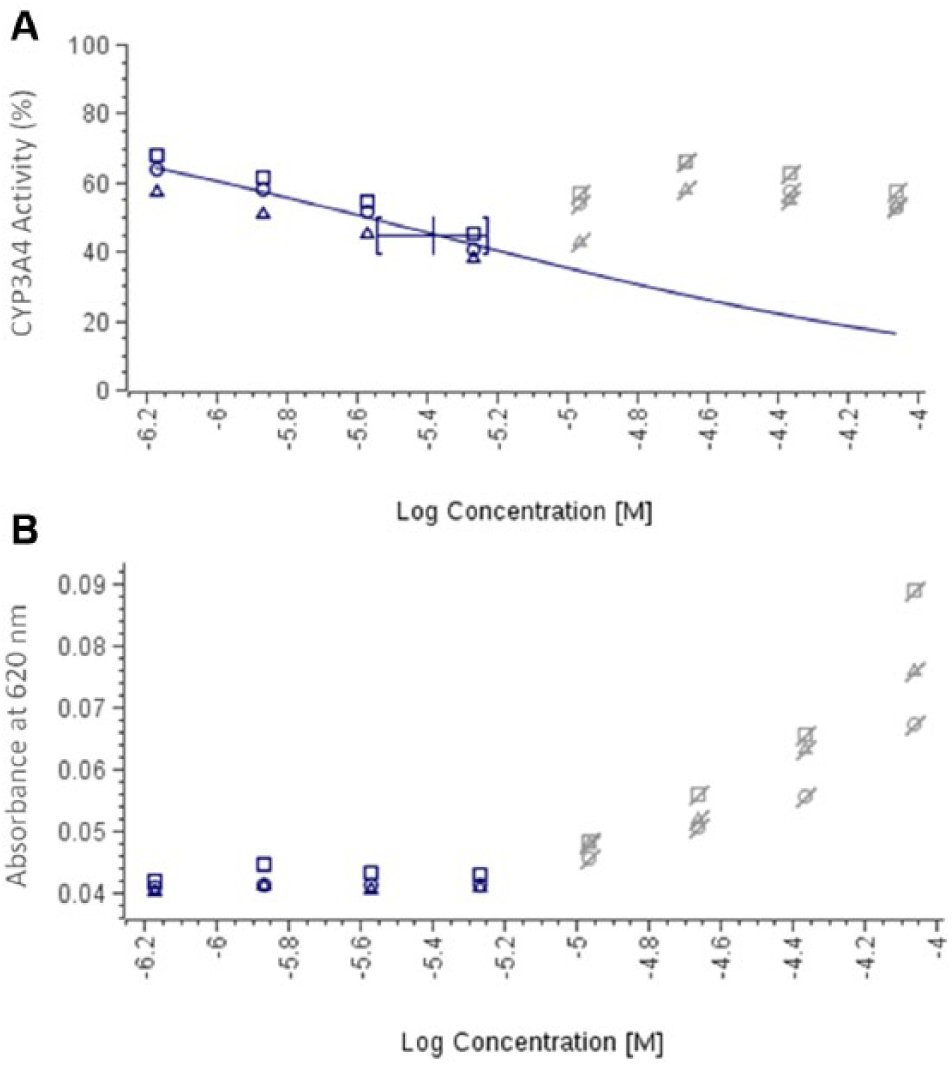
Dose–response curves for lead compound 4 using a novel in vitro approach for simultaneous evaluation of CYP3A4 inhibition potential and kinetic aqueous solubility (NIVA-CYPI-KS). (
Summary of Results for Drug Discovery Compounds Using a NIVA-CYPI-KS.
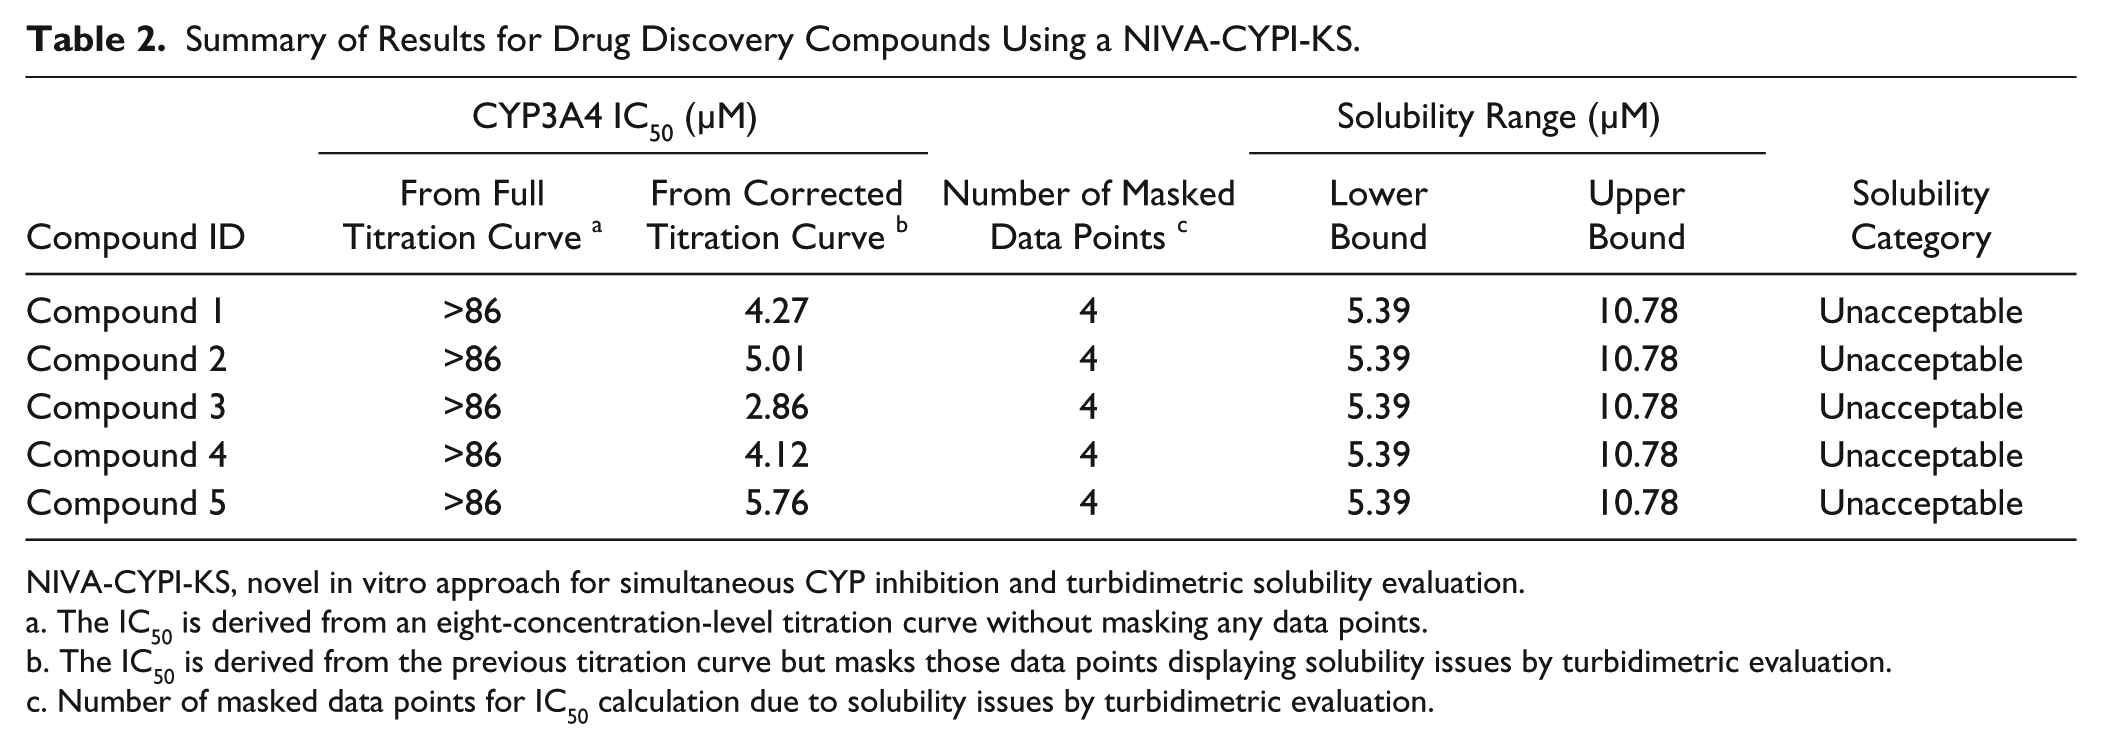
NIVA-CYPI-KS, novel in vitro approach for simultaneous CYP inhibition and turbidimetric solubility evaluation.
The IC50 is derived from an eight-concentration-level titration curve without masking any data points.
The IC50 is derived from the previous titration curve but masks those data points displaying solubility issues by turbidimetric evaluation.
Number of masked data points for IC50 calculation due to solubility issues by turbidimetric evaluation.
In summary, a high-throughput ADME profiling system has been implemented using this NIVA-CYPI-KS, which provides the throughput required to analyze a large number of early ADME samples while maintaining high data quality. The consolidation of two determinations in a single experimental procedure renders a significant saving in terms of reagents, material, as well as turnaround time. In addition, the ability to integrate and synchronize CYP3A4 inhibition and solubility data in a single result-reviewing session speeds up the candidate selection process and provides a more correct compound classification in terms of potential to inhibit CYP3A4 activity.
Footnotes
Acknowledgements
We acknowledge Carmen González Olmedo from Universitat Autònoma de Barcelona for critically reading and reviewing the manuscript.
Declaration of Conflicting Interests
The authors declared no potential conflicts of interest with respect to the research, authorship, and/or publication of this article.
Funding
The authors disclosed receipt of the following financial support for the research, authorship, and/or publication of this article: The results presented in this work will be compiled in the doctoral thesis (knowledge area code 32089 and subject code 320903) entitled “Evaluación de la actividad de los metabolitos hepáticos derivados de compuestos inmunomodulares e inhibidores de GSK3,” carried out currently by José Pérez del Palacio at FUNDACIÓN MEDINA in collaboration with the Department of Pharmacology at the University of Granada; thesis directors: Francisca Vicente (FUNDACIÓN MEDINA) and Julio Gálvez (Universidad de Granada).