
Abstract
Alzheimer disease (AD) is the most common neurodegenerative disease, and with Americans’ increasing longevity, it is becoming an epidemic. There are currently no effective treatments for this disorder. Abnormalities of Tau track more closely with cognitive decline than the most studied therapeutic target in AD, amyloid-β, but the optimal strategy for targeting Tau has not yet been identified. On the basis of considerable preclinical data from AD models, we hypothesize that interactions between Tau and the Src-family tyrosine kinase, Fyn, are pathogenic in AD. Genetically reducing either Tau or Fyn is protective in AD mouse models, and a dominant negative fragment of Tau that alters Fyn localization is also protective. Here, we describe a new AlphaScreen assay and a live-cell bioluminescence resonance energy transfer (BRET) assay using a novel BRET pair for quantifying the Tau–Fyn interaction. We used these assays to map the binding site on Tau for Fyn to the fifth and sixth PXXP motifs to show that AD-associated phosphorylation at microtubule affinity regulating kinase sites increases the affinity of the Tau–Fyn interaction and to identify Tau–Fyn interaction inhibitors by high-throughput screening. This screen has identified a variety of chemically tractable hits, suggesting that the Tau–Fyn interaction may represent a good drug target for AD.
Introduction
The microtubule-associated protein Tau is a major pathological marker of Alzheimer disease (AD) and plays an important role in facilitating deficits in models of AD. More specifically, Tau reduction has dramatic protective effects in many AD models.1–3 Also, Tau reduction is effective in pharmacological and genetic models of epilepsy,1,3–5 and Tau reduction remains effective when administered in adulthood. 6 These studies point to Tau as a key player in mediating AD-related neuronal hyperexcitability, but how to target this aberrant excitability has not been clear. Because Tau has a major role as a scaffolding protein, we looked to Tau interacting partners for therapeutic targets.
Several studies aroused interest in the nonreceptor tyrosine kinase Fyn, which interacts with polyproline helices in Tau through its SH3 domain
7
and, interestingly, also regulates seizure susceptibility.8,9 Tau reduction is protective in a Fyn-dependent model of AD,
2
but the mechanism for this protection has been unclear until recently. Studies now show that Tau targets Fyn to the dendrites, where Fyn facilitates N-methyl-
Materials and Methods
Protein Purification
Bacterial codon-optimized human 4R2N Tau (Life Technologies, Carlsbad, CA) was tagged on the N-terminus with a His tag and on the C-terminus with a Strep tag. The human Fyn SH3 domain was tagged on the N-terminus with a glutathione S-transferase (GST) tag and on the C-terminus with a Strep tag. The constructs were cloned into the pPR-IBA1 vector (IBA Life Sciences, Göttingen, Germany) and transformed into BL21(DE3)-RIPL Escherichia coli (Agilent Technologies, Santa Clara, CA). Colonies were picked from freshly streaked LB Agar plates containing 100 µg/mL carbenicillin (Fisher, Hampton, NH; all chemicals were obtained from Fisher unless otherwise noted) and 25 µg/mL chloramphenicol into 50 mL LB Broth starter cultures containing 100 µg/mL carbenicillin. Starter cultures were grown at 37°C for 10 h, then diluted 100× into 2 L of LB Broth split between five 2-L flasks containing 100 µg/mL carbenicillin, and growth was allowed to continue at 37°C. Bacteria were then closely monitored and induced at an OD600 of 0.6 to 1.0 (usually about 2–4 h of growth) with 1 mM isopropyl β-D-1-thiogalactopyranoside (IPTG). Phenylmethylsulfonyl fluoride (PMSF) was also added at this stage to a final concentration of 1 mM, which we found increased the yield of Tau. Protein expression was allowed to continue for 4 h at 37°C. Bacteria were then pelleted and immediately purified. Both proteins were bulk purified with 5 mL of Strep-Tactin Superflow high-capacity resin (IBA Life Sciences) according to the manufacturer’s instructions. The GST–Fyn SH3–strep protein was eluted with 50 mM Tris (pH 7.4); 300 mM NaCl; 10 mM TCEP (to reduce disulfide bonds, which we found persisted in purified Tau, even on sodium dodecyl sulfate–polyacrylamide gel electrophoresis [SDS-PAGE] gels with β-mercaptoethanol without this buffer component); 0.2% KATHON CG/ICP (Sigma-Aldrich, St. Louis, MO) as an antimicrobial reagent (because sodium azide is not compatible with AlphaScreen); 10 mM D-desthiobiotin, which allows for reuse of strep columns (IBA Life Sciences); and 2× Halt protease inhibitors (Thermo Scientific, Waltham, MA). This eluate was diluted 1:1 in ethylene glycol as a cryoprotectant for storage at −20°C. The final yield and concentration of GST–Fyn SH3–strep protein was 9.3 mg and 53.5 µM, respectively, as determined by staining compared with bovine serum albumin (BSA) standards (Thermo Scientific). We used the Coomassie Fluor Orange protein stain (Life Technologies) for concentration determination, which binds to the SDS-coat around proteins and thus is not susceptible to false concentration determination from differences in the number of aromatic residues present in purified proteins.
The His–Tau 4R2N–strep protein was eluted with 25 mM Bis-Tris (pH 6.0), 150 mM NaCl, 200 mM CaCl2, 10 mM TCEP, 0.2% KATHON CG/ICP, 10 mM D-desthiobiotin, and 2× Halt protease inhibitors. The difference in buffer from the elution buffer for Fyn SH3 was to achieve a pH further from Tau’s isoelectric point and to have the chaotrope CaCl2 present, both as measures against protein aggregation, because high-concentration preparations of purified Tau aggregated upon storage at −20°C in the storage buffer described for the Fyn preparation. Since Tau is an intrinsically unstructured protein, the presence of a chaotrope in the storage buffer was not a concern, and the high level of dilution prior to AlphaScreen ensured no effect on AlphaScreen signal. This eluate was diluted 1:1 in ethylene glycol as a cryoprotectant for storage at −20°C. The final yield and concentration of His–Tau 4R2N–strep protein was 11.5 mg and 5.2 µM, respectively, as determined by staining with Coomassie Fluor Orange staining (Life Technologies).
A GST-His fusion protein was also generated, which was expressed in the same manner and purified by both Cobalt resin and Glutathione resin (Thermo Scientific) by bulk purification according to the manufacturer’s instructions. The GST-His protein was then buffer-exchanged using a centrifugal filter unit (Millipore, Billerica, MA) with a 3-kDa MWCO into 50 mM Tris (pH 7.4), 300 mM NaCl, 10 mM TCEP, 0.2% KATHON CG/ICP, and 2× Halt protease inhibitors. This eluate was diluted 1:1 in ethylene glycol as a cryoprotectant for storage at −20°C. The final yield and concentration of GST-His protein was 2.3 mg and 39.4 µM, respectively, as determined by staining with Coomassie Fluor Orange.
Small amounts of Tau and Fyn SH3 containing a C-terminal Strep tag, but without N-terminal tags needed for interaction with the AlphaScreen beads, were also generated as competitive protein inhibitors for initial optimization experiments.
For small batches of protein to investigate the effect of Tau modifications on the Tau–Fyn SH3 interaction, proteins were expressed in KRX bacteria (Promega, Madison, WI) via autoinduction per the manufacturer’s instructions, purified with Strep-Tactin spin columns (IBA Life Sciences) per the manufacturer’s instructions, eluted with the same buffer used to elute the GST–Fyn SH3–strep protein, and then diluted 1:1 in Milli-Q water (Millipore) containing 0.2% casein (EMD Chemicals, San Diego, CA) (to prevent the low amount of purified protein from sticking to the sides of the storage tubes) and 2× Halt protease inhibitors for short-term storage at 4°C.
AlphaScreen
AlphaScreen was conducted with 10 µg/mL of glutathione donor beads (6765302; PerkinElmer, Waltham, MA) and nickel chelate acceptor beads (6760619R; PerkinElmer). The buffer composition was 10 mM Bis-Tris (pH 7.0), 1 mM TCEP, 0.02% casein, and 0.1% Tween-20. All dilutions were made in this buffer unless otherwise specified. The concentration of each protein used was 75 nM for high-throughput screening (HTS), since this was the minimal amount of protein needed to provide an acceptable signal for HTS, and 150 nM for manual optimization and verification plates, as this concentration gave a less variable signal when plates were prepared by hand.
Generally, compounds were plated first in experiments where compounds were used (including HTS), followed by simultaneous addition of the proteins. The protein-compound mixture was allowed to incubate for 30 min, and then the beads were added simultaneously and the final mixture was allowed to incubate for 1 to 5 h, over which time the signal remained strong and consistent. All experiments were conducted in 384-well plates (6005350; PerkinElmer). Miniaturization to 1536-well plates was attempted for HTS, but we observed a complete loss of signal in approximately 1% of the wells that we did not observe in 384-well plates. We speculate that this may have been due to Tau aggregation seeded by increased surface area contact in 1536-well plates. HTS results were read on an EnVision plate reader (PerkinElmer). Other results were obtained using a Synergy2 plate reader (BioTek, Winooski, VT) with excitation at 680/30 nm and emission at 570/100 nm (BioTek).
For small preparations used to investigate the effects of Tau modifications on Tau–Fyn SH3 interactions, where it was important to maintain a consistent concentration to ensure that an effect in AlphaScreen signal was due to a difference in Tau–Fyn SH3 interaction affinity and not due to a difference in concentration, 300 nM of each protein was used, since this concentration was at the top of the “hook point” for the AlphaScreen assay (see Fig. 1B ) and thus was less susceptible to variations in protein expression between preparations. This “hook point” is a characteristic feature of AlphaScreen assays, above which saturating protein concentrations can attenuate signal (see Wenham et al. 16 for further description). To further control for protein concentration, a protein gel was run as previously described with aliquots of the purified Tau or Fyn, along with lanes of BSA standards (10–300 µg). After running this gel, protein concentration was quantified versus the BSA standards by staining with Coomassie Fluor Orange and analyzed using ImageJ (National Institutes of Health, Bethesda, MD). The proteins were then diluted to the concentration of the lowest concentration preparation. These diluted samples were run on a second gel to verify equalization of protein concentration and quantified versus BSA standards as before. After determining the average concentration from this second gel, any preparations with concentration values less than half or more than double the calculated average on the second gel were discarded. Generally, preparations did not vary much more than 20% to 30% from the mean using this method, and it was not usually necessary to discard outlier preparations. The average of seven replicates (seven wells) in AlphaScreen per protein preparation was used for each data point presented in Figure 2C , Figure 4B , and Figure 4D .
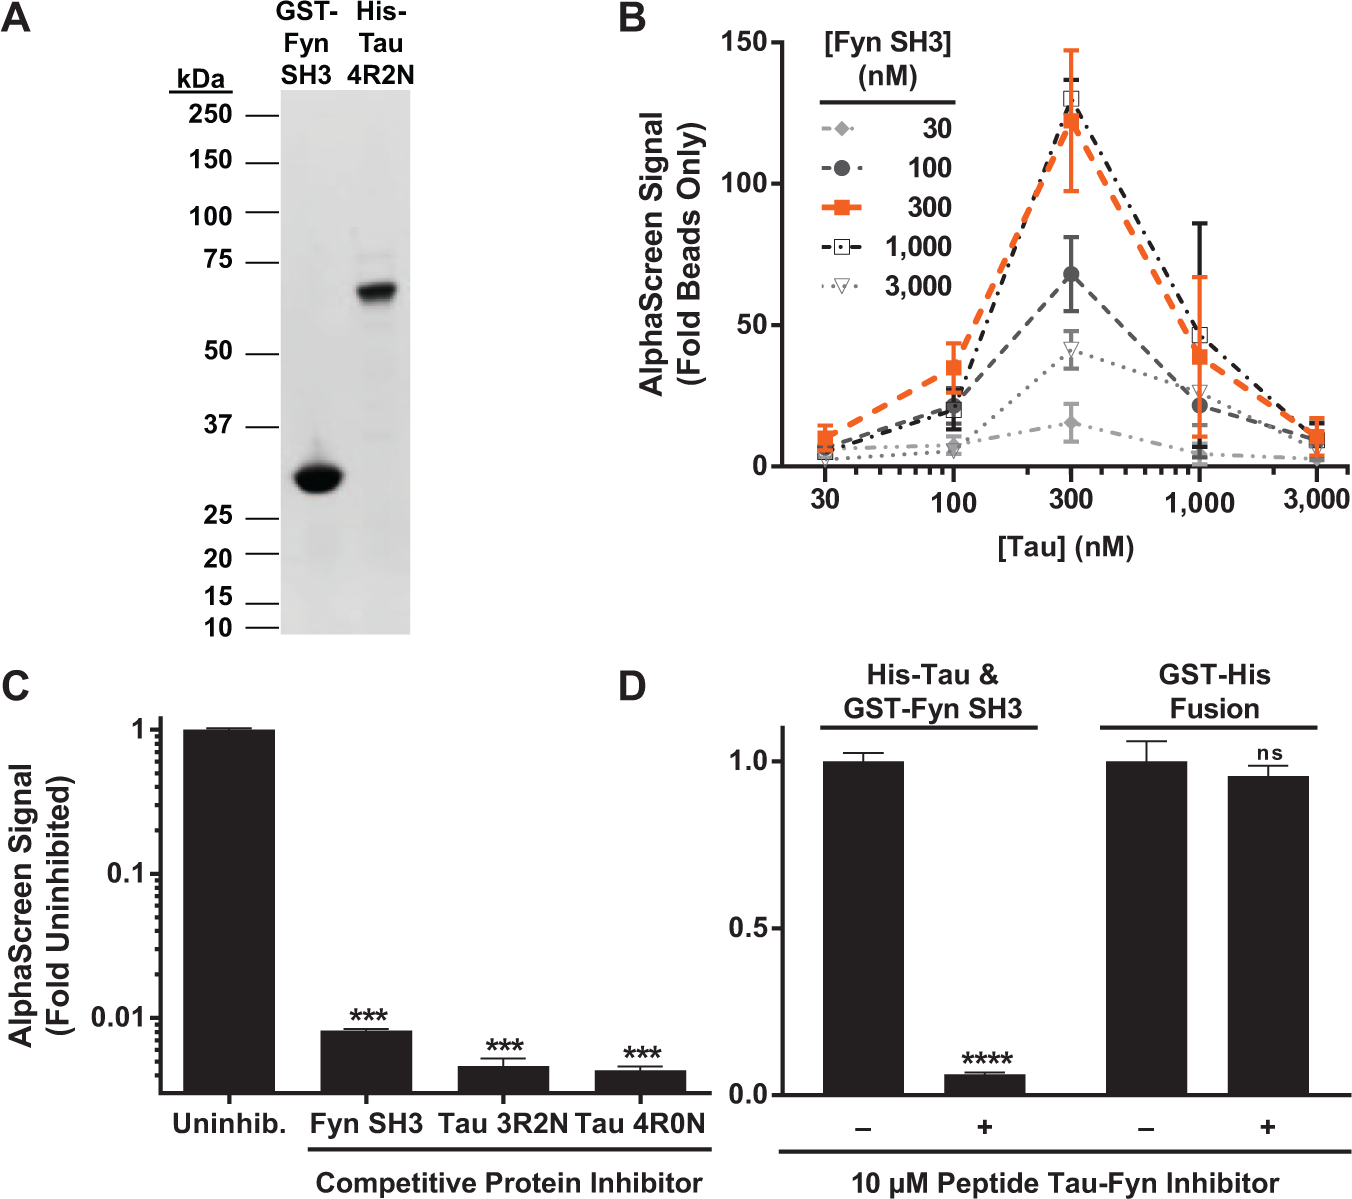
An AlphaScreen assay provides a high-throughput screening (HTS)–compatible signal for the Tau–Fyn SH3 interaction. (
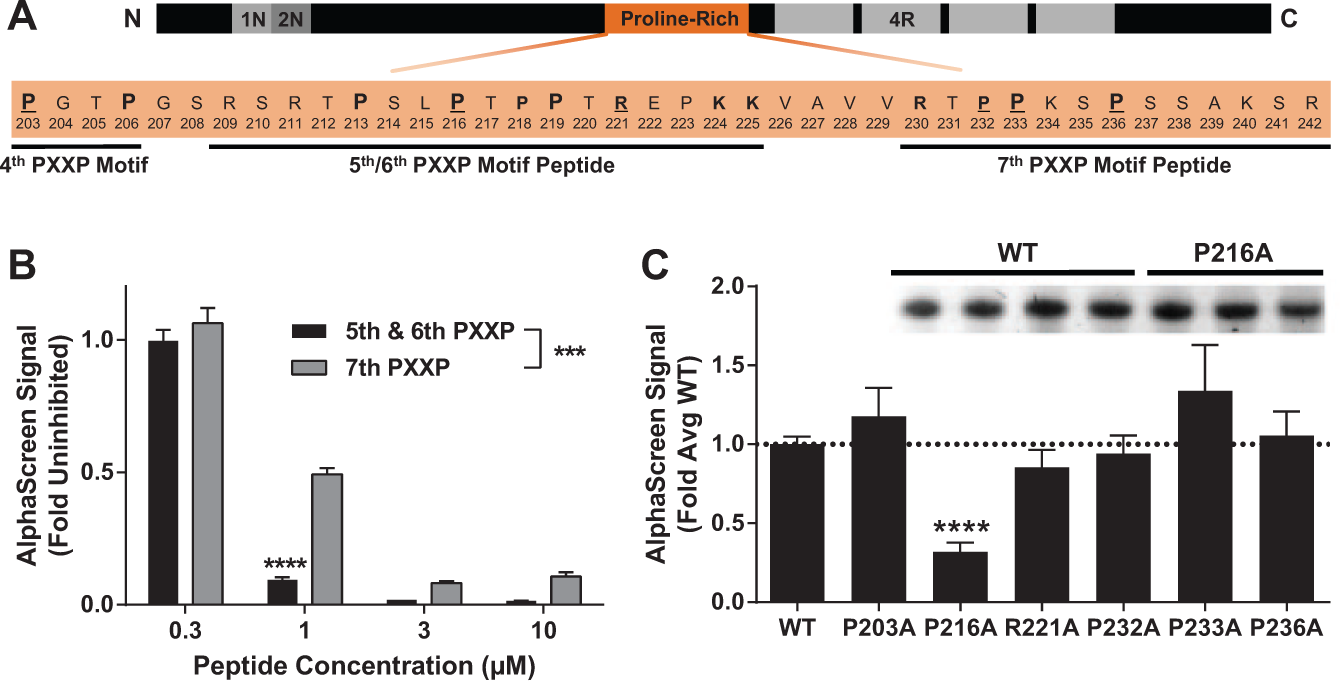
Fyn SH3 preferentially binds the fifth/sixth PXXP motifs in Tau. (
Bioluminescence Resonance Energy Transfer
Bioluminescence resonance energy transfer (BRET) was conducted with the Fyn SH3 domain fused on the C-terminus to click beetle green (CBG) luciferase 17 (E1461; Promega) and Tau tagged at each terminus with mKate2 18 (FP184; Evrogen, Moscow, Russia). Chinese hamster ovary (CHO) cells (85051005-1VL; Sigma, St. Louis, MO) were plated in 24-well opaque white plates (6005168; PerkinElmer) and transfected with Fugene HD (E2311; Promega) using the manufacturer’s instructions. Forty-eight hours later, fluorescence was read by excitation with a 530/25-nm filter and emission with a 645/40-nm filter on a Synergy2 (BioTek) to control for the concentration of Tau. Immediately after fluorescence measurement, D-luciferin (E1605; Promega) was added to a final concentration of 200 µM to each well. Two to 4 h later, after the signal had stabilized, plates were read with various wavelength filters in the far-red region (620/40, 645/40, 665/34, 680/30) and also with various filters in the green region (528/20, 540/45). We found that the relative signal separation between donor only and BRET increased with more red-shifted filters but that the noise did as well. We also observed a reduction in the amount of green light emitted with fusion of CBG and mKate2, consistent with efficient BRET. For this reason, we conducted initial optimization experiments reading at both red and green filters. However, for the BRET experiments to measure the Tau–Fyn SH3 interaction, measuring the signal at 645/40 nm alone and quantifying it versus the total amount of light emitted gave the most consistent results that maximized signal separation between donor-only and BRET conditions while minimizing noise.
Peptides
Peptides were produced at >95% purity and concentration was verified by mass spectrometry (Peptide 2.0, Chantilly, VA). Peptides used were
Statistics
We found that both AlphaScreen and BRET assays yielded normally distributed data. Therefore, we performed parametric one-way analysis of variance (ANOVA) tests with Dunnett’s post hoc test 20 for comparison to controls or multiple comparisons, correcting for multiple comparisons in each case. Where appropriate, we performed two-way ANOVA analysis with Sidak’s post hoc test 21 instead. All statistical tests were performed with Prism 6 (GraphPad Software, La Jolla, CA).
Results and Discussion
AlphaScreen Assay Development
To identify small-molecule Tau–Fyn SH3 interaction inhibitors, we developed an AlphaScreen assay amenable for HTS (
Potential Fyn SH3 Binding Sites in Tau
Before using this system for HTS, we tested the ability of the assay to report on known effectors of the Tau–Fyn SH3 interaction. One source of information on known effectors of the Tau–Fyn SH3 interaction comes from studies aimed at determining the residues in Tau important for Fyn binding. Deletion mutant studies have implicated both the fifth/sixth and the seventh PXXP motifs in mediating Tau–Fyn SH3 binding.1,7 However, more targeted peptide and alanine scan studies have implicated the fifth/sixth PXXP motifs, but not the seventh, as important for binding.15,22
One approach to identify Fyn SH3 binding sites in Tau is by competitive titration of peptides spanning these regions implicated in binding ( Fig. 2A indicates where implicated PXXP motifs lie in Tau). A Tat-tagged peptide spanning the fifth/sixth PXXP motifs provided more potent inhibition than a Tat-tagged peptide spanning the seventh ( Fig. 2B ). These data suggest that the fifth/sixth PXXP motif in Tau is a stronger binding site for Fyn than the seventh PXXP.
An alternative approach to identify Fyn SH3 binding sites in Tau is alanine scanning mutagenesis. Blocking the fifth/sixth PXXP motifs by mutating the central proline to alanine (P216A) reduced the Tau–Fyn interaction, but blocking the third/fourth PXXP motifs (P203A) or the seventh PXXP motif by mutating either P233 or P236 (or the preceding P232) did not ( Fig. 2C ). The effect of the P216A in the fifth/sixth PXXP motif on the Tau–Fyn interaction was not due to lower protein concentration ( Fig. 2C , inset), suggesting that the inhibition of the AlphaScreen signal was due to reduction in the affinity of P216A Tau for the Fyn SH3 domain rather than lower protein levels.
Data on the primary Tau binding site for Fyn have been somewhat discrepant. This is likely due in part to the different approaches that have been used to address the question, each of which has certain advantages and disadvantages. One possible reason for the discrepancy between prior studies addressing the roles of the fifth/sixth versus seventh PXXP could arise from the fact that polyproline helices are typically flanked by positive charges that participate in binding. 23 In some cases, deletion of the seventh PXXP motif could also delete key positive charges peripheral to the fifth/sixth PXXP motifs that play a role in binding. For example, K224 and K225 were deleted in a prior study that implicated the seventh PXXP, but these residues have been shown to facilitate the fifth/sixth PXXP motif interaction.1,15 Interaction of polyproline helices in Tau with SH3 domains is likely promiscuous, and different PXXP motifs might contribute depending on the conditions. However, it remains interesting that a single-point mutation (P216A) of the proline shared by the fifth/sixth PXXP motifs in Tau was sufficient for significant attenuation of the Tau–Fyn SH3 signal in AlphaScreen, but attenuation was not observed with P233A or P236A to block the seventh PXXP motif in Tau. This observation is consistent with a previous study that observed a drastic reduction in the amount of Tau pulled down with GST–Fyn SH3 with a P216A but not with a P233A mutation. 22 It is important to emphasize, however, that in both that study and in ours, there is some residual Tau–Fyn SH3 interaction signal even with P216A ( Fig. 2C ). This suggests that at least under some circumstances, Tau can bind Fyn through another PXXP motif or perhaps through a noncanonical interaction between Tau and the Fyn SH3 domain. Overall, the data favor the interpretation that the fifth/sixth PXXP motifs are the strongest site for Tau’s interaction with Fyn but that other PXXP motifs might contribute to a lesser extent, especially if interaction with the fifth/sixth PXXP motifs is blocked.
Effect of Tau Modifications
To further validate the AlphaScreen system, AD-related modifications were introduced to ask if these modifications alter the Tau–Fyn SH3 interaction signal. Because the Tau–Fyn SH3 interaction plays a role in the dendrites, we examined Tau pseudophosphorylated at sites that are preferentially phosphorylated in the dendrites24,25 to probe the effects of phosphorylation at these sites on the Tau–Fyn SH3 interaction. These sites include four “KXGS” sites in the microtubule-binding domains that are phosphorylated by microtubule affinity regulating kinase (MARK) and recognized by the 12E8 antibody (S262, S293, S324, S356) and three sites in the proline-rich domain recognized by the AT8 antibody (S199, S202, T205). The construct in which all seven of these sites are pseudophosphorylated is denoted as “Dendritic Tau” or D-Tau ( Fig. 3A ).
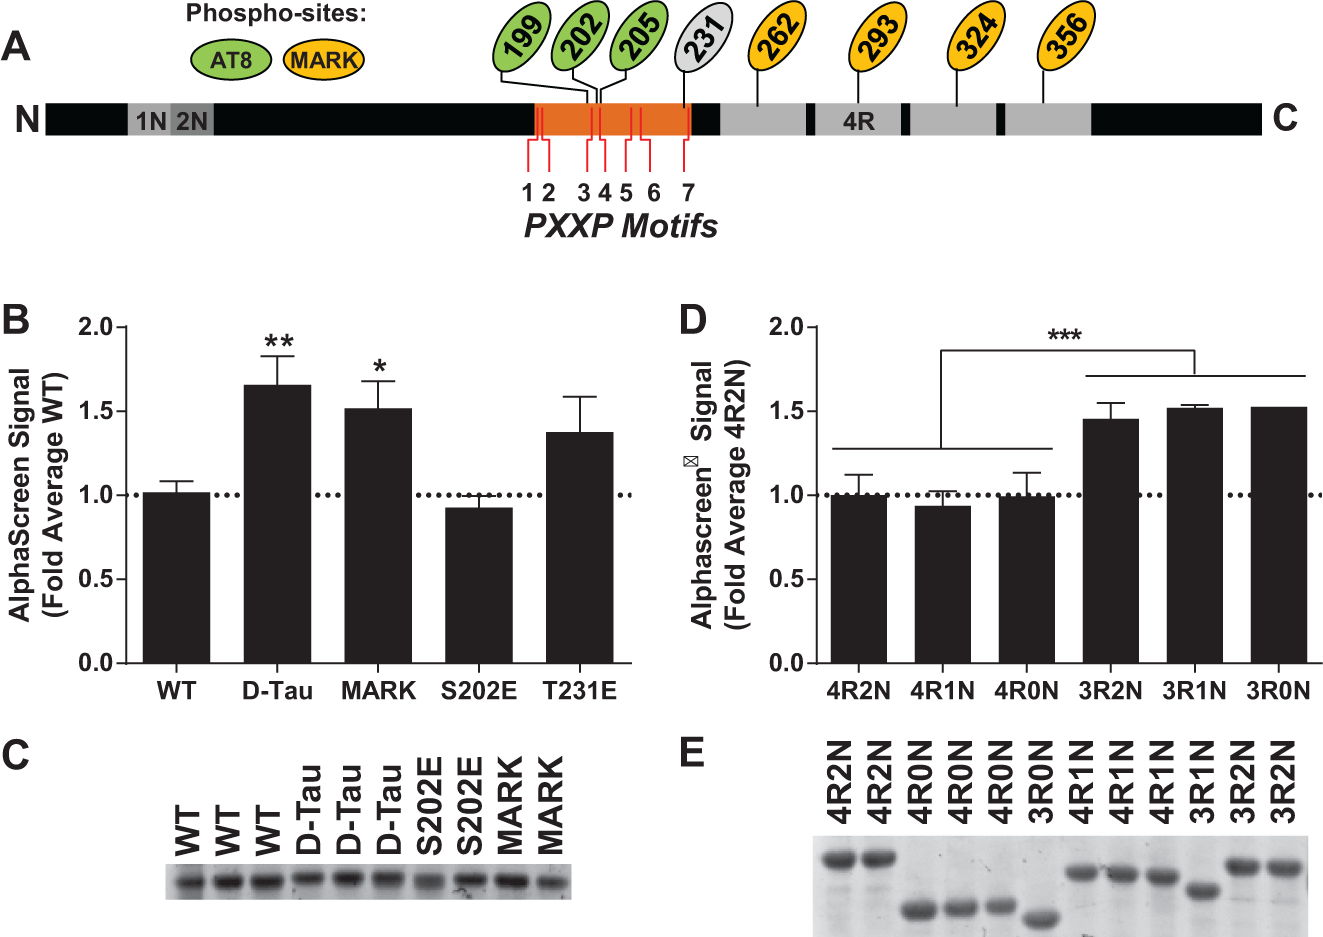
The AlphaScreen Tau–Fyn SH3 assay signal is increased by Alzheimer disease–associated modifications in Tau and by 3R Tau. (
Pseudophosphorylation at the MARK sites of Tau, alone or in combination with pseudophosphorylation at the AT8 epitope of Tau, increased the strength of the Tau–Fyn SH3 interaction in the AlphaScreen system ( Fig. 3B ). Pseudophosphorylation at S202, one of the residues in the AT8 epitope, or at T231 did not significantly change the interaction. Concentrations of the proteins used in the assay were not significantly different, indicating that the changes in AlphaScreen signal were due to increases in the affinity for Fyn of the MARK site pseudophosphorylated constructs rather than differences in protein levels ( Fig. 3C ).
Tau has six alternatively spliced isoforms expressed in the brain, with either three or four microtubule-binding repeats, denoted 3R or 4R, and zero, one, or two N-terminal inserts, denoted 0N/1N/2N; thus, Tau isoforms can be identified as, for example, 4R2N or 3R0N. 3R Tau is known to have a higher affinity for Fyn than for 4R Tau, 14 so we also evaluated all 3R and 4R isoforms of Tau to validate the AlphaScreen system. Corroborating published results, 3R isoforms of Tau showed significantly higher signal in the AlphaScreen system than did 4R isoforms ( Fig. 3D ). The differences were not explained by variation in protein concentration ( Fig. 3E ). Variation in the number of N-terminal inserts (0N, 1N, or 2N Tau) did not detectably affect the AlphaScreen signal ( Fig. 3D ).
Together, these results are consistent with the possibility that certain Tau modifications affect the tertiary structure of Tau, which could mediate differences in the affinity of Tau–Fyn SH3 interactions. Indeed, it has been shown that the AT8 Tau modification (one of the Tau modifications prevalent in the dendrites24,25) can affect the tertiary structure of Tau by disrupting intramolecular interactions in Tau. 26 Furthermore, a β-strand near the fifth to seventh PXXP motifs has been implicated in microtubule binding. 27 It is possible that β-strand–microtubule interactions, or possibly intramolecular β-strand interactions, normally could attenuate Tau–Fyn SH3 interactions through steric hindrance by occluding the fifth to seventh PXXP motifs. Disruption of these β-strand interactions (either by phosphorylation or, in 3R Tau, by the absence of a β-strand that is encoded in the exon unique to 4R Tau) may alter the tertiary structure of Tau, increasing exposure of the proline-rich domain and allowing for increased Tau–Fyn SH3 binding ( Fig. 4 ). In any case, the results indicate that Tau–Fyn SH3 interactions may be increased in disease not only through an increase in the total amount of Tau in the dendrites but also through increased affinity of Tau–Fyn SH3 interactions by phosphorylation of Tau.
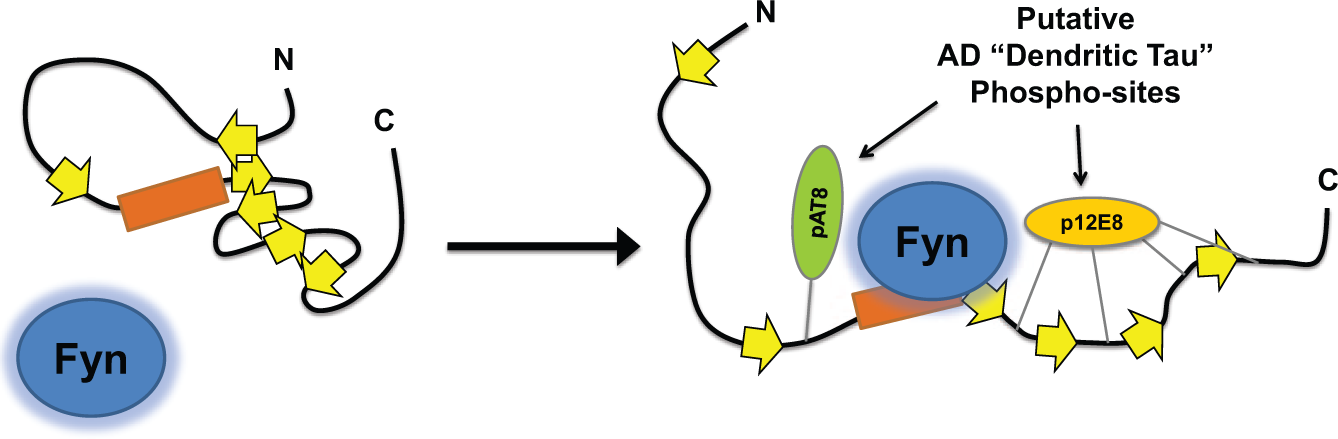
Model for how disruption of Tau tertiary structure may facilitate Tau–Fyn SH3 interactions. Location of β-strands are approximate based on a published map of Tau secondary structure elements. 36 Under normal conditions, interactions between β-strands may help maintain Tau in a conformation that reduces access to the proline-rich domain. Phosphorylation may disrupt interactions between β-strands (right), opening the paperclip conformation of Tau and facilitating Fyn binding to the proline-rich domain.
HTS Results
After validating the AlphaScreen assay, HTS was conducted to identify small-molecule inhibitors of the Tau–Fyn SH3 interaction. For HTS, we used the D-Tau construct (full-length human Tau pseudophosphorylated at the seven sites found in dendritic Tau; Fig. 3A ), since this represents the putative form of Tau found in the dendrites, where the pathogenic Tau–Fyn interaction is believed to occur.
The Z′ score
19
was monitored by plate, with a mean ± standard deviation (SD) of 0.84 ± 0.05 (
BRET for Live-Cell Measurement of Tau–Fyn SH3 Interactions
These 39 verified hits from HTS were further evaluated in a cell-based BRET assay that we developed using a novel BRET pair: CBG luciferase as the donor and the far-red fluorescent protein mKate2 as the acceptor (
The BRET assay consists of the Fyn SH3 domain tagged with CBG as the donor and Tau tagged with the far-red fluorescent protein mKate2 as the acceptor. When the Fyn SH3 domain interacts with Tau, it brings the donor luciferase in close enough proximity to the acceptor fluorescent proteins to allow for energy transfer, quantified by a shift in the amount of light emitted in the red portion of the spectrum. The combination of the high amount of light emitted by CBG 28 along with the low noise of the far-red signal from mKate2 allowed for live-cell quantitation of the Tau–Fyn SH3 interaction.
BRET was not detectable with coexpression of mKate2-actin and Fyn-CBG, indicating that there was no nonspecific BRET signal between noninteracting proteins (actin and Fyn) ( Fig. 5A ). However, covalent fusion of the two fluorophores, mKate2-CBG, generated a robust BRET signal in live cells ( Fig. 5A ). Next, we tested CBG coupled to Fyn SH3 with mKate2 coupled to either the N-terminus or C-terminus of Tau (mKate2-Tau and Tau-mKate2). A significant BRET signal was observed with either form of tagged Tau, and the signal could be inhibited with a Tat-tagged (and thus cell-permeable) peptide inhibitor spanning the seventh PXXP domain ( Fig. 5B ). To maximize signal, Tau was tagged at both termini with mKate2 for the final embodiment of the assay ( Fig. 5C ).
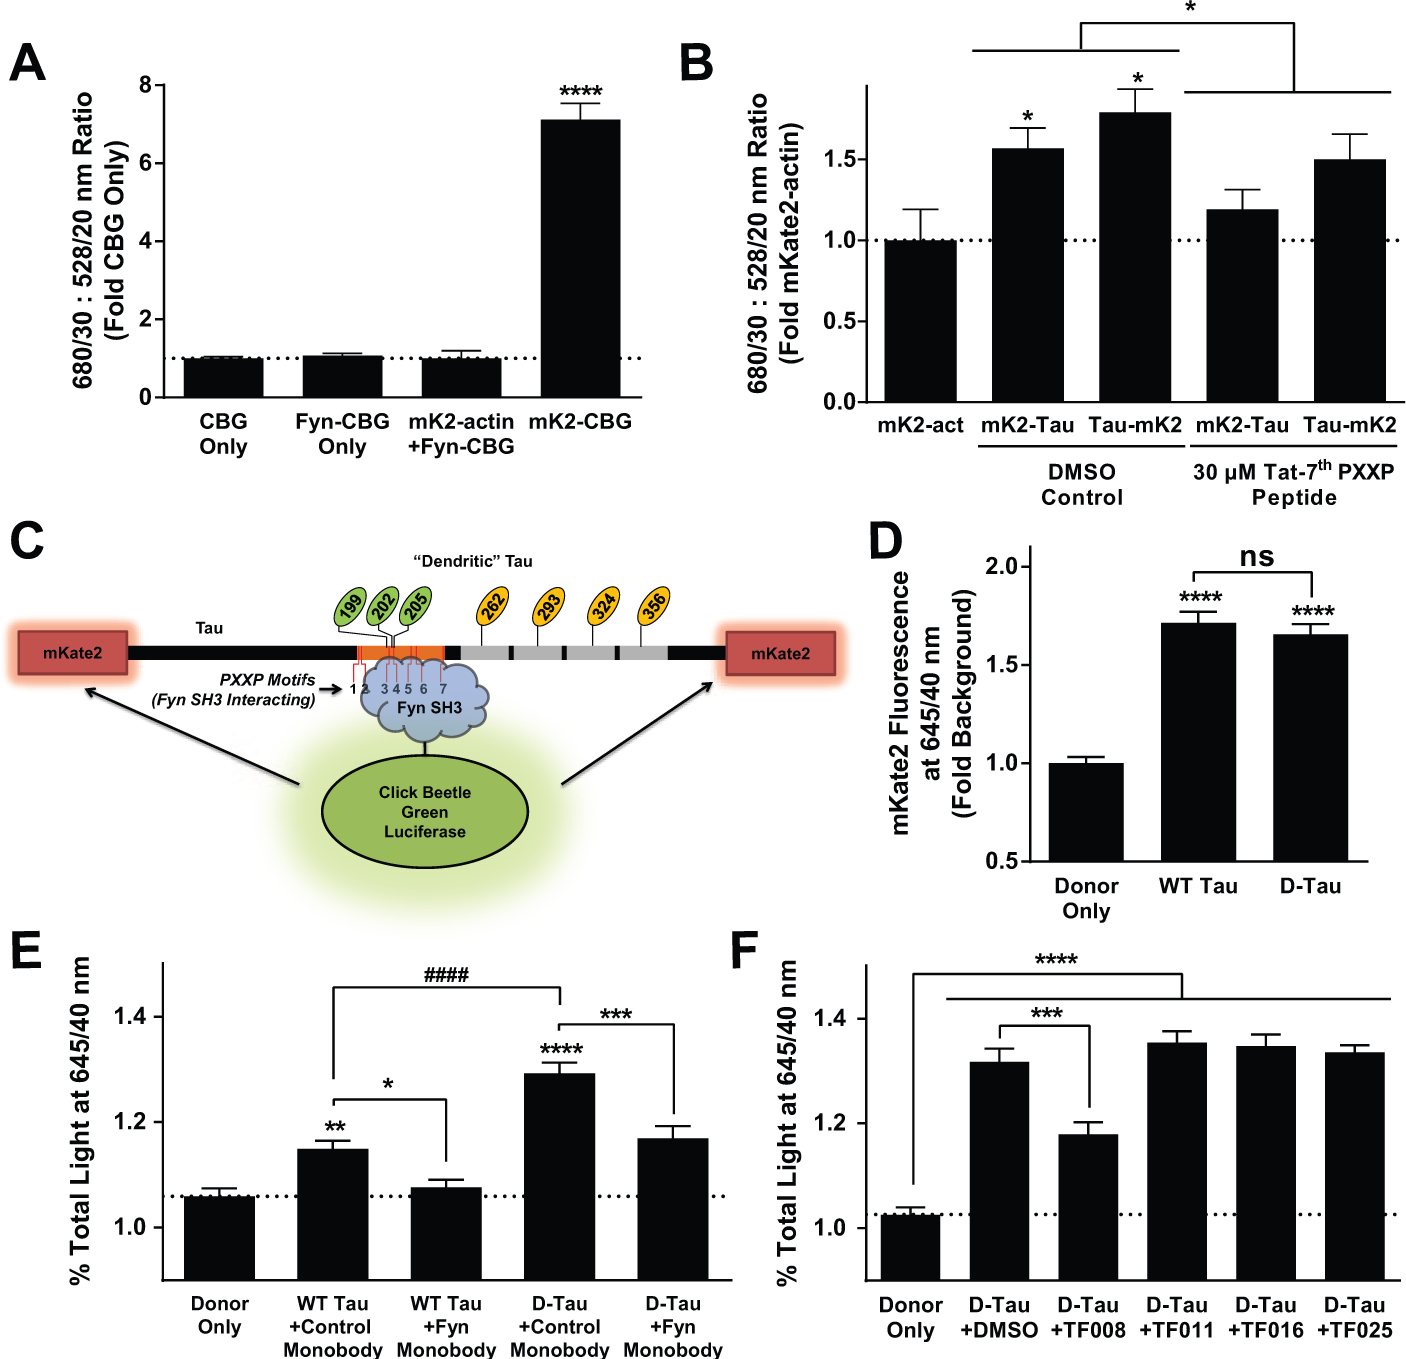
A bioluminescence resonance energy transfer (BRET) assay allows measuring the Tau–Fyn interaction in living cells. (
Before evaluating compounds for activity using this assay, we first asked if the BRET assay could detect the increased affinity induced by mimicking dendritic phosphorylation sites in Tau that we had observed in AlphaScreen ( Fig. 3B ). To address this question, we compared Tau pseudophosphorylated at the MARK sites and AT8 epitope (D-Tau) to unmodified Tau as we did with the AlphaScreen assay. To ensure that differences in protein expression between WT and D-Tau did not confound the results, we measured the amount of mKate2 fluorescence prior to addition of the luciferase substrate and verified that the fluorescent signals for unmodified Tau and D-Tau were not different ( Fig 5D ). We then proceeded to measure BRET. WT Tau showed a small but significant signal in BRET ( Fig. 5E ), consistent with the published observation that unmodified Tau has a low affinity for Fyn. 14 The BRET signal was indeed potentiated when Tau was pseudophosphorylated at MARK and 12E8 sites ( Fig. 5E ), consistent with the AlphaScreen findings.
To further validate this assay, we also cotransfected with a “monobody” (clone G9) that had been selected by phage display to bind selectively to the Fyn SH3 domain. 29 This Fyn monobody has a KD of 166 nM for Fyn SH3 and competitively inhibits proline-rich–Fyn SH3 interactions. 29 In the BRET assay, the Fyn monobody completely inhibited the WT Tau–Fyn SH3 interaction ( Fig. 5E ). Interestingly, it only partially inhibited the D-Tau–Fyn SH3 interaction ( Fig. 5E ). There are at least two possible explanations for why this tool inhibitor achieved only partial inhibition with D-Tau: (1) the Fyn monobody and D-Tau may have similar KD for the Fyn SH3 interaction, consistent with the idea that D-Tau modifications increase the affinity of Tau for Fyn SH3 ( Figs. 3B and 5E ). Thus, if the proteins are expressed at approximately equal levels in cells, one may expect that the signal may be attenuated by about half, as observed. (2) D-Tau may unmask an alternate mode of Tau interaction with the Fyn SH3 domain. We do not have any data to refute this possibility, which is intriguing because it raises the possibility that inhibitors could be developed that target pathogenic Tau–Fyn SH3 interactions while leaving endogenous interactions intact.
Evaluation of Hits with BRET
Of the 39 compounds evaluated, seven showed significant activity in the BRET assay (representative example, compound TF008, shown in Fig. 5F ). Although this hit rate may seem low, the Fyn monobody inhibitor, which has an excellent KD for Fyn SH3 (166 nM), 29 inhibited the D-Tau–Fyn SH3 interaction to a similar degree. Therefore, the fact that several compounds with distinct chemotypes show activity in this stringent assay that requires cell permeability, resistance to cellular degradation, nontoxicity, and high potency is very promising. Furthermore, performance in this stringent assay helped to prioritize the pool of candidate compounds for further counterscreening and evaluation in animal models of AD. Finally, it is possible that other hits may be optimized for good cell-based performance with medicinal chemistry effort.
Properties of Lead Compounds
In summary, we developed and validated two assays to measure the Tau–Fyn SH3 interaction and used these assays in a screening campaign to identify top hits that can inhibit this interaction. Many of the top hits are low molecular weight and have a low polar surface area, making them desirable candidates for further development ( Fig. 6A ). Furthermore, seven of the top hits have already shown activity in the stringent cell-based BRET assay, even before medicinal chemistry optimization ( Fig. 6A ). Thirteen of the top hits have particularly desirable chemical properties and low toxicity, including five that have shown activity in the BRET assay. Of these 13, four have polar surface areas below 90 Å2, which is an indicator of good potential for central nervous system penetration. 30 Therefore, we have identified several promising hits, plus others that may be improved by medicinal chemistry optimization.
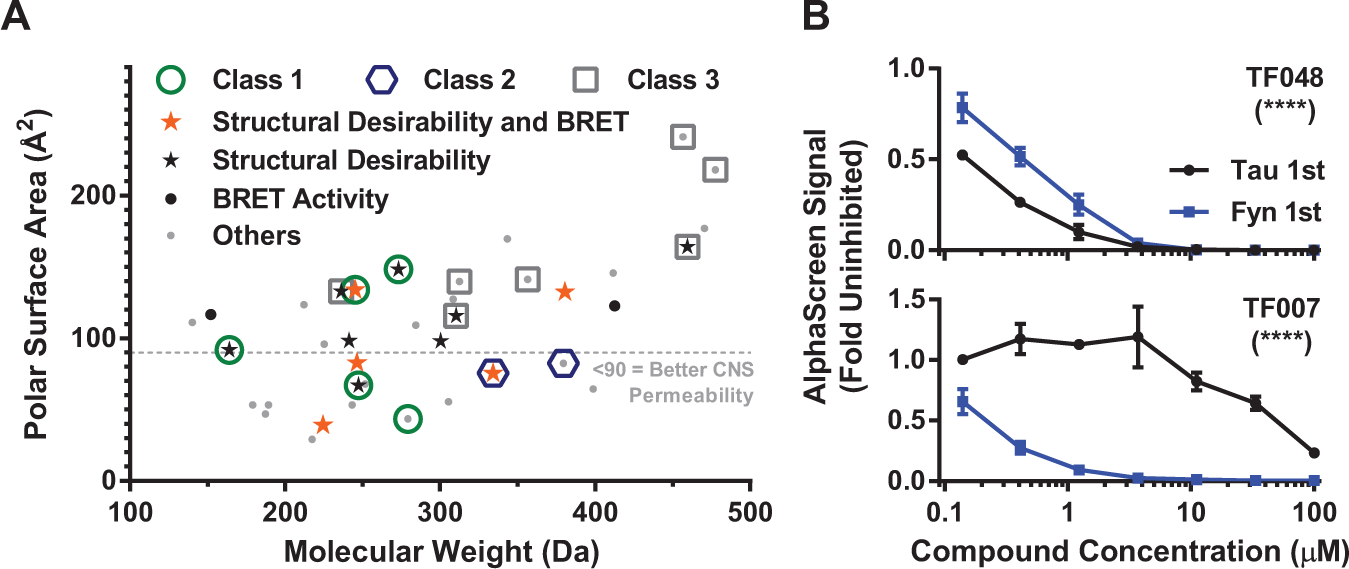
Lead compounds show desirable properties. (
Interestingly, a preincubation assay reveals that some of the hit compounds appear to bind to the Fyn SH3 domain, while others may bind to Tau ( Fig. 6B ). This is intriguing, because Tau is in complex with other SH3 domain–containing proteins in mice, including the synaptic scaffolding protein PSD-95 and the late-onset Alzheimer disease risk gene BIN1.1,31 Therefore, a small molecule targeting the Tau side of the Tau–Fyn SH3 interaction has the potential to inhibit these other interactions as well, which may improve the therapeutic potential if Tau aberrantly interacts with multiple SH3 domain–containing proteins in disease.
We plan to move these hits forward into lead development, primary neuron and animal models of AD, and more in-depth specificity and liability screening. Furthermore, three chemical classes have been identified in the top hits. Classes 1 and 2 have members with desirable properties and/or BRET activity with low polar surface area, making these classes particularly desirable for medicinal chemistry follow-up. Class 3 may provide promise with medicinal chemistry effort as well, and many singletons that do not have obvious chemical similarity with other compounds may also provide starting points for medicinal chemistry modification.
Implications for Targeting Protein-Protein Interactions with Small Molecules
Inhibition of protein-protein interactions has been discussed as a rich source of potential drug targets. 32 Here we have presented evidence that proline-rich–SH3 interactions can be targeted with small molecules. Furthermore, we identified several structural classes, suggesting that we may have identified inhibitors of multiple contact points between Tau’s polyproline helix and Fyn’s SH3 domain. Indeed, proline-rich–SH3 interactions have been shown to consist of three contacts with SH3 domains (two from prolines and one from flanking positive charges contacting an acidic region of SH3 domains), 23 so this is certainly a possibility. The fact that proline-rich–SH3 interactions have multiple contact points may seem to make targeting proline-rich–SH3 interactions more difficult, but our data in combination with other studies targeting this interaction class with small molecules show that it is indeed feasible to target either polyproline helices 33 or SH3 domains 34 with small molecules. Finally, the presence of multiple potential target sites supports the possibility that high specificity between related proteins can be achieved. This is consistent with published studies showing that it is possible to develop peptoid 35 or monobody 29 ligands that are highly selective for the Fyn SH3 domain over related Src-family kinase SH3 domains. This has implications not only for the Tau–Fyn SH3 interaction, but also for targeting other proline-rich–SH3 interactions that may be involved in disease pathways.
In conclusion, we provide primary evidence that the Tau–Fyn interaction can be targeted with small molecules, which presents a new opportunity for developing Tau-directed therapies for neurodegenerative disease.
Footnotes
Acknowledgements
We thank Andy West for various plasmids, Alecia Gross and Scott Wilson for the use of equipment, and members of the Roberson laboratory for critical reading of the manuscript. We also thank Maaike Everts for facilitating collaboration between the University of Alabama at Birmingham and Southern Research Institute through the Alabama Drug Discovery Alliance.
Declaration of Conflicting Interests
The authors declared the following potential conflicts of interest with respect to the research, authorship, and/or publication of this article: E.D.R. is an owner of intellectual property related to Tau.
Funding
The authors disclosed receipt of the following financial support for the research, authorship, and/or publication of this article: This work was supported by NIH grants R01NS075487, T32NS061788, UL1TR00165, P30NS057098, P30NS047466, and P30AI027767; the Alabama Drug Discovery Alliance; and the Howard Hughes Medical Institute through the Med into Grad Initiative, HHMI-56006768.
References
Supplementary Material
Please find the following supplemental material available below.
For Open Access articles published under a Creative Commons License, all supplemental material carries the same license as the article it is associated with.
For non-Open Access articles published, all supplemental material carries a non-exclusive license, and permission requests for re-use of supplemental material or any part of supplemental material shall be sent directly to the copyright owner as specified in the copyright notice associated with the article.