
Abstract
Echinomycin, a member of the quinoxaline family of antibiotics, is known to be a small-molecule inhibitor of hypoxia inducible factor–1 (HIF-1) DNA binding activity. Recently, it has been shown to suppress mammalian target of rapamycin (mTOR) signaling and growth in leukemia cell lines. In this study, we investigated whether echinomycin interacts with the FKBP12 protein. Molecular docking was used, and the predicted binding energy was −10.61 kcal/mol. Moreover, surface plasmon resonance imaging and fluorescence quenching techniques were used to validate this interaction. Echinomycin binds to FKBP12 with a strong binding affinity comparable with rapamycin. Furthermore, the echinomycin-FKBP12 complex has been shown to affect calcineurin activity when tested in a calcineurin phosphatase inhibition assay. All of these studies have shown that echinomycin may have a double impact on HIF signaling by direct inhibition and through mTOR.
Introduction
Echinomycin is a member of the quinoxaline family of antibiotics previously identified as a potential anticancer drug that binds strongly to double-stranded DNA. 1 Extensive research has been done on its potency in different biomedical areas. It has been shown to inhibit DNA replication, which affects embryonic development in vertebrates. 2 It has also been shown to strongly inhibit the binding of hypoxia inducible factor–1α (HIF-1α) to its DNA binding site on several promoters. HIF is a DNA-binding transcription factor that transactivates various genes to allow cell adaptation to a hypoxic condition. 3 HIF mediates cell signaling and plays an important role in the maintenance of both normal hematopoietic stem cells and leukemia stem cells under hypoxic environments such as bone marrow niches.4,5 It has been reported that HIF is up-regulated by mammalian target of rapamycin (mTOR) signaling. 6 Recently, Yonekura et al. 7 reported that echinomycin-mediated inhibition of HIF impaired leukemia cell growth in association with reduced notch signaling, down-regulation of phosphatase and tensin homologue, and suppression of mTOR signaling. Similarly to echinomycin, rapamycin has also been shown to inhibit the growth of lymphoid and myeloid leukemia cell lines and down-regulates the NOTCH1 and NOTCH2 signaling in TMD7 cell lines. 8 Rapamycin generally suppresses the activity of mTOR by binding to the FK506 binding protein (FKBP). 9 FKBP is one of the two major immunophilins that possesses immunosuppressive and PPIase activity. 10 A number of protein complexes containing FKBP12 have been determined, such as FKBP12-FK506-calcineurin,11,12 FKBP12-rapamycin-FRAB-binding domain, 13 and FKBP12-TGFI-β cytoplasmic domain. 14 All of these studies provide a hint of cross-talk between the mechanism of mTOR suppression by rapamycin and echinomycin. To examine this, we set up a docking model to check echinomycin binding with FKBP12. Surprisingly, we were able to show a good fit for a strong interaction. To validate these docking results, the binding of echinomycin-FKBP12 was measured by surface plasmon resonance imaging (SPRi). We further validated these results using a fluorescence quenching assay, confirming that the strong interaction is comparable to rapamycin. Interestingly, unlike FK506-FKBP12, the echinomycin-FKBP12 complex has a minor inhibiting effect on the phosphatase activity of calcineurin.
Materials and Methods
Reagents
Unless otherwise noted, material and solvents were obtained from commercial suppliers and used without further purification: gold-coated slides (Plexera, Woodinville, WA); SH-(PEG)n-COOH (M.W. 1000) and SH-(PEG)n-OH (M.W. 346; Shanghai Yan Yi Biotech, Shanghai, China); 1-(3-dimethylaminopropyl)-3-ethylcarbodiimide hydrochloride (EDC-HCl) and N-hydroxy succinimide (NHS), DMAP (N,N-dimethyl amino pyridine; Aladdin Chemistry, Shanghai, China); ethanolamine, DMSO, ethanol, DMF, and ACN (Sigma-Aldrich, St. Louis, MO). The photo-cross-linker was prepared according to a previously described method. 15 The recombinant FKBP12 protein was purchased from Sino Biological Inc. (Beijing, China).
Echinomycin, rapamycin, and FK506 were kindly donated by Professor Lixin Zhang from the Institute of Microbiology, Beijing, China.
Docking Studies
The crystal structure of FKBP12-rapamycin-FRB ternary complex (PDB ID: 2FAP, 2.20 Å) and the structure of echinomycin-DNA complex (PDB ID: 3GO3, 1.10 Å) were obtained from Protein Data Bank.16,17 The structure of FKBP12 and echinomycin were extracted from the crystal structures mentioned above. The docking models were obtained using AutoDock 4.2 software 18 and with the aid of the AutoDockTools. The flexibility of FKBP12 was taken into consideration for an accurate docking. Tyr26, Phe36, Phe46, Trp59, Tyr82, and Phe99 located in the active site were chosen as flex residues. FKBP12 and echinomycin were added to a Gasteiger charge, with the box to a grid number set to 70 × 66 × 72 Å3, with a grid space of 0.375 Å in each dimension, and the Lamarckian genetic algorithm was used for the conformation search. One hundred docking conformations for echinomycin were generated, and the maximum of evaluations was set to 2.5 × 10⁶ to explore the conformational space. We used default values for the remaining parameters of AutoDock 4.2. The final conformations were separated into clusters according to RMSD tolerance of 2 Å. The biggest cluster and the best binding conformation were selected for interaction analysis.
SPRi Assay
We used SPRi to measure the echinomycin-FKBP12 interaction. A photo-cross-linking technique was used to immobilize the echinomycin onto standard Plexera Nanocapture sensor chips. The chips were self-assembled with (SH-PEG-COOH: SH-PEG-OH) in a 1:10 ratio, respectively, and functionalized with diazarine photo-cross-linker after activation with EDC/NHS (0.4/0.2 M). The printed area was subsequently blocked by 1 M ethanolamine (pH 8.4) to prevent nonspecific adsorption of proteins on the surface. Rapamycin and echinomycin (10 mM in 100% DMSO) were spotted in multiplex (10 spots) on sensor chips by a commercial Genetix spotter. After extensively washing the chips with DMSO, DMF, ACN, ethanol, and Milli-Q water for 30 min, respectively, at room temperature, they were mounted on a KX5 Plexera SPR instrument, and FKBP12 protein was flowed as analyte at four different concentrations. The average results from 10 different spots were used to plot standard deviations. The average kinetics of the complexes was obtained from a 1:1 Langmuir model of kinetics fitting from four different concentrations. All of the data analysis was done using the PLEXEA data analysis module and the ORIGINLab software. 19
Fluorescence Quenching
FKBP12 can fluoresce at 310 to 340 nm when irradiated with ultraviolet light at an excitation wavelength of 295 nm. 20 After binding of the inhibitor to the binding pocket, the polar environment around Trp59 changes, resulting in fluorescence quenching. To measure this, FKBP12 (20 µM in 20 mM HEPES, 0.1 M NaCl, 5% manitol and 5% trehalose) was prepared to measure initial fluorescence at 25 °C. Increasing concentrations of echinomycin and rapamycin were added to make a quenching titration. The average results from three different experiments were normalized and plotted against inhibitor concentration by using the ORIGINLab software. All of the fluorescence experiments were done on a Perkin Elmer LS5 instrument.
Calcineurin Phosphatase Assay
The calcineurin phosphatase assay was performed under the same conditions as previously described. 21 Increasing inhibitory concentrations of the FKBP12-FK506 and FKBP12-echinomycin complexes were used. The assay was performed in the coupled enzyme system containing 50 mM MOPS, pH 7.0, 100 mM NaCl, 0.1 mM EDTA, 50 µM MESG, 0.1 mg/mL PNPase, 1 mM MnCl2, 1 mM CaCl2, 0.5 mg/mL BSA, 1 mM DTT, and 5 µM pRII peptides. This coupled assay uses PNPase and its chromogenic substrate MESG to monitor the production of inorganic phosphate. The enzyme, human calcineurin α 1-388 (20 nM), was preincubated with reaction mixture for 15 min. Then, the trans-inhibition reaction was initialized by adding 5 µM pRII peptide. All experiments were carried out at 25 °C in 1.8 mL reaction mixtures, and the continuous absorbance changes were recorded using a PerkinElmer LAMBDA 45 spectrophotometer equipped with a magnetic stirrer in the cuvette holder. The quantification of inorganic phosphate produced was monitored at 360 nm with the extinction coefficient of 11,200 M−1 cm−1. The initial rates were determined from the linear slope of the progress curves obtained.
Results
Identification of Echinomycin as a Potential FKBP12 Binder by Docking Model
Computational evaluation of ligand-receptor binding via docking is a well-established approach in structure-based drug design. This technique has been applied frequently in screening for molecules with potential therapeutic interest. 22 The free binding energy of echinomycin toward FKBP12 was evaluated by using the advanced docking program 4.2 and compared with previously reported binding energies against rapamycin and FK506. One hundred different conformations were generated to choose the final model. A three-dimensional structure of echinomycin-FKBP12 binding complex is shown in Figure 1A (ribbon-shaped structure showing interactions details with relative amino acids) and Figure 1B (representing the solid complex). From the docking model, two types of interactions were found in between echinomycin and certain amino acids of the binding pocket of FKBP12. In particular, Arg42 and Phe46 have the π-π interaction with one quinoxaline ring of echinomycin. Trp59 and Phe99 have the π-π interaction with another quinoxaline ring and with Val55, Leu74, Ile76, and Val101 to form a hydrophobic pocket. Two hydrogen bonds (1Le76 and TYR82), which represent a strong binding interaction, were also found ( Fig. 1C ). The predicted binding energy was −10.61 kcal/mol, and the predicted inhibition constant was 16.7 nM. Interestingly, rapamycin and echinomycin share five mutual amino acids—Phe46, Trp59, Val55, l1e76, and TYR82—for binding contacts in the binding pocket of the FKBP12 protein. Echinomycin possesses a binding energy that falls in between rapamycin and FK506, which are the best binding candidates of FKBP12. 10 By taking binding energy and molecular weight into account, which is more or less similar to rapamycin, echinomycin would be one of the best drug candidates and can provide the basis for further designing and synthesis of a new series of potential inhibitors against FKBP12. The chemical structure of echinomycin is shown in Figure 1D . To validate this binding model, two different assays were carried out.
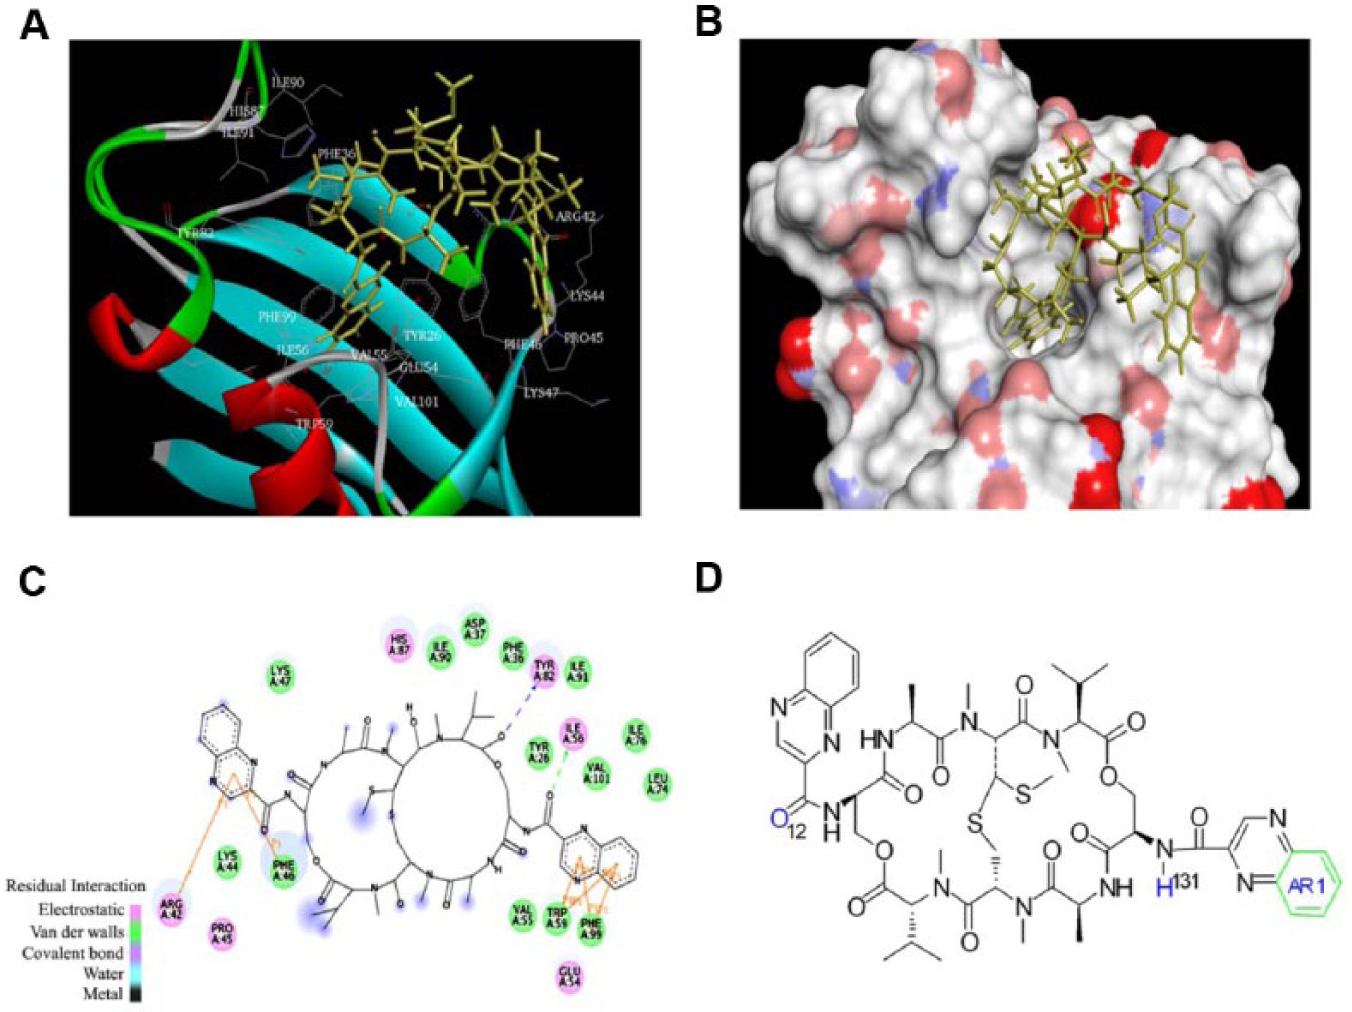
Docking model results of the echinomycin-FKBP12 complex. (
Validation and Real-Time Kinetics Analysis by SPRi Assay
The SPRi assay was considered because it has emerged as a powerful label-free detection system for the determination of the biomolecular interaction along with their kinetic parameters. 23 Echinomycin and rapamycin (10 mM) were printed in multiple spots on a PEG photo-cross-linked surface. A photo-cross-linked method was chosen to covalently immobilize the echinomycin because it contains multiple chemical groups, available for carbene attack, which allows it to be displayed in multiple orientations to maximize the binding interaction. Four different concentrations of FKBP12 (200, 400, 600, and 800 nM) were injected in ascending order to measure the accurate kinetics in a 1:1 Langmuir model. Strong SPRi signal responses ( Fig. 2A ) were observed by flowing the FKBP12 samples over immobilized echinomycin. These signals were comparable to the rapamycin spots ( Fig. 2B ). In solution, rapamycin has been shown to bind with a KD of approximately 0.2 nM. 24 It is likely that the photo-cross-linking method blocks or hinders some of the molecules from interacting with the target protein. This could explain in part that the dissociation constant (KD) obtained using our SPRi method was 19 ± 3.1 nM. Using the same methodology, we estimated that the KD for echinomycin was 33.6 ± 3.8 nM, which seems to be in the same range as rapamycin under these conditions ( Table 1 ). Although the estimated KDs using SPRi could be significantly different from activity base assays or binding assays in solution, we can clearly see these strong interactions with randomly immobilized compounds. To further confirm the specific binding event, a competition assay based on SPR imaging was performed. We used the FK506 as a competitive inhibitor for the immobilized echinomycin and rapamycin. FKBP12 was either injected alone or in a mixture with two concentrations of the FK506 (5% DMSO; FKBP12+FK506_100 nM and FKBP12+FK506_200 nM). In each of the three injections ( Fig. 2C ), the concentrations of FKBP12 were constant (200 nM). The mixture containing 100 nM FK506 shows a dramatic reduction in the response signals. The binding signals were almost negligible when the concentration of FK506 was increased to 200 nM. These data strongly support that the signals generated from SPRi were specific.
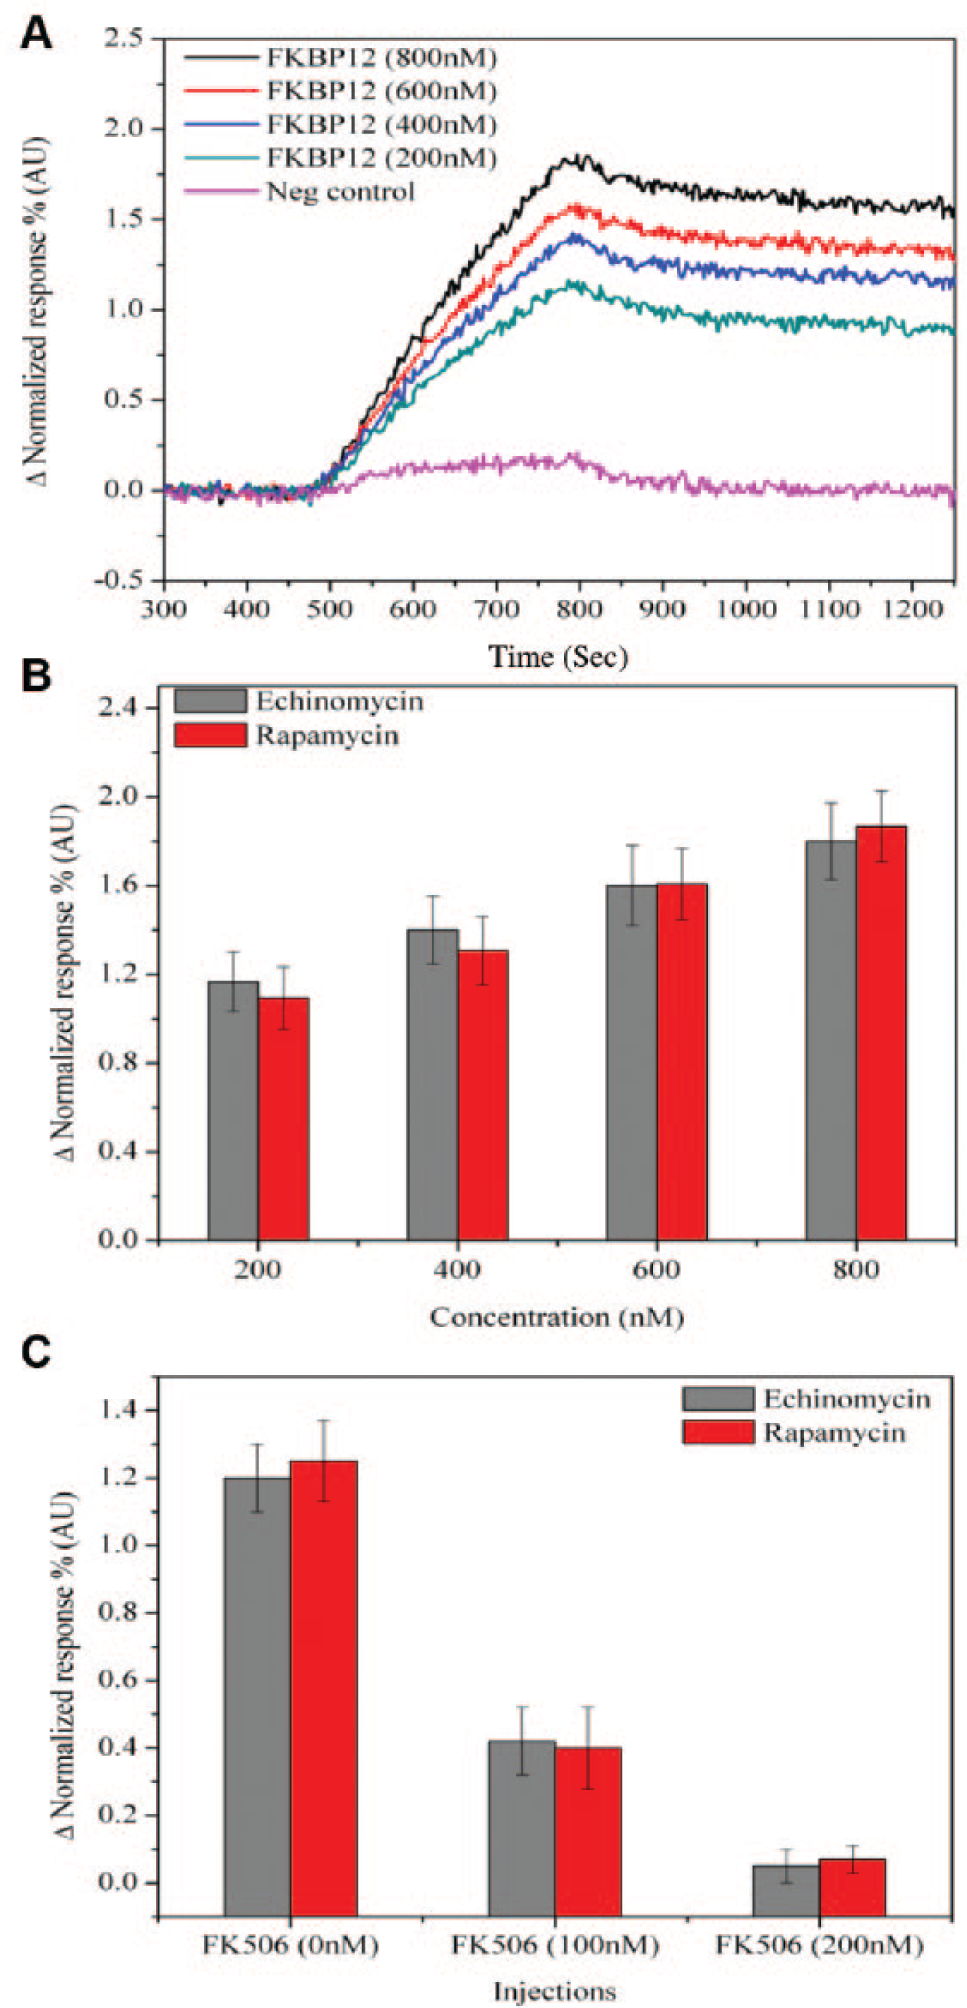
Signal response obtained from the surface plasmon resonance imaging experiments. (
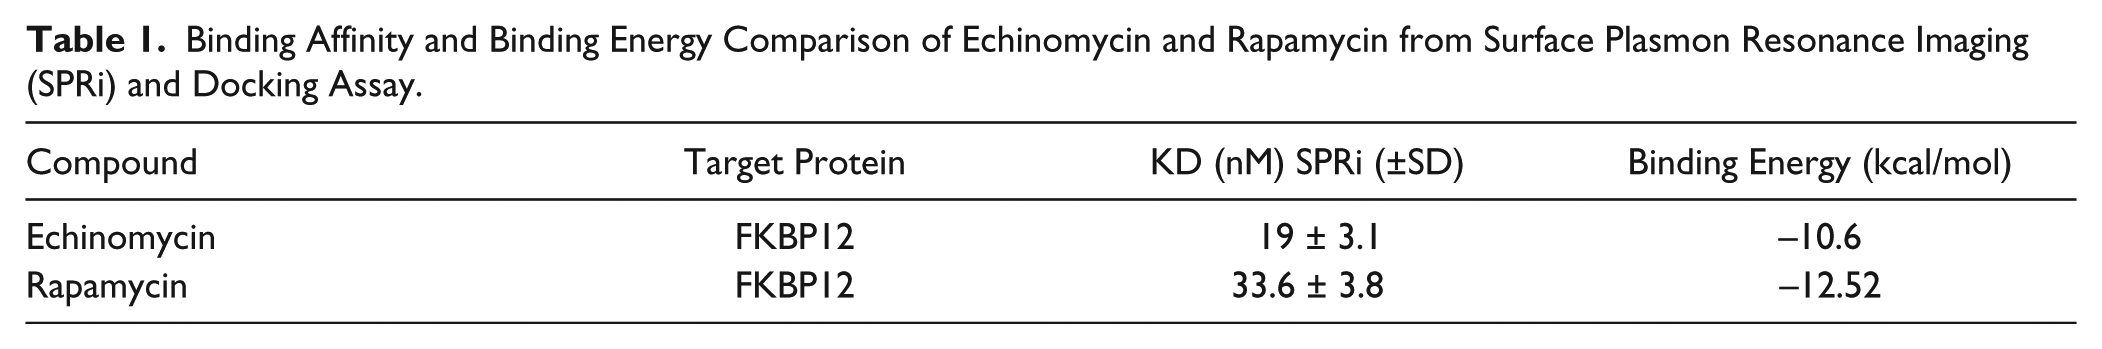
Binding Affinity and Binding Energy Comparison of Echinomycin and Rapamycin from Surface Plasmon Resonance Imaging (SPRi) and Docking Assay.
Fluorescence Quenching by Echinomycin
To further support that the binding of echinomycin to FKBP12 was equivalent to rapamycin, we decided to use a fluorescence quenching assay. A six series dilution (30–1000 nM) of rapamycin and echinomycin was titrated at 330 nm wavelength. The addition of both molecules led to fluorescence quenching ( Fig. 3A ) of the buried tryptophan residue (in particular, Trp59). The quenching of Trp59 confirmed the docking model results in which Trp59 seems to have π-π interaction with one of the two quinoxaline rings. The change in normalized fluorescence intensity (%age) using quenching was plotted against different concentrations of echinomycin and rapamycin. It is noted that the effect was not caused by a change in the environment of the Trp side chains given that their emission wavelength maximum (max) remained unchanged. Because of the systematic error of concentration measurements using this assay, it is hard to calculate an accurate binding constant. 10 Nevertheless, it is clear that the quenching behavior of echinomycin is about twofold lower than rapamycin, which correlates well with our SPRi results. Quenching of FKBP12 fluorescence further supports the strong binding of echinomycin to its specific binding pocket.
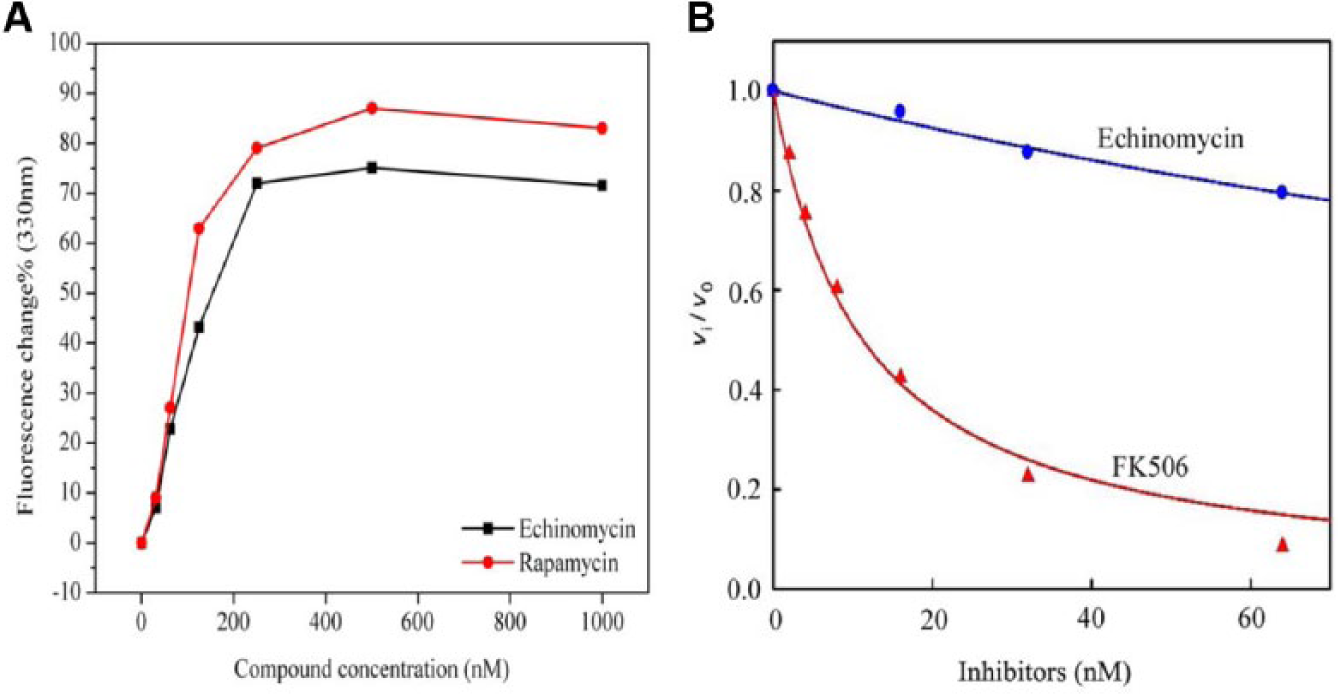
Graph showing fluorescence quenching of FKBP12 and inhibition of calcineurin activity. (
Echinomycin-FKBP12 Complex Weakly Inhibits Calcineurin Phosphatase Activity
The immunosuppressant effects of FK506 derive from the binding of the FK506-FKBP12 complex to the calcium-activated phosphatase, calcineurin, and the resulting inhibition of its activity. Although rapamycin binds to FKBP12, the complex does not interact with calcineurin. Instead, rapamycin- FKBP12 binds to mTOR as well as a recently identified protein designated rapamycin and FKBP12 target-1 (RAFT1) in rats 25 and FKBP-rapamycin-associated protein (FRAP) in humans. 26 As shown in Figure 3B , the FKBP12-FK506 complex was a potent inhibitor of calcineurin when the pRII peptide was used as a substrate, whereas the FKBP12-echinomycin complex was much weaker. FK506 mediates calcineurin phosphatase inhibition that follows by forming a composite effectors surface with structural elements from FKBP12, which then recognize and bind tightly to calcineurin. It is the bound FKBP12 that physically blocks access to pRII to the calcineurin phosphatase active site. Echinomycin failed to inhibit calcineurin completely because it was not able to bind strongly to calcineurin as FK506, despite binding FKBP12 tightly.
Discussion
It has previously been reported that both echinomycin and rapamycin affect the HIF-1 via different mechanisms. Rapamycin inhibits the proliferation of hemangioma endothelial cells by reducing HIF-1–dependent expression of vascular endothelial growth factor. 27 On the other hand, echinomycin is as potent inhibitor of HIF-1 DNA binding activity. 28 Echinomycin binds to the DNA sequences 50-ACGT-30 and 50-TCGT-30 and thus will prevent HIF-1 from binding the core sequences 50-ACGTG-30 or 50- GCGTG-30, the latter of which is not a high-affinity site for echinomycin binding. 29 Recently, both rapamycin and echinomycin were shown to suppress the growth of several leukemia cell lines and mTOR signaling, which is constitutively activated in these cell lines. Echinomycin has also been shown to affect the HIF-associated signaling pathways through the suppression of expression of certain proteins associated with AKT-mTOR signaling cascades. 7 Rapamycin-FKBP12-mTOR complex suppressed the HIF signaling through the P70-S6K1 kinase enzyme. This whole signaling process 30 is shown in Figure 4 . The studies mentioned above have shown that echinomycin may have a double impact on HIF signaling by direct inhibition and through mTOR. Here, we show for the first time that echinomycin binds strongly to FKBP12 with comparable affinity as rapamycin using SPRi and fluorescence in our assays. Moreover, docking studies revealed the five mutual binding contacts of rapamycin and echinomycin to the FKBP12 protein.
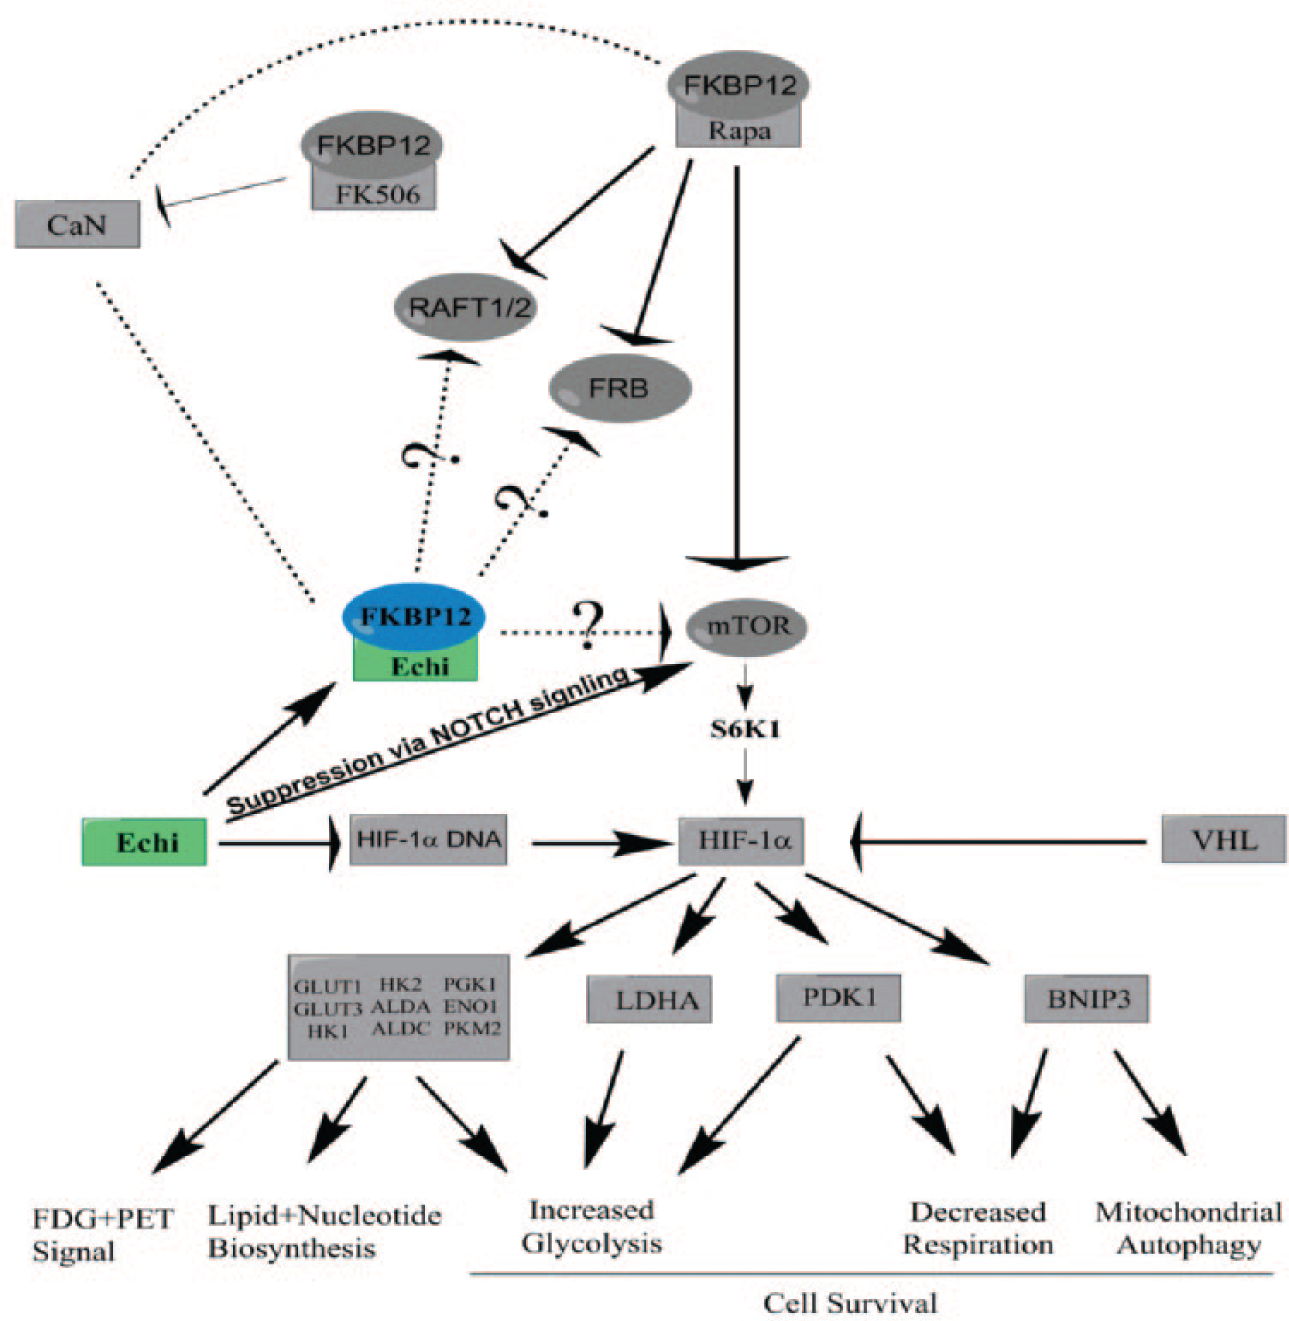
Flow diagram showing the relation of echinomycin and rapamycin to the mammalian target of rapamycin (mTOR) signaling process and hypothetical mechanism of echinomycin-FKBP12 complex formation with mTOR, RAFT1/2, and FRB.
Equivalent to the rapamycin-FKBP12 complex, the echinomycin-FKBP12 complex does not show significant inhibition of the phosphatase activity of calcineurin in our conditions. These conditions show clear inhibition of calcineurin when using the FKBP12-FK506 complex. It is possible that echinomycin-FKBP12 complex binds to mTOR or other targets such as RAFT1 31 or FRAP. 32 This could explain at least in part the anticancer properties of echinomycin. Because of limited resources and time constrains, we were not able to check the effect of the echinomycin-FKBP12 complex to mTOR or the potential targets. We believe that these data showing echinomycin as an FKBP12 binder will lead to a new hypothesis that could in turn promote new therapeutic alternatives.
Footnotes
Acknowledgements
We thank especially Professor Jia-Wei Wu from the School of Medicine, Tsinghua University, for providing lab facilities for the calcineurin phosphatase assay.
Declaration of Conflicting Interests
The authors declared no potential conflicts of interest with respect to the research, authorship, and/or publication of this article.
Funding
The authors disclosed receipt of the following financial support for the research, authorship, and/or publication of this article: This work was financially supported by following grants: National Natural Science Foundation of China (No. 61077064/60921001) and National Major Scientific Instruments and Equipments Development Project (No. 2011YQ03012405).