
Abstract
Screening compounds precipitate out of high-concentration DMSO solutions and cause issues in the liquid-handling equipment used to process the samples as well as false-positives and false-negatives in the biological data. This report examines the extent of the precipitation issue, correlation with physico-chemical properties of compounds, and measured concentrations. Possible ways to allow recovery of the precipitated solids are also described. This study also investigated whether particulates were present from the time of initial solubilization in DMSO or whether precipitation occurs during freeze-thaw cycling.
Introduction
DMSO is the most widely used solvent in drug discovery. 1 Although there are many reasons DMSO is a good solvent for organic compounds, 2 there are also limitations. On the topic of compound precipitation, the 2 main (and competing) disadvantages of DMSO are the solvent interference with biological assays and the finite solubility of screening compounds in any solvent (including DMSO).
Because DMSO interferes to various extents with all in vitro biological assays,2,3 compound stock concentrations in 100% DMSO need to be high to allow for biologically relevant testing concentrations in an assay. For example, a typical enzymatic assay can be run with 1% DMSO; therefore, a 10 mM compound stock in DMSO will result in the highest possible assay concentration of 100 µM. Other assays (especially cell-based ones) have a lower DMSO tolerance. 3 For an assay in which that tolerance is, for example, only 0.1%, a 10 mM compound stock solution will afford a highest possible assay concentration of only 10 µM.
When precipitation occurs, there are potential downstream implications. The process itself can be affected due to precipitates interfering with the hardware used for handling precipitated solutions, such as tip clogging, unknown carryover, process interruption, and so forth. In addition, there could be data integrity consequences, such as false-negatives (for under- or misdispensing) or false-positives (for overdispensing).
Few studies report the extent of the precipitation issue for screening compounds in DMSO at typical stock concentrations of 10 to 30 mM. Balakin et al. 3 found that 15.6% (10,223 of 65,500) of the Chemical Diversity Labs corporate collection was classified as poorly soluble at 10 mM in DMSO. Waybright et al. 5 reported precipitates in 26.4% (525 of 1990) of the wells from the DTP’s Diversity Set master plates at 10 mM.
To add to these issues, in certain cases there is a need to test compounds at high assay concentrations. The two more common applications are toxicity assays and fragment-based drug discovery (FBDD). For example, in vitro inhibition of the hERG potassium channel has been shown to be strongly associated with clinical polymorphic ventricular arrhythmia when the ratio between the free plasma concentration attained during clinical use and the HERG IC50 is high. 6 A ratio of at least 100-fold between the hERG and the target of interest respective IC50s is generally desirable. DMSO tolerance of hERG assays is between 0.1% and 1%, meaning that stock DMSO concentrations of 100 mM are required to reach top hERG assay concentrations of 100 µM to 1 mM. These high top assay concentrations allow IC50 determinations in the range of 1 to 1000 µM, which is within the window of activity for many pharmaceutical agents. 6
FBDD is another application in which compounds need to be screened at high concentrations. FBDD is used as an increasingly popular hit identification tactic. 7 Fragments are molecules that are small by design, and therefore their binding affinities are low. Potency of a fragment is expressed as its ligand efficiency (LE). 8 LE is the binding free energy for a ligand divided by its molecular size, generally defined as either molecular weight (MW) or number of heavy (nonhydrogen) atoms. Although LE values for fragments are within traditional high-throughput screening (HTS) hit ranges, the actual IC50s are usually in the high micromolar to low millimolar range. To identify such weak binders, the screening needs to be done with high-milimolar concentrations, hence the need for 100 mM (or higher) stock DMSO solutions for fragments.
As mentioned above, some studies describe precipitation of screening compounds in DMSO at 10 mM; however, to our knowledge, no data have been reported on higher concentration solutions. Presumably, the more concentrated the solution, the more likely it will be for compounds to precipitate. Described in this report is the occurrence of precipitation of 10, 40, and 100 mM DMSO solutions. In addition, a preliminary investigation into potential correlations between precipitation and calculated molecular properties of the compounds was performed. To explain the differences noted, a series of follow-up experiments was designed. The actual concentrations of a set of ~2000 fragment molecules were measured to investigate whether a clear differentiation existed between precipitated samples and clear solutions. The reported ability of acoustic mixing to drive compounds into solution9,10 was investigated as an alternative to solvent evaporation for recovery of precipitates. A further study was run to answer the question of where precipitation occurs: is it prevalent following freeze-thaw cycles, or is it mostly due to initial insolubility of compounds? Ongoing work in our group includes building a model to predict precipitation in DMSO, as well as optimizing performance of liquid-handling equipment to handle precipitates and will be the subject of a future report.
Materials and Methods
Solutions Inspections
Four sets of compounds were visually inspected for precipitation. All solutions had been previously prepared at their respective nominal concentrations of 10, 40, or 100 mM. Upon addition of DMSO to a known milligram amount of solid, each solution was mixed using a Covaris C2000 Automated Acoustic Mixer (KBioSciences, Hoddesdon, UK). Solutions were stored at −20 °C in sealed ABgene tubes (cat No. SP-1494, Fisher Scientific UK Ltd, Loughborough, UK) in an automated Large Tube Store (LTS; TAP Biosystems, Royston, UK). To perform the inspection, tubes were picked by the LTS and thawed to room temperature. The ABgene tubes have a tapered and opaque bottom, which makes it difficult to identify solutions with a low amount of precipitate. Each sealed tube that did not have a precipitate that was clearly visible above the tapered bottom was inverted upside down for a quick mix to allow identification of all precipitates. For the purpose of this study, no distinction was made between the levels of precipitate present within tubes. If solid was visible at the bottom of the tube, or if the tube inversion resulted in a clouding of the supernatant solution, it was marked as a precipitate.
The water content in the DMSO was also measured for all samples. A Freedom Evo 100 (Tecan US, Inc., Morrisville, NC) was used to transfer 20 µL of each solution to Echo Qualified 384-well microplates. Water content was subsequently measured using an Echo 555 acoustic dispenser (Labcyte, Sunnyvale, CA). The Echo 555 was inconsistent in dispensing or measuring water content in samples that contain precipitates. All measurements summarized in Table 1 are for the nonprecipitated samples only.
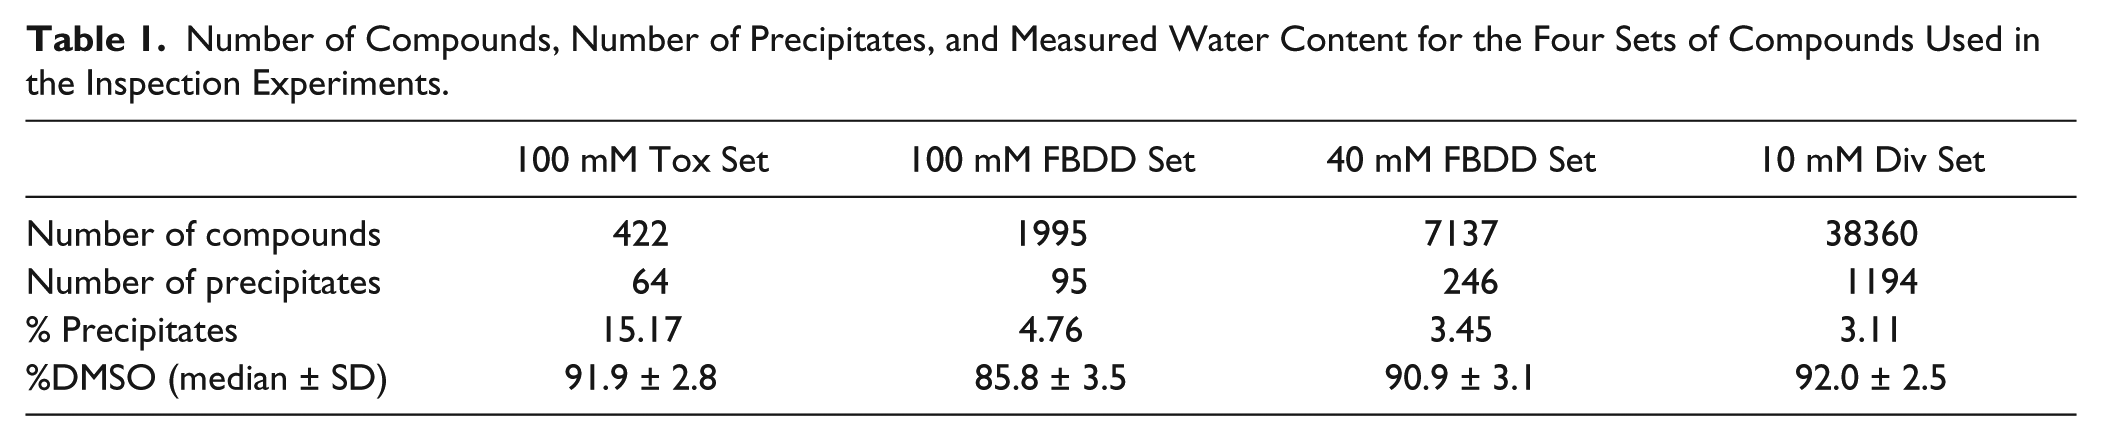
Number of Compounds, Number of Precipitates, and Measured Water Content for the Four Sets of Compounds Used in the Inspection Experiments.
Measured Purity and Concentration
Purity and concentration measurements were performed as previously reported. 11 Purity was measured using an LC-UV-MS-ELSD Acquity system (Waters Corp., Milford, MA). Concentration was determined using flow injection with an HTS CTC PAL autosampler, a Waters Corp. 1515 HPLC pump, and a chemi-luminescence nitrogen detector (CLND; Antek Instruments, Houston, TX). The HTS CTC PAL autosampler was set up to inject 2 mm from the bottom of the plate well. When precipitate was present in the well, it is not known whether it was aspirated or not for measurement.
Results
Frequency of Precipitation in 10, 40, and 100 mM Compound Solutions
For many years, precipitates have been sporadically noted in GSK’s Sample Management Technologies group. Although the most common outcome was to inform the requestor that a precipitate was found and remove it from the screening plate, generally speaking there was no set business rule on how to handle precipitates. Historically, most of the discovery compounds at GSK were made and stored in automated liquid stores as 10 mM solutions in DMSO. 8 However, with the increased interest in fragment-based drug discovery, as well as the use of toxicity assays earlier in the screening cascade, in more recent years higher and higher (up to 1 M) DMSO stocks were being prepared.
When a set of 422 compounds (100 mM Tox Set) was requested for toxicity screening (HERG, cytotoxicity, and mitotoxicity) at a stock concentration of 100 mM in DMSO, the precipitation issue came into sharp focus. Of the 422 solutions, 64 (15.17%) were precipitates. Around the same time frame, a set of 1995 fragment compounds (100 mM FBDD Set) were being prepared as 100 mM DMSO solutions. Precipitates were detected in 95 (4.76%) of those. Two observations are of note: (1) the precipitates seen in tubes across both 100 mM sets had very different consistencies (for example, a precipitate that is three-quarters of the total volume upon centrifugation could condense to below the tapered bottom of the tube, whereas a precipitate that was only 1–2 mm above the tapered end would remain at the same level upon centrifugation) and (2) generally speaking, without any centrifugation, the observed levels of precipitation in the 64 precipitates from the 100 mM Tox Set were much higher than the levels of precipitation seen in the 95 fragment precipitates.
A diverse set of 38,360 existing solutions at 10 mM (10 mM Div Set) and another fragment set of 7137 existing solutions at 40 mM (40 mM FBDD Set) were also visually inspected for precipitation. This systematic visual inspection identified 1194 precipitates in the 10 mM Div Set, or 3.11%. The 7137 40 mM FBDD set contained 246 precipitates (3.45%).
There was minimal overlap in the compounds in each of the four sets described above ( Table 1 ), with no compound present in more than two sets.
Figure 1 shows the distribution of MW, clogP, fraction of sp3 carbons (fsp3), and total polar surface area for the four sets of compounds that were visually inspected for precipitates. All physico-chemical properties were calculated using Daylight software v4.9 (Daylight Chemical Information Systems, Laguna Niguel, CA). Although there were relatively fewer precipitates in the fragment sets (40 mM and 100 mM) compared with the more diverse 100 mM Tox Set, no clear difference was observed between the profiles of the precipitated and the clear solutions within each individual set. This was reflected in the finding that none of the three data-mining techniques used (logistic regression, decision tree, partial least squares discriminant analysis) to explore the relationship between precipitation and the calculated physico-chemical properties were able to achieve acceptable predictions. Further work in our laboratory involves building a model that takes into account multiple calculated parameters.
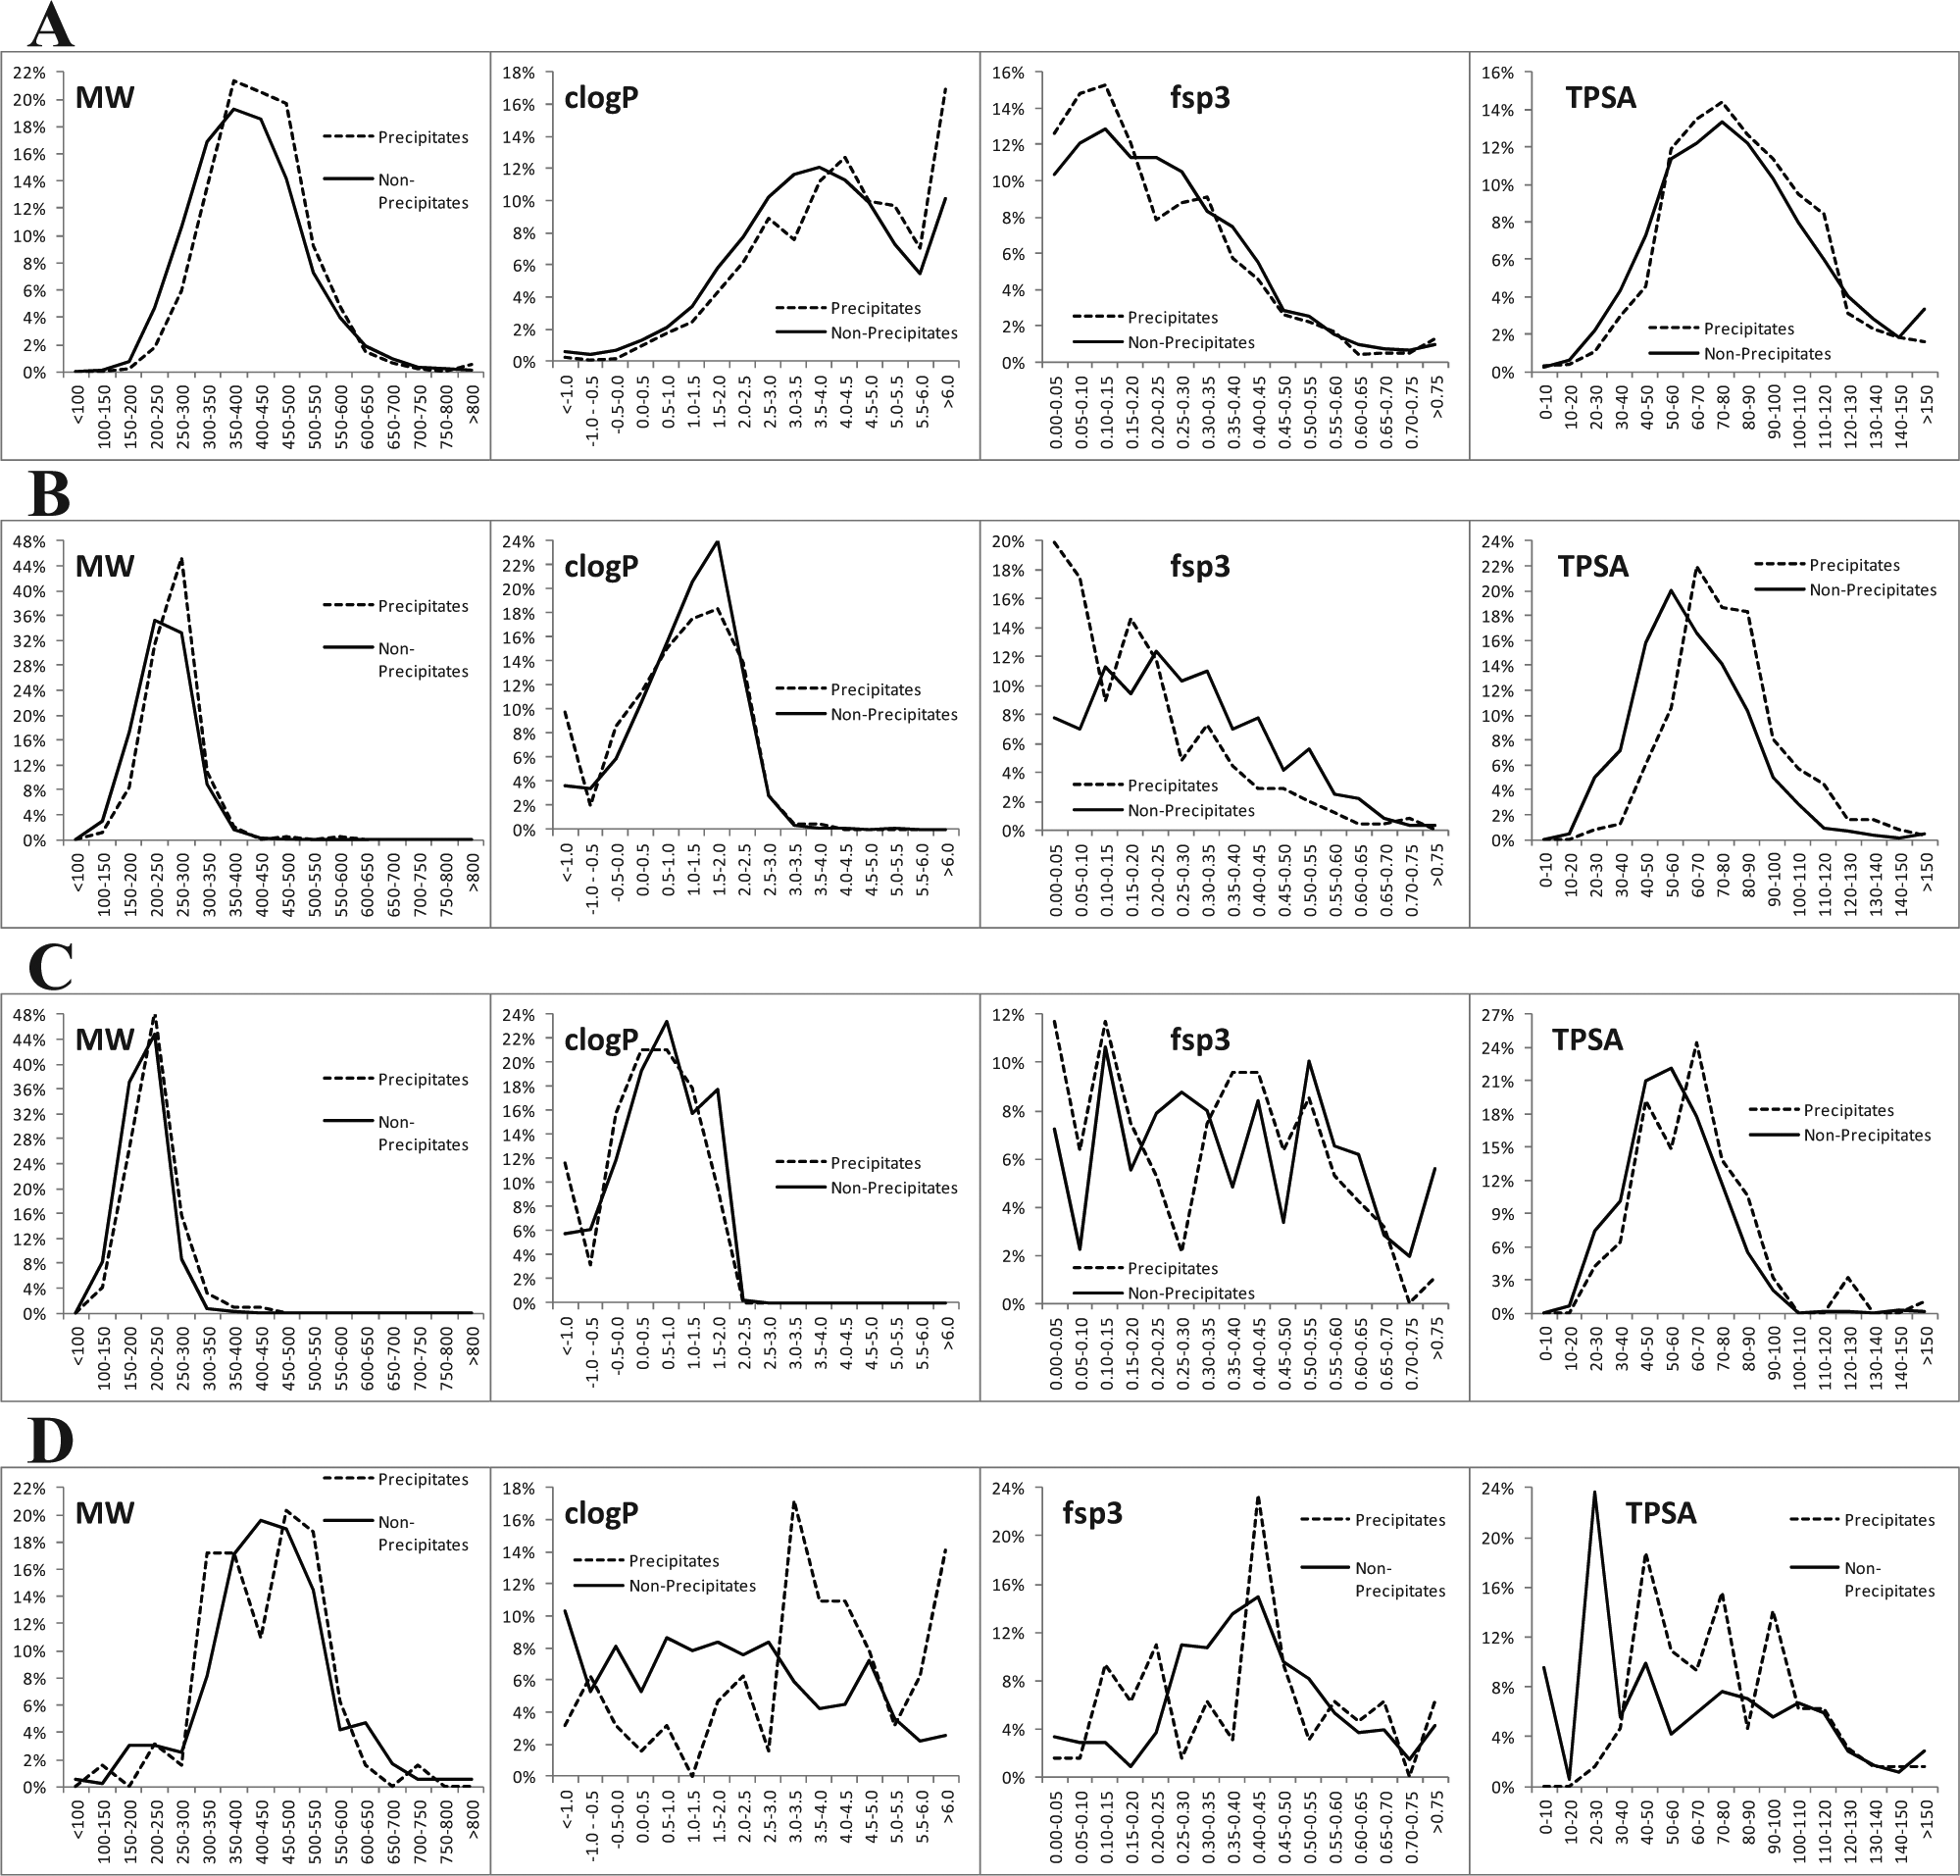
Selected molecular properties (molecular weight, clogP, fraction of sp3 carbons, total polar surface area) for four the sets of compounds used in the inspection experiments: (
The only direct comparison between the same concentration solutions was between the two 100 mM sets, in which 4.76% of the fragment solutions compared with 15.17% of the diversity compound solutions contained precipitates. Considering that the process of solubilization and liquid handling used to prepare these compounds was identical, the difference in the occurrence of precipitation is presumably due to the differences in molecular properties between the two groups of compounds ( Fig. 1C , D ).
Of the 64 precipitated solutions from the 100 mM Tox Set, 36 compounds had also been previously prepared as 10 mM solutions. No precipitate was present in any of those 36 solutions. Similarly, 64 of the 246 precipitates from the 40 mM fragment set were also available as 10 mM solutions. Of those 64, 12 were precipitates at 10 mM also, and 52 were only precipitates at 40 mM and clear solutions at 10 mM. These results support the assumption that the higher the concentration, the more likely it is for compounds to precipitate out of DMSO.
It has been reported that water absorption and freeze-thaw cycles have a synergistic effect on the precipitation of compounds from DMSO solutions. 10 The water content for the 4 sets of compounds inspected was very consistent within each set, as seen in Table 1 . Although water content could be measured only for nonprecipitated solutions, the fact that it was very consistent across solutions within a set suggests that it would be within the same range in the precipitated solutions. Water content did vary somewhat between sets. The 100 mM FBDD set had the lowest median value (85.8% DMSO and 14.2% water), whereas all the solutions in the other three sets had a water content of less than 10%. Overall, the relatively similar water content between compound sets support the hypothesis that differences in molecular properties do have an effect on DMSO solubility, even though no single property seems to have a clear effect. This is especially evident in the comparison between the 100 mM FBDD set and 100 mM Tox Set (4.76% versus 15.17% precipitation, whereas water content is higher in the 100 mM FBDD set).
Measured Properties for Precipitated versus Nonprecipitated Solutions from the 100 mM FBDD Set
Because no significant difference was noted in any single calculated physico-chemical property between the precipitated and nonprecipitated compounds, we asked the question whether selected measured parameters might be a good indicator. For each of the 1995 solutions of the 100 mM FBDD set, we measured both purity and concentration. The expectation was that the concentration of all precipitated samples would be lower than nominal. Figure 2 shows the distribution of purity (left panel) and concentration (right panel) of the precipitated and nonprecipitated solutions. The purity panel includes all 1900 nonprecipitated samples and 95 precipitated samples. The CLND detector gives an unreliable (underestimated) signal for compounds containing nitrogen-nitrogen bonds. 12 Of the 1995 solutions analyzed, 454 of the 1900 nonprecipitated samples and 20 of the 95 precipitated samples contained adjacent nitrogens. The concentration distribution shown in Figure 2 includes all samples that do not contain adjacent nitrogen atoms: 1446 of 1900 nonprecipitates and 75 of 95 precipitates. It should be noted that our method for concentration measurement did not include sampling of only the liquor above the precipitate, as previously described. 5 Rather, the autosampler was set up to aspirate 2 mm from the bottom of the plate, which meant that precipitate may or may not have been aspirated. This difference in methodology may explain why some of the measured concentrations for precipitated samples are >120 mM, presumably because precipitate was aspirated for injection.
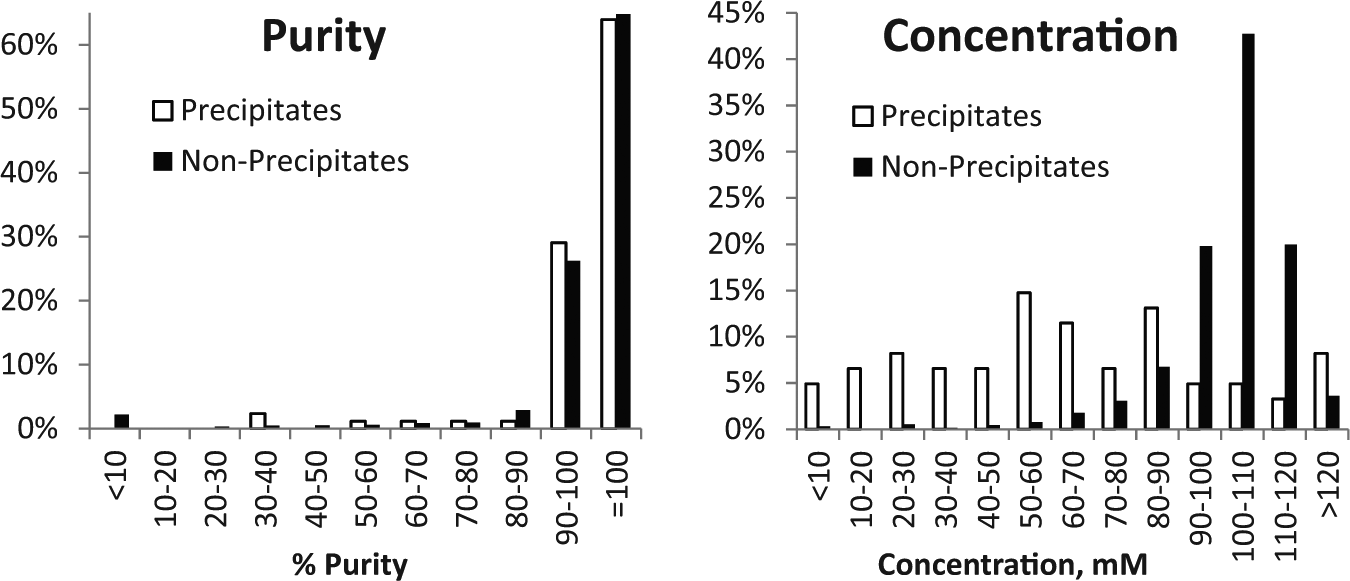
Purity and concentration distribution of precipitated and nonprecipitated solutions in the 100 mM fragment compounds set.
Even within the above-mentioned limitations of the method used, purity distributions of the 95 precipitates and the 1900 clear solutions were very similar; however, measured concentration profiles were clearly different. For precipitates, the distribution of compounds across the entire range was relatively flat, with 5% to 15% compounds in each of the equally spaced concentration bins. For the nonprecipitates, 92.9% of the measured concentrations were in the 80 to 120 mM range, which is ±20% of nominal. Approximately one-third (34.4%) of the precipitated samples also had a measured concentration of 80 to 120 mM. This is not very different from a previous report that found that the concentration of the liquor above the precipitate for 3 of 10 samples was 7 mM compared with a nominal 10 mM. 5 These results indicate that although a concentration <80 mM should raise a flag that a compound is a precipitate, a concentration close to the nominal 100 mM does not necessarily mean that the solution is clear.
Recovering Precipitates from High-Concentration Solutions
A typical HTS small molecule of 400 Da MW will require 20 mg of solid to prepare a 500 µL solution at 100 mM. In an early discovery context, especially given the miniaturization of all hit and lead identification screening operations, 20 mg is a large amount. Many times, it is the majority of the solid stock of compound. Unfortunately, without the ability to predict which compounds will precipitate out of DMSO, it is only upon dissolution into the solvent and subsequent visual inspection that a precipitate is identified. To recover a solid from solutions, the most common process involves evaporation of the solvent. However, DMSO does not evaporate easily due to its high boiling point (189 °C), and it is difficult to remove completely through conventional rotary evaporation. Because compounds in hit and lead identification programs are frequently profiled in various assays, not all of which would require 100 mM stock solutions, we wanted to investigate the possibility of sample recovery without the need for evaporation of DMSO but rather by dilution of the precipitated solution. Applying this method to recovery of all precipitated solutions may not be appropriate for every situation; however, it provides an alternative solution for the individual investigator to consider.
A random selection of 24 of the 64 precipitates from the 100 mM Tox Set was acoustically mixed on the Covaris instrument to yield a homogeneous suspension. Upon acoustic mixing, none of the 100 mM solutions were clear. Using a manual pipette, 100 µL aliquots of each of the 24 samples were rapidly transferred into a separate vial, and an additional 900 µL DMSO was added. It should be noted that the DMSO added was taken from a stock bottle and had a water content of <1%. All 24 samples became clear upon gentle manual shaking of the vial. The nominal concentration of all samples was 10 mM (1:10 dilution of the 100 mM precipitates). Actual concentrations were measured for the 24 diluted, clear solutions. Figure 3 shows the measured concentration of the diluted precipitates. Only four samples (17%) were within 20% of the nominal concentration of 10 mM, whereas, encouragingly, 16 of the 24 samples (67%) had a measured concentration of 5 to 15 mM. Dilution of homogenized precipitates could therefore be a viable alternative to DMSO solvent removal for driving precipitates into solution at a lower concentration. As previously mentioned, this method may not be applicable to all precipitated solutions. In addition, compounds may not be soluble even at 10 mM, and further dilution may be needed.
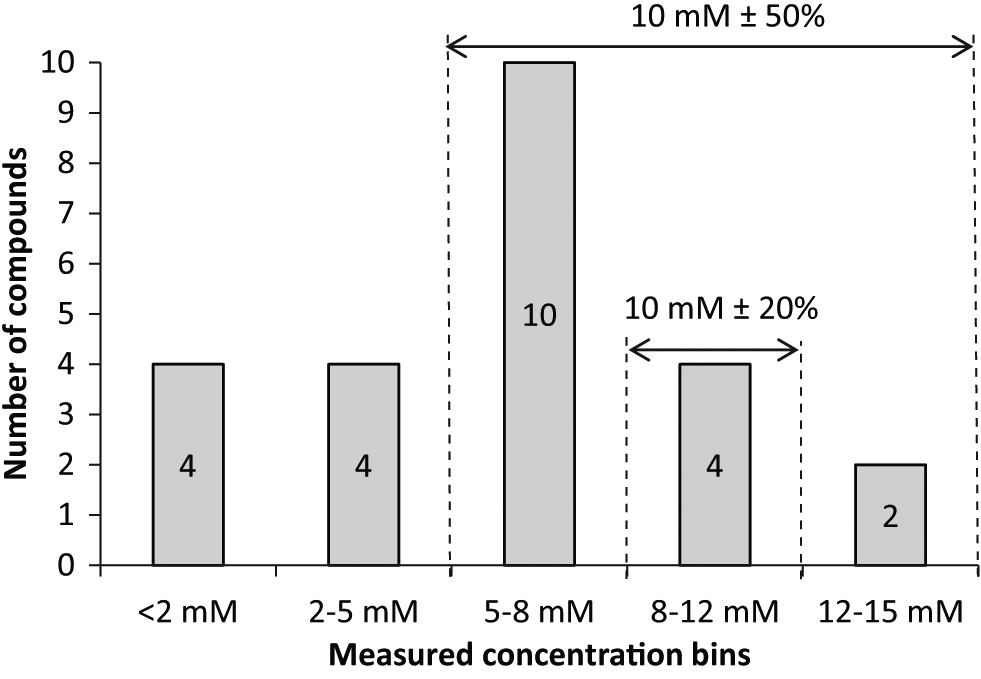
Measured concentrations of 24 solutions obtained through 1:10 dilution of 100 mM homogenized precipitates.
Precipitation through Freeze-Thaw Cycles versus (In)solubility in DMSO
It has been reported that acoustic mixing is an efficient way of driving back into solution precipitates that had been caused by kinetic events such as those induced by freeze-thaw cycles. 10 Although several reports have described the stability of compounds in DMSO solutions4,8 and the effect of freeze-thaw cycling on DMSO solutions, 13 to our knowledge, there are no data reported with regard to the extent of precipitation caused by freeze-thawing versus initial insolubility. We set out to determine what proportion of precipitation is caused by freeze-thaw cycles versus intrinsic insolubility of compounds in DMSO at given concentrations. The experiment was performed in sealed ABgene tubes to minimize as much as possible the effect of water absorption in DMSO.
A set of 110 compounds identified as precipitates at 100 mM from both the toxicity and fragment sets were weighed out from solid to prepare 300 µL solutions at 10, 25, 50, 75, and 100 mM for each compound. These solutions were acoustically mixed and stored in sealed ABgene tubes. Freeze-thaw cycles did not include removal of the tube seals. All tubes were visually inspected at time zero and after 1, 2, 5, and 10 freeze-thaw cycles. Table 2 shows the number of compounds precipitated at the given concentrations upon initial solubilization/mixing and after freeze-thaw cycling. Figure 4 shows the correlation of the percentage compounds precipitated with nominal concentration. Of the 110 solutions at 100 mM, 8 did not precipitate at all even after 10 freeze-thaw cycles, possibly because of the lower water content compared with the original precipitates (not measured because all samples were precipitates). Of note is that an attempt to transfer the 102 solutions with precipitates using the Tecan Freedom Evo resulted in eight clogged tips, as identified by empty transfer destinations.
Number of Compounds Precipitated at Given Concentrations upon Initial Solubilization (Time Zero) and after Various Numbers of Freeze-Thaw Cycles.
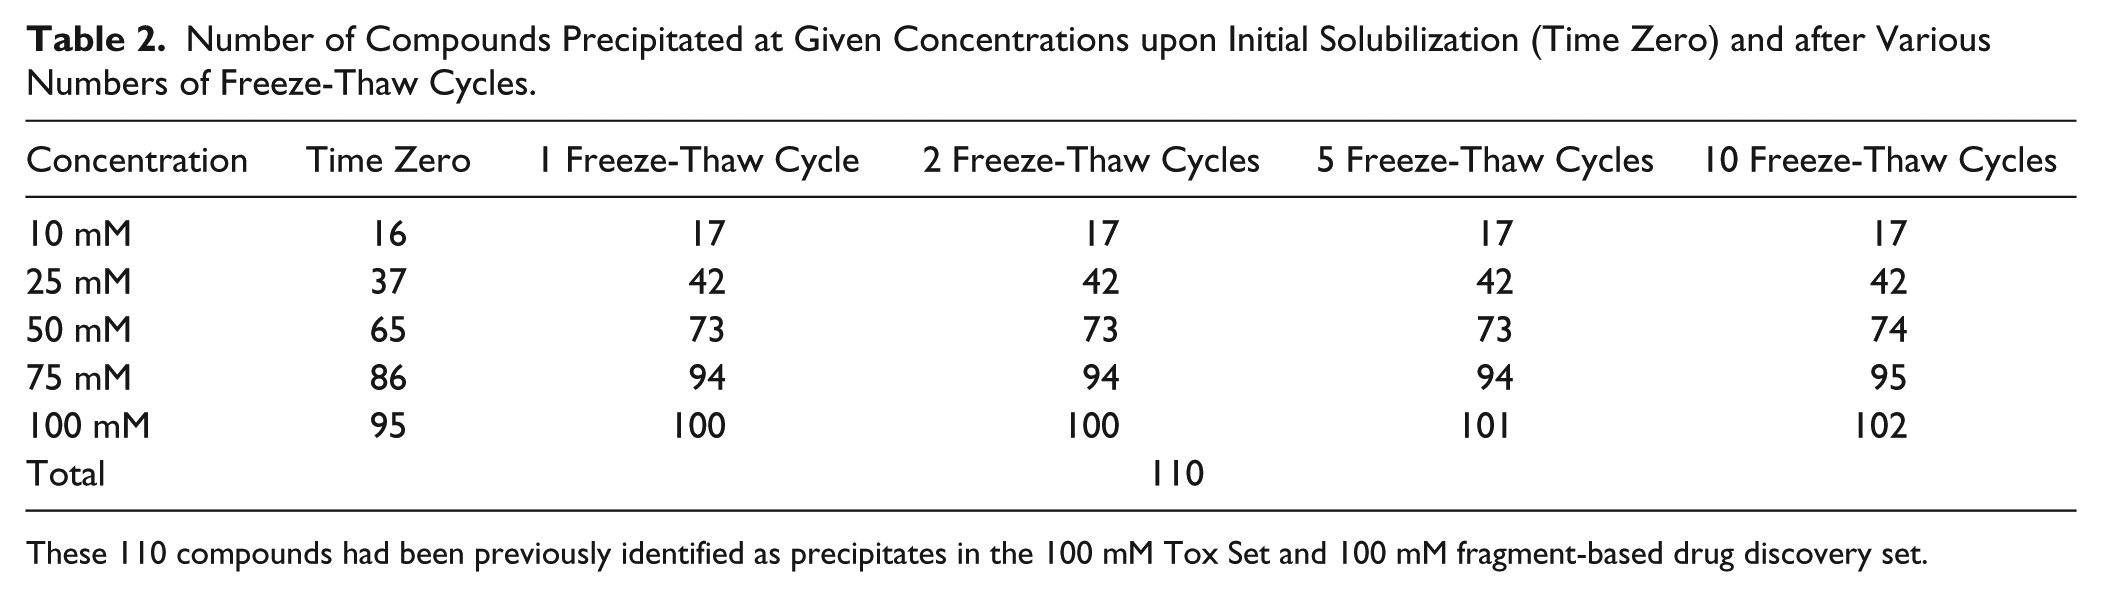
These 110 compounds had been previously identified as precipitates in the 100 mM Tox Set and 100 mM fragment-based drug discovery set.
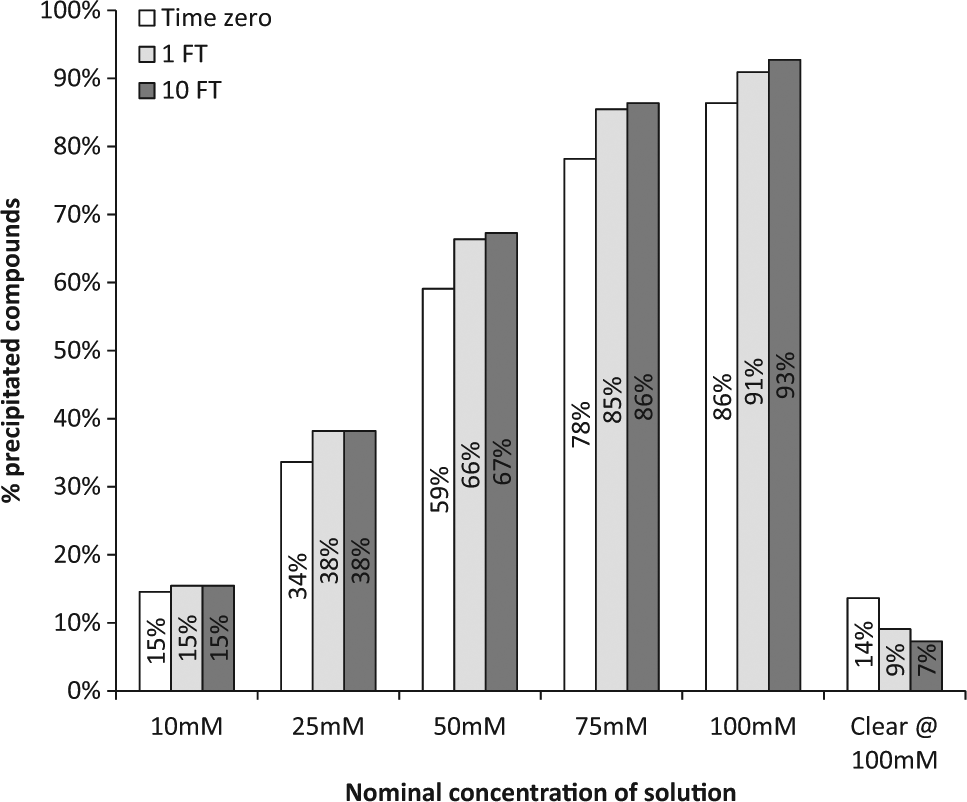
Percentage compounds precipitated at given concentrations upon initial solubilization (time zero), after 1 freeze-thaw cycle (1 FT), and after 10 freeze-thaw cycles (10 FT).
Of the 102 compounds that did precipitate at 100 mM, 95 (93%) never went into solution at time zero, even after acoustic mixing. An additional five samples precipitated out of solution at 100 mM after the first freeze-thaw cycle. There was no change between one and two freeze-thaw cycles, but after five freeze-thaw cycles, one additional compound precipitated out and one more after 10 freeze-thaw cycles. These results clearly show that the majority of compounds (95 of 110, 86%) never go into solution at 100 mM initially; a much smaller percentage (5 of 110, 5%) precipitate only after the first freeze-thaw cycle, and an even smaller number precipitate out after multiple freeze-thaw cycles. It should be noted that the level of precipitation was not measured in our studies, and it is possible that freeze-thaw cycles may have caused more precipitation in the 95 samples that never went into solution initially. Of the 95 compounds that did not solubilize in DMSO at 100 mM, 16 (17%) were insoluble at 10 mM, 37 (39%) at 25 mM, 65 (68%) at 50 mM, and 86 (91%) at 75 mM.
The results of this experiment are in full alignment with the intuitive assumption that the higher the concentration, the more compounds will precipitate, but to our knowledge, they are the first reported data to support this assumption.
Discussion
A limited number of previous reports describe the issue of precipitation of screening compounds in DMSO at 10 mM; however, to our knowledge, no data have been published on solutions with higher than 10 mM concentrations. In this study, we visually inspected four sets of compounds to identify precipitates, 1 at 10 mM, 1 at 40 mM, and 2 at 100 mM. Multiple physico-chemical properties of the compounds were compared for the precipitated versus nonprecipitated samples. No clear difference was observed for the distribution profile of any single property within each individual set. However, the difference between sets, especially the two 100 mM sets (one FBDD and one diversity) indicates that the totality of molecular properties does influence DMSO solubility. An analysis of the measured concentrations of the 100 mM FBDD set suggested that a concentration <80 mM was generally a good indication that a compound was a precipitate; however, a concentration close to the nominal 100 mM did not necessarily mean that the solution was clear. A simple experiment in which precipitates were first homogenized by acoustic mixing and then diluted from 100 mM to 10 mM indicated a potential alternative to DMSO solvent removal for driving precipitates into solution at a lower concentration. An investigation into where precipitation occurs showed that the majority of compounds (86%) never go into solution at 100 mM initially. A much smaller percentage (5%) precipitate after the first freeze-thaw cycle, and an even smaller number precipitate out only after multiple freeze-thaw cycles. The same study showed a linear correlation between the number of compounds precipitated and the concentration of the solution. It should be noted that the closed tube system used for this latter experiment enabled study of the effect of freeze-thaw cycling in the absence of changes in water content of the DMSO stocks.
Ongoing work in our group includes an analysis of the effect of precipitates on various types of liquid-handling equipment (fixed tips, disposable tips, acoustic dispensing), an investigation into the accuracy of identifying precipitates through visual inspection versus more automated methods, as well as the development of a model to allow prediction of precipitation in DMSO.
Footnotes
Acknowledgements
We would like to thank the UK Sample Management Solids group for weighing all the solid samples for the last experiment, Charles Alex Lane for his help with the visual inspection of the samples, and Margaret Martin, Dolores Jimenez-Alfaro, Snehal Bhatt, Stacey Barto, Alexandra Gray, and Karen Dobbs for their feedback, input, and suggestions on how to handle precipitates. We would also like to thank Brenda Ray and Ricardo Macarron for all their support, encouragement, and feedback throughout the entire project.
Declaration of Conflicting Interests
The authors declared no potential conflicts of interest with respect to the research, authorship, and/or publication of this article.
Funding
The authors received no financial support for the research, authorship, and/or publication of this article.