
Abstract
In this work, single-stranded DNA aptamers that are highly specific to enterotoxigenic Salmonella paratyphi A were obtained from an enriched oligonucleotide pool using Systematic Evolution of Ligands by Exponential Enrichment (SELEX) to target the flagellin protein. The selected aptamers were confirmed to have high sensitivity and specificity to the flagellin. In addition, a probe (P0) containing the DNAzyme and fluorescein isothiocyanate–labeled aptamer3 sequences was employed as a dual probe for observing fluorescence and absorbance changes. The flagellin demonstrated low detection limits of 5 ng/mL by fluorescence and 20 ng/mL by spectrophotometry. Moreover, milk samples spiked with Salmonella paratyphi A were also detected, with the low detection limits increasing to 105 CFU/mL by fluorescence and 106 CFU/mL by spectrophotometry. The combination of fluorescence and spectrophotometry offers a specific, rapid, and sensitive way for detecting Salmonella paratyphi A and has potential for detecting other pathogens in food.
Introduction
Salmonella paratyphi A, a pathogenic microorganism found in food-borne infections, is a major source of diarrhea, fever, nausea, gastroenteritis, food poisoning, and other symptoms in humans and has a great impact on public health.1,2 These symptoms are actually closely related to the flagellum. The flagellum extends from the cell membrane to form a helical propeller that enables the thallus to migrate to more favorable environments. 3 The flagellum can also play an important role in other processes such as substrate adhesion and host invasion in pathogenic bacteria. 4 Hence, flagella antigen can be used as a surface molecular marker as it not only can be detected but also can be used to study the mechanism of interaction with the host.
S. paratyphi A are generally detected using conventional microbiological culture methods, immunology, or PCR.5,6 However, all three methods have their shortfalls. Conventional microbiological culture methods are labor intensive, slow, and unsatisfactory for responding promptly to cases of contamination. Immunological methods are similarly time-consuming and costly, require complex sample pretreatment procedures, and produce false-positive results from cross-reaction. PCR requires multiple touch conditions and contaminates easily during nucleic acid sample extraction. An alternative method that is quick and highly sensitive and has a short detection time is needed.
Aptamers, or chemical antibodies, are ssDNA and RNA molecules obtained from the Systematic Evolution of Ligands by Exponential Enrichment (SELEX) process that can bind to a wide range of target molecules with high specificity and affinity, including proteins, metal ions, small molecules, whole cells, and even tissues.7–11 They have been used to detect pathogenic bacteria, treat cancer, and identify biomarkers.12 –14 They have also been tested as a bioprobe for detecting ATP, mercury ion, proteins, and cells.15–18 Their application in detecting pathogens, such as Staphylococcus aureus, Salmonella typhimurium, and Escherichia coli K88, has previously been reported.19–21
Catalytic nucleic acids (DNAzymes) have attracted substantial efforts for developing labels with amplified signals. One of the most extensively studied DNAzymes has been the hemin/G-quadruplex horseradish peroxidase–mimicking DNAzyme, which catalyzes the oxidation of 2,2′-azino-bis (3-ethylBenzthiazoline-6-sulfonic acid) ABTS2− to the colored product ABTS− by H2O2. 22 Many studies have already employed DNAzymes as catalytic labels for the colorimetric detection of DNA, aptamer complexes, and metal ions.23,24 Thus, using analyte-dependent DNAzymes as catalysts to amplify sensing events is especially attractive as a platform for designing biosensors.
Carbon nanotubes, first discovered by Iijima in 1991, have been extensively studied because of their unique chemical, electrical, and mechanical properties.25–27 Previous experiments have found that ssDNA wrapped around single-walled nanotubes (SWNTs) by π-stacking interactions between the nucleotide bases and the SWNT sidewalls can form stable ssDNA/SWNTs complexes. 28 In addition, SWNTs can act as quenchers for many dyes, which provides a new platform for detecting protein via fluorescence signals.
In this article, a sensitive and cost-effective detection method using noncovalently assembled SWNTs and probe (P0) was constructed for detecting S. paratyphi A. The P0 was composed of two regions: I and II. Region I was an fluorescein isothiocyanate (FITC)–labeled aptamer sequence that bound specifically to the target and emit fluorescence. Region II was a DNAzyme sequence that amplified absorbance signals. In the absence of the target, no detectable signals were generated as the P0 bound to the SWNTs blocked the formation of free hemin-containing active DNAzymes, which quenched the dye fluorescence. Upon adding the hemin and target, the P0 was released from the SWNTs and self-assembled into a DNAzyme unit that catalyzed the ABTS2− and fluorophores away from SWNTs and increased fluorescent intensity. This dual detection method successfully detected S. paratyphi A using both fluorescence and spectrophotometry.
Materials and Methods
Materials
Carboxy1-modified SWNTs, with a carboxyl mass fraction of 2.73%, were purchased from Organic Chemicals Co., Ltd. (Chengdu, China). All DNA oligonucleotides including the FITC-labeled probe were synthesized by Shanghai Sangon Biological Engineering Technology & Services Co., Ltd (Shanghai, China). All materials used in the experiment were dissolved in distilled water purified by a Milli-Q water purification system (electric resistivity 18 MΩ cm−1). The S. paratyphi A strain was given by the Changsha Central Hospital (Changsha, China). E. coli TOP10 was obtained from the Laboratory of Plant Developmental and Molecular Biology of the Hunan Normal University (Changsha, China). Hemin was purchased from Geling NanoTech Co., Ltd (Changsha, China). ABTS2− was purchased from Sigma. The pUC-T Simple Cloning Kit was obtained from Shanghai Sangon Biological Engineering Technology & Services Co., Ltd (Shanghai, China). The fluorescent emission spectra were recorded in a quartz cuvette by an LS55 luminescence spectrometer (PerkinElmer, UK) at room temperature. Both excitation and emission spectrometer slits were set at 10.0 nm. The ultraviolet (UV) spectrophotometer used for absorbance detection at 414 nm was purchased from Tianmei Techcomp (Shanghai, China). The milk used for analysis was purchased from the local market.
Methods
Separation and Purification of Flagellin
After culturing in nutrient medium (pH 7.4) at 37 °C for 18 h, S. paratyphi A were collected via centrifugation (10,286 × g) for 30 min at 4 °C and then resuspended in normal saline. Then, 1 mol/L HCl was added and the bacterial suspension continuously stirred for 30 min until the pH reached 2.0. The sediment was discarded after centrifuging (36,000 × g) for 60 min at 4 °C. NaOH 1 mol/L and then (NH4)2SO4 were added to the supernatant to obtain a pH of 7.2 in the supernatant. The mixture was placed at 4 °C overnight and then the precipitation dissolved in double-distilled H2O after centrifuging (36,000 × g) for 10 min at 4 °C. Native polyacrylamide gel electrophoresis (PAGE) was performed and the target protein purified from the gel with electroelution and lyophilized. The target protein powder was then conserved at −20 °C prior to use.
SELEX Procedure
A synthetic ssDNA library containing a 35-base central random sequence (5′-GGGAGCTCAGAATAAACGCTCAA-N35-TTCGACATGAGGCCCGGATC-3′) had primer sites on both sides: 5′-GGGAGCTCAGAATAAACGCTCAA-3′ for the forward site and 5′-GATCCGGGCCTCATGTCGAA-3′ for the reverse.
The procedure for selecting the flagellin DNA aptamers was implemented as follows. The flagellin with 0.05 mol/L NaHCO3 (pH 9.6) was coated on a 96-well enzyme-linked immunosorbent assay plate at 4 °C overnight. Three percent bovine serum albumin (BSA) was added at 37 °C for 2 h to block the wells coated with flagellin and blank wells. The ssDNA pools were heated at 95 °C for 5 min in binding buffer containing 20 mmol/L HEPES buffer (N-2-hydroxyethylpiperazine-N′-2-ethanesulfonic acid) at pH 7.35, 120 mmol/L NaCl, 1 mmol/L MgCl2, 1 mmol/L CaCl2, and 5 mmol/L KCl and then immediately placed into iced water. To decrease background binding, yeast tRNA was added to the binding buffer. For negative selection, ssDNA libraries added to BSA-blocked blank wells were maintained at 37 °C for 40 min. Uncombined ssDNA was then transferred to the wells coated with flagellin at 37 °C for 40 min. The wells were washed five times with washing buffer (binding buffer + 0.05% Tween 20) and filled with eluting buffer (20 mmol/L Tris-HCl, 4 mol/L guanidinium isothiocyanate, 1 mmol/L DTT, pH 8.3) at 80 °C for 10 min. Sodium acetate 3 mol/L (pH 5.2) and dehydrated ethanol were added and kept at −80 °C for 40 min and then centrifuged at 30,857 × g for 10 min at 4 °C. The sediment was dissolved in 20 µL double-distilled water after drying. The ssDNA was amplified by PCR (5 min at 95 °C, then 30 s at 95 °C, 30 s at 65 °C, and 30 s at 72 °C, 20 cycles, followed by 5 min at 72 °C). The asymmertric PCR (5 min at 95 °C, then 30 s at 95 °C, 30 s at 65 °C, and 30 s at 72 °C, 40 cycles, followed by 5 min at 72 °C; concentration of forward primer was 100 times greater than the down primer) was used to acquire the ssDNA as the enriched library for the next selection round. The amount of ssDNAs at each step was measured by UV-Vis spectroscopy. The aptamer binding ratio was obtained by analyzing the fluorescence of eluted ssDNA every two rounds.
After 14 rounds of aptamer enrichment, the PCR products selected from the 14th round were subcloned into pUC-T vectors using the pUC-T Simple Cloning Kit. The vectors were transformed into E. coli TOP10 cells. Thirty positive clones were then inoculated into test tubes. After shaking at 37 °C for 24 h (200 rpm/min), 1 mL of inocula was taken from each single colony and sent to sequence. Their secondary structures were performed using the Mfold program.
Determination of Dissociation Constant
The affinities of the selected aptamers against their targets were confirmed with binding assays. The equation Y = BmaxX/(Kd + X) and a calibration plot of the mean fluorescent intensities of the aptamers bound to flagellin were used to calculate the binding dissociation constant, Kd. Bmax was the maximal fluorescent intensity measured by this experiment, Y the mean fluorescent intensity, and X the concentration of the aptamer that was added.
Representation of Binding Parameters of Aptamer to Bacteria
Various amounts of S. paratyphi A cells ranging from 104 to 1011 CFU/mL were incubated with 400 nmol/L FAM-labeled aptamer3. Other bacteria, such as S. typhimurium, E. coli and S. aureus, were also incubated at 1011 CFU/mL with 400 nmol/L FAM-labeled aptamer 3 to test for selectivity. After binding and washing, the bacterium-ssDNA complex sediment was resuspended in 400 µL of normal saline. Fluorescent intensity (measurement conditions explained in the Materials and Methods section) was used to determine the binding affinity of the aptamer3 against various bacteria. Confocal laser scanning microscopy was also used to assess the binding of S. paratyphi A and S. typhimurium cells and aptamer3.
Simultaneous Fluorescence Spectrophotometric Assay and Specificity Detection
SWNTs were dissolved in Milli-Q water and sonicated for 30 min in an ice bath before use to obtain a homogeneous black solution. For the detection assays, the working solution (50 nmol/L P0, 20 mmol/L Tris-HCl) was mixed with 0.02 mg/mL SWNTs at 37 °C for 2 h. Hemin solution (1 µmol/L) and target flagellin were then added at 37 °C and the mixture incubated for 2 h. The solution was centrifuged at 20,571 × g for 10 min, and the supernatant was collected. The fluorescent intensity was measured at 515 nm with an excitation wavelength of 480 nm and recorded. ABTS2− (3 mmol/L) and H2O2 (5 mmol/L) were added, and the absorbance was measured again at 414 nm in 20 KH buffer (50 mmol/L HEPES-NH4OH, pH 8.0; 20 mmol/L KCl; 200 mmol/L NaCl; 0.05% Triton X-100; 1% DMSO). S. typhimurium flagellin, BSA, and the control were chosen to verify the selectivity of this approach. The concentration of P0 was set at 50 nmol/L, S. paratyphi A flagellin at 60 ng/mL, and S. typhimurium flagellin and BSA at 120 ng/mL.
Milk Sample Analysis
Milk was chosen as the sample matrix for detecting pathogens in food. Different concentrations of bacteria were added to 1 mL of milk in centrifuge tubes. The P0/SWNTs complexes in working solution (20 mmol/L Tris-HCl) were mixed with 1 µmol/L hemin and the various milk mixtures spiked with different concentrations of bacteria at 37 °C for 2 h; the fluorescent intensities were then measured. ABTS2− (3 mmol/L) and H2O2 (5 mmol/L) were added to the systems, and the absorbance was measured in 20 KH buffer at 414 nm. Specificity was examined using four different bacteria (108 CFU/mL)—S. paratyphi A, S. typhimurium, E. coli, and S. aureus—and detected under the same conditions. All experiments were repeated in triplicates.
Results and Discussion
The ssDNA concentration decreased with each subsequent selection round. After 14 selection rounds, the aptamers developed strong affinities for the flagellin. The amounts of flagellin and ssDNA pools added in each round are shown in
The nonlinear regression analyses of select aptamers are shown in
The secondary structures of aptamers 1 to 4 were predicted by DNAMAN software, and their typical stem and loop motifs are shown in
Figure 1a shows the proportional increase of fluorescence intensity to the number of cells, especially in the range from 106 to 1011 CFU/mL (R2 = 0.9927). The low detection limit was 104 CFU/mL, which confirmed that aptamer3 bound specifically to the bacteria and served as an ideal tool for monitoring them. Moreover, the fluorescent intensities of nontargeted bacteria were much lower than that of the target ( Fig. 1b ), despite having similar cell numbers (1011 CFU/mL). S. typhimurium, a bacteria within the same species and with similar serotypes to S. paratyphi A, yielded higher fluorescent intensities than that of the less related bacteria E. coli and S. aureus, suggesting that the flagellin of S. typhimurium and S. paratyphi A possessed similar binding epitopes. The fluorescent value of S. paratyphi A, however, was 2.8 times that of S. typhimurium, confirming that aptamer3 was more selective toward S. paratyphi A. Sequence alignment also found that, when compared with S. paratyphi A, the homologies of S. typhimurium and E. coli flagellin were 71.313% and 52.456%, respectively. Thus, the higher the homology, the more similar the spatial structure and higher affinity, which was consistent with the results above. Confocal laser scanning microscopy ( Fig. 1c ) further confirmed these results as FITC-specific green fluorescence appeared on the surfaces of S. paratyphi A rather than S. typhimurium cells.
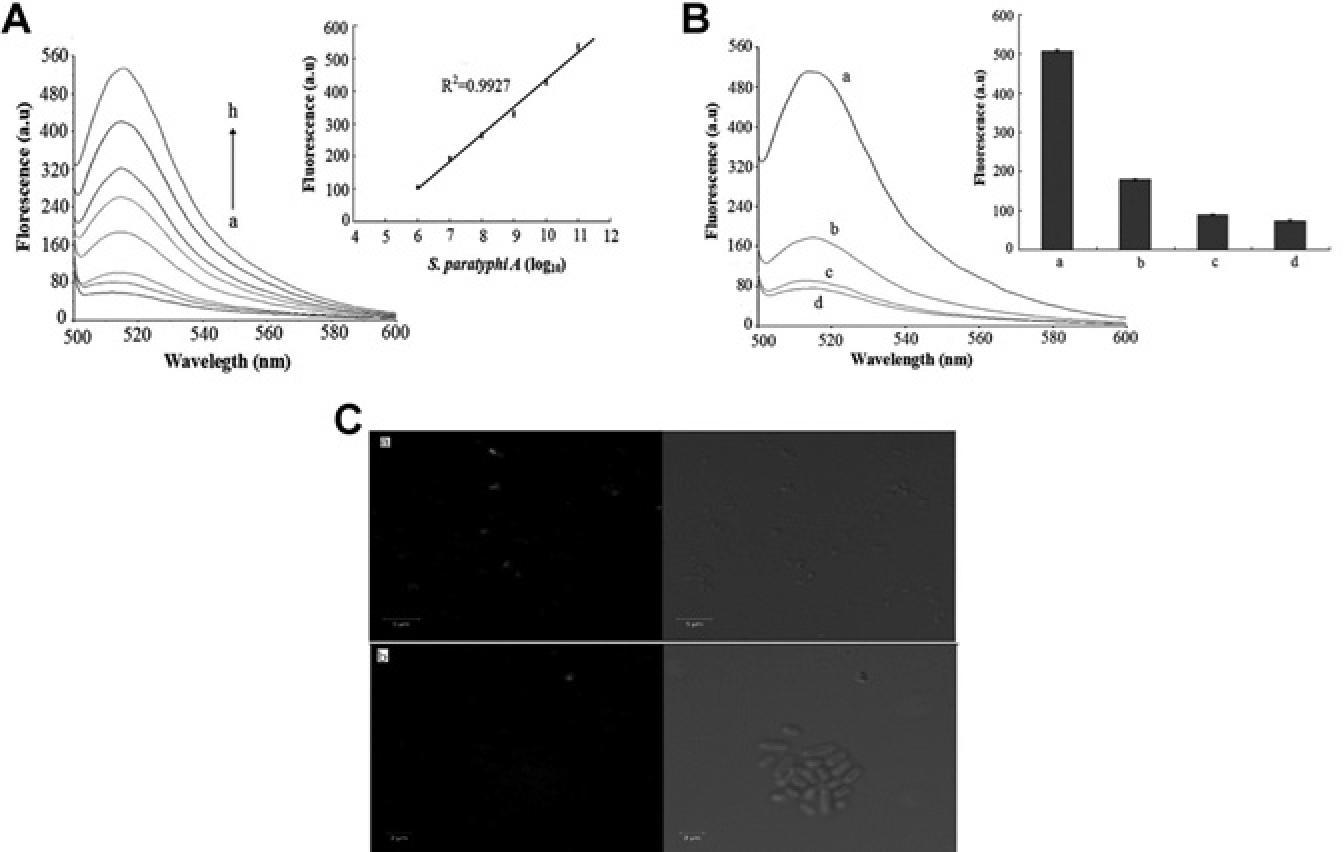
The binding capacity of candidate aptamer (aptamer3) against S. paratyphi A measured by fluorescence analysis. (
To develop a versatile detection system, a simultaneous fluorescence-spectrophotometric method employing SWNTs with a P0 was devised (
Fig. 2
). The P0 included two parts—an FITC-labeled aptamer3 (I) and a DNAzyme sequence (II;
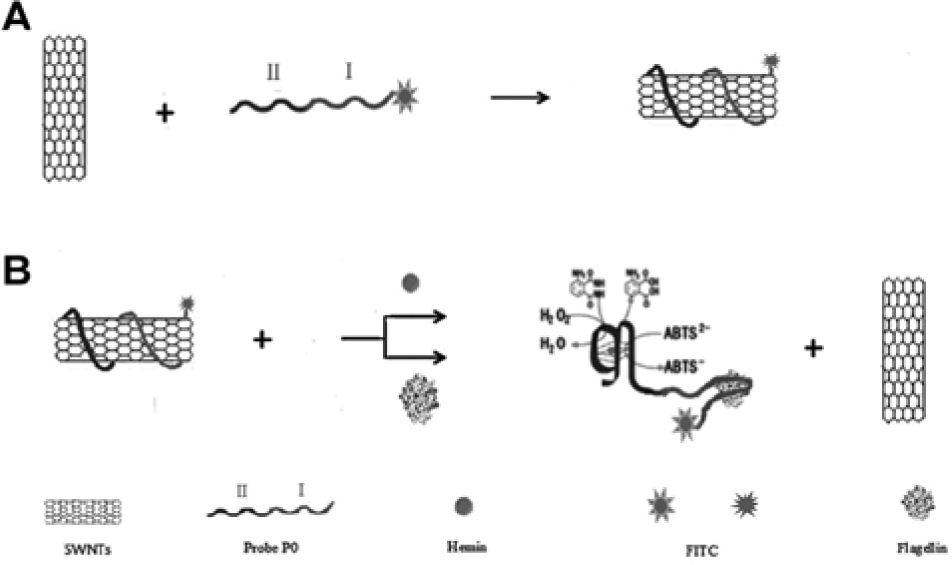
Schematic representation of the dual fluorescence-spectrophotometric platform for the detection of S. paratyphi A flagellin using aptamer3. (
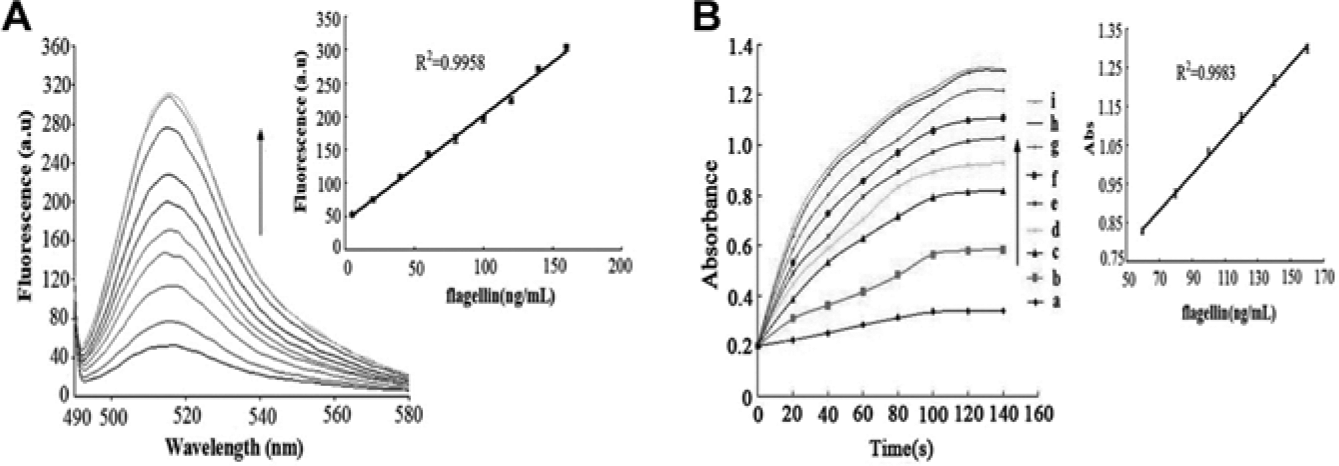
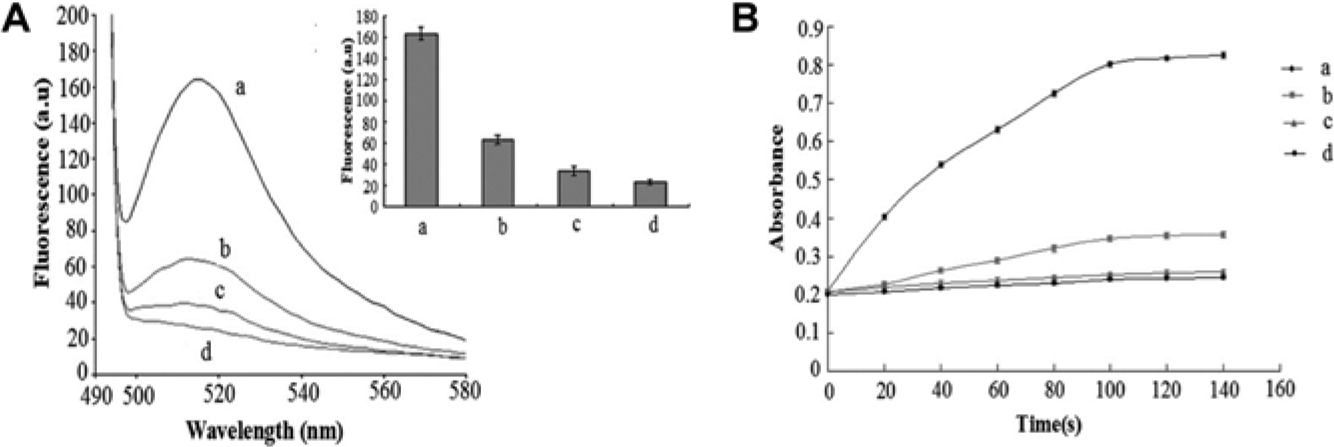
Quantitative detection of S. paratyphi A flagellin via simultaneous fluorescence-spectrophotometric method. (
The detection of the sample milk spiked with target bacteria with different concentrations. (
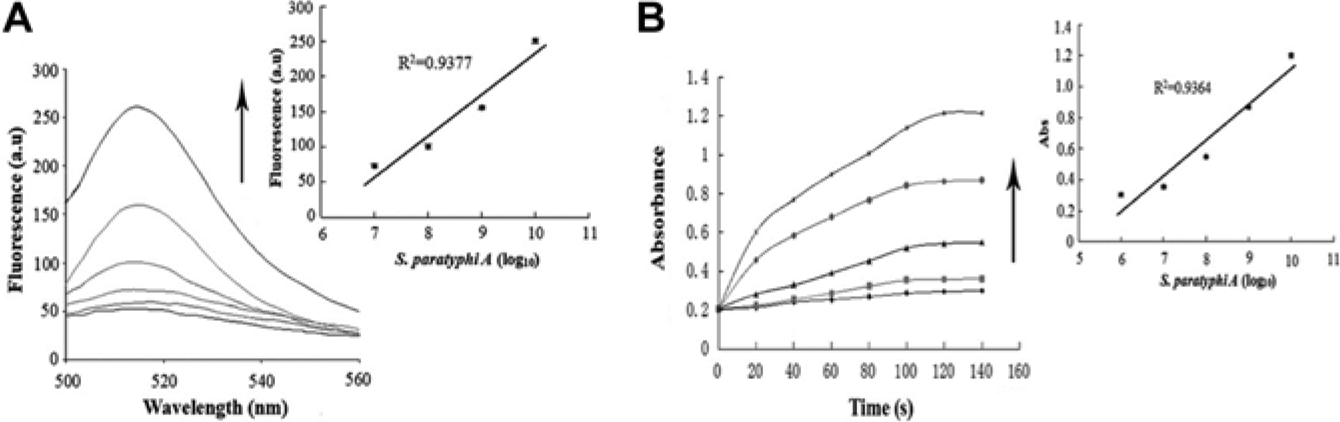
To test for selectivity, the fluorescent intensity of target flagellin was compared with nontarget proteins and found to be greater even when the concentrations of the control groups were twice that of the experimental group ( Fig. 5a ). The absorbance value changed similarly ( Fig. 5b ). These results suggested that only the target protein could enhance the fluorescent intensity and absorbance value of the solution, which, in this case, confirmed that the aptamers could specifically recognize the flagellin of S. paratyphi A and not nontarget proteins. Pathogen detection was also assessed, and it was found that the fluorescent intensity and absorbance triggered by S. paratyphi A were greater than that of nontargets ( Fig. 6a , b ). It should be stressed that our biosensor was highly selective and specific not only for S. paratyphi A flagellin but also for the bacteria itself, making the biosensor highly effective for pathogen detection and food safety control in the future. Compared with conventional methods, the biosensor was very sensitive to the addition of small volumes of the targets, and its detection limit was lower than enzyme immunoassays but similar to multiple PCR.29,30 As for selectivity, our biosensor and enzyme immunoassays could detect Salmonella bacteria with different serotypes but multiple PCR could not. Therefore, our new approach for Salmonella detection was simple, selective, and sensitive.
Dual signals triggered by different targets. (
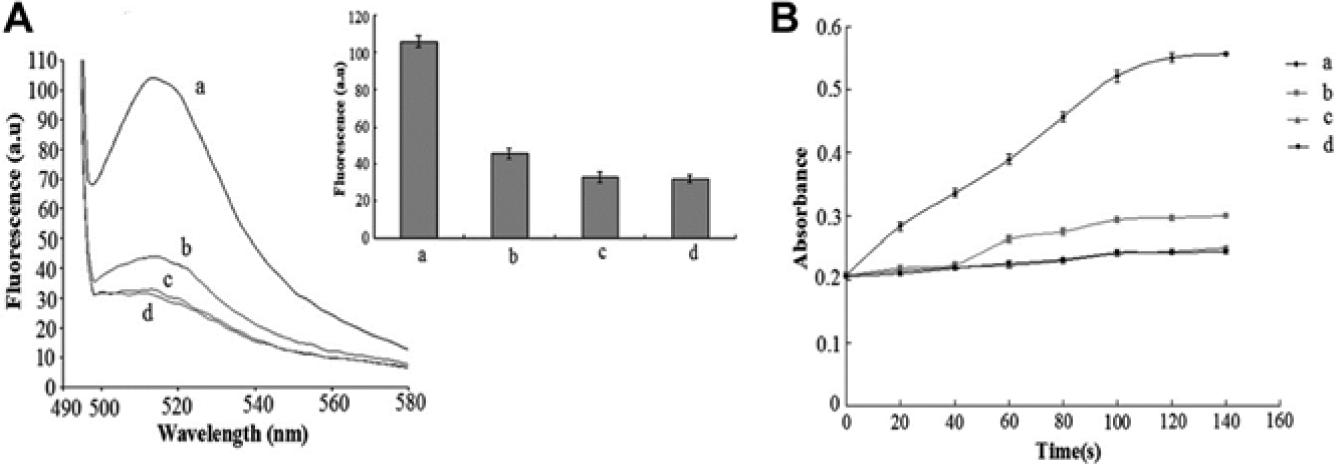
Specific detection of the sample milk spiked with S. paratyphi A compared with other bacteria strains. (
In conclusion, the ssDNA aptamers against S. paratyphi A flagellin were selected by employing asymmertric PCR-based SELEX. Four aptamers were authenticated with high affinities (Kd: aptamer1 = 49 ± 6 nmol/L, aptamer2 = 61 ± 7 nmol/L, aptamer3 = 27 ± 5 nmol/L, and aptamer4 = 65 ± 9 nmol/L). A simple and highly selective and sensitive fluorescence-spectrophotometric aptasensor has been developed for flagellin detection, with a low detection limit of 5 ng/mL for fluorescence and 20 ng/mL for spectrophotometry. The aptasensor, with its prominent fluorescence-spectrophotometric signal in cellular assays (low detection limits of 105 CFU/mL for fluorescence and 106 CFU/mL for spectrophotometry), was ideal for detecting real samples, such as S. paratyphi A. Furthermore, the simultaneous fluorescence-spectrophotometric method was more precise than current methods. Future work will focus on developing a kit for rapid detection of food-borne pathogens based on the simultaneous fluorescence-spectrophotometry.
Footnotes
Acknowledgements
We would like to thank National Natural Science Foundation (81271660) and the Specialized Research Fund of the Ministry of Education for the Doctoral Program of Higher Education (20114306110006), the Cooperative Innovation Center of Engineering and New Products for Developmental Biology of Hunan Province and A Project Supported by Scientific Research Fund of Hunan Provincial Education Department (09K021, 12K032) for the financial support.
Declaration of Conflicting Interests
The authors declared no potential conflicts of interest with respect to the research, authorship, and/or publication of this article.
Funding
The authors disclosed receipt of the following financial support for the research, authorship, and/or publication of this article: We would like to thank National Natural Science Foundation (81271660) and the Specialized Research Fund of the Ministry of Education for the Doctoral Program of Higher Education (20114306110006), the Cooperative Innovation Center of Engineering and New Products for Developmental Biology of Hunan Province, and A Project Supported by Scientific Research Fund of Hunan Provincial Education Department (09K021, 12K032) for financial support.
References
Supplementary Material
Please find the following supplemental material available below.
For Open Access articles published under a Creative Commons License, all supplemental material carries the same license as the article it is associated with.
For non-Open Access articles published, all supplemental material carries a non-exclusive license, and permission requests for re-use of supplemental material or any part of supplemental material shall be sent directly to the copyright owner as specified in the copyright notice associated with the article.