
Abstract
Gene-expression data are often used to infer pathways regulating transcriptional responses. For example, differentially expressed genes (DEGs) induced by compound treatment can help characterize hits from phenotypic screens, either by correlation with known drug signatures or by pathway enrichment. Pathway enrichment is, however, typically computed with DEGs rather than “upstream” nodes that are potentially causal of “downstream” changes. Here, we present graph-based models to predict causal targets from compound-microarray data. We test several approaches to traversing network topology, and show that a consensus minimum-rank score (SigNet) beat individual methods and could highly rank compound targets among all network nodes. In addition, larger, less canonical networks outperformed linear canonical interactions. Importantly, pathway enrichment using causal nodes rather than DEGs recovers relevant pathways more often. To further validate our approach, we used integrated data sets from the Cancer Genome Atlas to identify driving pathways in triple-negative breast cancer. Critical pathways were uncovered, including the epidermal growth factor receptor 2–phosphatidylinositide 3-kinase–AKT–MAPK growth pathway and ATR–p53–BRCA DNA damage pathway, in addition to unexpected pathways, such as TGF–WNT cytoskeleton remodeling, IL12-induced interferon gamma production, and TNFR–IAP (inhibitor of apoptosis) apoptosis; the latter was validated by pooled small hairpin RNA profiling in cancer cells. Overall, our approach can bridge transcriptional profiles to compound targets and driving pathways in cancer.
Introduction
Gene-expression profiling is used in various scenarios to characterize cells or tissues that are biologically dysregulated. Transcriptional changes may arise, for example, from treatment with a perturbagen, such as a compound or RNA interference (RNAi), or from disease-associated genetic disruptions. Despite an abundance of research attempting to infer changes in pathways reflected in differentially expressed genes (DEGs), less research has focused on interpreting transcriptional data in a way that sheds light on upstream causal nodes responsible for dysregulation. Oftentimes, causal nodes, such as drug targets, are challenging to predict because they are not themselves subject to transcriptional changes. 1 Nevertheless, DEGs are routinely input directly to gene set enrichment analysis, in which pathways have been defined by protein interaction sets. DEGs, however, better represent the effect rather than the cause of a perturbation. In this vein, it is more appropriate to identify nodes upstream of DEGs to predict the causes of biological dysregulation.
Predicting compound targets from expression data remains an unsolved challenge. In the seminal work describing the Connectivity Map (CMAP) approach, 2 gene-expression profiles of drugs were used to infer a mechanism by correlating a compound with reference signatures. Compound profile correlations can be used, in turn, to create a drug network in which densely connected nodes tend to group compounds by mechanism. 3 Additional throughput may be increased by reducing the number of genes in the signature but still providing enough information to predict a compound mechanism 4 or infer a global transcriptional response. 5
Increasingly, network-based methods are being applied to discovering drug targets. Causal modeling is a special branch of network science in which graph topology is used to explain downstream events based on upstream nodes. For example, knowing that protein A phosphorylates and activates protein B creates a directed graph with two nodes and a connecting edge. Such structures provide an opportunity to infer mechanistic relationships in a system as opposed to mere statistical correlations. 6 In Selventa’s reverse causal reasoning (RCR) approach, networks based on integrated “omics” molecular profiling data are computationally traversed with automated reasoning techniques to predict causal relationships in treated versus control measurements. 7 The result is a list of hypotheses, consisting of subnetworks connecting upstream and downstream nodes, which are evaluated in terms of “concordance” and “richness.” Importantly, RCR uses prior biological knowledge of molecular interactions as a scaffold to explain new data sets. Chindelevitch et al. also used prior knowledge from curated interactions with special emphasis on the stability of the method to network alterations. 8 In terms of large-scale drug mechanism-of-action prediction, Laenen et al. recently published a diffusion strategy that used either kernel-based random walks or diffusion to genes with similar connectivity structures in the surrounding network module to predict compound targets. 1 The authors found that predictivity was better for proteins than for small molecules, and nuclear hormone receptors were the easiest target class to predict.
Oftentimes in drug discovery, drugs may not be available for a particular disease indication, but gene-expression data are available from diseased tissues. In these cases, causal modeling from disease DEGs may provide pointers to new drug targets. In this vein, others have attempted network approaches to predict actual drug targets simply by scoring significant nodes in disease microarray data. 9 In work related to our approach, Goldenberg et al. created methods to identify network nodes that are highly influential on their neighbors’ expression. 10 Intriguingly, using both genes and protein interactions, the authors showed that many of the genes identified as influential and consistent among lung cancer cohorts were genes with significant second-order influence.
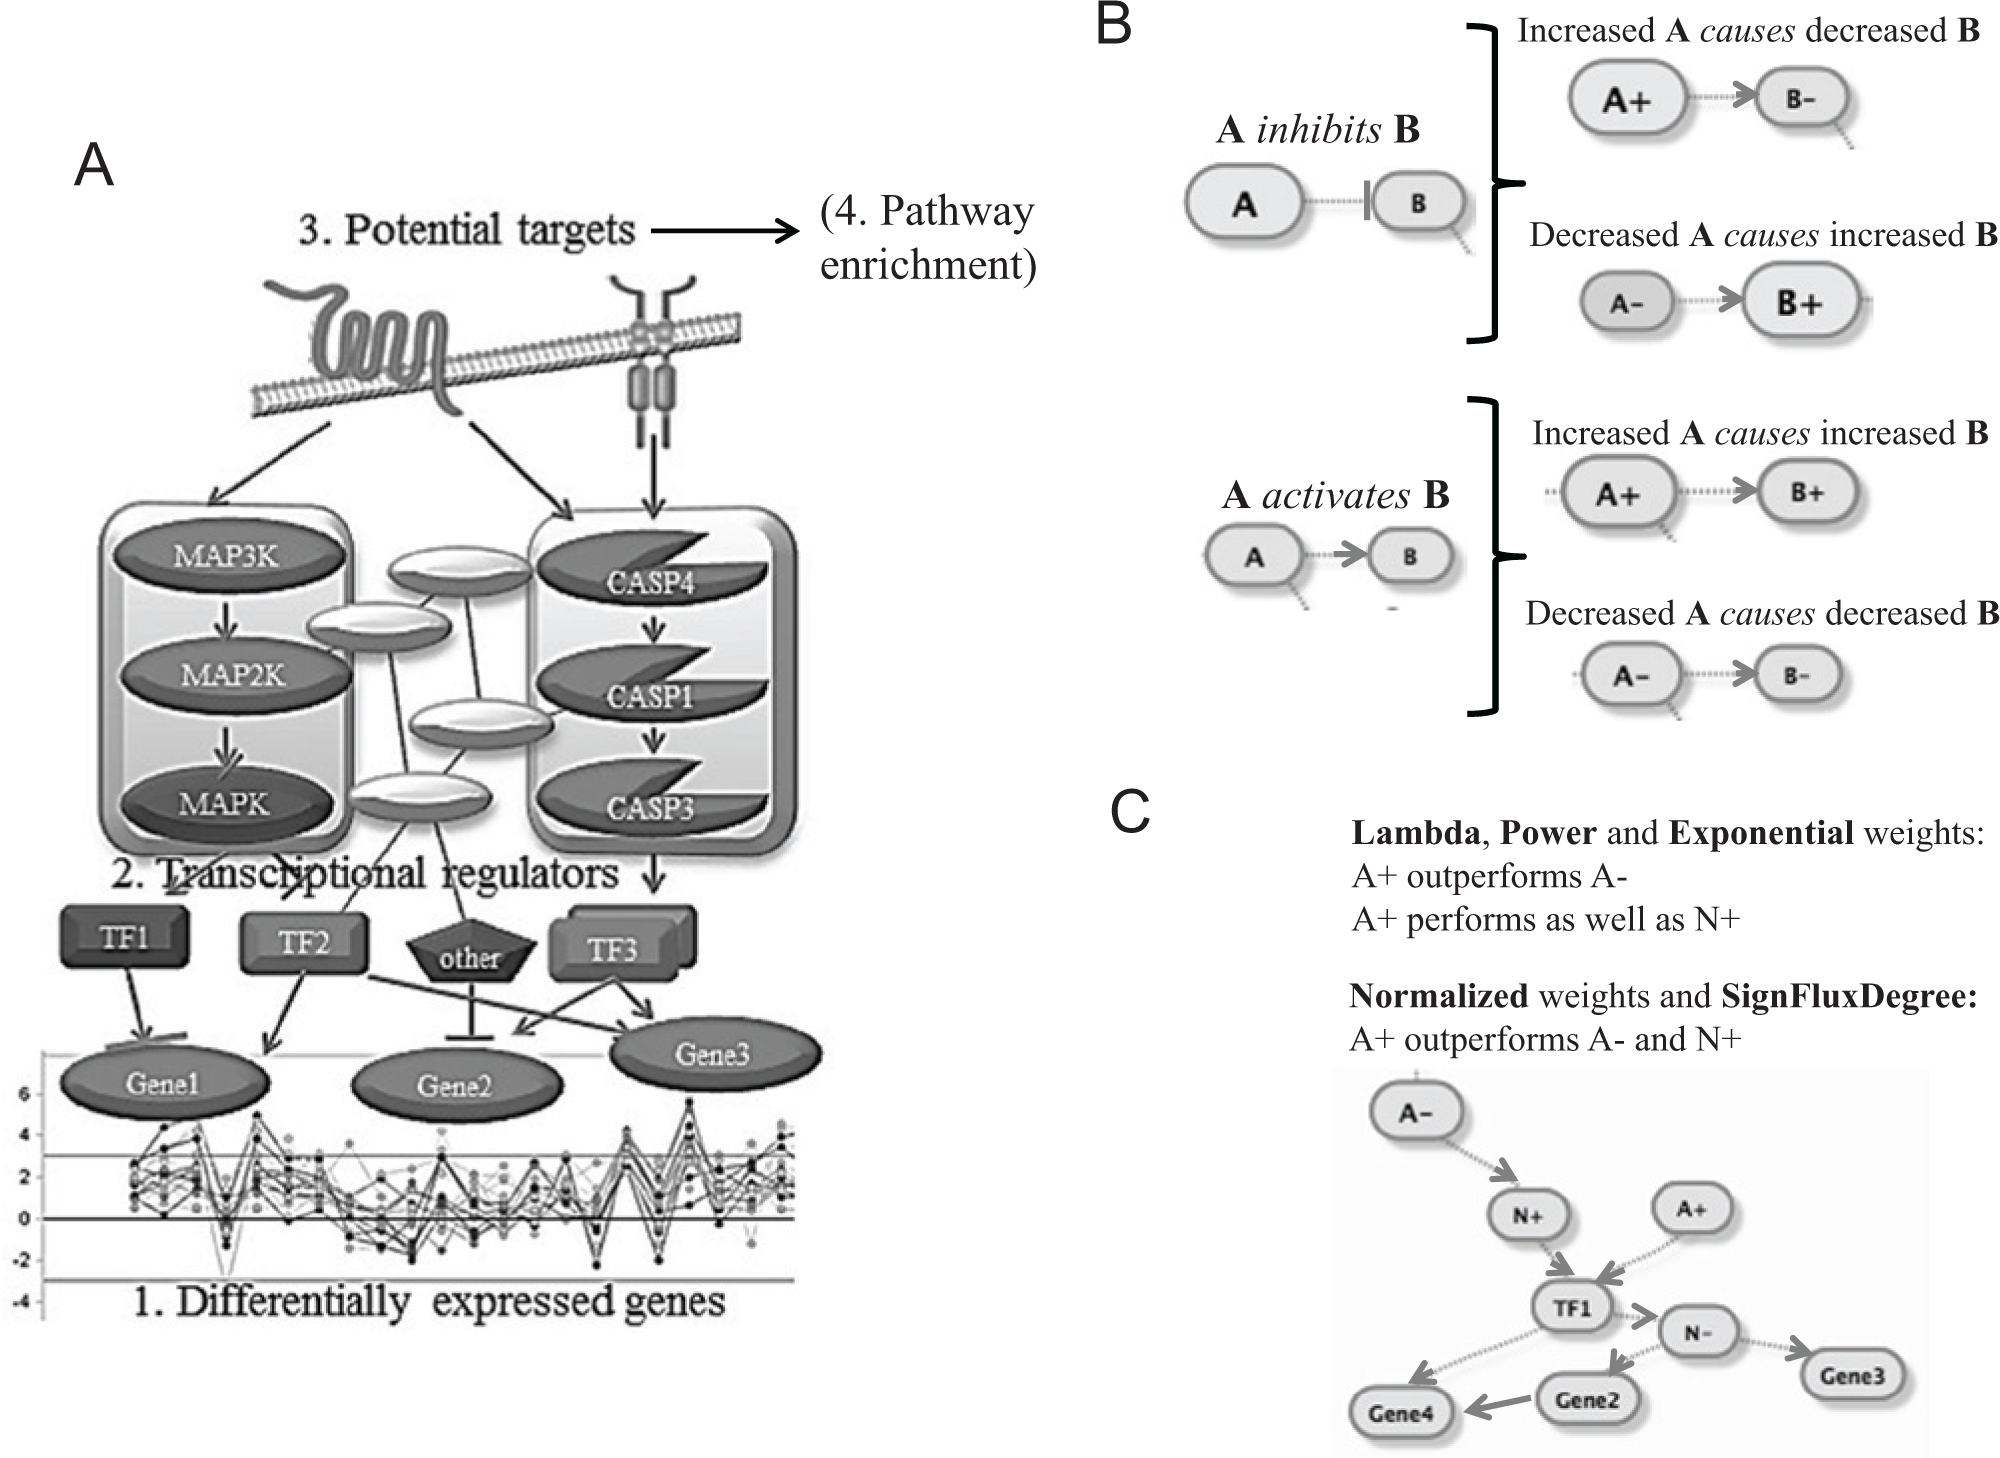
We postulate that target prediction from compound-treated samples is a related task to the prediction of potential influential nodes in diseased tissues. In the current study, we describe new approaches to predict causal nodes in a large, integrated network of curated interactions to explain downstream transcriptional changes ( Fig. 1A ). We attempt to find causal nodes in two orthogonal data types. First, we test a number of target prediction schemes on publicly available compound-treated microarray data from the CMAP. 2 We further assess whether causal hypotheses are more relevant as input for pathway-enrichment analysis than DEGs alone. Next, the best-performing algorithm for predicting targets from microarrays is applied to data sets from the Cancer Genome Atlas (TCGA) to predict causal nodes and pathways in triple-negative breast cancer (TNBC). TNBC is defined by the absence of expression of estrogen receptor 1 (ESR1), progesterone receptor (PR), and amplification of human epidermal growth factor receptor 2 (EGFR2 or HER2). TNBC remains a challenging disease with the poorest prognosis among all breast-cancer subtypes and no known molecular targets for this patient subgroup. Recent advances in genomic profiling have shed new light on the molecular heterogeneity of TNBC.11,12 But despite multiple targeted agents at various stages of development for this lethal subtype, clinical results have been disappointing. Clearly, new strategies are needed for target discovery in TNBC. Thus, to go beyond single genes and uncover topologically significant nodes in pathways hidden from direct analysis, we apply our network models to multiple TCGA profiling data sets and previously defined subtypes of TNBC.13,14 We are able to confirm several known and unexpected TNBC pathways, and we validate our inhibitor of apoptosis (IAP) pathway hypothesis by knockdown among breast cancer cell lines.
(
Materials and Methods
Drug-Specific Gene Signatures
Signatures for gene-expression changes on compound perturbation are derived from the CMAP.
2
The CMAP represents a collection of genome-wide transcriptional expression data from cultured human cells treated with compounds. CMAP2 contains more than 7000 expression profiles representing 1309 compounds. CMAP2 was done in batches, each batch with one cell line, and one array platform, with different compound treatment concentrations. All signature analyses were stratified by cell line, treatment, and concentration combination (see
Each signature is defined by its genes, the gene fold-changes of expression levels (representing the magnitude), and associated q-values (representing the significance). Only signatures with at least 10 significantly changing genes were considered in this study.
Networks
Networks were derived from different types of interactomes by combining Metabase (Thomson Reuters, New York, NY) and STRING DB v. 9.1
15
into a single text file containing node A, node B, the interaction direction, the interaction mechanism, and the source (see
In addition, canonical pathways from Metabase with highly confident interactions (referred to as “noodles” by GeneGo developers; personal communications, October 2011) were considered as part of this study. Because noodles describe high-confidence linear interactions, we sought to not penalize graph distances that occur within noodles. The noodles are thus rolled into knots, in which each member of a noodle is only one edge away from all of the other members of the noodle (see
Mathematical Directed Graph
The networks described in this article were processed and converted into mathematical directed graphs (using Accelrys PipelinePilot and the R iGraph library). Network models were written in R and executed with a GNU Parallel interface.
Every network node was represented twice in the graph, with a signed direction of “+” for up or “−” for down, reflecting the effect of the edges connecting node A to node B. For example, the relationship “the increase of node A increases the levels of node B” would be represented as “node (A+) directed to (→) node (B+)” and “node (A−) → node (B−)” ( Fig. 1B ). In contrast, the relationship “the increase of node A decreases the levels of node B” would be represented as “node A+ → node B−” and “node A− → node B+”. We will refer to these as “causal flows,” having in mind a loose definition of causality among biological entities. In this way, the edge’s direction and effect as described in this article are converted into another graph with directed edges. The second graph is written so that the effects are reflected in the signs of the nodes. In the cases of an edge effect being “unknown,” we treat with equal probabilities the “increase” and the “decrease” effects by generating signed nodes–edge combinations reflecting both of the effects. Also, because of the inherited symmetry in the second graph, the path from node A+ to node A− (in the case of negative feedback loops) also will be a path from node A− to node A+, connecting the nodes with the opposite signs. For example, the path “(A+) → (O+) → (A−)” (negative feedback loop) will be also present as a path “(A−) → (O−) → (A+).”
The path “(A+) → (O+) → (B−)” will be present as “(A−) → (O−) → (B+).”
This does not mean that the shortest paths (if any exist) for “(A+) … → … (B−)” and “(A−) … → … (B+)” will have the same length.
We define the distance from (A) to (A) as 0.
We annotate the opposite of signed node A as ¬ A (negation of A).
Schematic of How Causal Nodes Are Predicted
The significant signature genes are mapped onto the mathematical directed graph based on the sign of the gene-expression fold-change, in other words, a fold-change >0 for gene A will translate to (A+), and a fold-change <0 corresponds to (A−) (step 1 in the schematic; Fig. 1A ). Then, because these signatures reflect transcriptional changes, the edges for one-degree neighbors of the signature genes were filtered down to only the ones related to messenger RNA (mRNA) regulation or expression (step 2 in the schematic; Fig. 1A ). Each node from the graph is then assessed for how “well” it connects (by following the causal flow) to the significantly changing signature genes based on several scoring metrics ( Fig. 1C and legend). The node ranks from each scoring scheme are then combined into one, as explained in this article. The higher the rank, the higher the confidence that a hypothesized node will be a drug target.
In all cases, performance measures and graphs were compared to random predictions (see
Compound-Target Annotation
For the CMAP data set, we applied two different levels of compound-target annotations (see
We combined the mapped compound targets and the associated compound signatures with at least one predicted target. This resulted in a total of 204 signatures for 154 compounds from our Signature 1 approach and in 581 signatures for 191 compounds from our Signature 2 approach.
Network-Model Scoring Schemes, Parameters, and Performance
We explored the power of the directed graphs to predict compound targets based on gene-expression signatures. Different topological properties of the directed graph could have different effects on the ranking of compound targets that connect with the gene-expression signatures of interest. For this reason, we developed several network algorithms that rank each signed node in the directed graph for its ability to “predict” the gene-expression changes on compound perturbation under specific treatments, concentrations, and cell lines. We developed six algorithms, which differ in the way they rank each signed node of the directed graph. We refer to the six methods as Normalized Weights, SignFluxDegree, Lambda, Power Weights, Exponential Weights, and SigNet, with a minimum-rank consensus approach applied to Lambda, Power Weights, and Exponential Weights (see
Pathway Enrichment
For every gene list, pathway enrichments were calculated for Metacore maps [the false discovery rate (FDR) corrected; a p-value cutoff of 0.01; the maximum top 50 pathways reported; reported p-values are the p-values satisfying the FDR, not the q-values]. Enrichment was calculated in steps of 50 genes for each list (i.e., 50 genes, then 100, then 150, etc.). For the CMAP study, the enrichment process was applied to each CMAP treatment instance individually, in which the genes were ranked according to our best-performing method, SigNet.
Metacore maps were also used for pathway visualizations in
TNBC Design of Experiments
TCGA breast-cancer profiling data were obtained for RNAseq, methylation, and reverse phase protein array (RPPA) from the GDAC Firehose pipeline. 16 Consensus clustering using a nonnegative matrix factorization (NMF) algorithm of TCGA data was carried out (GDAC Firehose, Gene Pattern Consensus NMF; http://genepattern.broadinstitute.org), and the optimum number of clusters was determined based on the largest cophenetic correlation coefficient.
The most representative core samples of the clusters were identified based on positive silhouette width.16,17 Core samples were used to select differentially expressed markers for each cluster and platform by comparing the cluster versus the other clusters using Student’s t-test.
RNAseq and methylation-based differentially expressed markers were further filtered [q-value <0E-15, absolute difference of expression >0.5, and correlation coefficient between gene methylation and RNAseq profiles < (−0.2)].
Molecular-based subtypes of TNBC in TCGA were determined by running the TNBCtype tool. 18 The main subtypes BL, IM, and M+SML were further analyzed using the isoform-level RNAseq and RPPA data. Differentially expressed genes and proteins for each TNBC subtype were determined by two-way comparison to the non-TNBC tumor samples and matched normal. We applied the statistical method Limma with eBayes 19 for determining the significantly differentially expressed markers with contrast coefficient the TNBC subtype versus non-TNBC samples > 3 and contrast coefficient for subtype versus matched normal > 0.5. We also applied Benjamini and Hochberg’s method to control the FDR (adjusted p-value < 0.05). 20
Results
Performance of Signatures, Networks, and Scoring Methods
We first sought to combine compound-microarray data with molecular interaction knowledge to predict drug targets from gene-expression data. The CMAP data used in this study contain genome-wide microarray data for cellular compound treatment at multiple concentrations and cell lines. Supplementing this data set, we implemented two different DEG signature-generation approaches. Our causal-modeling approach relies on knowledge-based interaction networks that are used to interpret transcriptional changes. To better understand the influence of network construction on method performance, we used three different interactome data sets, including integrated commercial and public interactions (Metabase+STRING), only canonical linear networks (Noodles), or all of the above (Metabase+STRING+Noodles). Finally, we tried five different network-scoring schemes to predict compound targets as well as a minimum-rank approach that kept the consensus best rank for every target. “Canonical” compound targets (assigned in DrugBank or Integrity) were ranked among the entire human genome for each network type, for each network-scoring method, and for both DEG signatures generated for each treatment condition. For additional internal benchmarking, we also used compound target annotations that were unknown to DrugBank or Integrity but were derived from literature, patents, or legacy assays. These noncanonical targets may be considered novel targets arising from polypharmacology, indirect “assay readout targets” from cellular screens, or simply off-targets.
Performance assessment is based on receiver operating characteristic (ROC)-like measures of sensitivity and specificity, in particular how highly each method ranks in aggregate the known compound targets from every signature. First, we compared the three networks and two DEG signatures (
Fig. 2A
). Due to the practical difficulty of following up target hypotheses, we are most interested in method performance within the top 0.5% (rank < 179;
Fig. 2B
). To have equal comparisons, we only use a single scoring approach, the SigNet (minimum-rank) scoring method, which gives every target its best ranking from the scoring approaches. We observe that our implementation of a noodles-as-knots concept performs worse than the other networks that are larger and more inclusive in their interaction compositions. We also observe a marginal performance improvement in target enrichment for DEG Signature 2 within the top 1% (rank < 357;
Fig. 2B
). Within the top 0.5% (i.e., rank < 179), the best approach is the use of the combined Metabase+STRING network and our Signature 2 method to process the microarray gene changes, correctly predicting 49% of the 430 compound–target–signature associations. Notably, we also include a random ROC curve created by the randomization of target and signature assignments (see
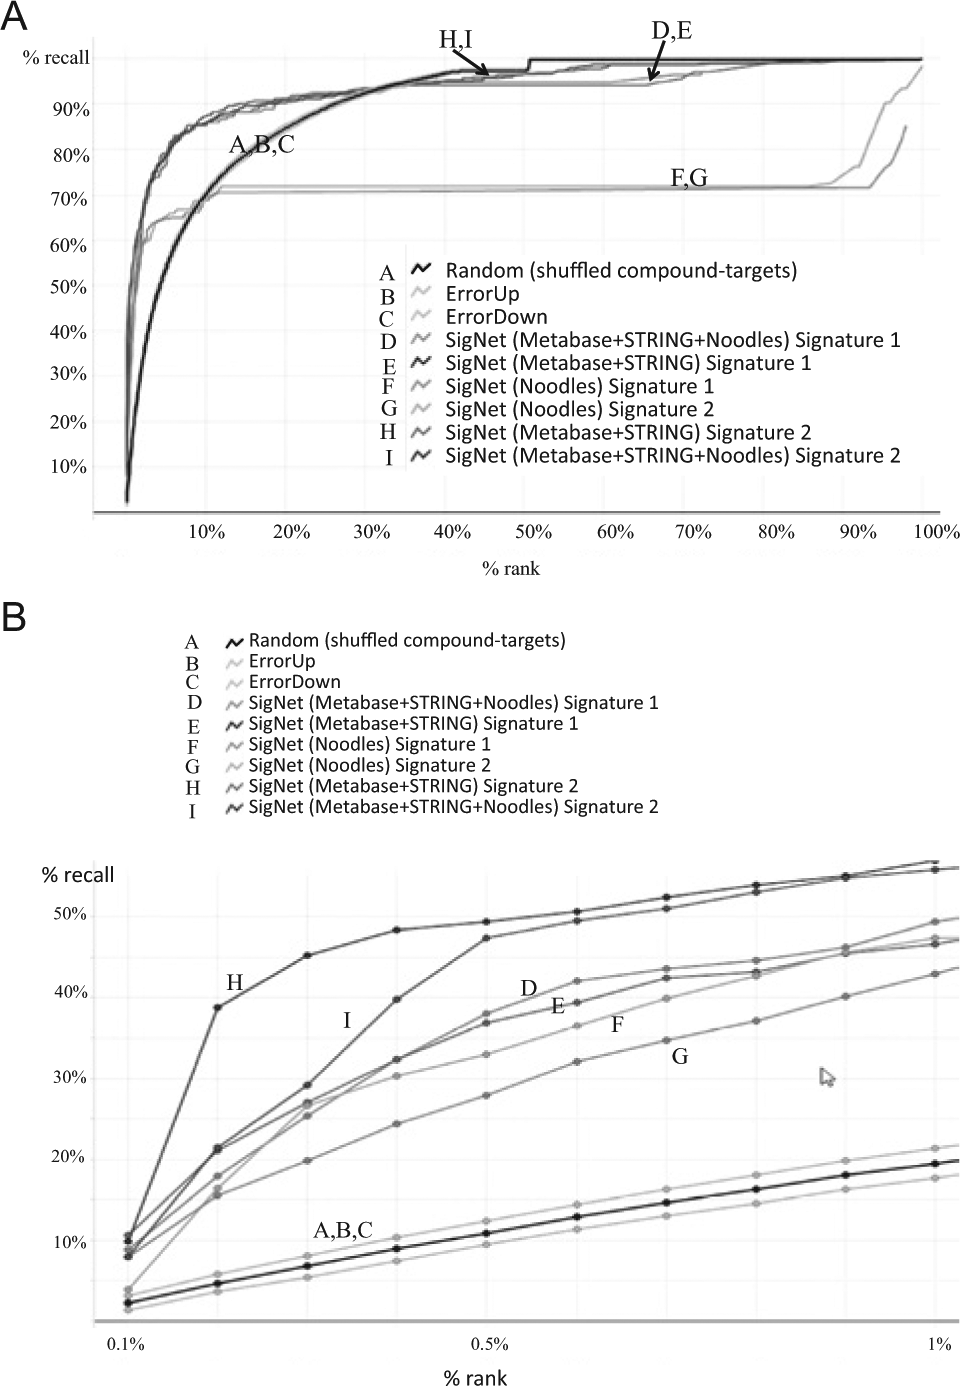
Network and signature performance. Enrichment of compound-canonical targets among the entire genome. (
Next, we examine our six scoring schemes using the Metabase+String network seeded with DEGs from Signature 2 ( Fig. 3A ). We find that the SigNet consensus method generates uniformly better performance than the rest of the methods and significantly outperforms random ranking methods within the top 1% of ranks ( Fig. 3B ). It also outperformed a consensus MeanRank (not shown). For the individual methods, Exponential Weights and Lambda give the best results, followed by the Power Weights method. None of the three best-performing methods, however, take into account the “sign of the path,” a concept used in Normalized Weights, SignFluxDegree, and other prior work. 15 It is possible that the curated networks in this study have different topological properties than the causal networks used in other studies. The Normalized Weights method performs very close to random for the top 5% of the ranks. This method does not score the length of the shortest path, but rather the “sign of the path” and the average fold-change for the signature genes.
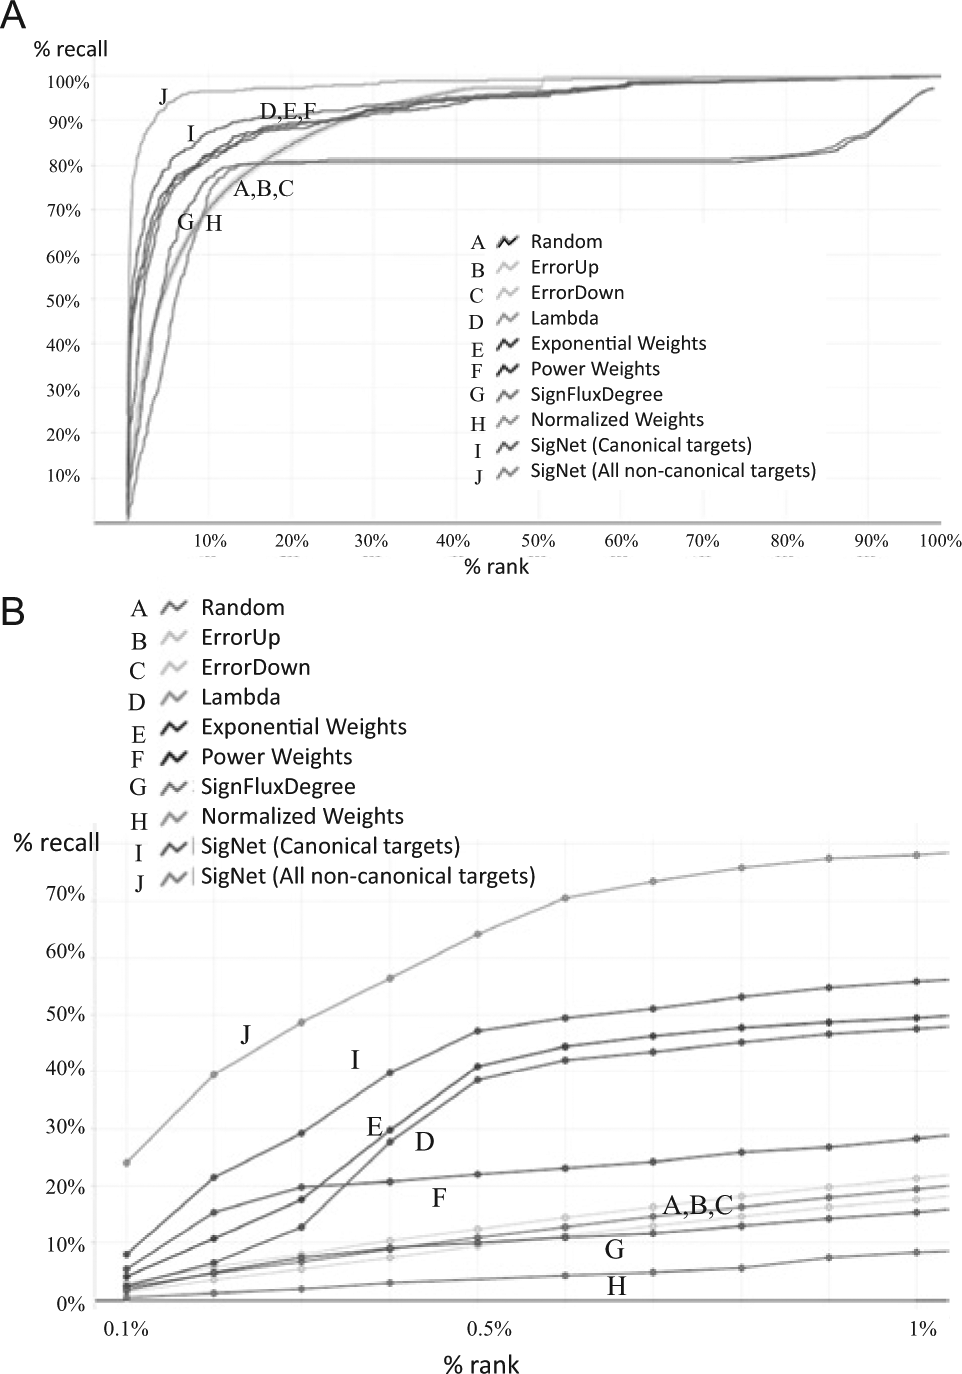
(
We next examined whether the confidence in target annotations influenced our predictions. We compared the accuracy of predicting well-established targets of the CMAP compounds with the accuracy of predicting additional compound targets published in literature and patents or in legacy Novartis assays. We find the SigNet method performs uniformly better for the more inclusive target annotations compared to using only well-established compound targets (
Fig. 3A
Compound-Target Prediction Examples
We began with 191 compounds that were mapped to one or more targets and input their DEGs from Signature 2 to our network models. We took the minimum rank of the three scoring methods that performed consistently significantly better than random within the top 1% ranks (i.e., Exponential Weights, Lambda, and Power Weights). From all possible compound–target mappings, we found 482 compound–signature–target triplets in the top ~0.5% of predictions (i.e., ranked in the top 170 genes) using our best method (SigNet, or minimum rank-score with the Metabase_STRING network). Of these, there are 172 unique targets (
A Selection of Correctly Predicted Compound–Target Pairs with Best Rank <100.
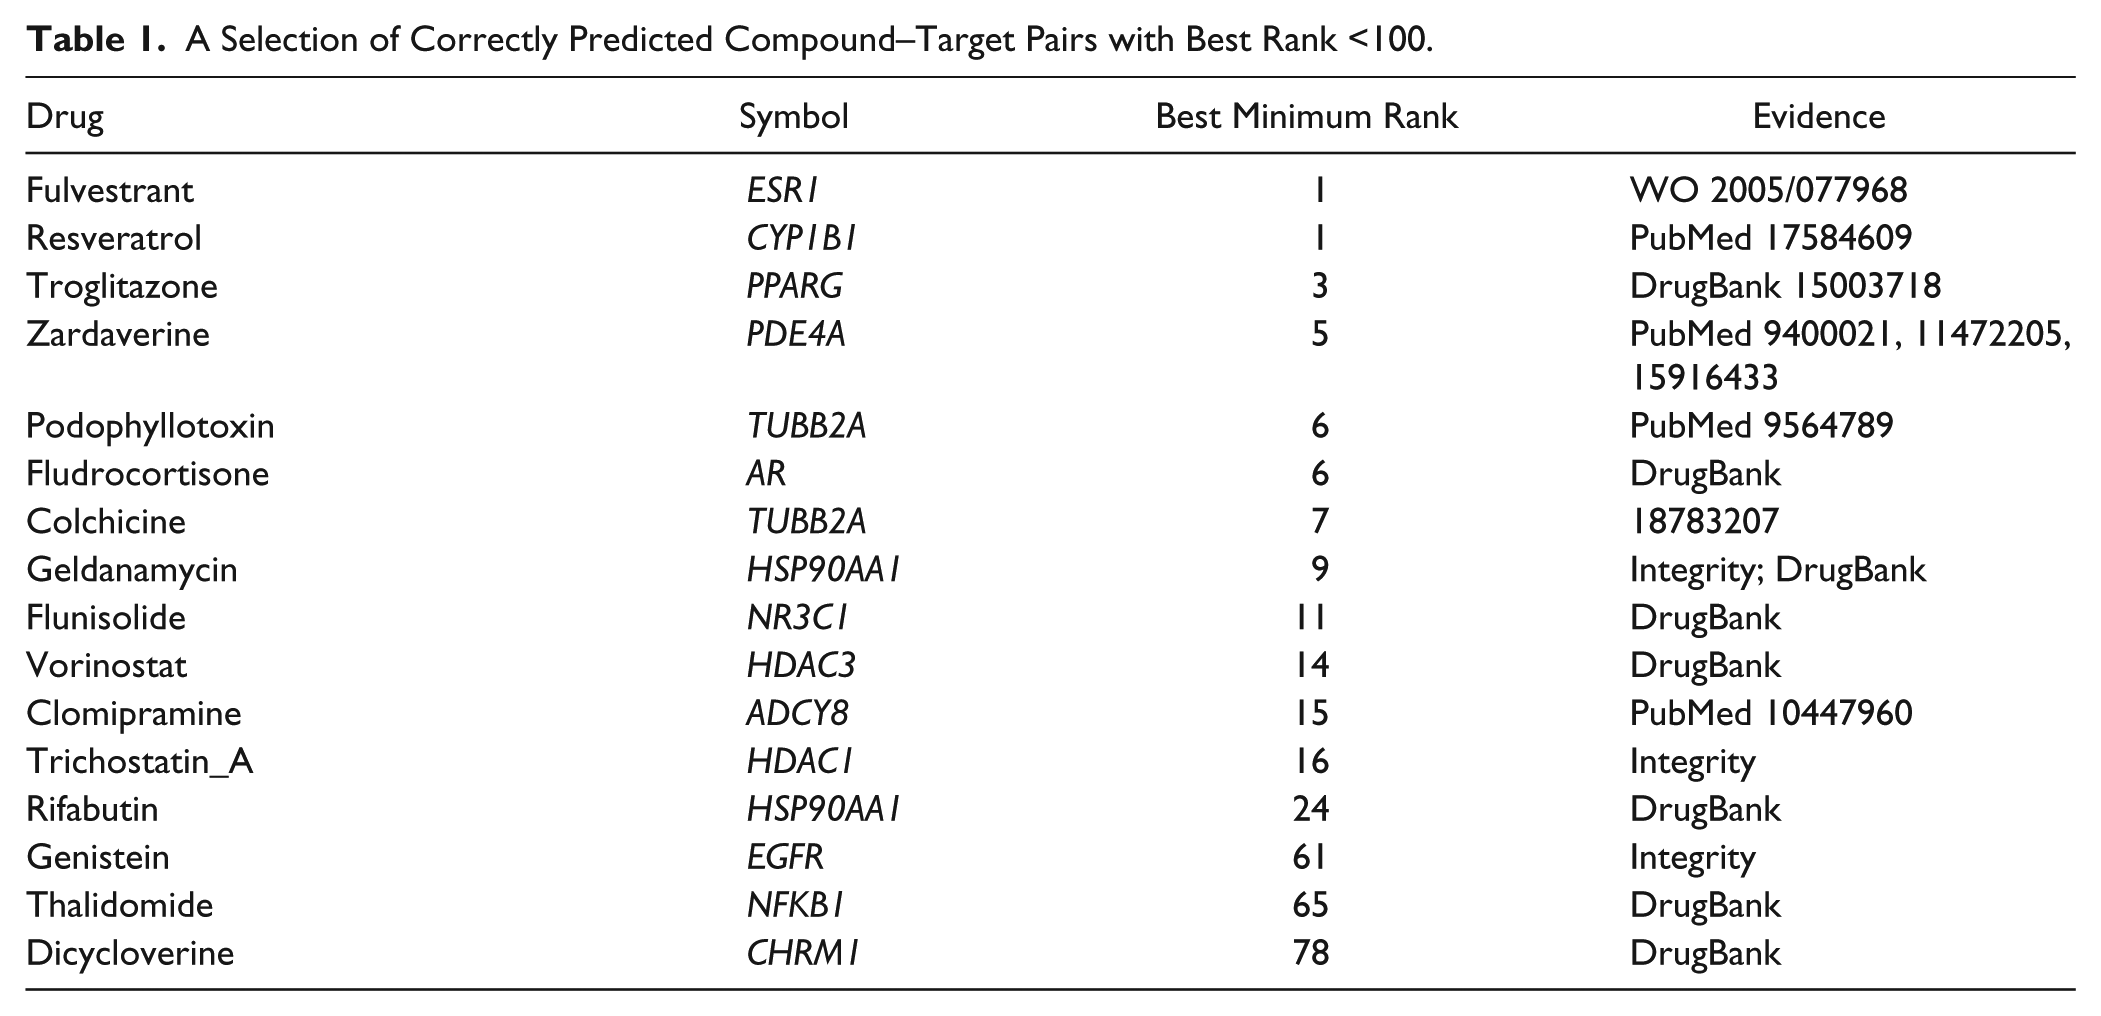
Aside from direct transcriptional regulators like nuclear hormone receptors, our causal modeling approach correctly predicted tubulin (TUBB2A) as a target for podophyllotoxin (ranked sixth) and colchicine (ranked seventh). Several DEGs are shared between podophyllotoxin and colchicine, including downregulation of NOP16 and upregulation of DUSP4, NR4A2, PPP1R16B, GPR183, CD86, TPM4, and TUBB2A. The two compounds also share many upstream nodes in common, such as ACTB and HSPA4, which are highly connected to the DEGs in the signatures. To better understand the hypothesis network leading from the differentially expressed genes for these compounds to tubulin, we plotted the network of interactions between genes moving up or down on compound treatment and the upstream pathway nodes (
Multiple compounds that were polyphenolic flavonoid natural-product scaffolds, such as resveratrol, quercetin, and luteolin, were correctly predicted to have CYP1B1 as a target. CYP1B1 is a monooxygenase involved in metabolism of xenobiotics such as polycyclic aromatic hydrocarbons. We observe that genes with altered transcription in response to flavonoids are highly connected to CYP1B1 enzymes upstream in our network models.
Another validated prediction from Table 1 is clomipramine and adenylyl cyclase 8 (ADCY8). Clomipramine is given as an antidepressant and anxiolytic, and for treating obsessive-compulsive disorder. The drug is primarily thought of as a modulator of SLC6A4 sodium-dependent serotonin transporter, although it is also known to potently target adenylyl cyclases. 23 ADCY8 is differentially expressed in specific brain regions of mice that differ in avoidance behavior levels. Moreover, chemical modulation of adenylyl cyclase reduced mouse avoidance behavior. 24 Together with prior pharmacology data, our connectivity between clomipramine-induced gene changes and ADCY8 suggests that this target might be more broadly considered as part of the drug’s therapeutic mechanism.
Target Prediction by Pathway Enrichment: DEGs versus Causal Hypotheses
Given the enrichment for compound targets among the network nodes upstream of the compound-induced DEGs, we surmised that pathway-enrichment analysis on the upstream nodes would provide important and divergent information from pathway-enrichment analysis on DEGs. For each signature, we determined the top 10 most significantly enriched pathways starting from either (1) DEGs resulting from compound treatment or (2) highly ranked network nodes upstream of DEGs. To judge success, we determined the number of significant pathways that contained known compound targets, which enables us to “recover” hidden targets not found directly among the DEGs or causal nodes.
First, it is critical to note that in only 29 out of 191cases (15%), the drug target’s expression level itself changed on drug treatment, reinforcing the notion that looking at transcriptional gene changes alone is not usually sufficient for identifying protein targets of compounds.
Using DEGs as input, we could recover targets for only 8% of compounds (16 out of 191 compounds with 17 unique targets). In contrast, when using causal nodes from SigNet as input, pathway-enrichment analysis could recover targets for 46% of compounds (87 out of 191 compounds with 77 unique targets). Thus, SigNet finds around five- to sixfold more targets by pathway analysis than the traditional approach of pathway enrichment using DEG lists. Notably, all 16 compounds for which we could recover targets with DEGs as input are entirely a subset of the compounds with targets recovered by SigNet.
Despite the advantage of pathway enrichment using causal network nodes rather than DEGs, we still recall the most compound targets directly among the top-ranked causal network nodes. Presumably, in many cases, the pathways that are most enriched exclude some known compound targets. Understanding the upstream pathways that are enriched among causal-node hypotheses, however, remains useful for biological interpretation of profiling data. We suggest that there is a trade-off between the interpretability of curated pathway maps and the accuracy of compound-target predictions based on the whole network, a gap that may close in the future as pathway curation captures cellular networks more holistically.
Applying the Network Methods to Signatures from TNBC Subtypes
Because our causal network-modeling approach is able to enrich for compound targets that drive a transcriptional response on perturbation, we next sought to assess whether the same approach could be repurposed to predict driver nodes in cancer. Furthermore, we wanted to assess the integration of diverse profiling data sets rather than gene expression alone. We first analyzed breast invasive carcinoma (BRCA) data sets obtained from TCGA for three platforms: RNAseq, DNA methylation, and RPPA as obtained from GDAC Firehose pipeline.
16
On applying nonnegative matrix factorization (NMF), we observed that the samples corresponding to TNBC stably clustered for each profiling data set (
Next, we used the differential markers from our triple-negative (TN)-containing clusters as a subset of the BRCA from all three data platforms for network modeling. As with the CMAP exercise, we generated network-based ranking of the top hypotheses linked to the differential-marker signatures from each profile. We determined enriched pathways for both the causal hypotheses and differential-marker signatures (
Meta-Analysis of Common Pathways among Platforms
Having assessed the entire BRCA data set, we next sought to examine the inherent heterogeneity within TNBC by incorporating previously defined subtypes, specifically those reported by (1) Perou in Prat et al. 14 , and (2) Lehmann et al. 13
The Perou signatures defined three major subtypes in TN known as Basal, HER2E, and LAR (luminal androgen receptor).
The TNBCtype tool allowed us to define TN subtypes in TCGA. The main classes we identified were for IM (Immunomodulatory), BL1 (Basal-like 1) merged with BL2, and M (mesenchymal) merged with MSL (mesenchymal stem–like) subtypes. We compared each of these three major TN subtypes to the rest of the breast-cancer tumors—which do not overlap with the extended definition of TN tumors—and derived gene signatures for each major subtype. The comparisons were done on RNAseq isoforms as well as on RPPA levels for the TCGA tumors with matched normal.
From the above signatures, we generated network-based causal hypotheses. Then, to interpret the many causal predictions, we explored them together on a pathway level. We investigated enriched pathways for both the causal nodes and gene signatures. The pathway-similarity approach in principle can uncover pathways on which both the causal hypotheses and differentially expressed genes (which are sometimes the causal hypotheses themselves) converge. Thus, we also applied pathway-similarity statistics (kappa
26
) on the combined signatures and causal hypotheses to understand the most significantly predicted pathways as well as pathway concordance among signatures, as exemplified for the Basal-like subtype (
Fig. 4
) and IM subtype (
Fig. 5A
), which complement the IM subtype pathway enrichment with gene signatures as input only (

Most significant pathways in the Basal-like subtype of triple-negative breast cancer (TNBC). Shown are the top 10 significantly enriched pathways based on both causal nodes and gene signatures. The top pathway, DNA damage ATM–ATR, is further explored in
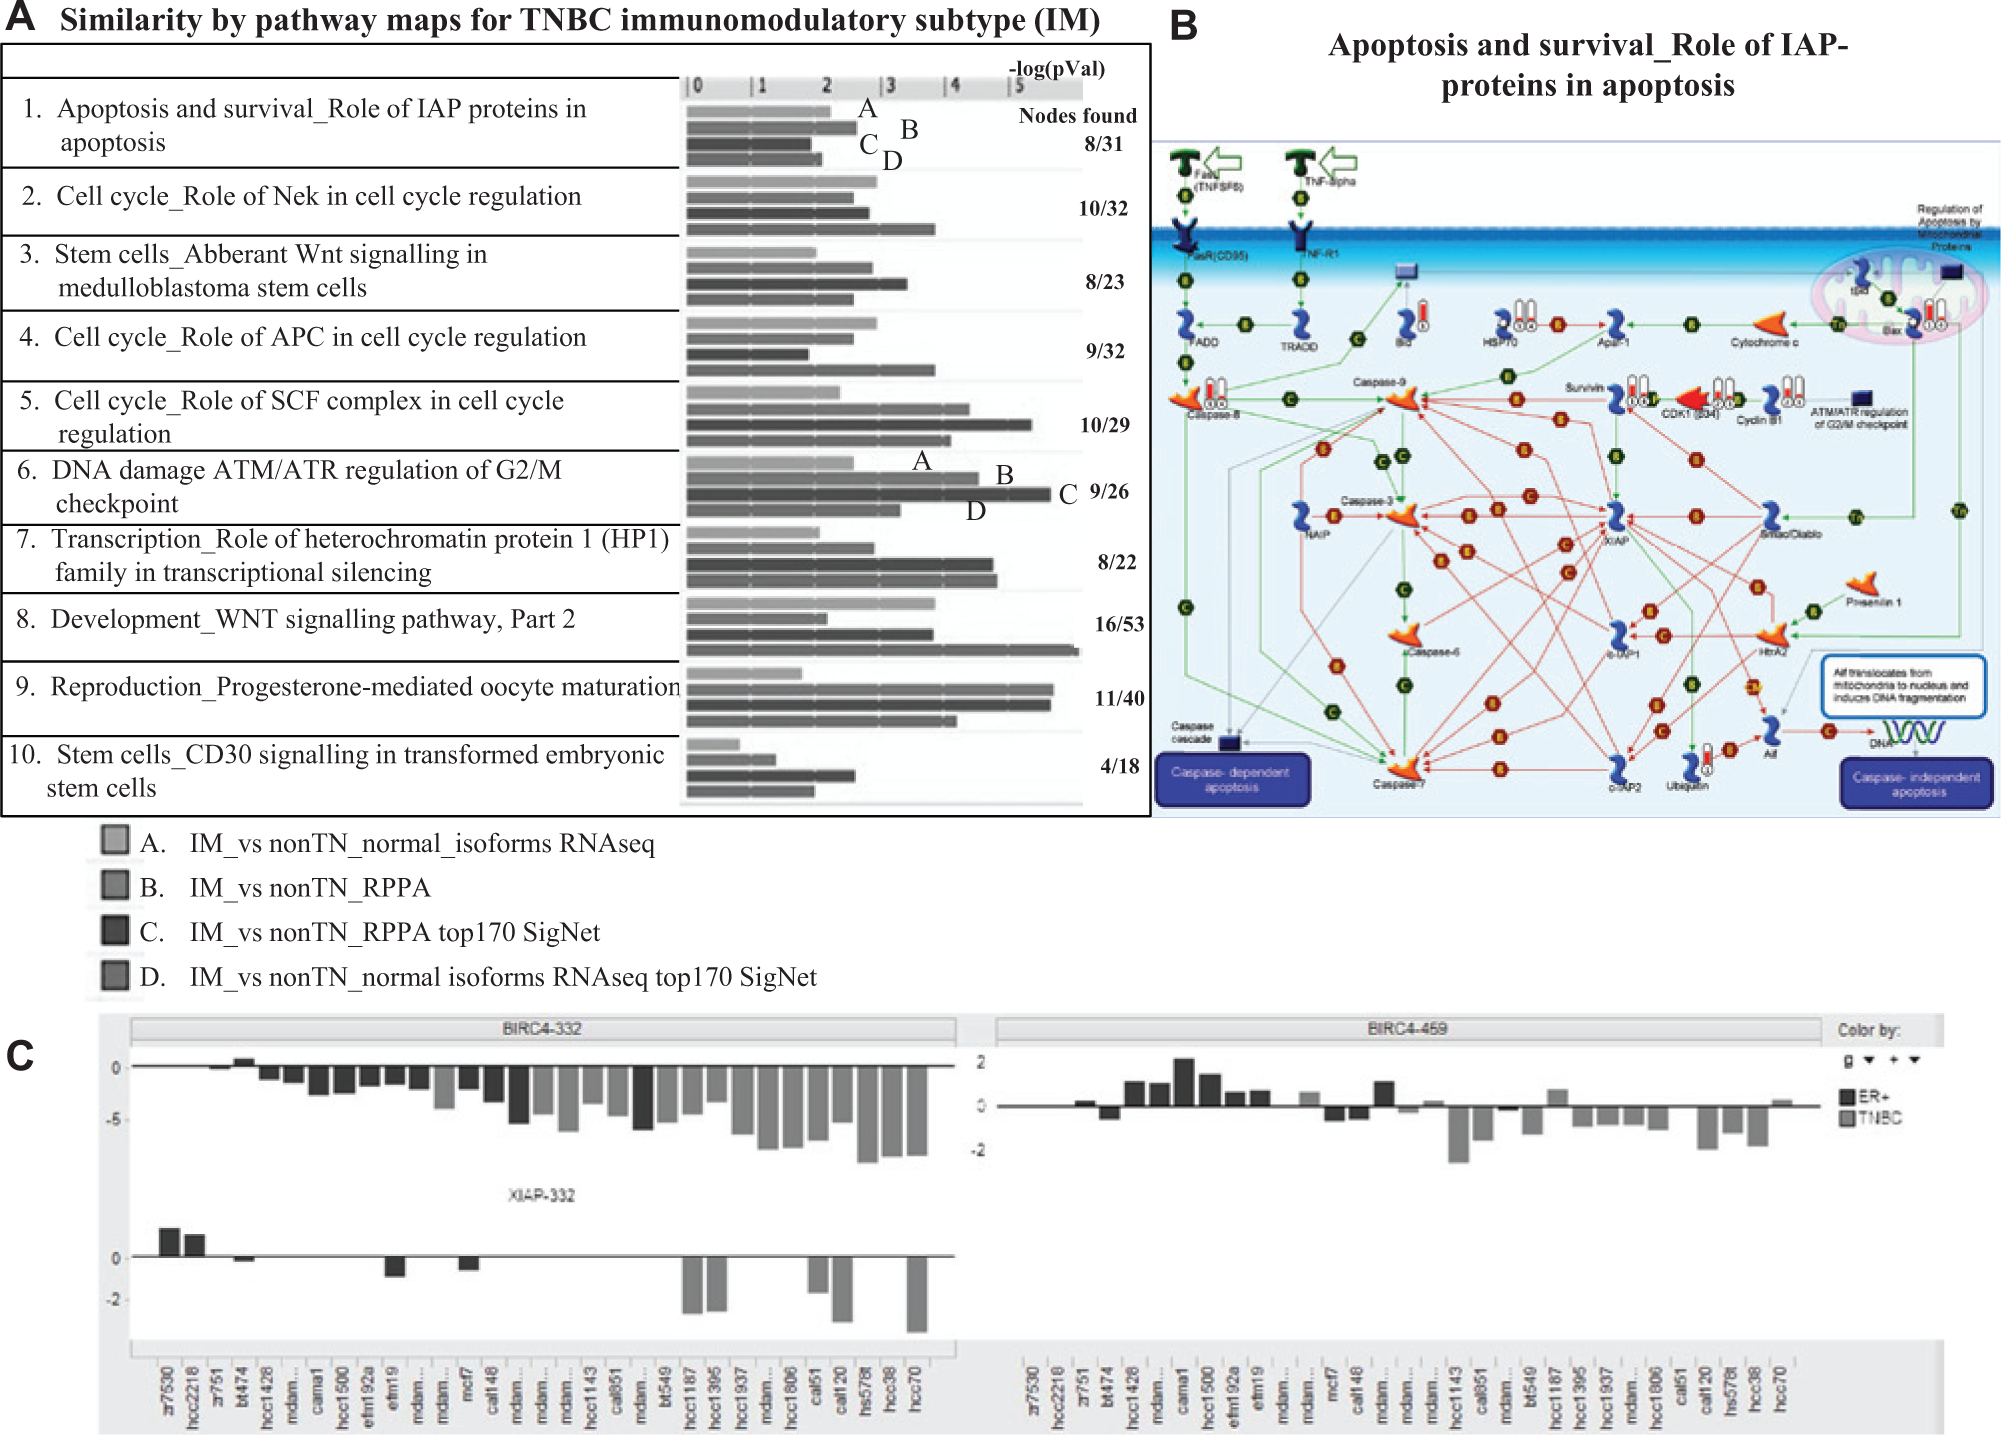
Evidence for the tumor necrosis factor–inhibitor of apoptosis (TNF–IAP) apoptosis pathway in triple-negative breast cancer (TNBC). (
Discussion
In this study, we applied causal graph-based analysis of curated interaction networks as a framework to interpret profiling data. For compound-target prediction from gene expression profiles, we observed that larger, more comprehensive networks consisting of both canonical and noncanonical pathway interactions were more helpful to construct a directed graph for predicting causal, upstream compound targets. This may be because the noodle-based graph is much sparser, and many important relationships are not captured. Alternatively, canonical relationships may not be more influential than noncanonical ones and should not get special weight in the causal modeling. This is exemplified by
Our two DEG signature-generation methods did not have a major impact on overall performance compared to the differences in performance that network methods had. Three of the network scoring methods worked better than the other two that incorporated “sign of the path” rules in their scoring. In other words, giving high emphasis to the shortest path flow versus longer paths was less accurate at target prediction. This may suggest that the existence of a biological interaction (A→B) is a more fungible relationship than a directed effect (A→B), which may be more condition dependent. Our three most successful methods put more emphasis on the “reachability” of the upstream nodes to signature genes, allowing for the magnitude of the gene changes to influence the network models to various degrees. Thus, with our experimental setup, network topology was more important than shortest path flow. Finally, simple voting methods combining the different assumptions about network reachability, shortest paths, and DEG fold-changes significantly outperformed the individual methods.
We observed that the targets of drugs are not often themselves transcriptionally altered by drug treatment (15% of compounds). In addition, genes differentially expressed on compound treatment are not particularly good inputs to pathway-enrichment algorithms in that they do not often enrich for pathways containing compound targets (8% of compounds). These observations are because target perturbation is fundamentally an event that is upstream of gene changes. Thus, reconstructing the upstream nodes of resultant gene changes should provide a better set of proteins to use for pathway-enrichment analysis. Indeed, for 46% of compounds, enriched pathways from SigNet upstream nodes contained known drug targets. We therefore suggest that genes found by pathway enrichment starting from DEG lists are unlikely to point to the actual molecular targets of compounds and that approaches like SigNet provide better inputs for pathway analysis.
To further explore applications of our network models in disease settings, we chose the TNBC subtype of breast cancer because it remains the only clinical subtype for which we have no effective targeted therapy. Distinct from previous studies, we applied an integrative network analysis to TCGA breast-cancer mutation, copy number, mRNA, and proteomic profiling data sets. We reaffirmed that the most critical pathway in TNBC is the cell cycle and DNA-damaging pathway (
Figs. 4
Perhaps the most unexpected critical pathway within TNBC that we identified was the TNFα–IAPs apoptosis pathway. IAPs are key regulators of apoptosis and block apoptosis from both the intrinsic and extrinsic pathways. Relieving the inhibition of apoptosis by the IAP proteins may provide an avenue for the reactivation of cell death. Importantly, our follow-up shRNA validation studies showed growth inhibition of 15 TNBC cell lines when knocking down XIAP. The most successful approach to date for targeting IAPs has been the design of small-molecule second mitochondrial-derived activator of caspases (Smac) mimetics. In preclinical studies, Smac mimetics show single-agent activity in a subset of human breast-cancer cell lines in vitro and in vivo. 29 Furthermore, the triple-negative subtype of human breast cancer appears to be particularly sensitive to Smac mimetics. Importantly, Smac mimetics show broad synergistic activity in combination with agents targeting the death receptors, such as TNFα and TRAIL, as well as with conventional chemotherapeutic agents and certain tyrosine kinase receptor inhibitors. To date, six Smac mimetics have advanced into clinical development. Initial clinical data suggest that these compounds are well tolerated in patients with advanced cancer and demonstrate initial evidence of antitumor activity, including tumor regression and stable diseases. Additional clinical trials (NCT01617668, NCT01078649, and NCT01930292) are being conducted to test IAP inhibitor combination with conventional anticancer drugs in patients with TNBC, a strategy that is scientifically supported by the current study.
While we are waiting for the results of those clinical trials, the network models applied in this study may provide one of the platforms for rationally designing combinations at both vertical and horizontal pathway levels. One such case is PARP inhibitors to target the DNA-damaging pathway in combination with PI3K inhibitors to target the critical growth pathway. Experimentally, in a Brca1-deficient rodent model of mammary basal carcinoma, Juvekar et al. recently demonstrated dramatic tumor shrinkage owning to combination treatment with the pan-PI3K inhibitor BYM and a PARP inhibitor, Olaparib. 30 A Phase I clinical trial was recently launched to test this in clinical settings.
Given the marked molecular and clinical heterogeneity of TNBC, molecular subtyping may be essential to identify driving pathways in a subset of patients who share a common genetic background. The novel critical pathways identified in the present study are worth further exploration not only for new target discovery but also for rational target combinations and for better understanding mechanisms of resistance to either standard-of-care or targeted therapies.
In conclusion, we used knowledge-based interaction networks as a framework to interpret molecular profiling data together with causal network approaches. Upstream nodes can help identify compound targets as well as pathways dysregulated in cancer, and provide a basis for more relevant pathway-enrichment analysis.
Footnotes
Acknowledgements
We thank Wolfgang Hackl, Doug Selinger for mentoring of Janna Hutz, Wendy Broom, Eugen Lounkine, Adam Hill, Somnath Bandyopadhyay, and Joe Loureiro for helpful conversations and collaborations.
Declaration of Conflicting Interests
The authors declared no potential conflicts of interest with respect to the research, authorship, and/or publication of this article.
Funding
The authors received no financial support for the research, authorship, and/or publication of this article.
References
Supplementary Material
Please find the following supplemental material available below.
For Open Access articles published under a Creative Commons License, all supplemental material carries the same license as the article it is associated with.
For non-Open Access articles published, all supplemental material carries a non-exclusive license, and permission requests for re-use of supplemental material or any part of supplemental material shall be sent directly to the copyright owner as specified in the copyright notice associated with the article.