
Abstract
Kaposi’s sarcoma–associated herpesvirus (KSHV) has a causative role in several human malignancies, especially in immunocompromised hosts. KSHV latently infects tumor cells and persists as an extrachromosomal episome (plasmid). KSHV latency-associated nuclear antigen (LANA) mediates KSHV episome persistence. LANA binds specific KSHV sequence to replicate viral DNA. In addition, LANA tethers KSHV genomes to mitotic chromosomes to efficiently segregate episomes to daughter nuclei after mitosis. N-terminal LANA (N-LANA) binds histones H2A and H2B to attach to chromosomes. Currently, there are no specific inhibitors of KSHV latent infection. To enable high-throughput screening (HTS) of inhibitors of N-LANA binding to nucleosomes, here we develop, miniaturize, and validate a fluorescence polarization (FP) assay that detects fluorophore-labeled N-LANA peptide binding to nucleosomes. We also miniaturize a counterscreen to identify DNA intercalators that nonspecifically inhibit N-LANA binding to nucleosomes, and also develop an enzyme-linked immunosorbent assay to assess N-LANA binding to nucleosomes in the absence of fluorescence. HTS of libraries containing more than 350,000 compounds identified multiple compounds that inhibited N-LANA binding to nucleosomes. No compounds survived all counterscreens, however. More complex small-molecule libraries will likely be necessary to identify specific inhibitors of N-LANA binding to histones H2A and H2B; these assays should prove useful for future screens.
Keywords
Introduction
Kaposi’s sarcoma (KS)-associated herpesvirus (KSHV) has a causative role in KS, primary effusion lymphoma (PEL), and multicentric Castleman’s disease (MCD). 1 KSHV establishes long-term latent infection and persists in cell nuclei as a multicopy, circular, extrachromosomal episome (plasmid). During latent infection, only a small subset of viral genes is expressed. Prominent among these genes is the latency-associated nuclear antigen (LANA).
LANA is an 1162-amino-acid protein that is essential for viral persistence in infected cells. 2 It is necessary and sufficient for KSHV episome persistence in the absence of other viral genes. 3 LANA acts as a molecular tether to bridge KSHV DNA to mitotic chromosomes and thus effect efficient episome segregation to daughter nuclei. Such mechanisms are also used by EBNA1 of Epstein–Barr virus (EBV) and E2 of papillomavirus, which tether their respective genomes to chromosomes to effect efficient segregation during mitosis.4,5
N-terminal LANA attaches to chromosomes by binding histones H2A and H2B, whereas C-terminal LANA binds specific sequence in KSHV terminal repeat (TR) DNA.6–9 The nucleosome core particle consists of an octameric assembly of two copies each of histones H2A, H2B, H3, and H4, wrapped in 147 base pairs of DNA. Genetic and structural studies have shown that residues 1–23 at the N-terminal end of LANA are critical for the binding to histones at a conserved acidic region on the nucleosome surface.6,7 This region has been described as having a role in chromatin compaction. In the absence of LANA binding to histones H2A and H2B, episomes are no longer maintained.6,7
To date, there are no drugs specifically directed against KSHV latent infection. Currently, three FDA-approved systemic agents are available for treatment of KS, PEGylated liposomal doxorubicin, liposomal daunorubicin, and the taxane paclitaxel. These agents are, however, cytotoxic and not specific to KS. Response rates are limited, and most patients with KS progress within 6–7 months of treatment and require additional therapy.
Tumor cells are dependent on latent KSHV infection for viability, and LANA is essential for KSHV latent infection. Small molecules that disrupt N-terminal LANA binding to histones H2A and H2B are expected to result in rapid loss of episomes and KSHV infection. Such molecules would serve as useful tools to investigate KSHV latent infection as well as potential therapeutic agents for the prevention and treatment of KSHV malignancies.
Materials and Methods
Nucleosome Purification from Chicken Erythrocytes
Whole chicken blood was obtained from Pel-Freez Biologicals (#33130-1; Pel-Freez Biologicals, Rogers, AR). Chicken nucleosomes were prepared as described10,11 with a few modifications. Erythrocytes were isolated immediately when received by washing three times (or until no more thin cream-colored layer of white cells was observed over the red cells) with phosphate-buffered saline (PBS) containing 5% citrate (to prevent coagulation). Concentrated red blood cells (RBCs) were resuspended in PBS–citrate, aliquotted, and frozen on dry ice before storage at −80°C. Erythrocytes were then thawed at 37°C for 30 min (or until entirely thawed) before adding 10 volumes RBC lysis buffer (10 mM Tris–HCl pH 7.5, 10 mM NaCl, 5 mM MgCl2, 0.5% NP-40, and Complete EDTA-Free protease inhibitors cocktail [Roche #04693159001; Roche, Basel Switzerland]). Lysis was performed at 37°C for 1 h. Cellular debris was filtered through two layers of muslin (cheesecloth) into a new tube on ice. Flow-through containing RBC nuclei was centrifuged 5 min at 3500×g, and pelleted nuclei were washed once with 10 volumes RBC lysis buffer followed by two additional washes (or until the supernatant and pellet were no longer red) with washing buffer (RBC lysis buffer without NP-40). Nuclei were then resuspended in micronuclease (MNase) buffer (15 mM HEPES pH 7.5, 65 mM NaCl, 65 mM KCl, 2 mM MgCl2, 5 mM CaCl2, and Complete EDTA-Free protease inhibitors cocktail tablet [Roche]) and incubated 2 h at 37°C with 800 kunitz units MNase (NEB #M0247S) and 10 mL MNase buffer, to generate short chromatin of 1–6 nucleosomes long. MNase digests linker DNA. The MNase reaction was stopped by adding 10 mM ethylenediaminetetraacetic acid (EDTA) and cooling on ice. Nuclei were pelleted 5 min at 3500×g, and excess buffer drained by inverting the tube on paper for 30 s. Nuclei were then lysed in nuclear lysis buffer (20 mM Tris pH 7.5, 600 mM NaCl, 0.2 mM EDTA, and 0.5 mM β-mercaptoethanol) for 1 h on ice. Short chromatin (1–6 nucleosomes long) was recovered in the supernatant after 5 min centrifugation at 3000×g. The protein content of purified nucleosomes was analyzed by Bradford assay (BioRad #500-116; Berkeley, CA) and 15% sodium dodecyl sulfate polyacrylamide gel electrophores (SDS-PAGE) followed by Coomassie staining. DNA was purified by phenol-chloroform and visualized in a 1.2% agarose gel containing ethidium bromide. Purified chicken nucleosomes were stored at 4°C for up to 2 months or snap frozen and stored at −80°C.
Protein Expression and Purification
Glutathione S-transferase (GST) fusion proteins 7 were induced from BL21 Escherichia coli for 3 h at 30°C by adding 0.4 mM isopropyl β-D-1-thiogalactopyranoside. The bacterial pellet was resuspended in radioimmunoprecipitation assay (RIPA) lysis buffer (PBS, 1% NP-40, 0.5% sodium deoxycholate, 0.1% SDS, complete EDTA-free protease inhibitor [Roche], and lysosyme) and snap frozen. Cells were lysed by sonication (5×15 sec repeated 3 times). Glutathione beads (GE Healthcare #17-0756-01; Little Chalfont, UK) were added to cell lysate supernatant containing protein and incubated overnight at 4°C. Beads were washed three times with 10 volumes RIPA buffer and eluted by gravity on a Poly-Prep chromatography column (BioRad #731-1550) in 50 mM Tris, 150 mL NaCl, 2mM DTT, and 10mM glutathione at pH 8. Protein purity and concentration were analyzed by Coomassie staining after 12% SDS-PAGE.
Fluorescence Polarization (FP) Assay
For the pilot screen and the primary screen at the Harvard Institute of Chemistry and Cell Biology (ICCB-L) and the National Screening Laboratory for the Regional Centers of Excellence in Biodefense and Emerging Infectious Diseases (NSRB), 50 nM fluorescein isothiocyanate (FITC) LANA peptide tracer ([FITC]-beta alanine-MAPPGMRLRSGRSTGAPLTRGSC-[NH2], synthesized at Tufts University Core facility) was mixed with 240 to 320 nM purified chicken nucleosomes corresponding to 480 to 640 nM LANA peptide-binding sites in TEN (10 mM Tris–HCl pH 7.5, 1 mM EDTA, 2.5 mM NaCl, 0.01% Triton X-100, and 0.5 mM β-mercaptoethanol). 30 µL/well was dispensed in black 384-well plates (Corning #3575; Corning, Corning, NY) using a Matrix WellMate (Thermo Scientific, Waltham, MA) instrument. Compounds were transferred to plates using a custom-built Seiko pin-transfer robot (0.1 µL/well). Fluorescence polarization was measured using a PerkinElmer EnVision plate reader (PerkinElmer, Waltham, MA), set up with 480 nM excitation and 535 nM S and P emission filters with a D505 FP–D535 dichroic mirror. The S and P values were processed with the standard FP calculation formula (mP = 1000 * [S – G * P] / [S + G * P], where G is the G-factor and is approximately 1). As a positive control, 1250 nM unlabeled LANA 1–23 peptide (pilot screen) or 10 µM mitoxantrone (MTX) (high-throughput screen [HTS]) was added to the mixture before dispensing into plates. Cherry pick was performed as described here, but 100 nL compounds in DMSO were transferred into 384 well plates using a Cybi-Well vario instrument and PocketTip D.A.R.T.s (Thermo Scientific).
At the Broad Institute, the HTS was performed in black 1536-well plate format (Aurora Lobase SQ #11001122000), using the same concentration of FITC LANA1-23 and nucleosomes as above. Plates were prefilled with 10 nL compounds at 10 mM in DMSO with a Labcyte Echo acoustic fluid transfer apparatus. To facilitate the potential binding of FITC LANA1–23 to compound, tracer was added first, using a Thermo Scientific Multidrop Combi nL reagent dispenser, followed by the addition of nucleosomes with a Beckman-Coulter BioRAPTR microfluidic workstation and either positive-control 40 µM MTX or DMSO. Plates were then incubated for 1 h at room temperature and read using a PerkinElmer Viewlux plate reader. All timings and movements were coordinated with HighRes Biosolutions Cellario software on a Nanocell automation system.
Generation of Nucleosomes Lacking Histone Tails
Nucleosomes were treated 7 min with 91 ug/mL trypsin (Sigma #T6567; stock solution was diluted at 1 mg/mL in 1 mM HCl) before adding protease inhibitor cocktail (Pierce #88665; stock solution at 10× in TEN) to a final concentration of 1.9×. As a control, HCl and protease inhibitors were added to nucleosomes in the absence of trypsin, or protease inhibitor was added to nucleosomes prior to the addition of trypsin. For the fluorescence anisotropy (FA) assays with trypsin-digested nucleosomes and controls, 0.25× protease inhibitor cocktail was added to TEN buffer. Trypsin-digested nucleosomes and controls were analyzed by 15% SDS-PAGE followed by Coomassie staining.
Data Analysis
For all screens, positive- (unlabeled peptide or MTX) and negative-control wells (DMSO or monensin) were included on every plate. Active compounds result in decreased readout signal. For the pilot screen and the HTS at ICCB-L and NSRB, data were processed using Spotfire and Excel.
mP values were normalized to determine how many standard deviations each well was higher or lower than the mean of overall experimental wells (Z score 12 ). Based on the normalized mP values, a substance was considered active with at least the equivalent of two standard deviations lower than the mean of overall wells (Z score < −2). All compounds were screened in duplicate, and a substance was considered to be active only if both duplicates were active. Moreover, the raw fluorescence of each positive well was examined and compounds exhibiting fluorescence were eliminated. Hits were ranked from weak to strong inhibitors: hits with Z score between −2 and −3 were weak (W) inhibitors, whereas those with a Z score between −3 and −5 were medium (M) inhibitors, and those lower than −5 were considered strong (S) inhibitors.
For the Broad Institute HTS, the raw signals of the plate wells were normalized using the Neutral Controls minus Inhibitors method in Genedata Assay Analyzer (v. 7.0.3): the median raw signal of the intraplate negative-control wells was set to a normalized activity value of 0; the median raw signal of the intraplate positive-control wells was set to a normalized activity value of −100; and experimental wells were scaled to this range, giving an activity score as a percentage change in signal relative to the intraplate controls. The plate pattern correction algorithm Runwise Pattern (Multiplicative) in Genedata Screener Assay Analyzer was applied to the normalized plate data. The replicate activity scores were multiplied by −1 to convert Genedata Screener Assay Analyzer negative percentage inhibition values to Pubchem positive percentage activity values. The final PUBCHEM_ACTIVITY_SCORE was set as equal to the most active replicate. The PUBCHEM_ACTIVITY_OUTCOME class was assigned as described below, based on an activity threshold of 25%: Activity_Outcome = 1 (inactive), where none of the replicates fell outside the threshold; Activity_Outcome = 2 (active), where both replicates fell outside the threshold; and Activity_Outcome = 3 (inconclusive), where one of two replicates fell outside the threshold.
Z’ factors were calculated as described by Zhang et al. in 1999. 13 Fluorescence anisotropy and curve fitting for estimation of binding constants (Kd) were calculated according to Roehrl 14 using two- and three-state binding models.
Compound Purity and Identity
All reagents and solvents were purchased from commercial vendors and used as received. The purity of compounds purchased by the Broad Institute was determined by ultra-performance liquid chromatography mass spectrometry (UPLC-MS). Compounds were dissolved in DMSO at approximately 1 mg/mL, and 0.25 uL of this solution was injected. An Acquity BEH C18 column (1.7 um, 1.0×50 mm column; Waters, Milford, MA) was used with column temperature maintained at 65°C. Mobile Phase A consisted of either 0.1% ammonium hydroxide or 0.1% trifluoroacetic acid in water, whereas mobile Phase B consisted of the same additives in acetonitrile. The gradient ran from 5% to 95% mobile Phase B over 0.8 min at 0.45 mL/min. Purity was measured by UV absorbance at 210 nm. The identity of compounds was determined on a single quadrupole mass spectrometer by positive electrospray ionization.
Counterscreen Assay to Detect DNA Intercalators
Acridine orange was stored at 4°C and protected from light in a 1 mM stock solution in water. 50 nM acridine orange and 6 ug/mL salmon sperm DNA (Invitrogen #15632-011) were incubated with compounds in HEN buffer (10 mM HEPES pH 7.5, 1 mM EDTA, and 100 mM NaCl) for 20 min. Mitoxantrone (MTX) (Sigma), a known DNA intercalator, was used as the positive control at 10 µM. The assay was formatted for 384-well plates (Corning #3575), and reaction volume was 30 uL per well. Fluorescence polarization was measured using a PerkinElmer EnVision plate reader using the same filters and mirror as for the FP assay at ICCB-L and NSRB.
Enzyme-Linked Immunosorbent Assay (ELISA)
1.5 µg (based on protein content by Bradford assay) of purified chicken nucleosomes (100 µL/well, in PBS) were absorbed to wells of an Immulon 2HB 96 well-plate (ThermoFisher #3455) by overnight incubation at 4°C. 15 On the next day, wells were blocked with 5% dry milk in PBS. GST LANA1–23 was diluted with compounds in blotto (PBS containing 1% dry milk and 0.2% Tween 20) and incubated for 1.5 h at 4°C in nucleosome-coated wells. Detection of retained protein was achieved with the anti-GST-tag antibody (1:2000 dilution in blotto; Sigma G1417) and peroxidase-labeled goat anti-rabbit immunoglobulin G (1:5000 dilution in blotto; Southern Biotech #4030-05). Substrate Sigma Fast OPD (Sigma-Aldrich #P9187) was then added to wells and optical density (O.D.) read at 450 nm using a Biotek Powerwave HT 96/384 Microplate. Wells were washed three times with 0.05% Tween 20 between incubations.
Cytotoxicity Assay
HeLa cells were seeded at 3000 cells per well in 30 uL in 384-well plates. The following day, 100 nL of compound was added per well with a CyBio Vario pinning apparatus. Cells were incubated in a Liconic incubator for 48 h at 37°C. 20 uL of Cell Titer Glo (Promega) was added per well, and plates were shaken for 1 min, incubated at room temperature for 10 min, and then read on a PerkinElmer Envision plate reader with standard luminescence parameters. All compounds were tested at multiple concentrations (0.015 to 35 µM) in duplicate. Compounds that exhibited no cytotoxicity at 10 µM or lower were prioritized for follow-up. Compounds were considered valid for subsequent studies only if they did not kill cells.
Results
Generation of Reagents for an FP Assay
N-terminal LANA (N-LANA) binds to the conserved acidic patch of histones H2A and H2B to tether KSHV DNA to mitotic chromosomes.7,16 Because this tethering mechanism is essential for KSHV episome maintenance, we reasoned that a compound capable of binding either N-LANA or histones H2A and H2B that interferes with LANA nucleosome association ( Fig. 1 ) would disrupt episome persistence and latent infection.
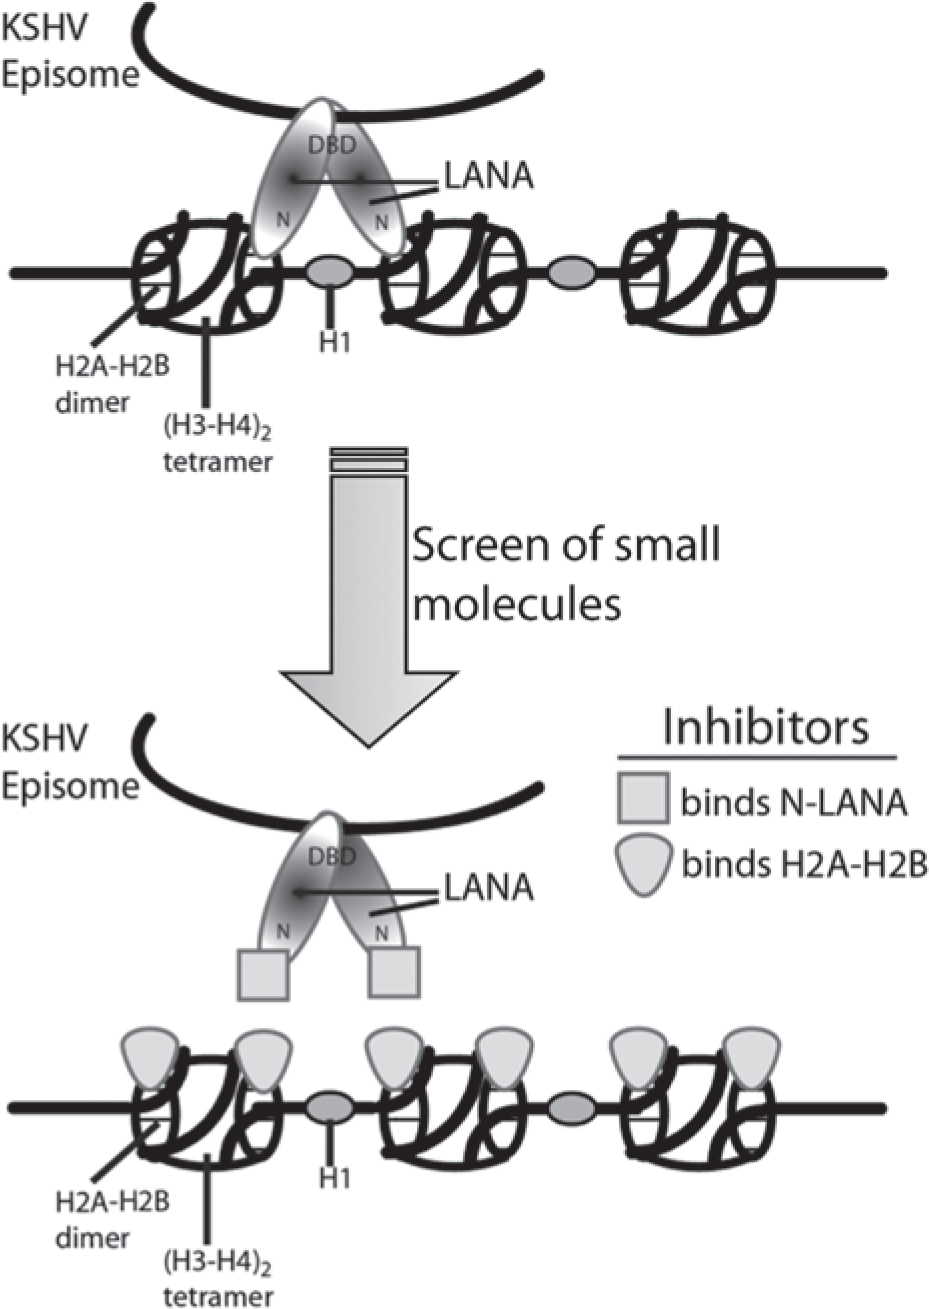
Schematic of latency-associated nuclear antigen (LANA) tethering Kaposi’s sarcoma–associated herpesvirus (KSHV) DNA to chromosomes and potential inhibitory mechanisms. (A) During latency, LANA tethers circular KSHV genomes to mitotic chromosomes. N-terminal LANA (N-LANA) binds to histones H2A and H2B, and C-terminal LANA binds to viral terminal repeat DNA. (B) Inhibitors binding to either N-LANA or histones H2A and H2B are expected to disrupt LANA tethering.
A fluorescence polarization (FP) assay was developed to detect the interaction between N-LANA and histones H2A and H2B. Tracer, composed of LANA residues 1–23, was synthesized and N-terminally labeled with FITC through a beta alanine linkage at the Tufts University Core facility (
FP Assay Development and Z’ Factor Determination
To determine the optimal concentration of FITC LANA1-23 (tracer) and nucleosomes, different concentrations of tracer were assessed against different concentrations of chicken nucleosomes in black 384-well plates. An optimal binding curve was observed using 50 nM tracer, which produced a quasi-saturation plateau at ~500 nM peptide-binding sites (assuming two H2A–H2B binding sites per nucleosome) ( Fig. 2A ). After transformation of FP into FA, 14 we calculated a Kd of 184 +/− 28.5 nM for N-LANA peptide binding to its histone H2A–H2B binding site from the data in Figure 2A . (Kd measurments for the data in Fig. 2D used nucleosomes that had been stored for a longer period of time and had modestly higher Kd values calculated; see below.)
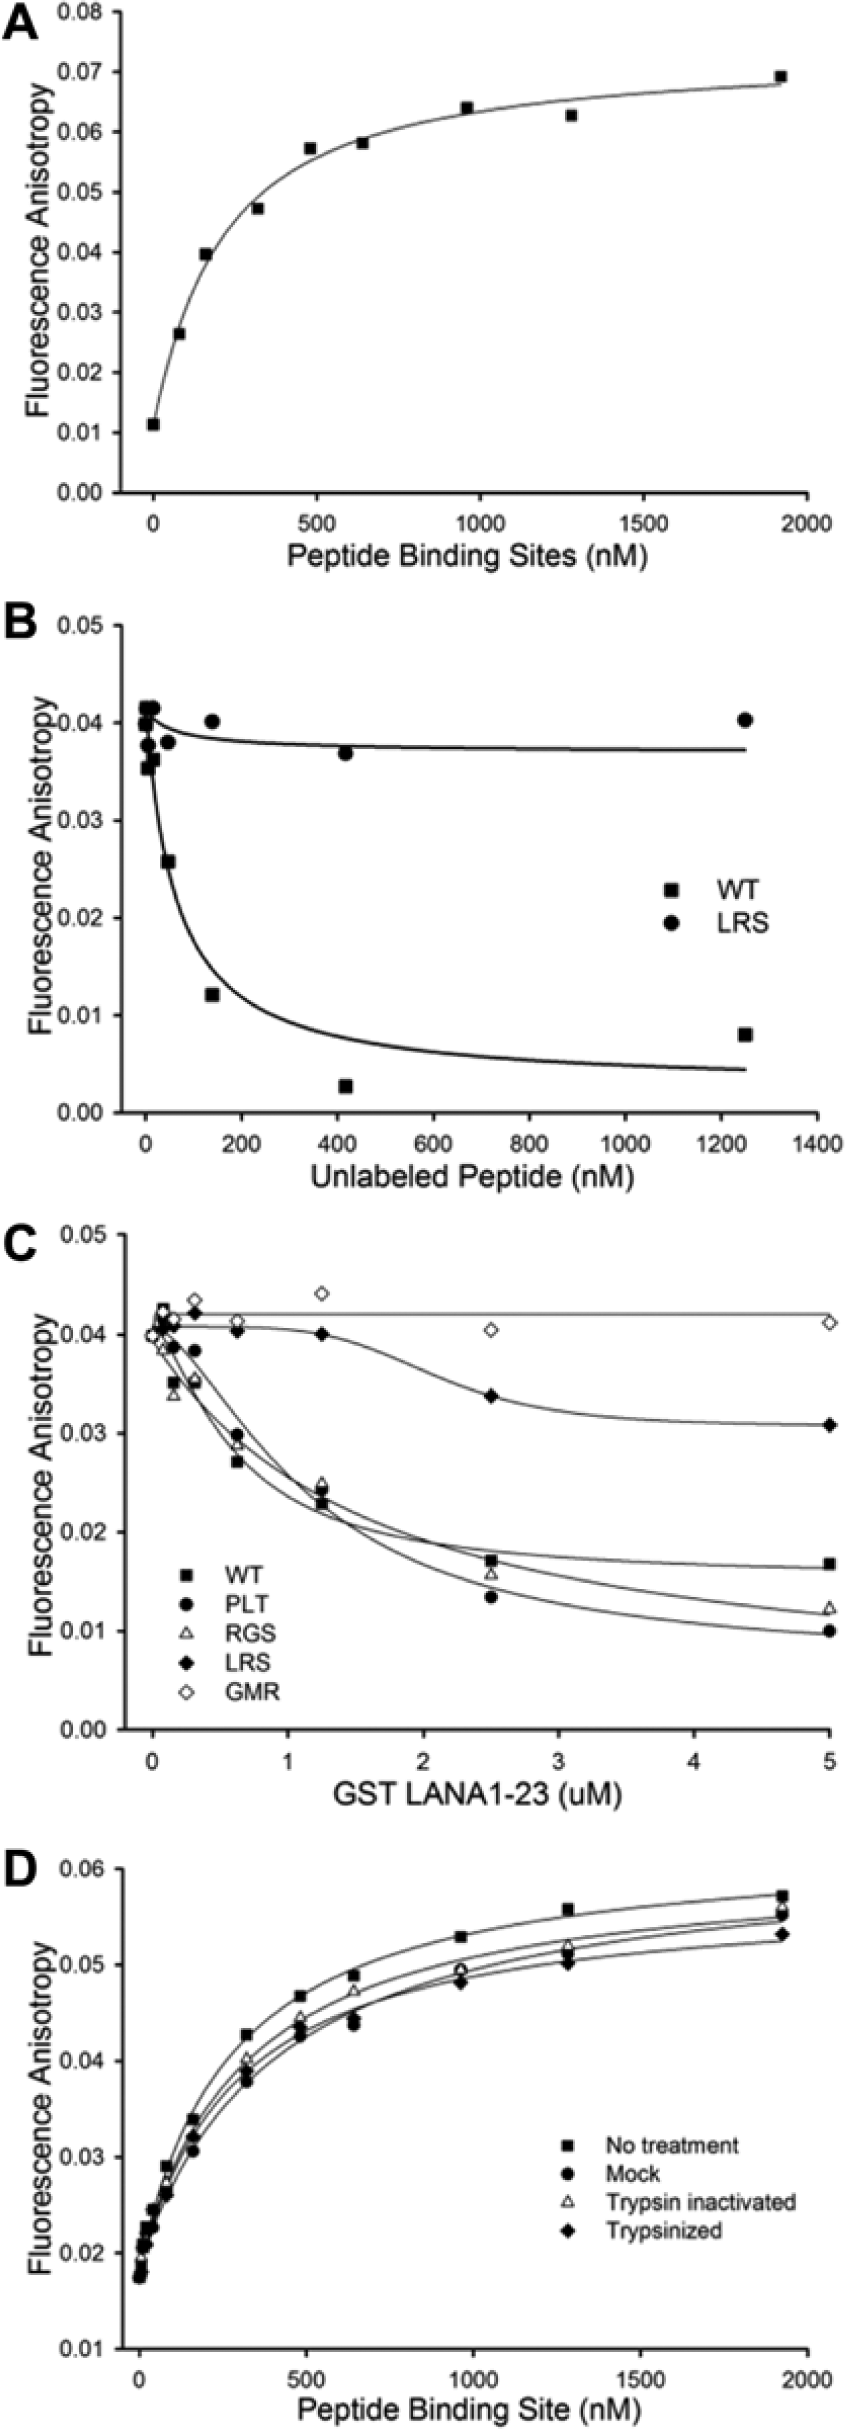
Fluorescence polarization (FP) assay for N-terminal latency-associated nuclear antigen (N-LANA) peptide binding to nucleosomes was performed and transformed into fluorescence anisotropy (FA). 14 (A) Titration of nucleosomes causes an increase in FA of fluorescein isothiocyanate (FITC)-labeled N-terminal LANA peptide. (B) Competitive inhibition of FITC labeled-peptide binding to nucleosomes by unlabeled wild-type (WT) LANA1–23 peptide results in decrease in FA. In contrast, unlabeled LANA1–23 peptide with residues 8LRS10 substituted to alanines does not bind histones H2A and H2B 6 and does not reduce FA. (C) Addition of GST LANA1–23 WT, or GST LANA 1–23 containing alanine substitution mutations at 17PLT19 or 20RGS22, that do not reduce binding to nucleosomes 7 each compete with a FITC-labeled peptide for nuclesome binding. In contrast, GST LANA1–23 containing alanine substitutions at residues 5GMR7, which abolish N-LANA interaction with histones H2A and H2B (similar to 8LRS10 7 ), did not decrease FA. GST LANA1–23 8LRS10 weakly competed for nucleosome binding at high concentrations. (D) Titration of nucleosomes that were untreated, mock treated (HCl and protease inhibitor), treated with inactivated trypsin (protease inhibitor added prior to trypsin), or treated with trypsin to digest histone tails showed similar binding of FITC LANA1–23 to nucleosomes.
We assessed the specificity of the N-LANA tracer interaction with nucleosomes using competition assays with 50 nM FITC LANA1–23 tracer and 480 nM LANA binding sites. Increasing concentrations of unlabeled N-LANA1–23 effectively reduced the FA signal ( Fig. 2B ). In contrast, N-LANA1–23 peptide containing alanine substitutions at LANA residues 8LRS10, which abolish N-LANA interaction with histones H2A and H2B, 7 did not interfere with the FA signal ( Fig. 2B ). In addition, increasing concentrations of unlabeled GST LANA1–23 WT effectively competed with FITC LANA1–23 binding to nucleosomes ( Fig. 2C ). GST LANA1–23 containing alanine substitutions of LANA residues 17PLT19 or 20RGS22, which do not affect LANA binding to histones H2A and H2B, 7 also effectively competed and decreased FA signal. In contrast, GST LANA1–23 containing alanine substitutions at residues 5GMR7, which abolish N-LANA interaction with histones H2A and H2B similar to 8LRS10 substitutions, 7 did not decrease FA. GST LANA1–23 8LRS10 only weakly competed for nucleosome binding at high concentrations ( Fig. 2C ). Therefore, effective competition of tracer–nucleosome interaction was observed only after the addition of N-LANA capable of binding histones H2A and H2B, not with N-LANA deficient in binding histones H2A and H2B. These results demonstrate that this assay specifically detects N-LANA binding to histones H2A and H2B.
A Z’ factor was calculated to assess assay reproducibility. A Matrix WellMate instrument was used to fill a 384-well plate using the same tracer and nucleosome concentrations as used in the competition assays. As a positive control for inhibition, 1250 nM unlabeled N-LANA peptide WT competitor was included in half of the wells, whereas the other half of the plate contained no competitor. A Z’ factor of 0.57 was calculated. Because a Z’ factor of at least 0.5 is considered satisfactory for HTS, 18 this assay was judged to be sufficiently robust.
Histone Tails Do Not Reduce LANA Binding to the Histone H2A and H2B Acidic Patch
The crystal structure of the nucleosome core particle (NCP) demonstrates that histone H4 N-terminal tails bind one (of the two) histone H2A and H2B acidic regions on adjacent nucleosomes, leaving alternate H2A and H2B acidic patches unoccupied. The N-terminal LANA–NCP co-crystal was derived after incubation of preexisting NCP crystals with N-LANA peptide, and revealed LANA peptide occupying the intervening H2A and H2B acidic patches not occupied with histone H4 tail.
7
Because this assay used nucleosomes that included short chains of two to three nucleosomes (
To compare LANA binding to intact nucleosomes versus nucleosomes lacking histone tails, we digested nucleosomes with trypsin. Partial digestion of core histones with trypsin leads to loss of the tail regions.
19
After partial trypsin digestion and resolution by SDS-PAGE, Coomassie staining revealed a shift to a faster migration pattern, consistent with loss of histone tails (
We assessed N-LANA’s ability to bind intact nucleosomes containing histone tails with nucleosomes in which the histone tails were removed by trypsin digestion. A Kd value of 246 +/− 22 nM was obtained for LANA tracer binding to intact nucleosomes as measured by the fitting of FA data (
Fig. 2D
). We assumed that the two histone H2A and H2B LANA-binding sites on each nucleosome were independent of each other when performing calculations of Kd values. Notably, similar Kd values for LANA peptide binding were obtained in the presence of trypsin digestion or when trypsin digestion was inhibited. After trypsin digestion, a Kd of 260 +/− 28 nM was obtained. When protease inhibitor was added prior to the addition of trypsin, which effectively inhibited trypsin digestion (
DNA Intercalation Counterscreen
Compounds that intercalate into DNA may disrupt nucleosomes. Insertion of planar chromophores into DNA results in unwinding and can lead to loss of higher and possibly lower order chromatin structure.20,21 The loss of the lower order of chromatin structure may lead to nucleosome disruption and liberation of core histones. 20 In addition, DNA unraveling induced by intercalators can result in nucleosome aggregation. 22 These changes would be expected to reduce FP signal detected by N-LANA binding to nucleosomes and therefore lead to a positive readout for inhibition in the absence of specific disruption of N-LANA binding to histones H2A and H2B.
To identify nonspecific inhibitors due to DNA intercalation, we miniaturized and optimized an assay developed by Richardson and Shulman.23,24 Acridine orange exhibits increased fluorescence polarization on DNA intercalation. Different concentrations of acridine orange were assessed against a titration of salmon sperm DNA, and an optimal binding curve was observed using 50 nM acridine orange, which produced a saturation plateau at about 10 µg/mL of DNA ( Fig. 3A ). In subsequent assays, we used 6 µg/mL salmon sperm DNA and 50 nM acridine orange. DNA intercalator agents were expected to compete with acridine orange for intercalation into DNA, causing a decrease in FP readouts.
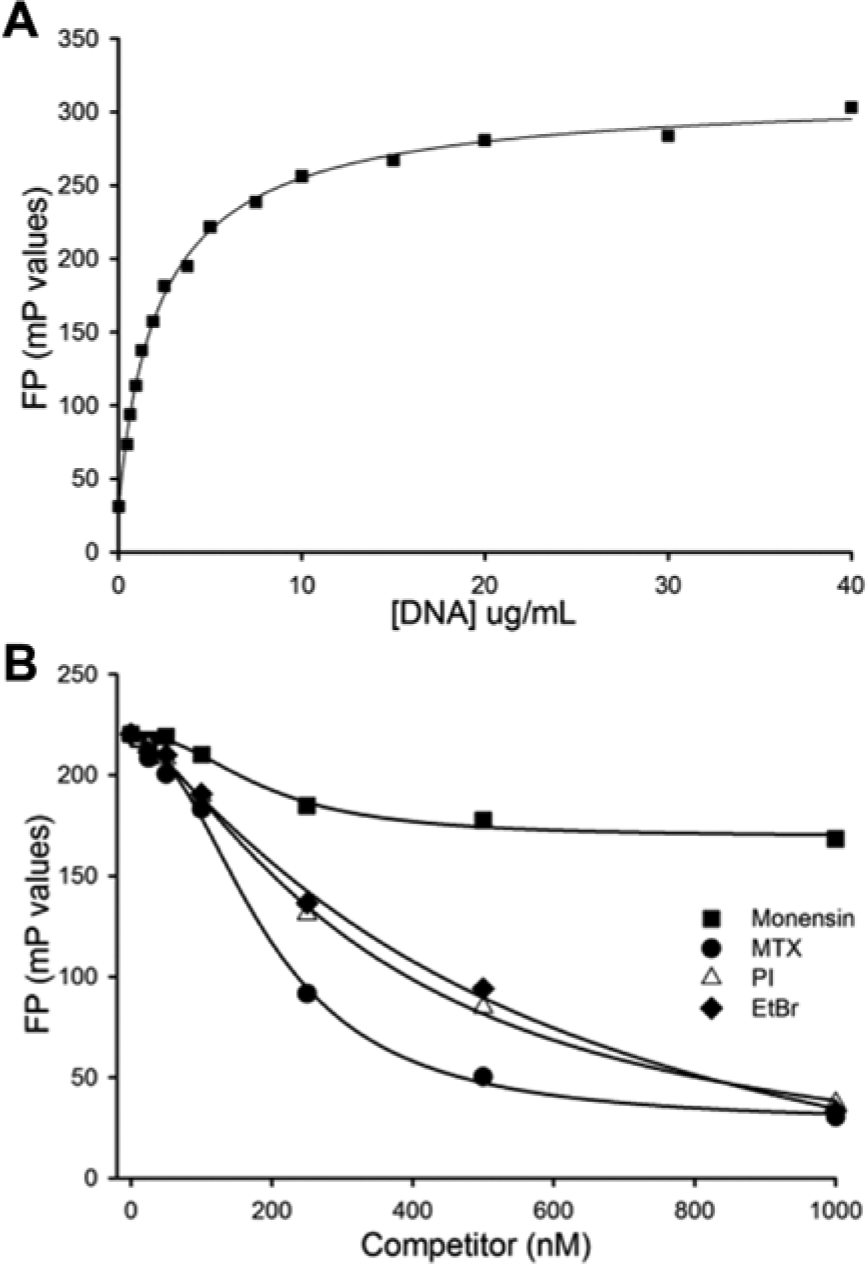
Counterscreen to identify DNA intercalation. (A) Increasing concentration of DNA rapidly increased acridine orange fluorescence polarization prior to plateau formation. (B) The known DNA intercalators mitoxantrone (MTX), propidium iodide (PI), and ethidium bromide (EtBr) each effectively reduced acridine orange fluorescence polarization (FP), whereas monensin, which does not intercalate into DNA, did not.
We assessed the validity of the assay by testing the ability of the DNA intercalators propidium iodide (PI), ethidium bromide (EtBr), and mitoxantrone (MTX) to compete with acridine orange for DNA intercalation. Increasing concentration of PI, EtBr, or MTX each reduced acridine orange mP values, consistent with effective competition ( Fig. 3B ). As a negative control, we used the small molecule monensin, which is not known to bind or intercalate into DNA. Monensin had only a negligible effect on acridine orange mP values, even at concentrations as high as 1 µM. We assessed the reproducibility of the assay by determining a Z’ factor using monensin as a negative control and MTX as a positive control. The calculated Z’ factor was 0.75. 13 Therefore, this assay was specific and reproducible.
Development of an ELISA to Detect LANA Interaction with Nucleosomes
Because many library compounds exhibited color or intrinsic fluorescence that could potentially influence FP results, we developed a nonfluorescent assay for hit validation. An ELISA using nucleosomes and purified GST LANA1–23 was generated after binding nucleosomes to Immulon 2HB 96-well plates. Binding of GST LANA1–23 to nucleosomes was assessed using anti-GST antibodies conjugated to horseradish peroxidase (HRP). The addition of the chromogenic HRP substrate, o-phenylenediamine dihydrochlodride (OPD), allows quantitative optical density readout of antibody binding.
Wells were coated with increasing amounts of nucleosomes and assessed against a titration of GST LANA1–23. An optimal binding curve was observed using 1.5 µg of nucleosomes per well, which produced a quasi-saturation plateau at around 200 nM of GST LANA1–23 ( Fig. 4A ). As expected, GST did not bind nucleosomes.
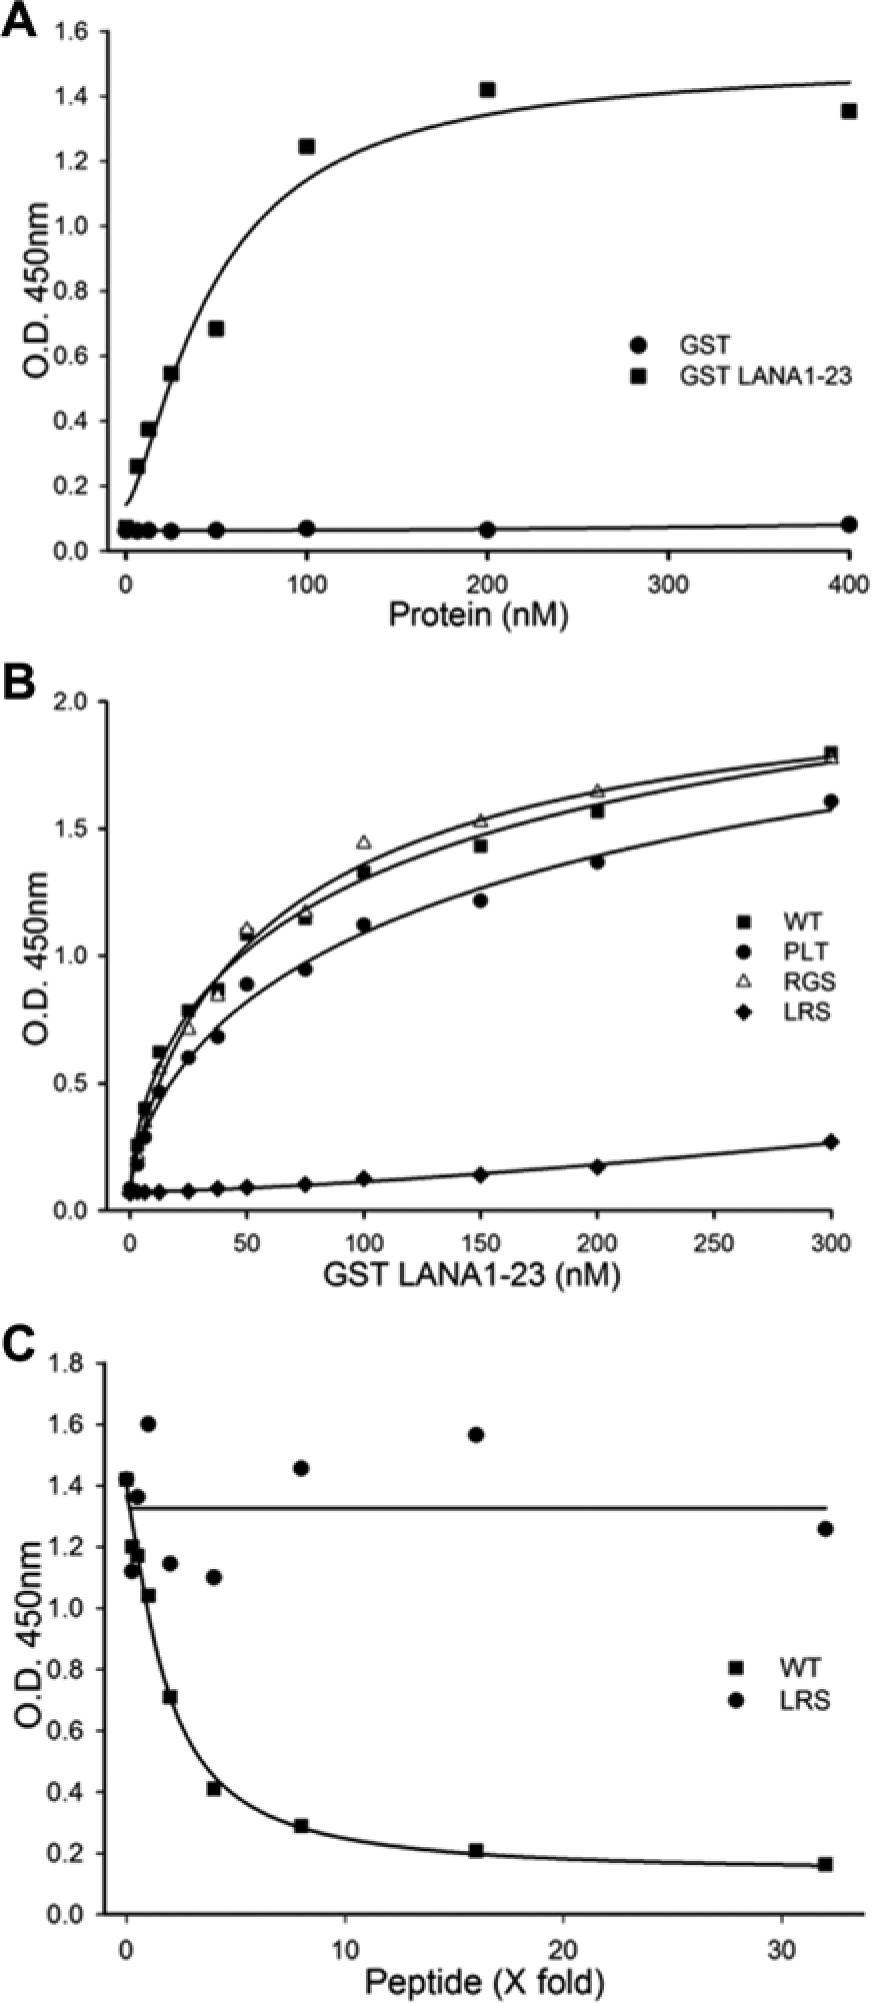
Development of enzyme-linked immunosorbent assay (ELISA) to detect N-terminal latency-associated nuclear antigen (N-LANA) binding to nucleosomes. (A) Wells coated with nucleosomes were incubated with glutathione S-transferase (GST) or GST LANA1–23. The GST moiety was detected using mouse anti-GST following by goat antimouse antibody conjugated with horseradish peroxidase and o-phenylenediamine dihydrochlodride reagent. GST LANA1–23, but not GST, bound to nucleosomes as measured by O.D. increase. (B) Increasing concentrations of GST LANA1–23 wild-type (WT) or GST LANA1–23 mutants were incubated with nucleosomes. GST LANA1–23 17PLT19 and 20RGS22, which bind nucleosomes, each resulted in increasing O.D., whereas GST LANA1–23 8LRS10, which is abolished for chromosome binding, was highly deficient in increasing O.D. (C) LANA1–23 WT peptide competed with GST LANA1–23 for nucleosome binding, but LANA 8LRS10 peptide did not.
We assessed the specificity of the assay by testing GST LANA fusions containing alanine substitutions. Titration of GST LANA1–23 20RGS22 or 17PLT19, which contain alanine substitutions that do not reduce histone H2A and H2B binding, 6 bound nucleosomes similarly to GST LANA1–23 ( Fig. 4B ). In contrast, titration of GST LANA1–23 8LRS10, which contains alanine substitutions that abolish histone binding, was highly deficient in the ability to increase O.D. ( Fig. 4B ). The specificity of the assay was further assessed using either unlabeled WT LANA1–23 or LANA1–23 8LRS10 peptide to compete with GST LANA1–23 for nucleosome binding. LANA1–23 8LRS10 peptide did not reduce the interaction between GST LANA1–23 WT and nucleosomes ( Fig. 4C ). However, LANA1–23 WT peptide efficiently decreased absorbance, and the O.D. reached a plateau at a peptide concentration of ~8 fold (~1.6 µM) the concentration of GST LANA1–23 (200 nM). Therefore, the ELISA specifically detected GST LANA1–23 binding to nucleosomes.
Pilot Screen of Known Bioactives
To assess the suitability of the FP assay for an HTS, we performed a pilot screen of 2638 structurally diverse, known bioactive compounds in 384 well plates ( Fig. 5A ). At least one column of 16 wells of each plate contained 1250 nM unlabeled LANA1–23 WT peptide (25-fold excess higher than tracer) as a positive control. Negative control wells contained tracer and nucleosomes without the addition of compounds. Correlation of replicates from representative plates revealed an orthogonal straight-line fit with an excellent R2 value of 0.934 ( Fig. 5A ). As expected, negative controls ( Fig. 5A , squares) grouped with most of the experimental compounds ( Fig. 5A , triangles), which did not inhibit binding. The grouping was clearly separated from the positive controls ( Fig. 5A , circles) containing unlabeled competitor LANA1–23 peptide. A small number of experimental wells grouped with or near the positive controls.
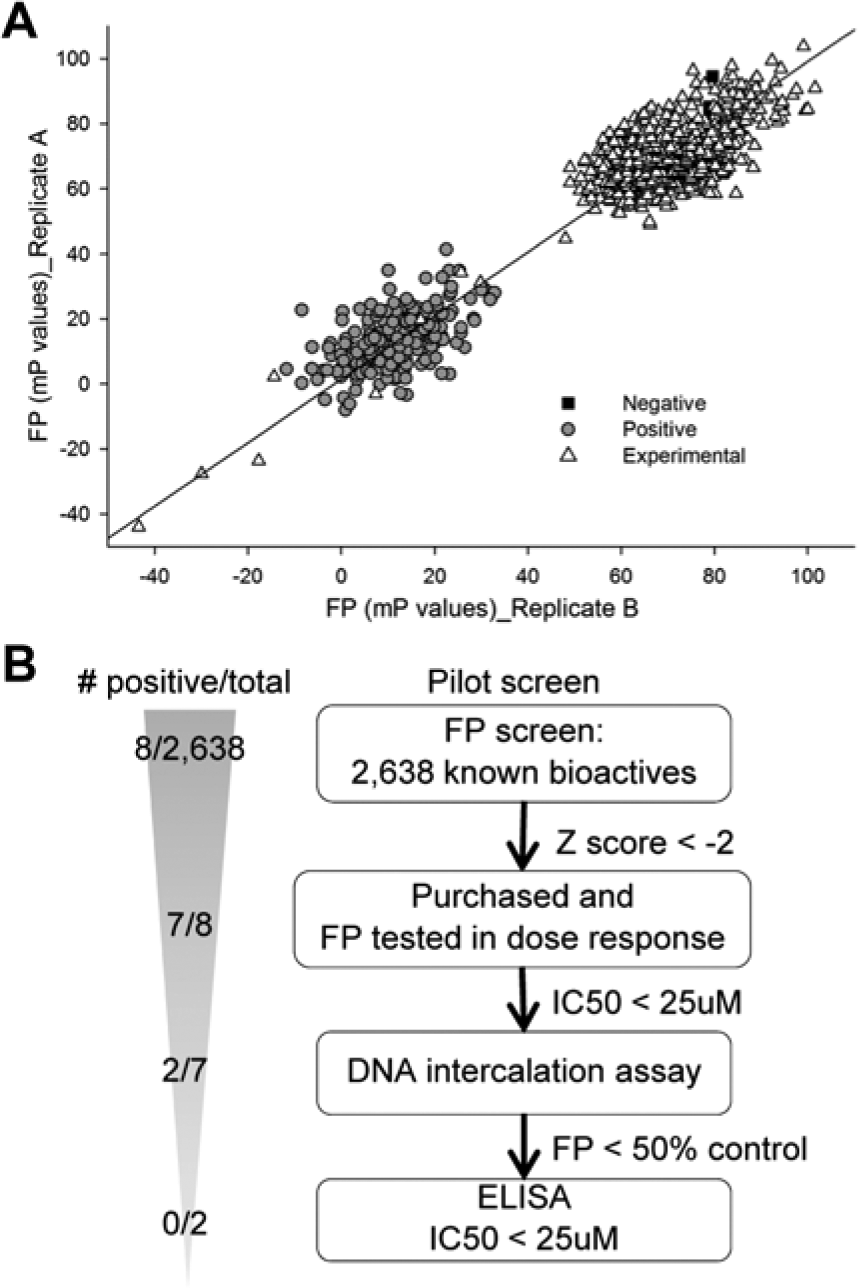
Pilot screen for inhibitors of N-terminal latency-associated nuclear antigen (N-LANA) peptide binding to nucleosomes. (A) Scatterplot of replicate (Replicate A vs. Replicate B) results for fluorescence polarization (FP). The best fit linear regression curve resulted in R2 = 0.934 and Y = 2.565 + 0.961X, where Y = FP of replicate A and X = FP of replicate B, indicating the reproducibility of replicates. The separation of negative and positive controls and the clustering of the majority of experimental wells with negative control are shown. For clarity, only four representative plates are plotted. Negative and positive control wells are indicated, as are experimental wells. (B) Flow chart of the pilot screen.
A positive hit was defined as reduction of the FP at least two standard deviations lower than the overall mean of the wells (Z score < −2). Wells containing autofluorescent compounds determined from high raw fluorescence values were excluded. The bulk of experimental wells had a Z score near 0, whereas the vast majority of wells containing positive-control unlabeled LANA1–23 peptide had a Z score lower than −2, with an average of −3. In the experimental wells, eight molecules out of 2638 (0.3%) were identified as possible hits with Z scores below −2 for both replicates. Interestingly, daunorubicin and doxorubicin, currently used for treatment of patients affected by KS, were identified in the pilot screen. The potent antitumor agents MTX and 10-hydroxycamptothecin (10-HCT) were also identified.
The eight hits identified in the pilot screen were purchased and tested at increasing concentrations in the FP assay, with the DNA intercalation counterscreen, and by ELISA ( Fig. 5B ). FP inhibition of FITC LANA1–23 binding to nucleosomes was confirmed for seven compounds out of eight, with half maximal inhibitory concentrations (IC50) lower than 25 µM. Positive hits included doxorubicin, daunorubicin, and MTX. 10-HCT inhibitory activity could not be confirmed by FP. Five of eight compounds efficiently competed with acridine orange for DNA intercalation, reducing the acridine orange FP by at least 50%. As expected, doxorubicin, daunorubicin, and MTX scored positive for DNA intercalation, whereas 10-HCT inconsistently competed with acridine orange for intercalation. No pilot screen hits survived the DNA intercalation and ELISA counterscreens.
Because the DNA intercalators MTX and doxorubicin were found to have inhibitory activity by ELISA, with MTX the most potent, MTX was assessed as a positive control for future HTS. A new Z’ factor of 0.66 was calculated with MTX as the positive control, and monensin, a known bioactive compound that did not inhibit LANA1–23 binding to nucleosomes, as the negative control. Therefore, the pilot screen indicated that the FP-based assay was suitable for HTS.
HTS Screen at the ICCB-L and NSRB
An additional compound collection at ICCB-L and NSRB comprising 49,810 small molecules was screened in duplicate. Compounds included 704 natural products ( Fig. 6A ). Each plate contained wells with MTX as a positive control for inhibition and monensin as a negative control. As in the pilot screen, a Z score was calculated for each well, and raw fluorescence evaluated. One hundred and forty-one compounds scored positive for inhibition for both replicates (0.28% hit rate), including nine known bioactives, nine natural products, and 123 additional, commercially available molecules. Among known bioactives, doxorubicin, daunorubicin, and MTX again scored positive. Positive hits were cherry picked and retested at the same dose as in the primary screen for FP and DNA intercalation. Fifteen compounds of 141 survived these counterscreens, including two natural products and 13 commercially available, nonknown bioactive compounds. Commercially available compounds with chemical structures considered to have high potential to covalently bind proteins were eliminated. Eight compounds were purchased, and two natural product compounds were kindly provided by Jon Clardy (Harvard Medical School), and these compounds were analyzed by FP and ELISA at increasing concentrations. Four commercially available compounds and one natural product inhibited in the FP assay with IC50s lower than 25 µM, but no compounds inhibited by ELISA.
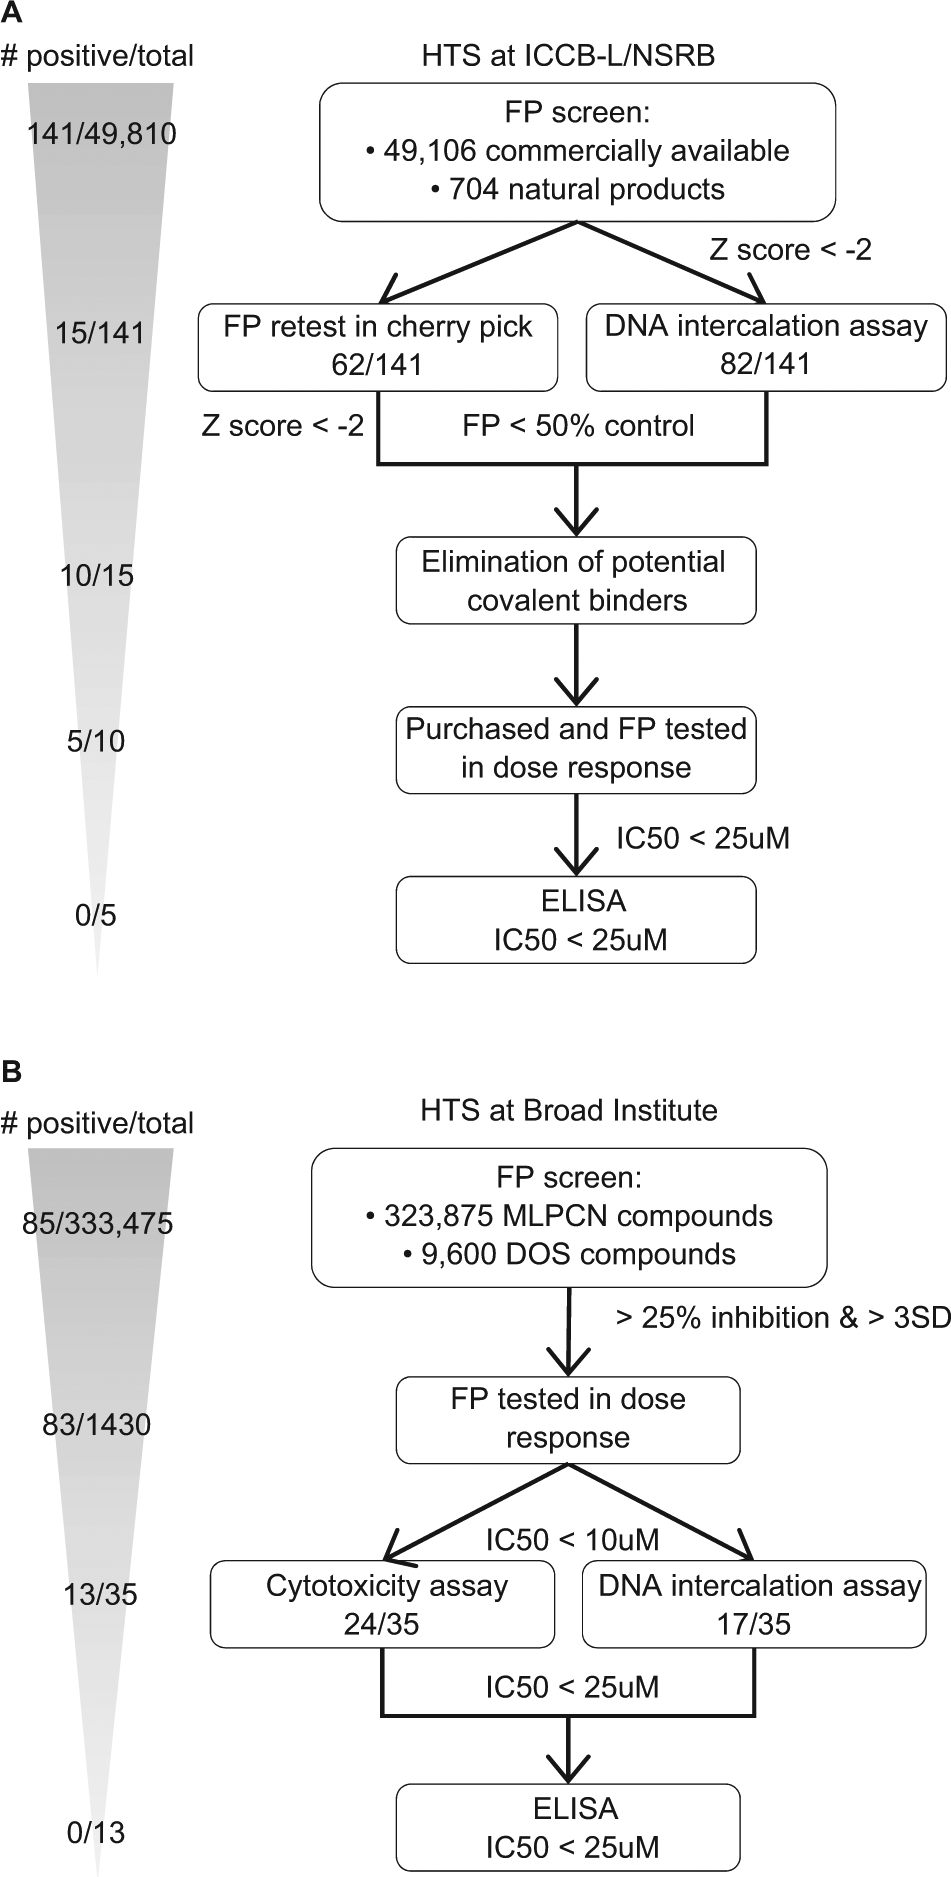
Flow charts of high-throughput screens (HTS). (A) HTS at the Harvard Institute of Chemistry and Cell Biology and the National Screening Laboratory for the Regional Centers of Excellence in Biodefense and Emerging Infectious Diseases; and (B) HTS at the Broad Institute. For compounds present in PubChem, screen results, including from pilot screening, have been deposited (ICCB-L, PubChem AID: 720717; and Broad, PubChem AID: 435023).
HTS at the Broad Institute
In addition to the ICCB-L and NSRB screen, we also performed an additional HTS at the Broad Institute. Compounds from the National Institutes of Health Molecular Libraries Probe Production Centers Network (MLPCN) (323,875) and from the Broad diversity-oriented synthesis (DOS) library (9600) were screened ( Fig. 6B ). There is an estimated 15–20% overlap of compounds between the MLPCN and ICCB libraries. From the MLPCN library, 1947 compounds (0.6%) inhibited FITC LANA1–23 binding to nucleosomes in at least one replicate, and 85 (0.026% hit rate) were positive for both replicates. No hits were obtained with the DOS informer set. 1430 MLPCN compounds were retested at eight doses with threefold dilutions from 35 µM. From the compounds retested, 83 compounds were confirmed hits, with IC50 ≤10 uM. From these compounds, 35 were commercially available, obtained as dry powders, and confirmed to have purity greater than 95%. Only 13 of the 35 purchased compounds survived cytotoxicity and intercalation counterscreens, and no compounds inhibited LANA-binding nucleosomes as detected by ELISA ( Fig. 6B ).
Discussion
KSHV is tightly linked with KS, PEL, and MCD, for which there are no specific therapies. KSHV LANA is essential for viral persistence in latently infected tumor cells, and inhibition of its episome maintenance function is expected to abolish infection, leading to tumor cell death. LANA directly tethers the KSHV genome to mitotic chromosomes to segregate viral DNA to progeny nuclei after mitosis. Here, we developed an FP assay to screen for inhibitors of N-terminal LANA binding to nucleosomes through histones H2A and H2B. We performed two HTS for inhibitors, but no compounds survived all counterscreens, including counterscreens for DNA intercalation and an ELISA assessing LANA binding to nucleosomes. Of note, ELISA assays may be prone to false-negative results due to nonequilibrium washing conditions, and an improved, future alternative to this counterscreen might use an approach such as ForteBIO Octet® RED, which allows measurement of binding and dissociation kinetics and is capable of determining equilibrium binding and dissociation.
A small-molecule inhibitor that directly binds N-LANA is expected to specifically inhibit LANA chromosome tethering, whereas an inhibitor that binds the H2A and H2B acidic patch would likely have broader effects on the cell because the latter would potentially interfere with other host cell-binding partners and processes. For instance, the H4 histone tail, 25 interleukin 33 (IL-33), 26 the Drosophila regulator of chromosome condensation 1 (RCC1), 27 Saccharomyces cerevisiae silent information regulator 3 (Sir3), 28 high-mobility group nucleosomal 2 (HMGN2), 29 and CENP-C 30 each interact or may interact with the H2A and H2B acidic patch. Further, the H2A and H2B acidic patch exerts effects on the state of chromatin compaction, including through histone H4 tail binding to the patch.16,31 Therefore, an inhibitor that specifically binds N-LANA would likely be most effective as a specific probe for LANA function and inhibitor of KSHV, whereas a compound that binds the acidic patch would serve as a useful probe for KSHV and for the function of the H2A and H2B patch itself. N-LANA is likely disordered in the absence of partner binding. To efficiently bind N-LANA, a small molecule compound will likely need a more complex three-dimensional structure than many of the molecules typically present in compound libraries.
We obtained a kd of 184 +/− 28.5 nM for LANA peptide binding to nucleosomes. This value is higher than the kd of 4.5 nM, which was previously obtained for LANA binding to recombinant histone H2A and H2B dimers. 16 N-terminal LANA binds histones H2A and H2B and not histones H3 or H4 or DNA.7,16 However, it is possible that the DNA or histone H3 or H4 components of the nucleosome may reduce LANA binding, perhaps through electrostatic or steric effects. It is also possible that posttranslational modifications on the folded portion of the chicken nucleosome histones may cause reduced LANA binding. The finding that trypsin digestion did not alter LANA binding indicates that histone tails did not reduce LANA binding. However, it is important to note that these results may not be sensitive enough to detect an effect as small as a 25% reduction in binding, and our estimation is that after near complete micrococcal nuclease digestion, only ~25% of histone H2A and H2B sites had adjacent nucleosomes to provide possible competition for LANA binding with histone H4 tails.
Several inhibitors have been described to inhibit EBV EBNA1, which maintains EBV episomes. EBNA1 and LANA share structural and functional characteristics, including bridging the viral genome to host mitotic chromosomes to mediate episome segregation to daughter nuclei. EBNA1 self-associates through its C-terminal DNA-binding domain, and its binding to oriP in the EBV genome is well characterized. An in silico screen using computational docking programs identified four compounds capable of inhibiting EBNA1 binding to DNA. 32 Three of these compounds were capable of inhibiting EBNA1 transcriptional activation and also reduced the EBV DNA copy number in short-term assays in an EBV-infected Burkitt lymphoma cell line.
In separate work, a HTS for inhibitors of EBNA1-mediated transcriptional activation identified a small molecule termed EiK1, which inhibited EBNA1 homodimerization and DNA binding. 33 The same HTS also identified roscovitine as an EBNA1 inhibitor. Roscovitine is a cyclin-dependent kinase inhibitor that inhibits cyclin-dependent kinases (CDK) 1, 2, 5, and 7. Roscovitine was found to inhibit CDK phosphorylation of EBNA1 on serine 393, which was important for oriP-dependent transcription and episome persistence. 34 Notably, in vitro phosphorylation assays on a protein microarray identified kinases of N-terminal LANA, including casein kinase 1, PIM1, GSK3, and RSK3, which acted on LANA amino acids serine 10 and threonine 14, 35 residues that have roles in histone H2A and H2B binding.6,7 Inhibition of RSK, but not the other kinases, diminished LANA’s association with histones H2A and H2B. In addition, extended treatment of infected PEL cells with the RSK inhibitor resulted in decreased LANA levels and loss of cell viability. 35
This work developed an assay for screening for inhibitors of N-LANA binding to histones H2A and H2B that was amenable to HTS. Performance of HTS identified multiple hits, but none survived all counterscreens. Future identification of specific inhibitors of N-LANA binding to histones H2A and H2B will likely require libraries with compounds of more complex three-dimensional structure, such as mimics of folded peptides.
Footnotes
Acknowledgements
We thank Jayanth Chodaparambil for helpful suggestions, Su Chiang for screening advice, Kyungae Lee for advice on chemistry, and David Wrobel and Jennifer Nale for computational analysis and advice. We also thank the ICCB-L and the NSRB for their support during assay development and screening.
Declaration of Conflicting Interests
The authors declared no potential conflicts of interest with respect to the research, authorship, and/or publication of this article.
Funding
The authors disclosed receipt of the following financial support for the research, authorship, and/or publication of this article: This work was supported by grants from the National Cancer Institute (CA082036) and the National Institute of Neurological Disorders and Stroke (R21 NS061738-01) (KMK); Fonds de Recherche en Santé du Québec (FRSQ) and the Canadian Institutes of Health Research (CIHR) (CB); and the New England Regional Center of Excellence (NERCE) (grant U54 AI057159) and MLPCN program (grant 5U54HG005032) (Stuart Schreiber).
References
Supplementary Material
Please find the following supplemental material available below.
For Open Access articles published under a Creative Commons License, all supplemental material carries the same license as the article it is associated with.
For non-Open Access articles published, all supplemental material carries a non-exclusive license, and permission requests for re-use of supplemental material or any part of supplemental material shall be sent directly to the copyright owner as specified in the copyright notice associated with the article.