
Abstract
Nef is a human immunodeficiency virus 1 (HIV-1) accessory factor essential for viral pathogenesis and AIDS progression. Many Nef functions require dimerization, and small molecules that block Nef dimerization may represent antiretroviral drug leads. Here we describe a cell-based assay for Nef dimerization inhibitors based on bimolecular fluorescence complementation (BiFC). Nef was fused to nonfluorescent, complementary fragments of yellow fluorescent protein (YFP) and coexpressed in the same cell population. Dimerization of Nef resulted in juxtaposition of the YFP fragments and reconstitution of the fluorophore. For automation, the Nef-YFP fusion proteins plus a monomeric red fluorescent protein (mRFP) reporter were expressed from a single vector, separated by picornavirus “2A” linker peptides to permit equivalent translation of all three proteins. Validation studies revealed a critical role for gating on the mRFP-positive subpopulation of transfected cells, as well as use of the mRFP signal to normalize the Nef-BiFC signal. Nef-BiFC/mRFP ratios resulting from cells expressing wild-type versus dimerization-defective Nef were very clearly separated, with Z factors consistently in the 0.6 to 0.7 range. A fully automated pilot screen of the National Cancer Institute Diversity Set III identified several hit compounds that reproducibly blocked Nef dimerization in the low micromolar range. This BiFC-based assay has the potential to identify cell-active small molecules that directly interfere with Nef dimerization and function.
Introduction
Nef, an accessory protein expressed by human immunodeficiency virus (HIV) and other primate lentiviruses, plays an essential role in viral pathogenesis.1,2 Studies in several animal models have demonstrated that Nef is a critical determinant of viral replication, viral and immune receptor downregulation, and AIDS progression.3–5 Nef-defective HIV strains have been isolated from infected patients who remain asymptomatic for long periods in the absence of antiretroviral therapy, providing strong evidence that Nef is a critical virulence factor for HIV pathogenesis.6–8 Taken together, these studies provide a strong rationale for the discovery and development of a new generation of HIV therapeutics targeting Nef.
Despite the lack of intrinsic biochemical activity, Nef influences numerous signaling pathways through interactions with a diverse group of host cell proteins. 9 Previous studies have identified distinct structural motifs that are required for specific Nef functions. Among the best known are the PxxPxR motif, which forms a polyproline type II helix required for SH3 domain binding and host cell kinase activation, a polyglutamate stretch near the N-terminus that is involved in MHC-I downregulation, and a dileucine motif within a flexible internal loop required for downregulation of cell-surface CD4. Separation of these and other functional motifs in the 3D structure of Nef creates a challenge for drug discovery, 10 as small molecules that selectively target individual interfaces may inhibit only a subset of Nef functions.11,12
Previous biochemical and structural studies have demonstrated that Nef forms homodimers and possibly higher-order oligomers in vitro.13,14 For example, Nef/SH3 complexes crystallize as dimers, with the Nef/Nef dimerization interface formed by the nearly orthogonal packing of the αB helices of the folded Nef core. 14 This helical interface comprises a hydrophobic interface flanked by reciprocal electrostatic interactions involving the side chains of residues R105 and D123. Mutagenesis studies based on the crystal structure of this Nef dimer interface suggest that dimerization is critical for most Nef functions15,16 and support the idea that small-molecule inhibitors of dimerization may represent broadly active Nef antagonists.
While mutagenesis studies based on the Nef crystal structure have implicated the dimerization interface in Nef function, none of these previous studies provided direct evidence for Nef dimerization in cells. More recent work used a cell-based bimolecular fluorescence complementation (BiFC) assay for direct visualization of Nef dimers. 16 The BiFC approach involves fusion of Nef to nonfluorescent, complementary fragments of a yellow-shifted variant of the green fluorescent protein of Aequorea victoria (YFP). When coexpressed in the same cell, Nef dimerizes, juxtaposing the two YFP fragments and reconstituting the fluorescent YFP structure. Cells expressing Nef dimers exhibit strong YFP fluorescence that localizes to the same subcellular compartments as wild-type Nef, which include the plasma membrane and the trans-Golgi network. 16 Using the Nef-BiFC assay, this study went on to identify a large series of Nef mutants that disrupted the BiFC signal, providing important biological validation for the X-ray crystal structure of the Nef dimer. Mutants of Nef defective for dimerization as determined by BiFC also failed to support HIV-1 replication and CD4 downregulation, supporting the idea that small molecules that interfere with Nef dimerization may be broad-based inhibitors of Nef function. Indeed, a small-molecule inhibitor of Nef-induced Src family kinase activation, HIV infectivity, and HIV replication was recently found to block Nef dimerization in the BiFC assay. 17
In the present study, we describe a high-content screening (HCS) assay for HIV-1 Nef dimerization blockers based on the Nef-BiFC principle. To enable independent detection of transfected cells, the coding sequences for the two Nef-YFP fusion proteins were linked to an internal monomeric red fluorescent protein (mRFP) reporter, separated by picornavirus “2A” linker sequences in a single expression vector. 18 These viral 2A coding sequences permit individual translation of all three proteins from a single transcript. Cells transfected with this single plasmid were imaged using the Cellomics (Pittsburgh, PA) ArrayScan II HCS platform, which simultaneously records information about Nef dimerization (BiFC channel) and transfection efficiency (mRFP channel) in 384-well plates. Validation studies revealed that gating on the mRFP signal to identify the subpopulation of transfected cells enhanced assay performance. An assay implementation study using wild-type Nef and a dimerization-defective mutant as positive and negative controls for Nef-BiFC, respectively, documented that the assay met universally accepted high-throughput screening (HTS) criteria, with Z factors above 0.5 and coefficients of variance (CVs) of <10% in multiday variability experiments. A pilot screen of the National Cancer Institute (NCI) Diversity Set III identified several hit compounds that reproducibly blocked Nef dimerization in the low micromolar range. Coupling bimolecular fluorescence complementation of Nef-YFP with the ArrayScan II platform enables cell-based HTS of chemical libraries for direct identification of small molecules that interfere with Nef dimerization.
Materials and Methods
Cell Culture
The human cell line 293T was obtained from the American Type Culture Collection (ATCC, Manassas, VA) and maintained at 37 °C in a humidified incubator with a 5% CO2 atmosphere. 293T cells were cultured in Dulbecco’s modified Eagle’s medium (DMEM) supplemented with 5% fetal bovine serum (FBS; Atlanta Biologicals, Flowery Branch, GA) and antibiotic-antimycotic (Life Technologies, Carlsbad, CA). A cell bank of defined passage was established and cells were propagated for no more than 10 passages in culture. 293T cells were transfected using XtremeGeneHP (Roche, Indianapolis, IN) at a 1:2 DNA-to-reagent ratio with 25 ng DNA per well of a 384-well plate.
Nef-2A Plasmid Construction
The single-plasmid BiFC vector for high-content screening (HCS) was created by fusing the N- and C-terminal coding regions of Venus to the C-terminus of the SF2 allele of HIV-1 Nef. The resulting fusion proteins, termed Nef-VN and Nef-VC, contain Venus amino acids 2 to 173 and 155 to 238, respectively. The Nef-VN, Nef-VC, and mRFP coding regions were then sequentially subcloned into the plasmid vector pcDNA3.1(–) (Life Technologies), each separated by a unique picornavirus 2A element (E2A and F2A, respectively). The 1161-bp Nef-VN coding sequence was amplified by PCR and inserted via EcoRI/HindIII sites. An 1167-bp fragment consisting of the E2A region fused in-frame and upstream of Nef-VC was amplified by PCR and inserted downstream of Nef-VN via ColdFusion cloning (System BioSciences, Mountain View, CA). Finally, a 1354-bp fragment encoding F2A-mRFP and a stop codon (TGA) was amplified by PCR and inserted via ColdFusion cloning. The final open reading frame encodes Nef-VN/E2A/Nef-VC/F2A/mRFP (see Fig. 1A ); for simplicity, this construct is referred to as Nef-WT2A throughout the article.
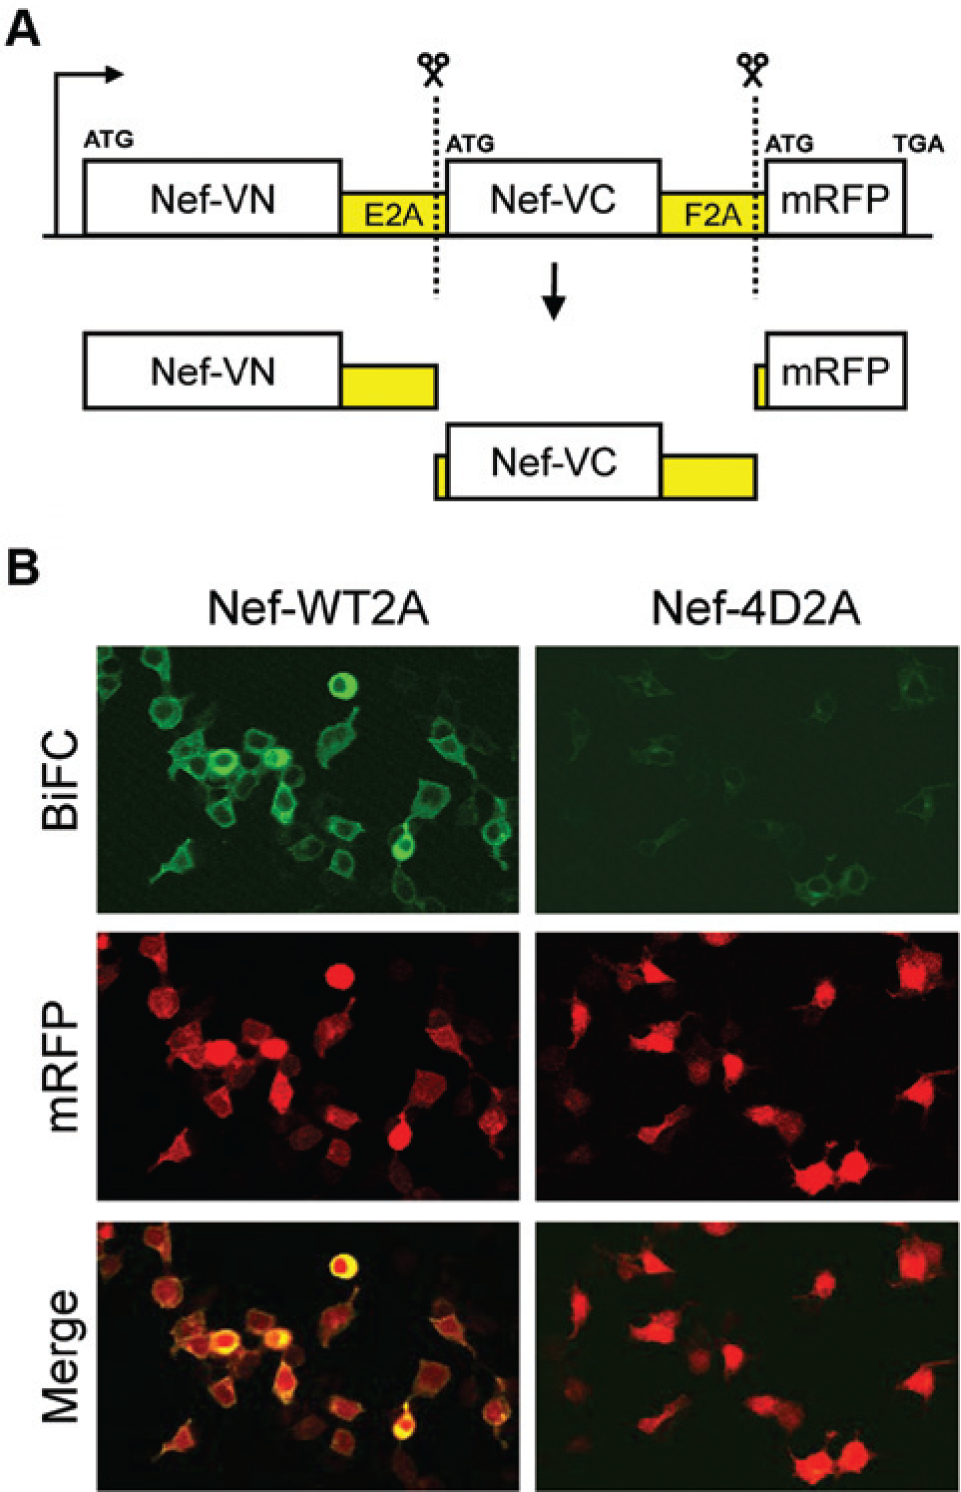
Single-plasmid expression vector for detection of Nef–bimolecular fluorescence complementation (BiFC) inhibitors by high-content screening. (
To facilitate subcloning of the Nef-4D mutant control, a new starting template was synthesized to introduce unique restriction sites flanking each Venus fragment and mRFP (DNA2.0, Menlo Park, CA). This fragment, which encoded the VN-E2A–VC-F2A backbone, was subcloned into pCDNA3.1(–). A 642-bp fragment containing the Nef-4D mutant coding region was amplified by PCR and cloned upstream and in-frame of both the VN and VC genes using EcoRI/HpaI and SacII/AgeI sites, respectively. A 694-bp mRFP complementary DNA (cDNA) was PCR-amplified and subcloned downstream of the F2A element via unique BsiWI/HindIII sites. The final sequence encodes Nef-4D-VN/E2A/Nef-4D-VC/F2A/mRFP. This construct is referred to as Nef-4D2A throughout the article. Confocal images of 293T cells transfected with the Nef-WT2A and 4D2A vectors were captured on an Fluoview FV1000 confocal microscope (Olympus, Tokyo, Japan) using a 20× objective (NA 0.85). Venus and mRFP fluorescence were detected using the excitation wavelengths 488 nm and 559 nm, respectively.
BiFC-ArrayScan Assay
Assays were conducted in sterile, black clear-bottom, collagen-coated 384-well plates (cat. 356667; BD Biosciences, Franklin Lakes, NJ). Plates containing aliquots of compound stock solutions (10 mM in 100% DMSO) were stored in a Matrical Ministore (Brooks Automation, Spokane, WA) under temperature- and humidity-controlled conditions and reconstituted to 30 µM in growth medium on the day of the experiment. In total, 15 µL of 30-µM compound solutions were transferred to assay plates using a Janus MDT automated workstation (PerkinElmer, Waltham, MA). The first and last two columns (1/2 and 23/24) of each 384-well plate contained cells transfected with either the positive or negative control plasmids (Nef-WT2A and Nef-4D2A, respectively) in the presence of vehicle (DMSO). Cells were transfected as a single batch, and 104 cells were seeded per well in 30 µL of medium using a MAP-C2 bulk liquid dispenser (Titertek, Huntsville, AL). The final concentration of DMSO carrier solvent was 0.1%. Forty-eight hours after treatment, cells were fixed with formaldehyde (4%) and counterstained with Hoechst 33342 (H1399; Invitrogen, Carlsbad, CA) at 10 µg/mL in Hank’s balanced salt solution (HBSS). After a 30-min incubation at room temperature, plates were washed three times with HBSS on the Titertek MAP-C2, sealed, and stored at 4 °C until imaging.
For the HCS screen, images were acquired on the ArrayScan II using a 10× objective and a Texas Red compatible filter set (XF53; Omega Optical, Brattleboro, VT) at excitation/emission wavelengths of 350/461 nm (DAPI, Hoechst), 494/519 nm (FITC, BiFC), and 595/613 nm (Texas Red, mRFP). Using the Compartmental Analysis Bioapplication (Thermo Fisher Cellomics, Pittsburgh, PA), a mask was created from Hoechst-stained nuclei to serve as a reference point for intensity measurements and to enumerate cell numbers. For measurements of mRFP and BiFC intensity, the nuclear mask was enlarged by one and three pixels, respectively, to account for the different subcellular localization patterns of the two fluorophores. Mean fluorescence intensities were then calculated for both channels in an area defined by the channel-specific masks. A threshold was set for mRFP-expressing cells based on visual evaluation of cells transfected with the Nef-WT2A plasmid. Cells were classified as positive if their mean mRFP intensity exceeded this threshold. For each well, the instrument was set to acquire 1000 mRFP-positive cells or 16 imaging fields, whichever came first.
Chemical Library
The NCI Diversity Set III library, a collection of 1597 diverse structures, was obtained from the Developmental Therapeutics Program, National Cancer Institute, National Institutes of Health (NIH). Each compound was screened in the Nef-BiFC assay at 10 µM with a final DMSO concentration of 0.1%.
Results
Development of a Single-Vector Nef-BiFC Biosensor Compatible with HCS
BiFC enables direct visualization of binary protein-protein interactions in live cells as a bright fluorescent signal. 19 This approach requires a specific protein-protein interaction (Nef dimerization in this case) to juxtapose the two nonfluorescent YFP fragments, thus promoting complementation of the functional YFP structure. 20 An important assay requirement, therefore, is the expression of both complementary fragments in the same cell. Most BiFC systems involve co-transfection of two plasmids so as to express the target proteins as fusions with the respective N- and C-terminal YFP fragments. To simplify this system for HCS and to ensure equal expression of both Nef BiFC partners within each transfected cell, we designed a monocistronic vector with the Nef-VN and Nef-VC proteins separated by so-called 2A linker peptides. Originally isolated from foot and mouth disease virus (FMDV), 21 the self-cleaving 2A peptide permits stoichiometric translation of several coding regions from a single transcript. 18 When the ribosome encounters the 2A sequence in the messenger RNA (mRNA), it stutters, effectively “cleaving” the polyprotein as translation proceeds.
To take advantage of this phenomenon for BiFC, the coding regions of Nef-VN and Nef-VC, as well as an independent transfection marker (mRFP), were coupled in a single expression vector and separated by a unique 2A peptide sequence ( Fig. 1A ). As a negative control, a similar vector was constructed using a dimerization-defective Nef mutant (4D) described previously. 16 To characterize this single-plasmid BiFC system, 293T cells were transfected with the wild-type and negative control plasmids followed by confocal microscopy. As shown in Figure 1B , transfection with the wild-type plasmid (Nef-WT2A) produced bright green fluorescence with strong localization to the cell periphery, indicative of Nef dimerization at the cell membrane. In contrast, the plasmid expressing the dimerization-defective Nef-4D mutant exhibited virtually no BiFC signal. Comparable levels of mRFP fluorescence were expressed in both transfected cell populations, providing a positive control for transfection efficiency.
HCS Assay Development
We next implemented the single-plasmid Nef-BiFC system on the ArrayScan II HCS platform. We first performed a time course experiment to determine the optimal end point for detection of the Nef-BiFC signal. Signal intensities were measured 6, 24, 36, and 48 h after transfection for both Nef-BiFC and mRFP ( Fig. 2A ). Interestingly, mRFP fluorescence appeared first, followed by the Nef-BiFC signal 8 to 12 h later. This delay in the appearance of Nef-BiFC fluorescence most likely reflects the time required for Nef dimerization, YFP complementation, and fluorophore maturation. 19 Both mRFP and Nef-BiFC fluorescence were ultimately observed in approximately 80% of the transfected cells, and similar results were obtained with two different transfection reagents.
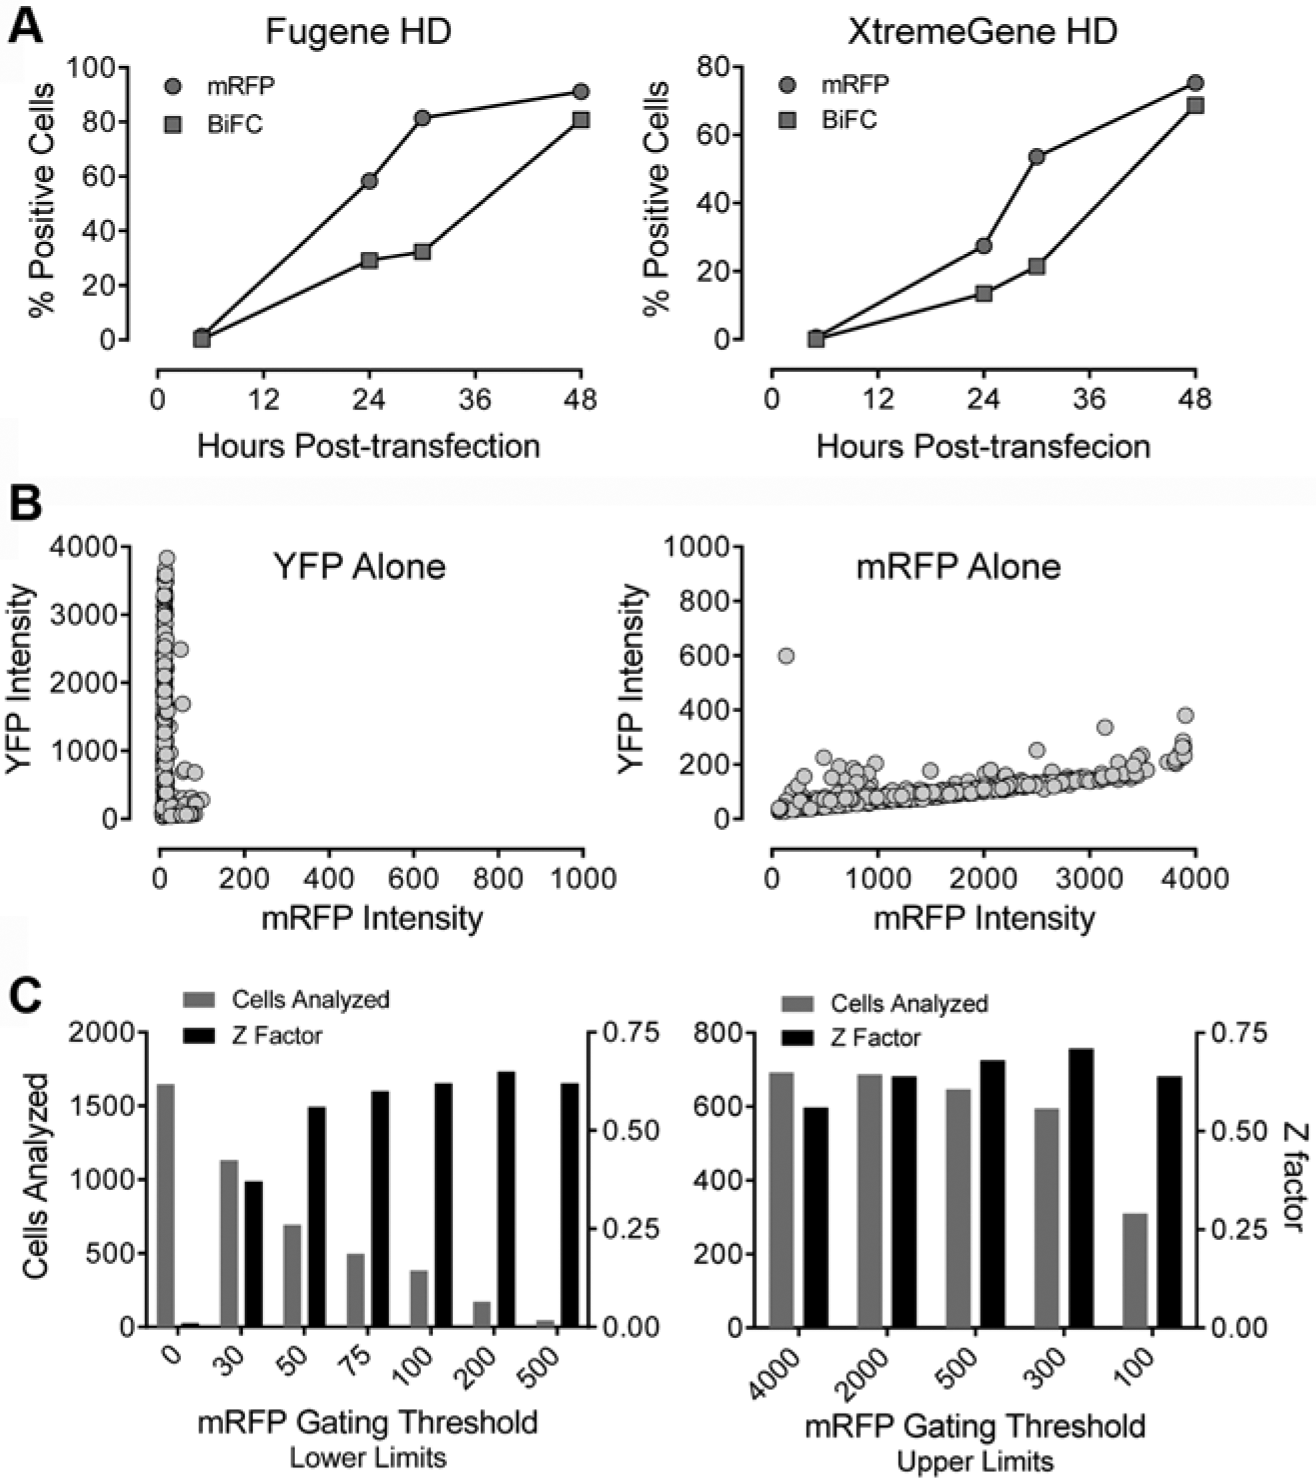
Characterization of single-plasmid biosensors for Nef dimerization using the ArrayScan II imaging platform in transfected 293T cells. (
To control for potential fluorescence bleed-through between the YFP and mRFP channels, 293T cells were transfected with expression plasmids for mRFP or YFP alone and imaged in the FITC (YFP) and Texas Red (mRFP) channels ( Fig. 2B ). Cells expressing YFP, even at very high levels, were not detected in the RFP channel ( Fig. 2B , left). However, a small mRFP crossover signal was observed in the FITC (YFP) channel that was proportional to the mRFP signal intensity ( Fig. 2B , right). To assess the extent to which mRFP bleed-through might affect the measurement of BiFC (YFP) fluorescence, we quantified the effect of mRFP marker expression levels on assay performance over a series of gating thresholds. YFP signal intensities were quantified in cells transfected with either the Nef-WT2A plasmid or the mRFP-only control plasmid. Z factors were then determined as a function of placing lower (dim cells) and upper (bright cells) thresholds within the mRFP channel. The Z factor is a convenient tool to assess the quality of the assay because it takes into account both the magnitude of separation of the mean values for the positive and negative controls and their standard deviations. 22 As shown in Figure 2C (left panel), setting a lower-limit fluorescence intensity threshold of 50 or higher, thereby gating only on the population of mRFP-expressing cells, significantly improved assay performance (Z factor = 0.62). On the other hand, assay performance was unaffected by the inclusion of the brightest RFP-positive cells (Z ≥ 0.56 in each case; Fig. 2C , right panel). This experiment demonstrates that even in cells with very high levels of mRFP expression, any spectral spillover of the mRFP signal into the YFP channel does not negatively affect assay performance. Based on these data, mRFP-negative cells were gated out in subsequent experiments.
We next tested cells transfected with either the Nef-WT2A or 4D2A plasmids on the ArrayScan II under screening conditions. Nuclei of transfected cells were stained with Hoechst 33342 prior to imaging to provide a reference point for cell identification and to calculate cell loss as an indirect measure of compound toxicity. Cells were imaged on the ArrayScan II as described under Materials and Methods ( Fig. 3A ). The mask generated from the Hoechst nuclear stain was used as a reference point to define the region of interest of individual cells for both the RFP and BiFC channels, and the corresponding average intensities were acquired and are plotted in Figure 3B . Comparison of the signals obtained from cells expressing either the wild-type (WT2A) or mutant (4D2A) Nef-BiFC fusion pairs revealed a dramatic difference in the BiFC fluorescence intensities, while mRFP expression was similar for both populations. The difference in the BiFC signal between the two populations was readily evident when comparing the slopes of the linear regression lines fit to each data set (m = 0.81 vs. 0.11 for wild-type Nef vs. the 4D mutant, respectively; Fig. 3B ).
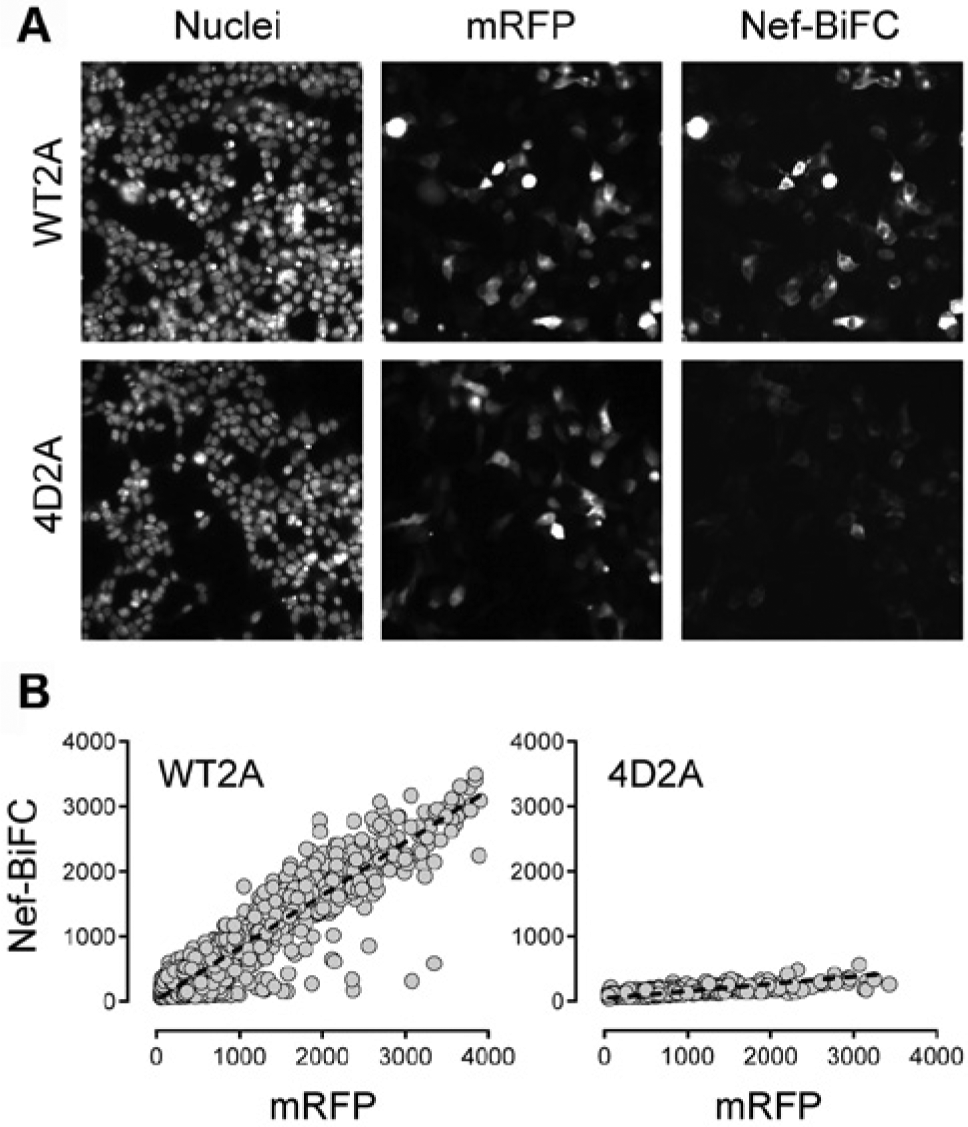
Automated imaging of 293T cells transfected with the Nef-WT2A and Nef-4D2A plasmids. (
Assay Optimization and Multiday Variability Studies
Having established a clear assay window between the Nef-WT2A and 4D2A plasmid pair by automated microscopy, we next optimized the analysis parameters for changes in BiFC relative to assay performance. Using a 384-well plate format and cells transfected with either the wild-type or negative control plasmids (half-max/half-min) to generate a larger number of data points, a distinct separation between the positive and negative controls was observed even under the most basic detection parameters ( Fig. 4A , % BiFC+). We next examined the average BiFC fluorescence intensity per well ( Fig. 4B ). We again observed a clear difference between the wild-type and mutant populations, with a signal-to-background ratio of 2.9 and a Z factor of 0.57. However, this analysis also revealed variations in the fluorescence intensity per cell (CV approaching 8%), which most likely reflects the range of expression of the Nef-BiFC proteins. To control for this variation, we normalized the fluorescence intensities of the BiFC signals for each cell to those of the corresponding mRFP expression marker ( Fig. 4C ). Data analysis based on the BiFC to mRFP ratio decreased variability (CVs of 4% and 5% for WT2A and 4D2A, respectively) and improved the Z factor to 0.66.
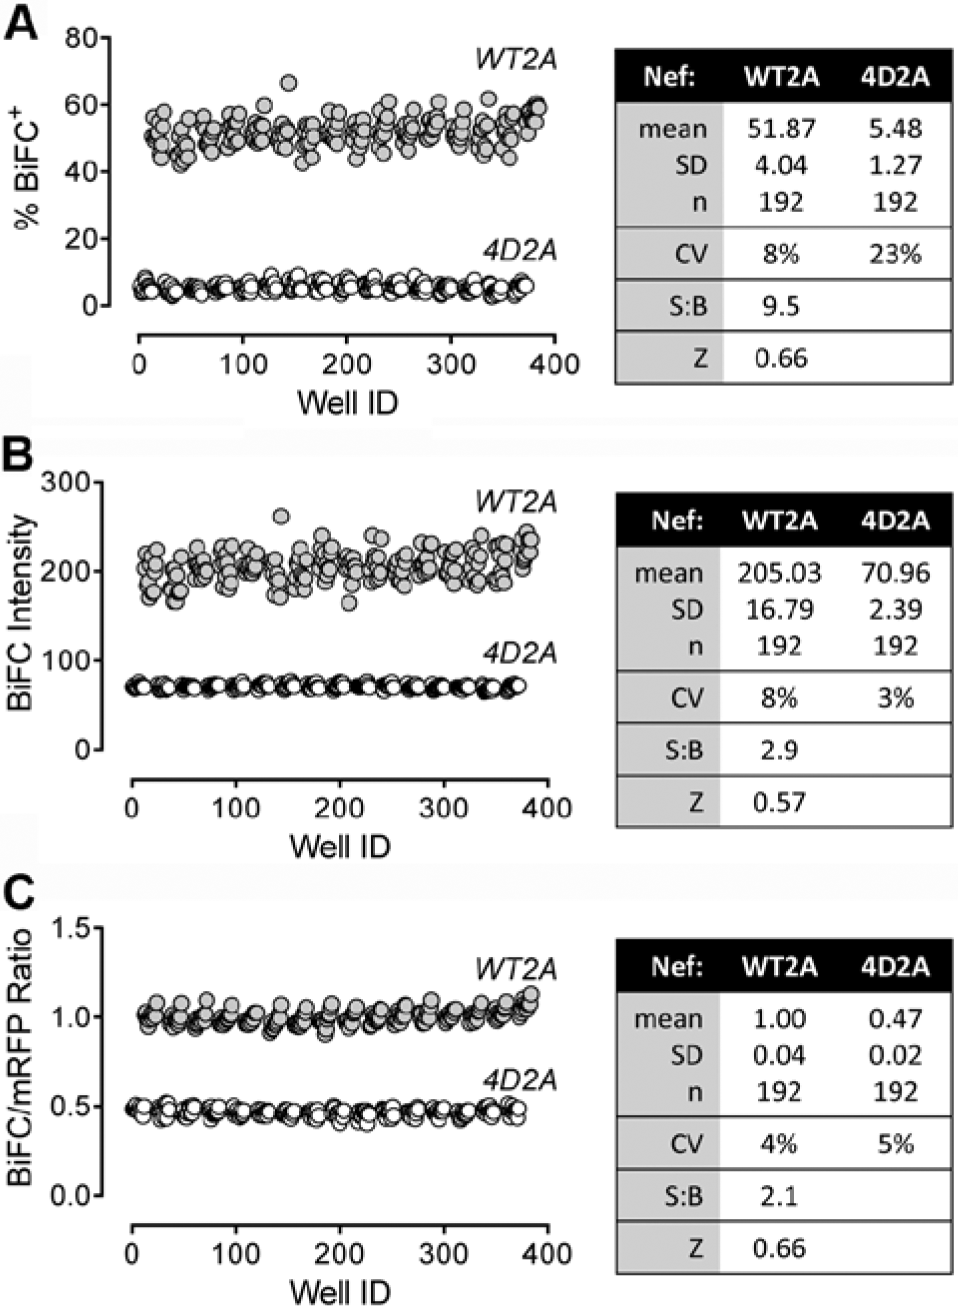
Normalization of the Nef–bimolecular fluorescence complementation (BiFC) signal to monomeric red fluorescent protein (mRFP) expression improves assay performance. Transfected 293T cells expressing the wild-type Nef-BiFC protein pair (WT2A) or the dimerization-defective control (4D2A) were imaged on the ArrayScan II platform, and the resulting data were analyzed in three different ways: (
We next investigated tolerance to DMSO, the carrier solvent to be used for addition of library compounds. As shown in
The BiFC/mRFP ratiometric approach was then validated in a multiday variability study. Two full microplates of cells transfected with the Nef-WT2A (maximum signal) or Nef-4D2A (minimum signal) BiFC plasmids were processed on 3 consecutive days on laboratory automation equipment to be used in subsequent HTS experiments. To simulate conditions of chemical library screening, cells were treated with 0.1% DMSO, the final concentration of carrier solvent to be used as determined above. The Nef-BiFC assay met universally accepted HTS criteria and returned the same level of statistical significance on all 3 days. All Z factors were >0.5 with low intra- and interplate variability (CVs of less than 8% for both positive and negative controls and less than a 10% difference between days and between the means of plate pairs;
Pilot Screen for Inhibitors of Nef Dimerization via the BiFC Assay
To identify small-molecule inhibitors of Nef dimerization and further validate the Nef-BiFC assay system, we screened the NCI Diversity Set III of 1597 compounds representative of a broad range of chemical scaffolds. For the pilot screen, 293T cells were transfected in a single batch and then robotically dispensed into 384-well assay plates preloaded with the test compounds. All plates contained clusters of DMSO-only positive control wells (Nef-WT2A) plus wells transfected with the dimerization-defective Nef mutant (4D2A). The average Z factor for all assay plates from the primary screen was greater than 0.5, indicating robust assay performance under screening conditions. The resulting data were handled as described below.
Data were preprocessed using the raw BiFC/mRFP ratio values following the approach of Makarenkov et al.
23
This procedure is especially important for small screens (<100 plates) to reduce the influence of outliers on plate means and standard deviations and make measurements comparable across multiple plates. The presence of systematic error was first ruled out by examining the hit distribution surface (heat mapping).24,25 Next, the average BiFC/mRFP fluorescence ratio and standard deviation for the positive control wells (WT2A) were calculated for each plate. An upper-limit threshold was then set as three standard deviations above the average control ratio. Compound-treated wells greater than this threshold were then eliminated, because visual inspection revealed that many of these wells contained autofluorescent or toxic compounds (
Following preprocessing, we next analyzed the data using three independent statistical procedures to evaluate the effectiveness of the BiFC/mRFP ratiometric approach to identify positive hits. A rank order was generated from each of the analyses, and these are compared in
Figure 5
. In the first analysis, results from all compounds were simply ranked according to the calculated BiFC/mRFP ratio for each well (
Fig. 5A
). The ratio reports the level of Nef dimerization (BiFC) relative to total protein expression based on the mRFP reporter as described above. In the second analysis, control normalization23,26,27 (normalized percent inhibition) was calculated for each well, with values normalized relative to the mean ratios for the Nef-WT2A (max) and 4D2A (min) controls (
Fig. 5B
). In the third analysis, a Z score26,27 was calculated for the BiFC/mRFP ratio for each well (
Fig. 5C
). This statistic provides a measure of variation from the mean sample ratio that is independent of the controls. Finally, a fourth rank order was generated based on pseudo–percent inhibition,
24
where normalization is based on the median (rather than the mean) value of the compounds and is less sensitive to the influence of outliers (
Fig. 5D
). The top 1% of compounds present in each of the four rankings was then compared, and a strong correlation emerged: the same compounds identified by the simple ratiometric approach were also identified by both the control normalization and Z score analyses while all but one compound matched by pseudo–percent inhibition. Furthermore, not only were the same compounds identified by all three categories, but the same rank order was also maintained across all the parameters tested. The identities of the top compounds are presented in
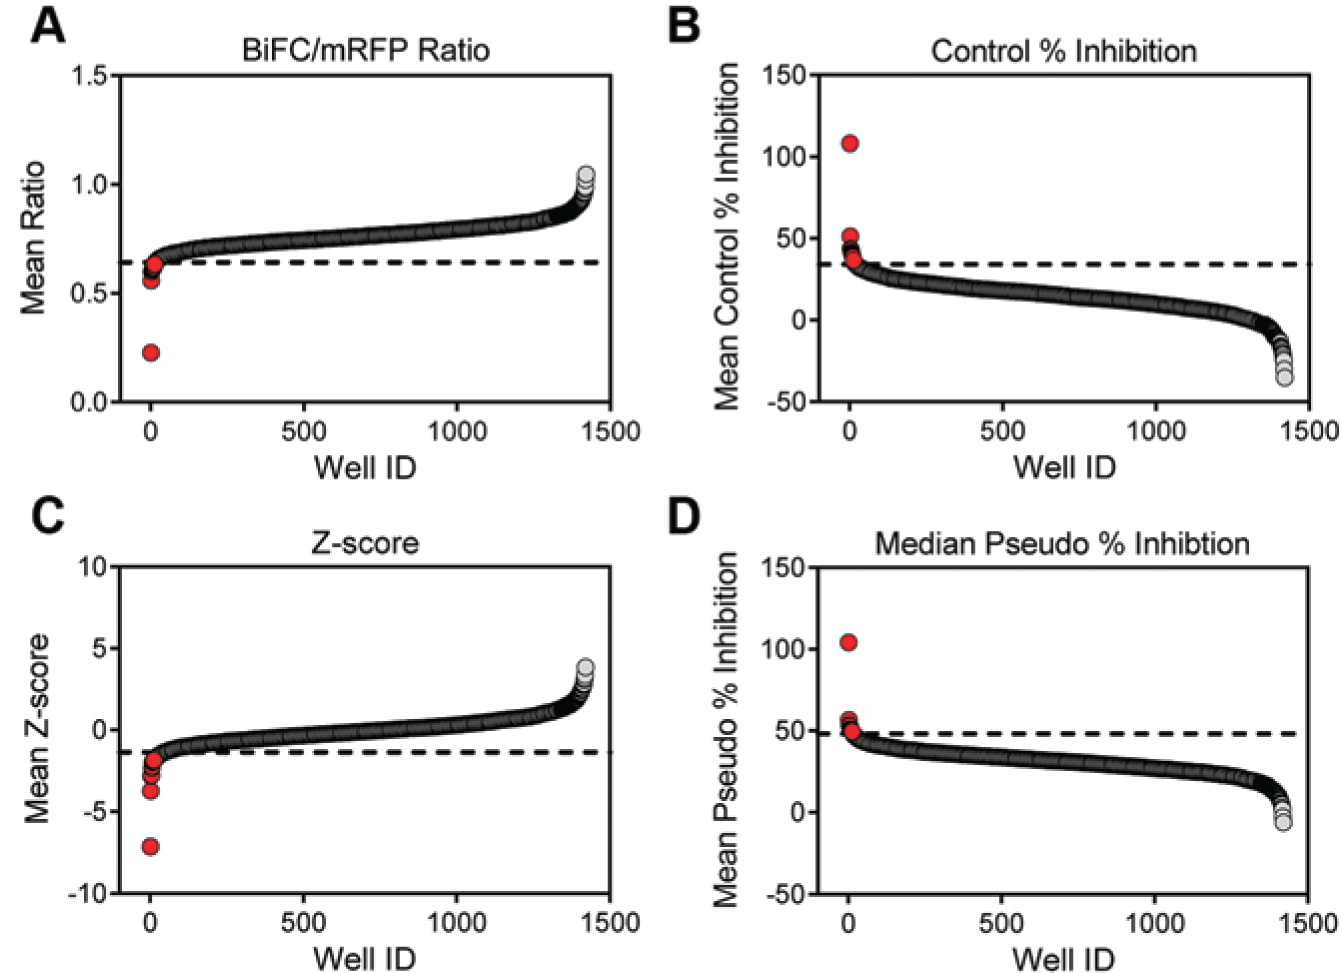
Pilot screen of the National Cancer Institute Diversity Set III using the Nef–bimolecular fluorescence complementation (BiFC) assay. The Diversity Set III of ~1600 compounds was screened for inhibitors of Nef dimerization using the Nef-BiFC assay as described under Materials and Methods. The resulting data set was ranked according to (
Reproducibility and variability were next assessed using the potentially active compounds of various potencies (top 1% as described above). Two independent trials were conducted with each compound tested in quadruplicate at the original screening concentration (10 µM). All plates also contained clusters of DMSO-only positive control wells (Nef-WT2A) plus wells transfected with the dimerization-defective Nef mutant (4D2A). Using a one-tailed t-test relative to the untreated WT2A controls, 10 of these 16 compounds were confirmed to have BiFC/mRFP ratios significantly lower than the controls (p < 0.01;
Fig. 6A
). Comparison of the results from the two trials also met the criteria established in the NIH/Lilly Assay Guidance Manual for reproducibility, with a mean ratio of 1.10, a ratio limit interval of 0.99 to 1.23, a minimum significance ratio of 2.21, and a limit of agreement interval of 0.49 to 2.45. Compound efficacy was also evaluated and passed all criteria with a mean difference of less than 5%, a difference limit interval of 2.23 to 6.99, and a mean significant difference of less than 20%. The ratio–geometric mean (reproducibility) and difference-mean (efficacy) plots for individual and average compound values are shown in
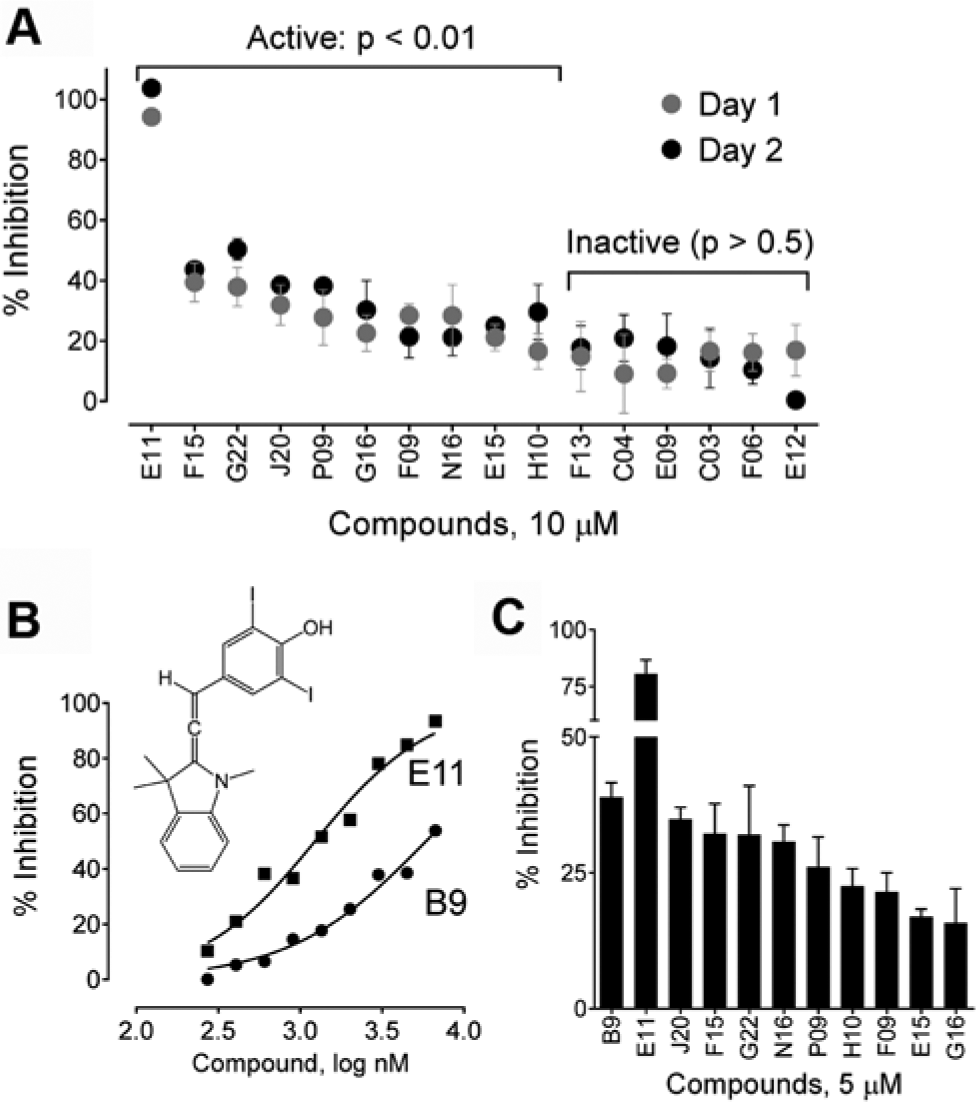
Reassay of hit compounds. (
The 10 confirmed hit compounds were then reevaluated using the screening assay in comparison to the diphenylpyrazolodiazene compound B9, which we have recently shown to interfere with Nef dimerization in a similar 293T cell-based BiFC assay.
17
Figure 6B
shows that B9 produced a concentration-dependent inhibition of the Nef-BiFC/mRFP ratio in the automated Nef-BiFC assay with an IC50 value of 5.8 µM, consistent with our published results.
17
Six of the hit compounds identified in the NCI Diversity Set inhibited Nef dimerization with similar or greater potency than B9 at a concentration of 5 µM (
Fig. 6C
). The remaining compounds were less potent, but all produced at least partial inhibition of the Nef-BiFC signal at this concentration (
Fig. 6C
). Moreover, the top compound unanimously identified by all four ranking approaches from the screen (compound E11) was particularly potent, suppressing Nef-BiFC to a greater extent than B9 with an IC50 value of 1.23 µM (
Fig. 6B
). To exclude the possibility of a toxicity-associated reduction in fluorescence, cytotoxicity assays were performed for each of these compounds in 293T cells using the Cell-Titer Blue (Promega, Madison, WI) cell viability assay as previously described.
17
None of the compounds showed appreciable toxicity in this assay at a concentration of 5 µM, with the exception of N16, which reduced viability by 33% relative to the untreated control (
Discussion
In this study, we describe a BiFC assay for the identification of small-molecule inhibitors of HIV-1 Nef dimerization that is compatible with automation and HTS. Previous studies have demonstrated that dimerization is critical to Nef function and have identified the Nef dimerization interface as a hotspot for small-molecule inhibitor targeting (see Introduction). However, no assays have been described that enable direct screening for inhibitors of Nef dimer formation. The assay described here addresses this need with a robust, cell-based assay that has the potential to support a large-scale HTS campaign to identify direct HIV-1 Nef antagonists.
A key factor in the successful adaptation of the Nef-BiFC assay to automated HCS was the development of a single vector that drives stoichiometric production of the Nef-VN and Nef-VC complementing pair plus an independent marker (mRFP) to identify the transfected cell population. Addition of the mRFP reporter also eliminated the need for immunofluorescent counterstaining to control for Nef protein expression levels as used previously for this assay.16,17 This approach resulted in a linear correlation between the mRFP and Nef-BiFC fluorescence intensities (
Fig. 3B
), allowing us to normalize the Nef-BiFC signal to the relative protein expression level present in each cell (as mRFP). This ratiometric method significantly decreased well-to-well variability and improved overall assay performance (
Fig. 4
). The BiFC/mRFP ratio also gave insight into the specificity of potential inhibitors during the screening process. Data from compounds that specifically inhibited the Nef-BiFC signal without affecting mRFP were readily distinguished from the overall mean ratio values, whereas compounds causing nonspecific decreases in both the interaction and expression channels showed little separation from the untreated control wells or those treated with inactive compounds. Similarly, toxic or autofluorescent compounds often resulted in high BiFC/mRFP ratios (
One possible concern regarding use of a cell-based BiFC system for HTS is the irreversible nature of the reconstituted fluorophore. Although BiFC is dependent on Nef dimerization, chemical dissociation of the Nef dimer is unlikely to reverse this process once the YFP complementation step has occured.19,28 Time course experiments ( Fig. 2 ) revealed a lag time of several hours between biosensor protein expression and YFP complementation. Therefore, cells were transfected in a single batch and rapidly plated in wells containing each compound to ensure that the compound is present prior to expression of the Nef-BiFC proteins. In this way, active compounds have the opportunity to inhibit Nef dimerization and thus reduce BiFC during the time course of the assay.
Protein-protein interactions, while historically considered intractable to small-molecule inhibitor discovery, are now growing in importance as viable targets for therapeutic intervention.29,30 While recent successes in this field have taken advantage of computational and fragment-based screening approaches, the ability to model specific interactions in cell-based assays provides an important platform for unbiased lead compound discovery. The assay described here demonstrates that YFP fluorescence complementation effectively reports the homotypic interaction required for HIV-1 Nef function as a new platform for the discovery of antiretroviral lead compounds. The lessons learned from this study have potential applicability for other intracellular targets in which dimerization plays a role.
Footnotes
Declaration of Conflicting Interests
The authors declared no potential conflicts of interest with respect to the research, authorship, and/or publication of this article.
Funding
The authors disclosed receipt of the following financial support for the research, authorship, and/or publication of this article: This work was supported by National Institutes of Health grants R01 AI057083 and R01 AI102724 to T.E.S. and by the University of Pittsburgh Cancer Institute Chemical Biology Facility, which is supported in part by National Institutes of Health grant P30 CA047904.
References
Supplementary Material
Please find the following supplemental material available below.
For Open Access articles published under a Creative Commons License, all supplemental material carries the same license as the article it is associated with.
For non-Open Access articles published, all supplemental material carries a non-exclusive license, and permission requests for re-use of supplemental material or any part of supplemental material shall be sent directly to the copyright owner as specified in the copyright notice associated with the article.