
Abstract
Drug-induced phospholipidosis is characterized by the accumulation of intracellular phospholipids in cells exposed to cationic amphiphilic drugs. The appearance of unicentric or multicentric multilamellar bodies viewed under an electron microscope (EM) is the morphological hallmark of phospholipidosis. Although the EM method is the gold standard for detecting cellular phospholipidosis, this method has its drawbacks, including low throughput, high cost, and unsuitability for screening a large chemical library. In this study, a cell-based phospholipidosis assay has been developed using the LipidTOX Red reagent in HepG2 cells and miniaturized into a 1536-well plate format. To validate this assay for high-throughput screening (HTS), the LOPAC library of 1280 compounds was screened using a quantitative HTS platform. A group of known phospholipidosis inducers, such as amiodarone, propranolol, chlorpromazine, desipramine, promazine, clomipramine, and amitriptyline, was identified by the screen, consistent with previous reports. Several novel phospholipidosis inducers, including NAN-190, ebastine, GR127935, and cis-(Z)-flupentixol, were identified in this study and confirmed using the EM method. These results demonstrate that this assay can be used to evaluate and profile large numbers of chemicals for drug-induced phospholipidosis.
Keywords
Introduction
Phospholipidosis (PLD) is characterized by excessive intracellular accumulation of phospholipids, with a distinct morphological appearance of lamellar bodies visible under an electron microscope (EM). 1 Drugs, including many antibiotics, antidepressants, and antihistamines, induce PLD in various tissues such as lung, 2 heart, 3 liver, 4 and kidney. 5 These compounds share the common feature of a cationic amphiphilic structure and so are commonly called cationic amphiphilic drugs (CADs). Specifically, CADs contain a hydrophobic aromatic or aliphatic ring structure and a hydrophilic side chain containing a cationic amine group, which is charged at physiological pH. 1 There are several hypothesized mechanisms for PLD, including direct inhibition of the enzymatic activity of the phospholipases or other intralysosomal catabolic pathways by CADs,6,7 or the binding of CADs to phospholipids, resulting in indigestible drug-lipid complexes.6,8
At present, there is still no clear evidence that PLD has significant toxicological effects in animals or humans. 9 However, several research groups found that gentamycin induced PLD in kidney tissues and also caused renal tubular toxicity in the affected tissue.5,10 Amiodarone, an antiarrhythmic agent, has been reported to induce liver cirrhosis accompanying phospholipidosis in a patient with long-term administration of a daily low dose of amiodarone. Reasor et al 11 also reported that amiodarone-induced pulmonary toxicity in rats may be linked to the induction of phospholipidosis, suggesting that drug-induced PLD may have potential adverse effects. Although the toxicological significance of PLD is still under investigation, additional information on the PLD potential of drugs is often requested by the U.S. Food and Drug Administration (FDA) in the drug development process. 12
To date, the determination of PLD relies on transmission electron microscopy (EM), a gold standard method for the detection of PLD. However, the EM method is time-consuming, labor intensive, and unsuitable for screening a large number of compounds. Currently, various fluorescent dyes, including NBD-PE,13,14 NBD-PC, 15 and Nile Red, 16 have been developed to measure PLD in cells. More recently, Nioi et al 17 also developed a PLD assay in 96-well plate format using LipidTOX Red, a fluorescent lipophilic dye. However, these assays have complicated assay protocols requiring several wash steps, which limit throughput. In this study, we have validated a HepG2 cell-based PLD assay in 1536-well plate format and screened 1280 compounds in the LOPAC (Library of Pharmacologically Active Compounds) collection in an established quantitative high-throughput screening (qHTS) platform. 18 The PLD inducers identified from the primary screen were confirmed using the EM method. Thus, the results suggest that this assay is robust and can be used to screen large compound collections to identify novel PLD inducers.
Materials and Methods
Cell Culture
Human HepG2 (hepatocellular carcinoma) cell line was purchased from the American Type Culture Collection (ATCC, Manassas, VA). HepG2 cells were cultured in minimum essential (Eagle) medium (ATCC) supplemented with 10% fetal bovine serum (FBS) (Hyclone Laboratories, Logan, UT) and 100 U/mL penicillin and 100 µg/mL streptomycin (Invitrogen, Carlsbad, CA). The cells were maintained at 37 °C under a humidified atmosphere and 5% CO2.
Reagents
The LipidTOX Red dye and Hoechst 33342 were obtained from Invitrogen. A library of pharmacologically active compounds (LOPAC), containing 1280 compounds with known pharmacological actives, as well as other compounds used in this study were purchased from Sigma-Aldrich (St. Louis, MO).
LipidTOX PLD Assay and qHTS
The PLD assay can quantify the PLD changes in cells. A LipidTOX Red dye is used to fluorescently label intracellular phospholipids to detect PLD formation. The assay protocol in a 1536-well plate format is described in
Cell Viability
Cell viability after compound treatment was determined using a CellTiter-Glo viability assay (Promega, Madison, WI) by measuring intracellular adenosine triphosphate (ATP) content. The cells were dispensed at 900 cells/3 µL/well in 1536-well white-wall/solid-bottom assay plates. After assay plates were incubated for 4 h at 37 °C, 3 µL of 1:500 LipidTOX Red dye using a Multidrop Combi 8 channel dispenser and 23 nL compounds via the pin tool were added into each well. The assay plates were incubated at 37 °C for 24 h, followed by the addition of 4 µL/well of CellTiter-Glo reagent using a flying reagent dispenser (FRD). After a 30-min incubation at RT, the luminescence intensity of the plates was measured using a ViewLux plate reader (PerkinElmer, Shelton, CT).
Electron Microscopy Analysis
Cells were seeded at 500,000 cells/well into 6-well plates (Corning-Costar, Tewksbury, MA). After overnight incubation, the assay plates were treated with five PLD compounds at approximate EC50: 6 µM amiodarone, 3 µM NAN-190, 1 µM ebastine, 3 µM GR127935, 6 µM cis-(Z)-flupentixol, or DMSO vehicle (Fisher Scientific, Pittsburgh, PA) control for 24 h. The assay plates were then washed once with DPBS and fixed in electron microscopy (EM) fixative solution (2% glutaraldehyde in 0.1 M cacodylate buffer, pH 7.2) for 1 h at RT and then stored at 4 °C. For further EM processing and embedding, the cells were postfixed in 1% osmium tetroxide in the same buffer for 1 h and en bloc stained with 0.5% uranyl acetate in 0.1 M acetate buffer, pH 4.2. The cells were then dehydrated in graded ethanol solutions (35%, 50%, 70%, 95%, and 100%) and infiltrated overnight in epoxy resin (Poly/Bed 812; Polysciences, Warrington, PA). After adding fresh pure resin, the cell plates were cured for 72 h in 55 °C. After removing the polystyrene plates, suitable areas for thin sectioning were selected, cut out with a jewelry saw, and gled onto empty resin stubs. Approximately 70-nm-thin sections were cut on an ultramicrotome (Leica EM UC6; Leica Microsystems, Buffalo Grove, IL) and mounted on naked copper grids. The thin sections were double stained (uranyl acetate and lead citrate) and examined under a Hitachi H-7650 transmission electron microscope (Hitachi High Technologies, Gaithersburg, MD), and images were taken using an AMT CCD camera. (Advanced Microscopy Techniques, Woburn, MA).
Data Analysis
Primary data analysis was performed as previously described. 18 Briefly, raw plate reads for each titration point were first normalized to the amiodarone control (19.16 µM, 100%) and DMSO-only wells (basal, 0%) and then corrected by applying a pattern correction algorithm using compound-free control plates (DMSO plates). The standard deviation (SD) of the corrected activities in the DMSO control plates and the lowest concentration plate in each titration series was calculated to assess the extent of random variations in the assay and used as an indicator of assay performance. A good assay is expected to have an SD of <10%. 20 Concentration-response titration points for each compound were fitted to the Hill equation, yielding concentrations of half-maximal induction (EC50) and maximal response (activity at the highest test concentration, efficacy) values.
Compounds considered active in the cell-based PLD assay showed stimulation in the pit integrated intensity per well and pit integrated intensity per cell and had an efficacy ≥30% in both of the above readings. These compounds were selected based on the potency, efficacy, novelty, and structure-activity relationship and then ordered from commercial vendors for confirmation and follow-up studies.
Results
Optimization and Validation of the Cell-Based PLD Assay in the 1536-Well Plate Format
To identify compounds that induce intracellular phospholipidosis, we used a high-content imaging method to optimize and validate the cell-based PLD assay. The assay was miniaturized into a 1536-well plate format with a final assay volume of 6 µL. After HepG2 cells were treated with various concentrations of amiodarone for 24 h in the presence of a PLD dye (LipidTOX Red), the assay plate was fixed with formaldehyde and stained with Hoechst 33342 dye to identify nuclei. Pit integrated intensity per cell was used for quantitative image analysis of puncta formation of PLD in each well. As shown in Figure 1A , amiodarone concentration dependently induced phospholipidosis in HepG2 cells with an EC50 of 4.96 µM, which is consistent with a previous study conducted by Bhandari et al. 19 High-content imaging revealed PLD induction by amiodarone in a concentration-dependent manner, as shown in Figure 1B .
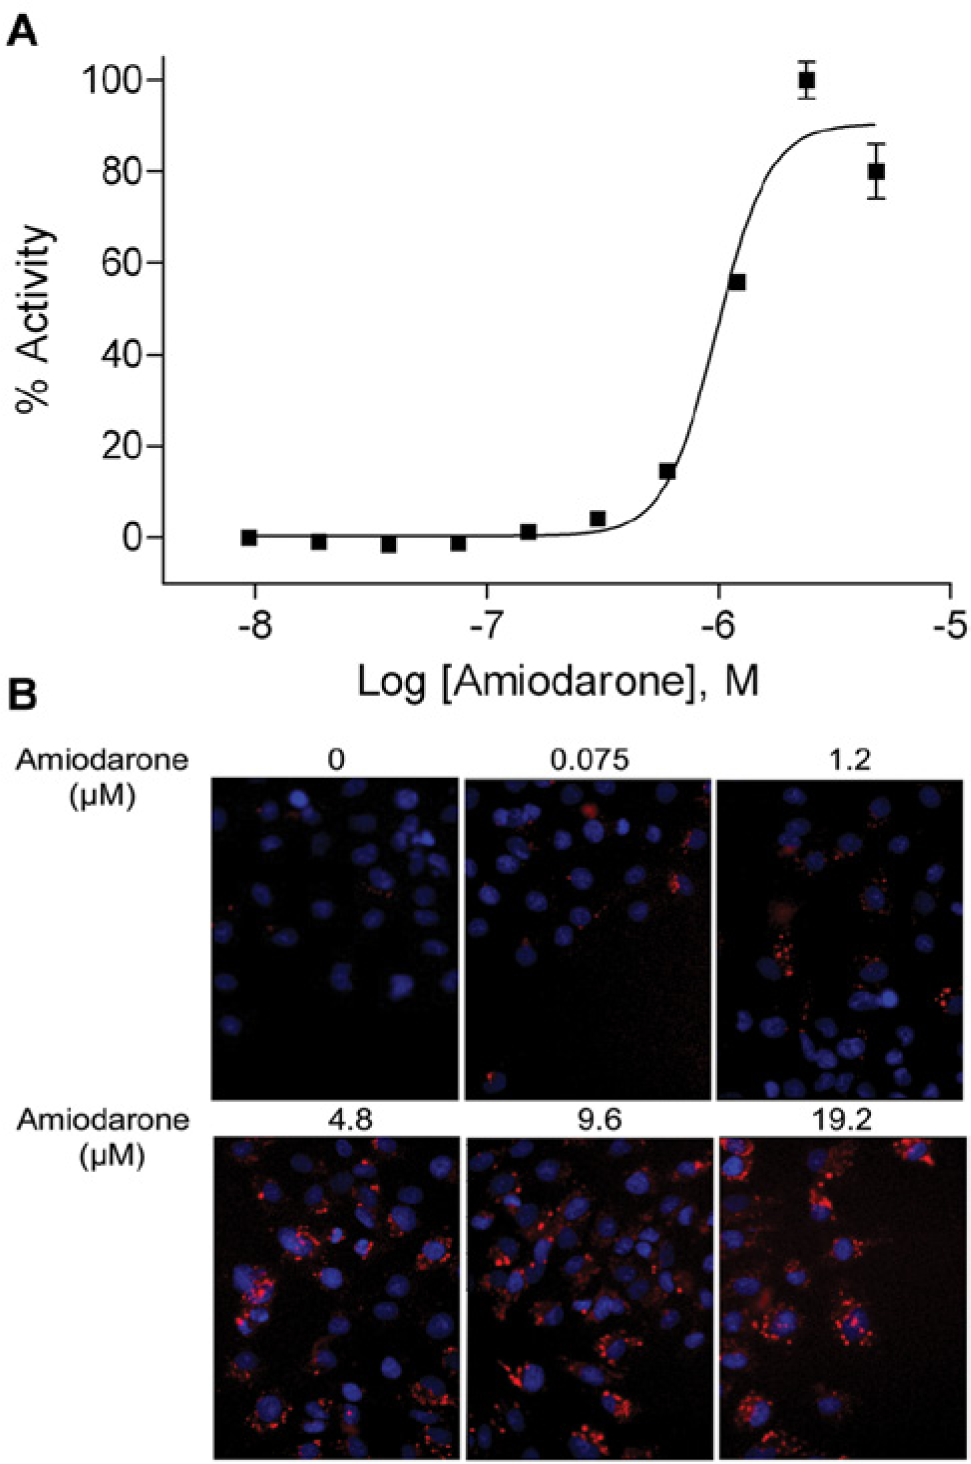
Effect of amiodarone on phospholipidosis (PLD) induction in HepG2 cells. (
To evaluate measurement parameters and optimize assay performance, a plate was tested using DMSO as the negative control and amiodarone as the positive control. After a 24-h treatment of amiodarone (19.16 µM final, 16 wells) or DMSO (32 wells), several algorithmic outputs—pit count per well, pit count per cell, pit integrated intensity per well, and pit integrated intensity per cell—were used for quantitative image analysis of PLD formation. One and two sites were measured in each well. In the one-site measurement, the mean signal-to-background (S/B) ratios were 3.6 ± 0.2, 4.1 ± 0.4, 12.6 ± 3.1, and 14.3 ± 4.2 fold in pit count per well, pit count per cell, pit integrated intensity per well, and pit integrated intensity per cell, respectively. In the two-site measurement, the S/B ratios were 3.5 ± 2.1, 4.4 ± 1.6, 15.7 ± 9.0, and 17.5 ± 10.6 fold in pit count per well, pit count per cell, pit integrated intensity per well, and pit integrated intensity per cell, respectively. The assay standard deviations were calculated among replicates of amiodarone and replicates of DMSO. The SDs from one-site measurement for pit count per well, pit count per cell, pit integrated intensity per well, and pit integrated intensity per cell were 9.0, 8.7, 2.9, and 3.2, respectively. The SDs from two-site measurement for pit count per well, pit count per cell, pit integrated intensity per well, and pit integrated intensity per cell were 8.0, 9.0, 2.4, and 3.4, respectively. The assay SD was used to select the best readout parameter to pursue for further screening. The further experiments, including primary screening and confirmation studies, were performed by imaging one site per well and analyzing data using pit integrated intensity per cell.
Screening Performance and Statistics in qHTS
To evaluate the screening performance of the PLD assay in the qHTS format, we screened the LOPAC collection for PLD induction in HepG2 cells. The screen was carried out over five concentrations ranging from 12 nM to 38 µM, and pit integrated intensity per cell was measured for one site per well. Amiodarone (19.16 µM final) was included as a positive control and DMSO was used as a negative control in each plate to monitor assay performance and plate-to-plate variations during the screen. The average S/B ratio was 15.1 ± 3.0 for pit integrated intensity per cell. The assay SD was 2.1 ± 1.6.
Identification of PLD Inducers
In the LOPAC primary screening, 187 compounds were identified with efficacy values >30%. Among these compounds, 109 were cherry-picked and retested in the PLD assay. The activities for these 109 compounds are listed in
Potencies and Efficacies of Known Phospholipidosis (PLD) Inducers Identified from Primary Quantitative High-Throughput Screening and Confirmed in the Follow-up Assays.
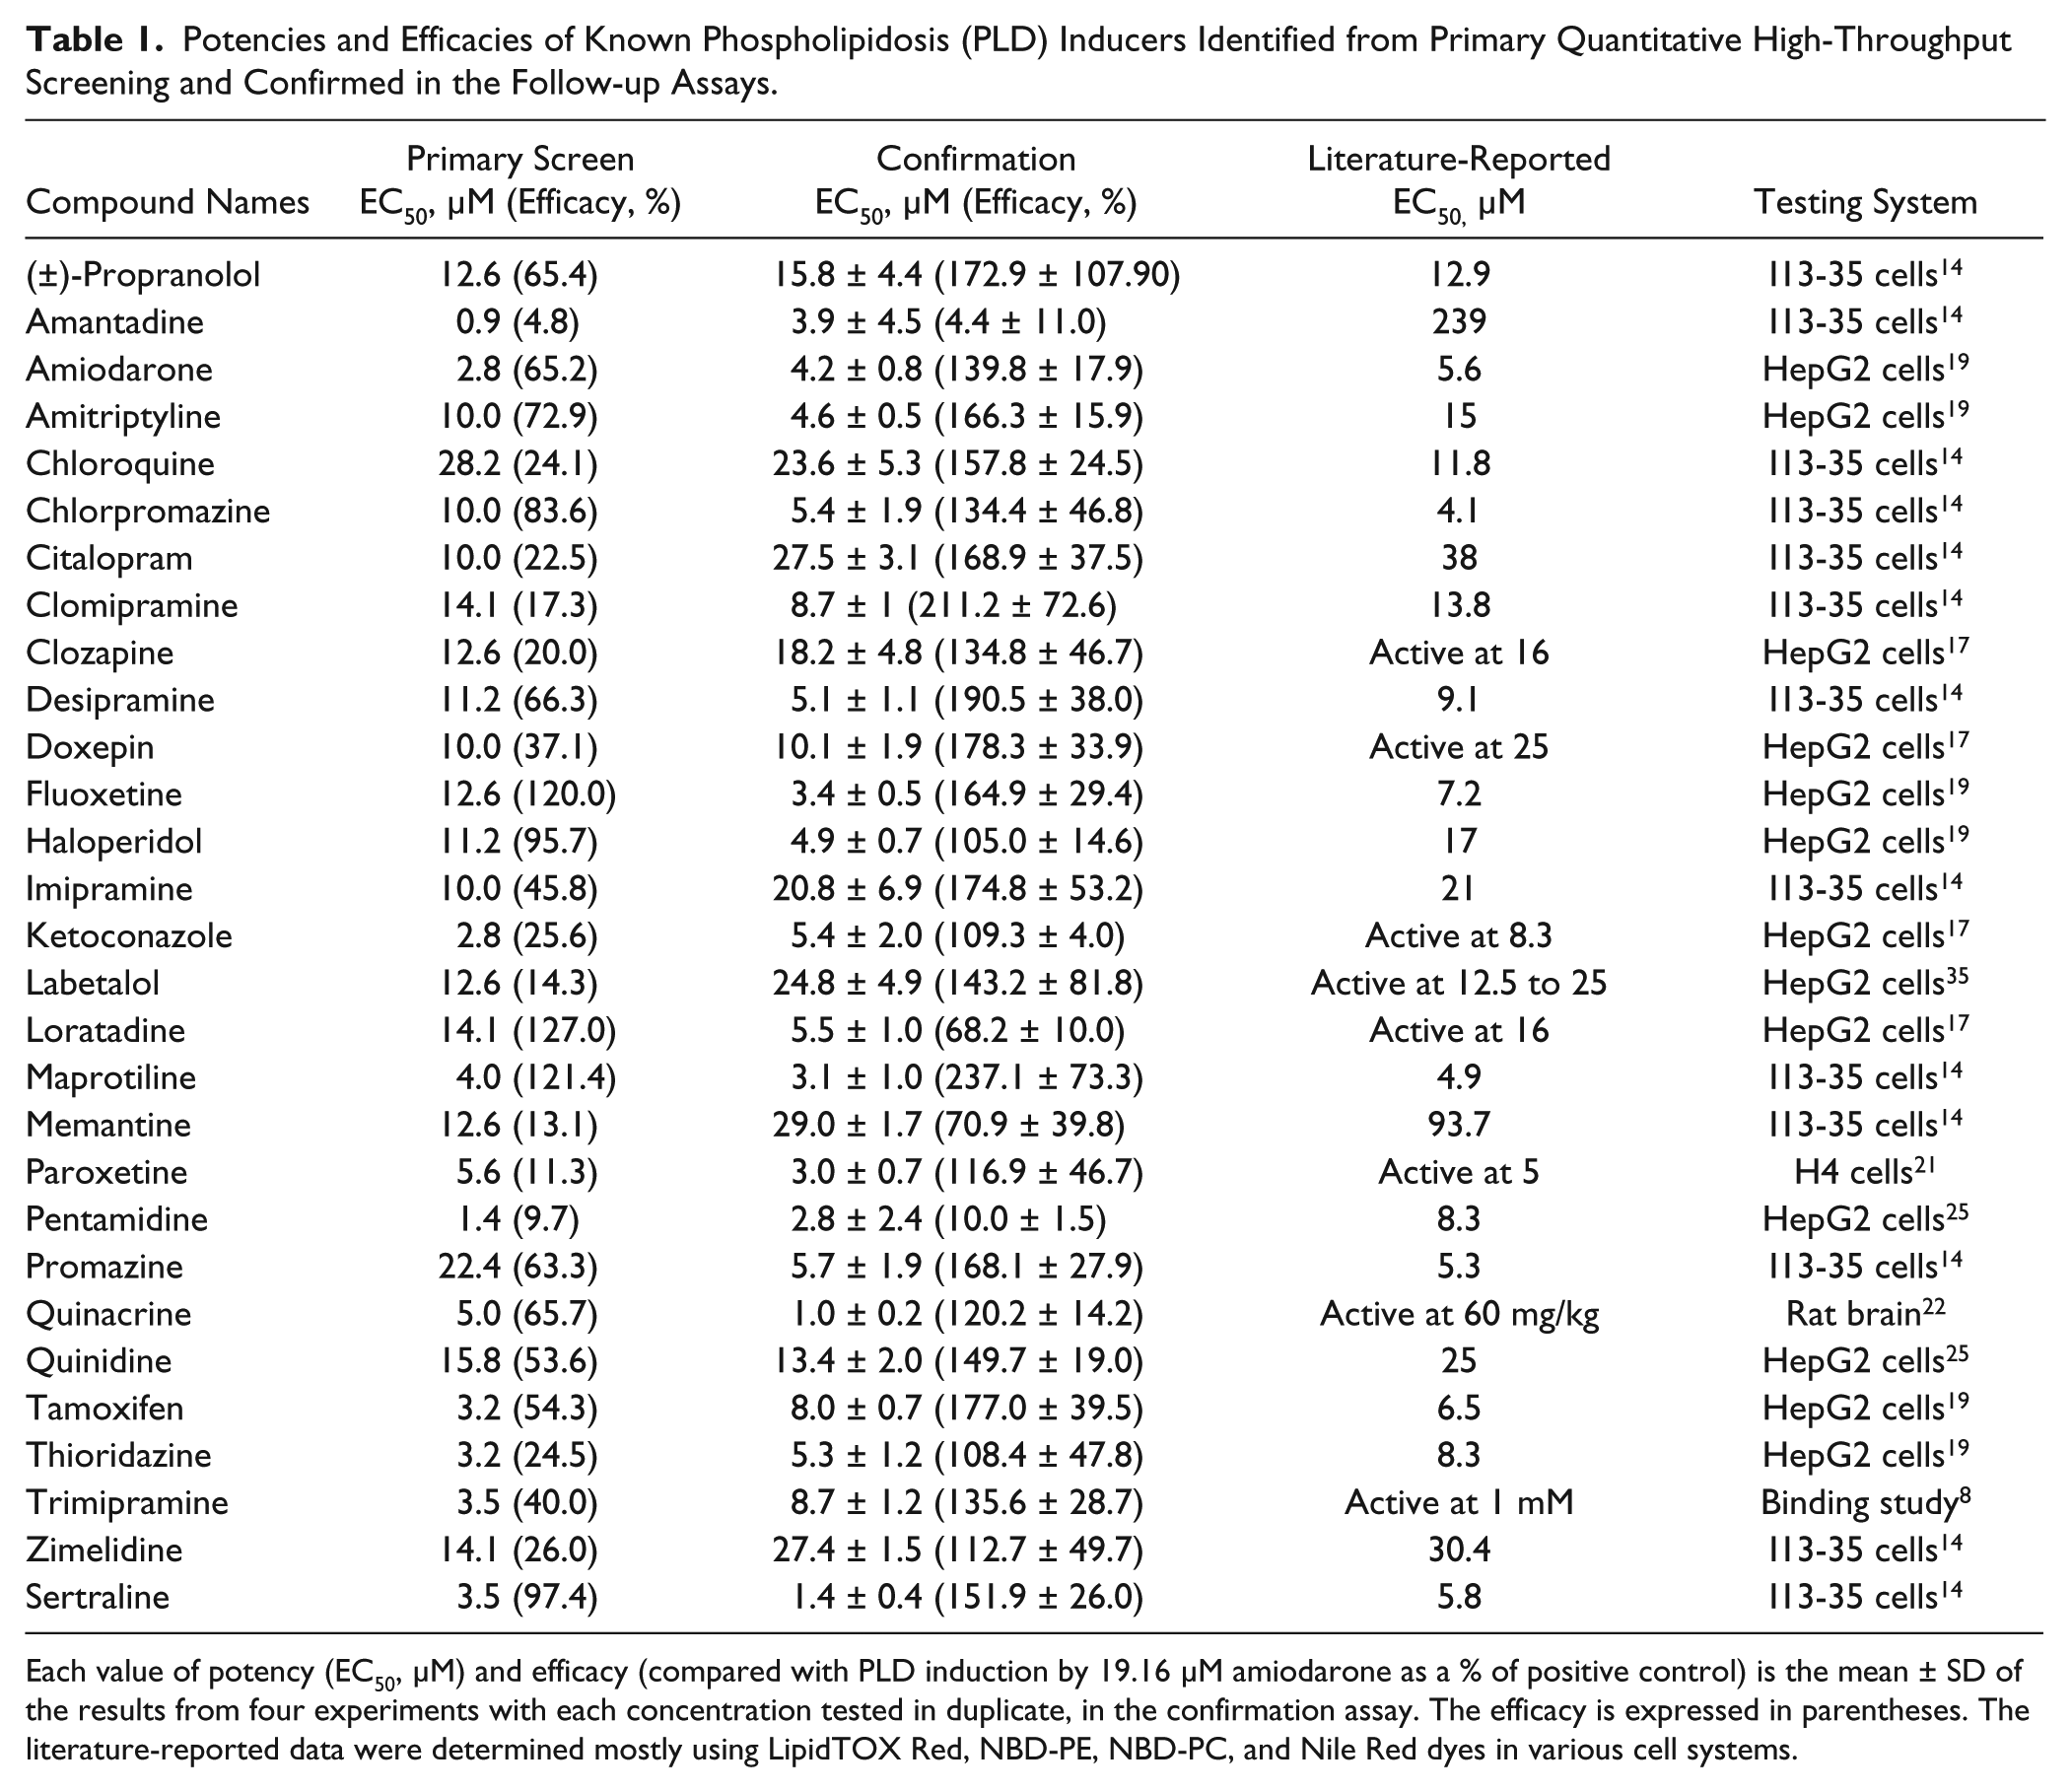
Each value of potency (EC50, µM) and efficacy (compared with PLD induction by 19.16 µM amiodarone as a % of positive control) is the mean ± SD of the results from four experiments with each concentration tested in duplicate, in the confirmation assay. The efficacy is expressed in parentheses. The literature-reported data were determined mostly using LipidTOX Red, NBD-PE, NBD-PC, and Nile Red dyes in various cell systems.
Among the 29 clusters identified from the primary screen, 12 have not been previously reported as PLD inducers. For example, cluster 2, including ebastine, clemastine, and aminobenzotropine; cluster 10, including NAN-190, p-MPPF, and GR127935; and cluster 11, including cis-(Z)-flupentixol and chlorprothixene, significantly induced PLD formation in both the primary screen and cherry-pick confirmation (
Confirmation of PLD Inducers
To further confirm the PLD induction potential of compounds, 24 compounds ( Table 2 and Fig. 2 ) were selected based on the cherry-pick confirmation data and novelty of compound structure and then purchased from commercial vendors. None of these compounds have previously been reported as PLD inducers except for amiodarone and propranolol used as positive controls. These compounds were selected from 12 clusters identified from the screening. The activities of all 24 compounds were confirmed in the PLD assay with a 100% confirmation rate. The EC50 values for these 24 compounds in the confirmation studies correlated well with those in the primary screen (R2 = 0.71) and cherry-pick confirmation (R2 = 0.76). The most potent compound among the 24 confirmed compounds was ebastine, which had average EC50 values of 0.36 µM in the primary qHTS and 0.20 µM in the confirmation study. The next most potent compounds were GR127935 (average EC50 = 0.8 µM), BIX 01294 (average EC50 = 1.6 µM), and NAN-190 (average EC50 = 2.0 µM); EC50 values provided here were from the confirmation study ( Table 2 ).
Potencies and Efficacies of Novel Phospholipidosis (PLD) Inducers in Primary qHTS, Confirmation (PLD Induction), and Cell Viability Assays.
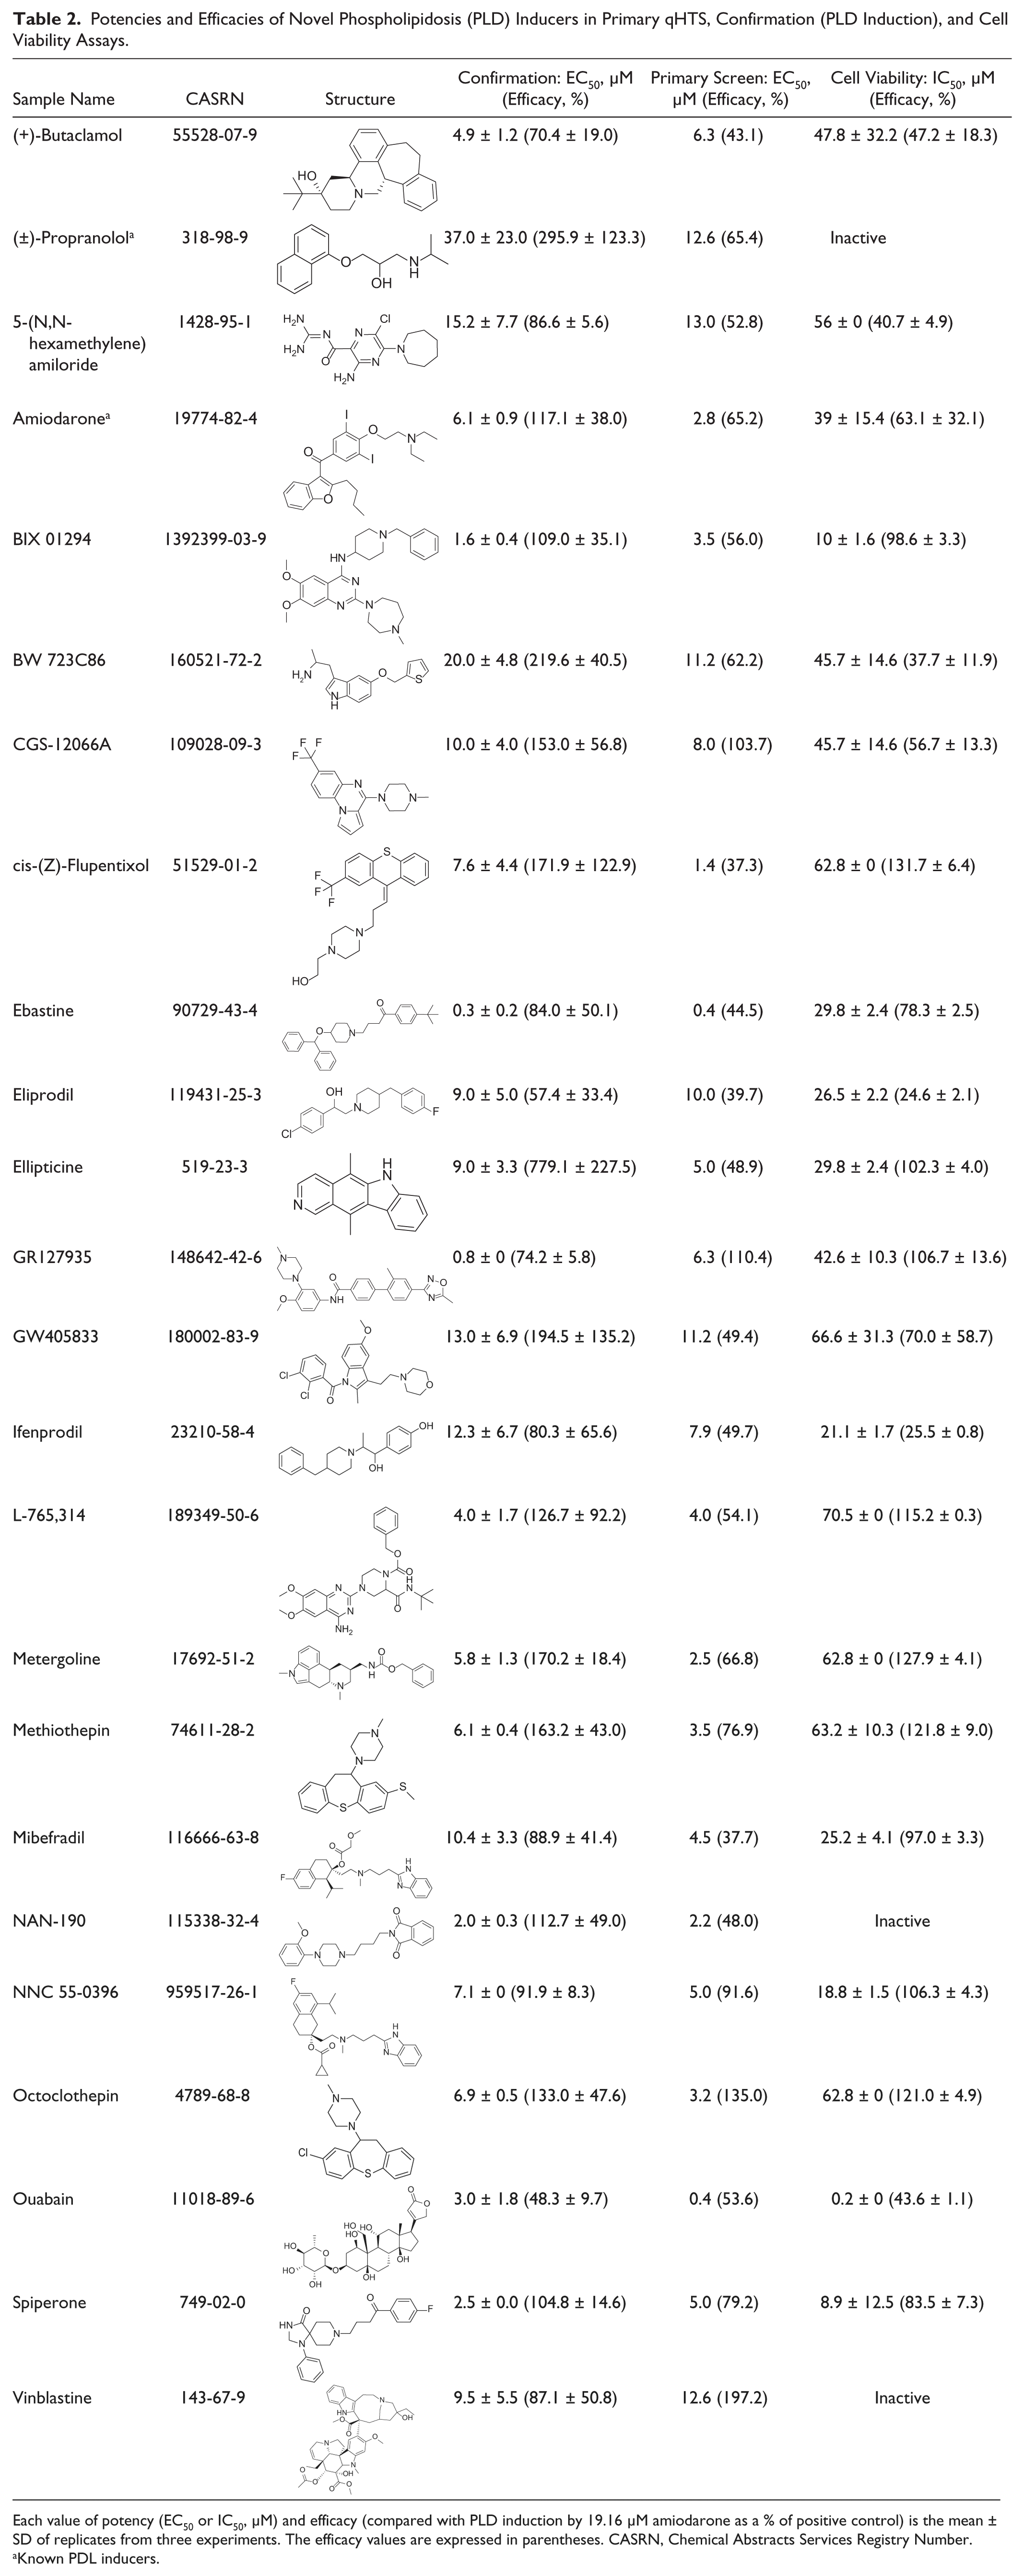
Each value of potency (EC50 or IC50, µM) and efficacy (compared with PLD induction by 19.16 µM amiodarone as a % of positive control) is the mean ± SD of replicates from three experiments. The efficacy values are expressed in parentheses. CASRN, Chemical Abstracts Services Registry Number.
Known PDL inducers.
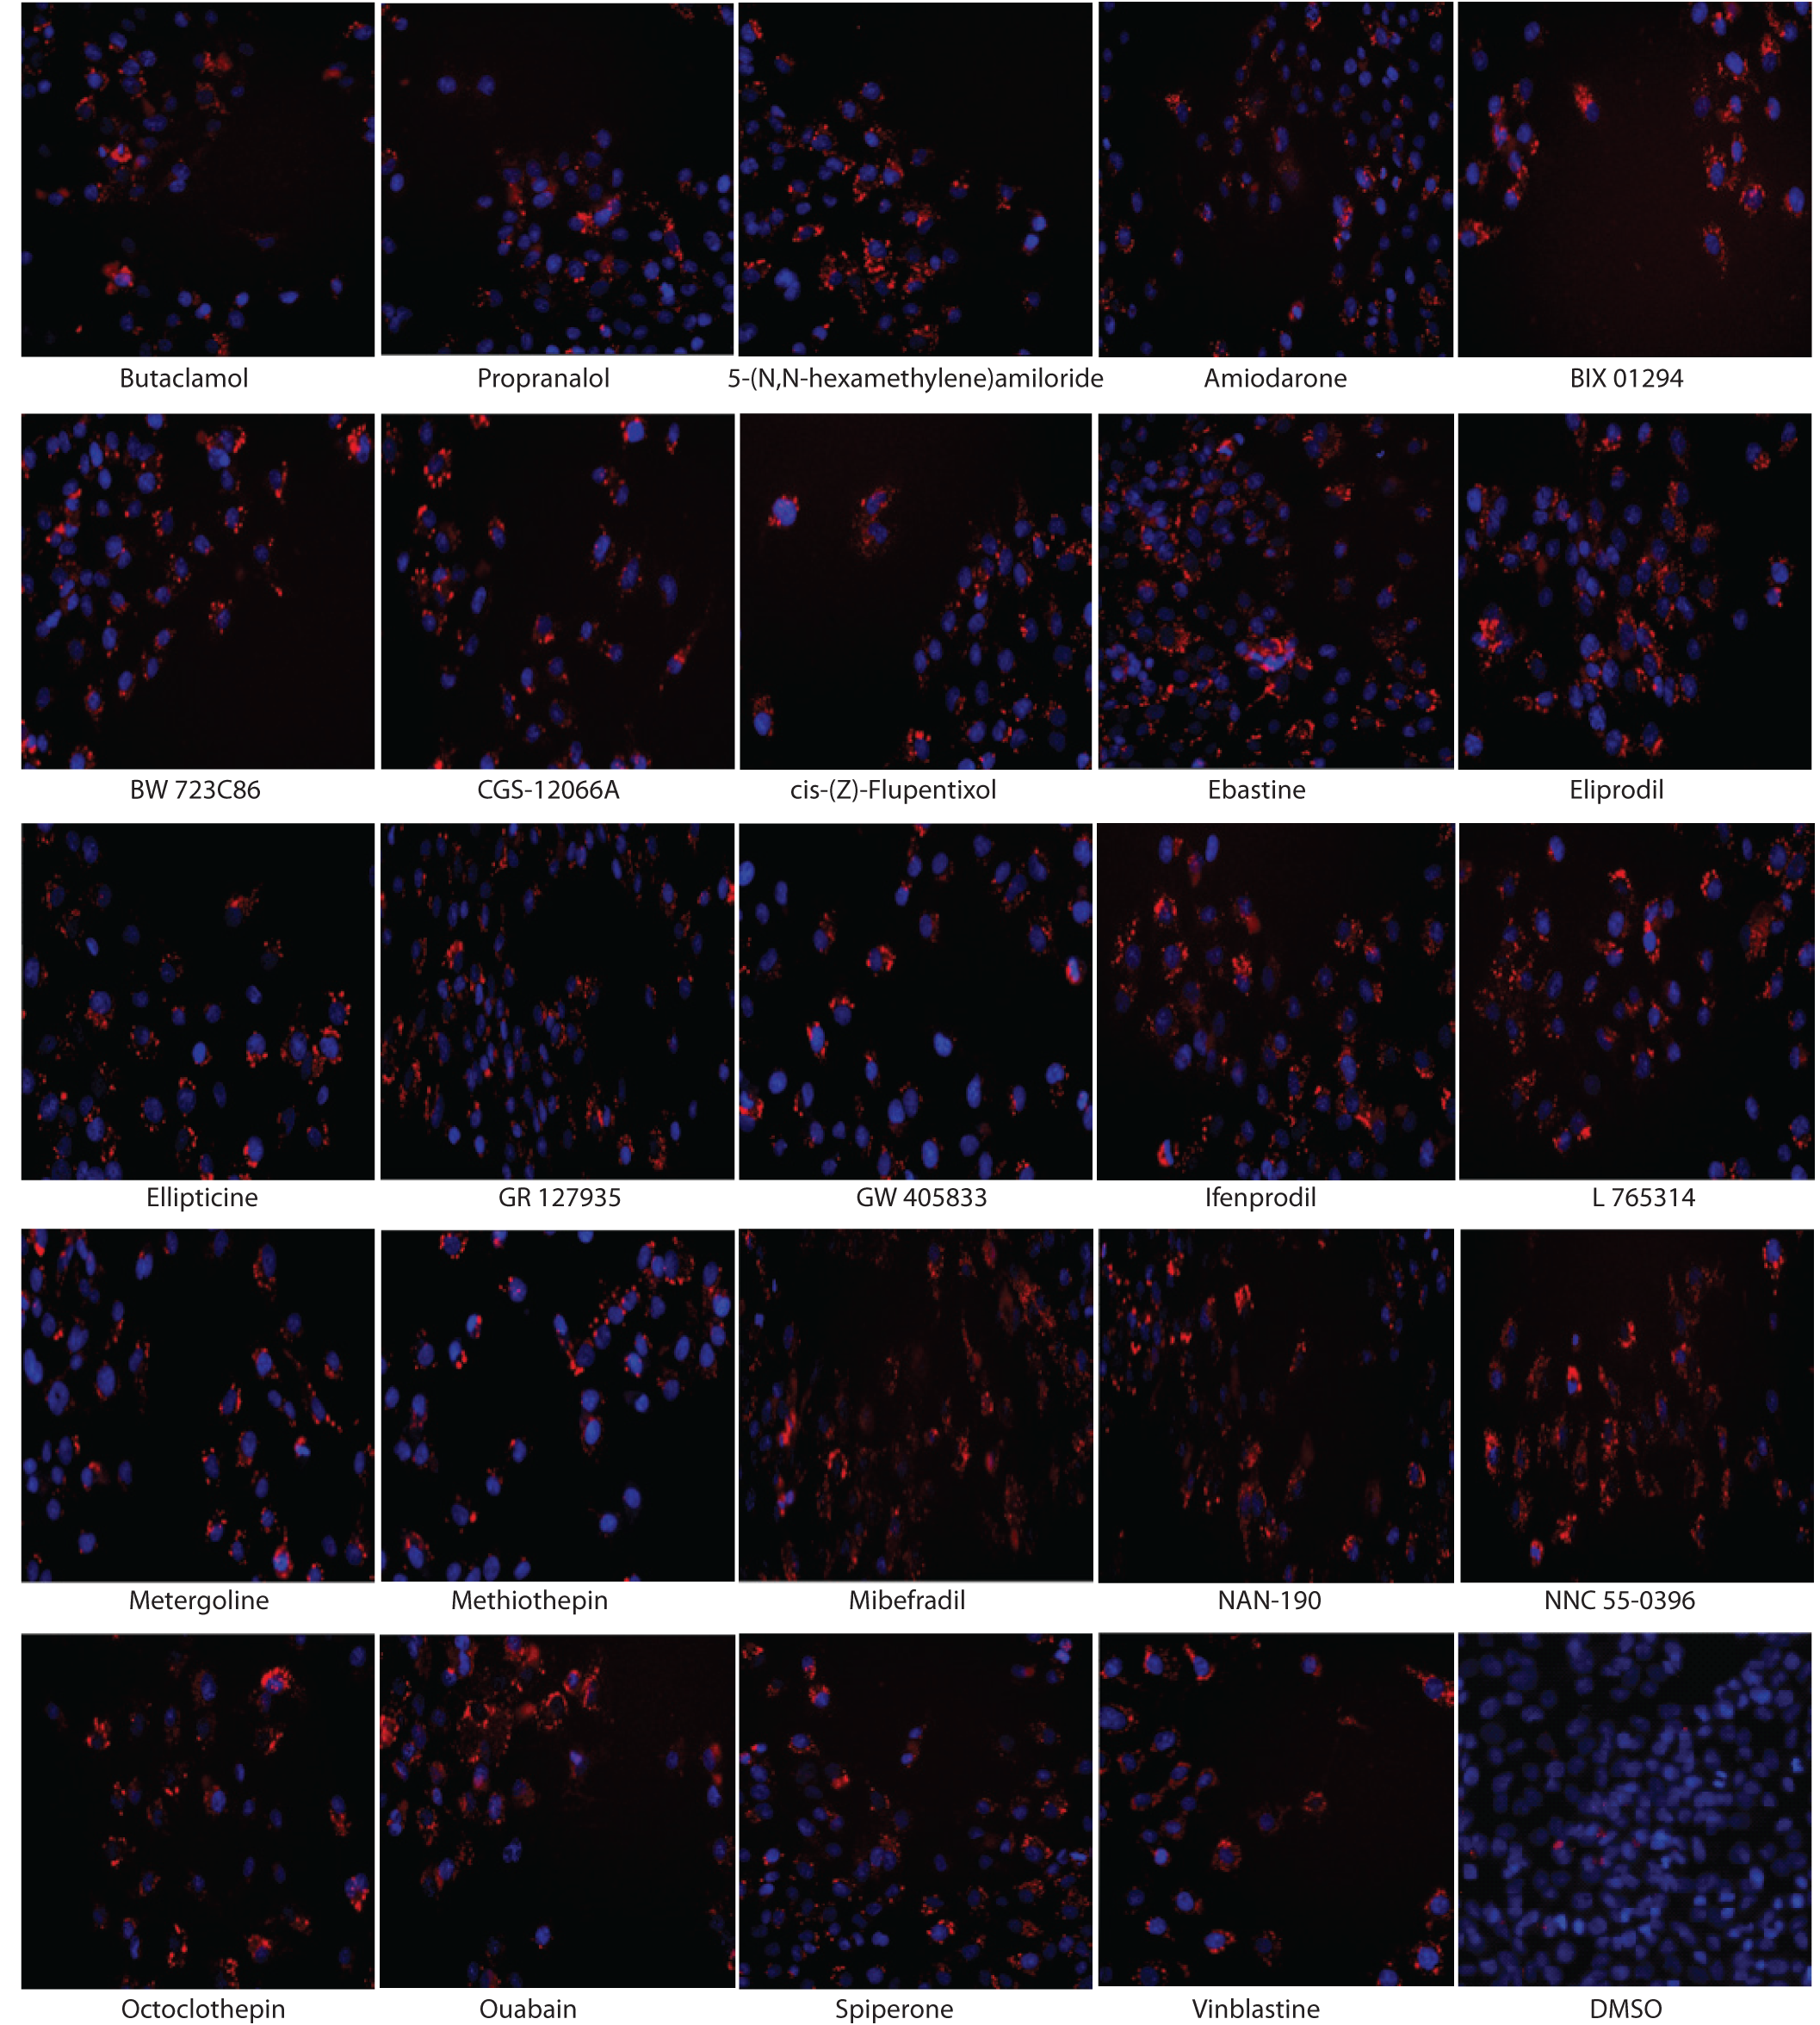
Induction of intracellular accumulation phospholipidosis (PLD) labeled with LipidTOX Red dye in HepG2 cells after 24 h of compound treatment. Representative images of fixed cells stained with LipidTOX Red (red) and Hoechst (blue) are from 24 compounds with the indicated concentration around EC50 values; butaclamol, 4.8 µM; propranalol, 19.16 µM; 5-(N,N-hexamethylene) amiloride, 19.16 µM; amiodarone, 4.8 µM; BIX 01294, 2.39 µM; BW 723C86, 19.16 µM; CGS-12066A, 9.58 µM; cis-(Z)-flupentixol, 4.79 µM; ebastine, 0.3 µM; eliprodil, 9.58 µM; ellipticine, 9.58 µM; GR127935, 1.2 µM; GW405833, 19.16 µM; ifenprodil, 9.58 µM; L765,314, 4.8 µM; metergoline, 4.79 µM; methiothepin, 4.79 µM; mibefradil, 9.58 µM; NAN-190, 2.4 µM; NNC 55-0396, 9.58 µM; octoclothepin, 9.58 µM; ouabain, 2.39 µM; spiperone, 2.4 µM; and vinblastine, 19.16 µM.
In addition, the cytotoxicity of these 24 compounds after 24 h treatment with cells was evaluated in a cell viability assay. Of the 24 compounds, ouabain, spiperone, BIX 01294, and NNC 55-0396 showed some degree of cytotoxicity, with IC50 values of 0.2, 8.9, 10, and 18.8 µM, respectively, and maximum inhibition of cell viability of 42%, 83%, 98%, and 106%, respectively. These compounds need further confirmation for PLD induction using orthogonal assays including electron microscopy analysis. All other compounds had either minimal or no cytotoxic effect on the cells ( Table 2 ).
To confirm their ability to induce PLD, we further examined NAN-190, ebastine, GR127935, and cis-(Z)-flupentixol for their effect on PLD induction by electron microscopy analysis, the gold standard method for characterization of PLD. Amiodarone was used as the positive control and DMSO treatment as the negative control. HepG2 cells were treated with these compounds at the concentration around their EC50 values. Either unicentric or multicentric multilamellar bodies, the hallmark of PLD, were observed in the cytoplasm after the treatment with amiodarone, NAN-190, ebastine, GR127935, or cis-(Z)-flupentixol but not with DMSO treatment ( Fig. 3 ). The electron microscopy results were in agreement with the data from the high-content assay (LipidTOX Red staining) shown in Figure 4 .
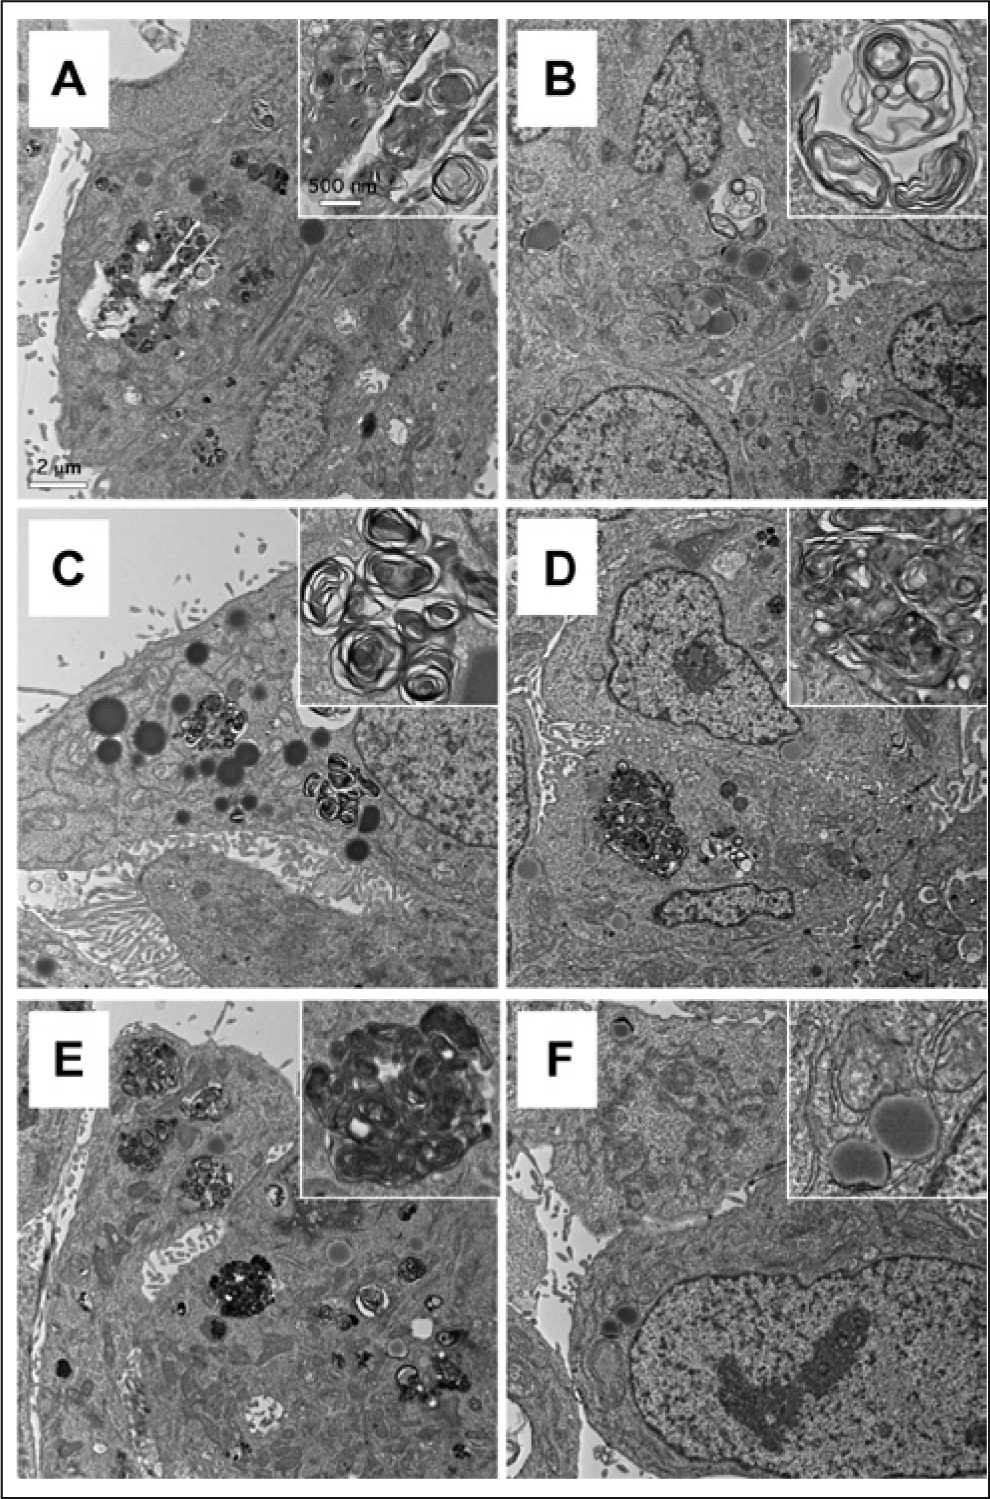
Transmission electron micrographs of phospholipidosis induction in HepG2 cells treated with drugs for 24 h. (
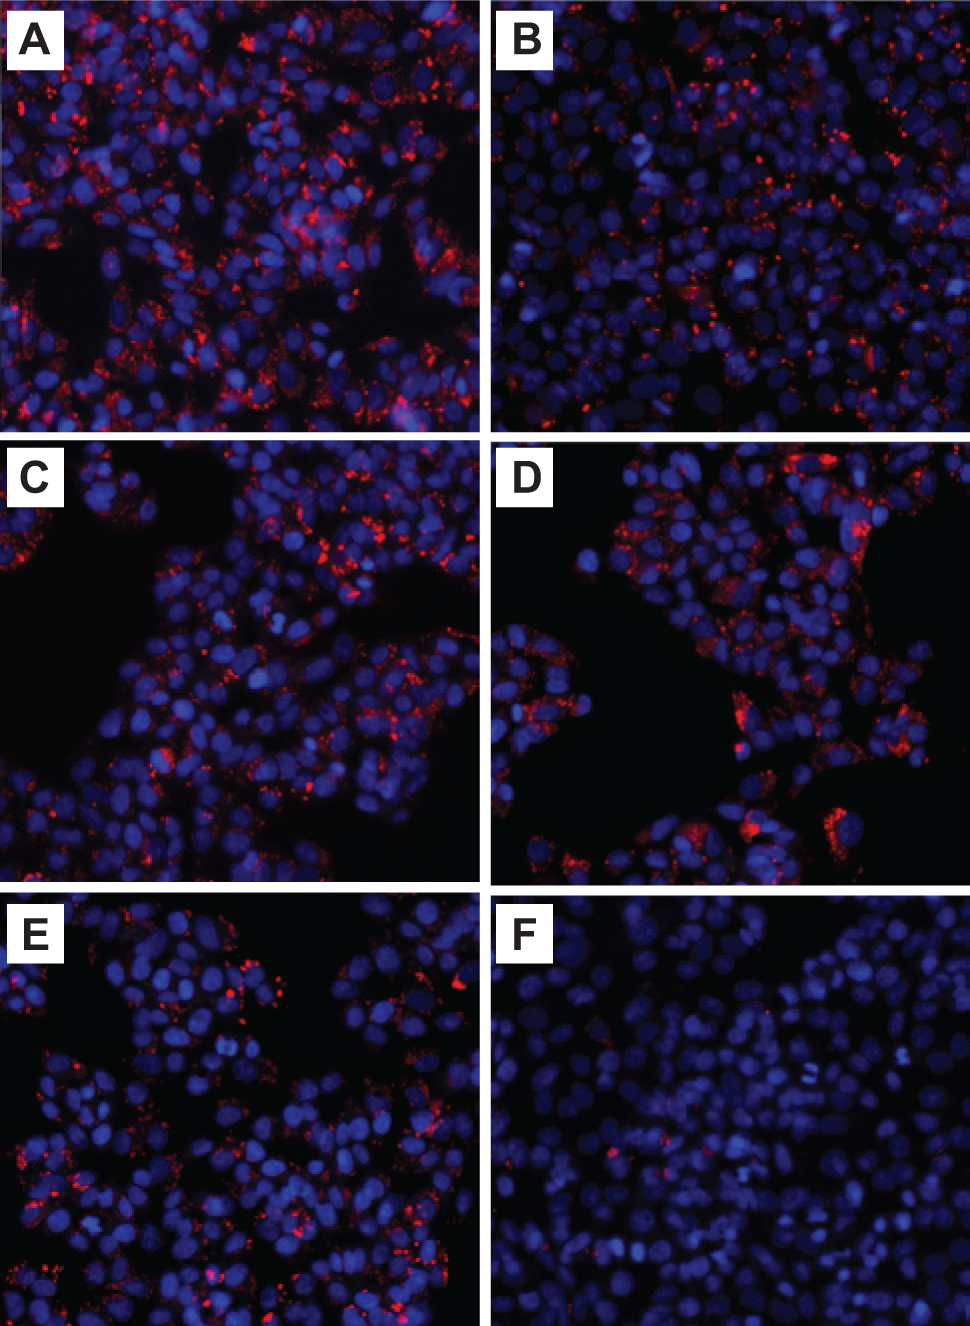
Phospholipidosis induction in HepG2 cells using LipidTOX Red dye. After treatment with (
Discussion
Drug-induced PLD can lead to the impairment of lipid metabolism and phospholipid accumulation in cells, especially in lysosomes. 6 A number of clinical and experimental drugs have been shown to induce PLD in several cell culture and animal models, 12 although a direct link between PLD and tissue/organ toxicity is lacking. Drug-induced PLD is still a concern to both the U.S. FDA and the pharmaceutical industry. To identify drug-induced PLD in early drug development, the Phospholipidosis Working Group from the FDA Center for Drug Evaluation and Research has developed the guidelines on the regulatory implications of PLD and a database of PLD findings from published literature and drug review submissions. 23 Currently, electron microscopy is still the gold standard method for PLD detection, but this method is time-consuming and labor intensive, making it unsuitable for large compound library screening. Measurement of drug-induced PLD has also been conducted in experimental animals, but large quantities of compounds are required, and the induction of PLD may take days to months depending on the affinity of the drugs for susceptible tissues. 24 To increase the screening throughput, several in vitro cell-based PLD assays have been developed using various fluorescent dyes or probes to identify phospholipids that accumulate intracellularly and induce lysosomal concentric lamellar bodies after exposure to PLD-inducing agents.13–16 Recently, Nioi et al. 17 have developed a cell-based assay using LipidTOX Red, a fluorescent lipophilic dye, in a 96-well plate format, which is a highly sensitive assay for detecting drug-induced PLD in HepG2 cells. In addition, they compared this cell-based assay with gene expression experiments that measured 17 genes identified as potential biomarkers of PLD using real-time PCR 25 and found that this cell-based assay using LipidTOX Red was less time-consuming, more sensitive, and higher throughput than gene expression analyses.
NBD-PE, NBD-PC, Nile Red, and LipidTOX Red are commonly used PLD dyes for the cell-based assays. Compared with the LipidTOX Red dye, which can be easily dissolved in an aqueous solution, NBD-PE13,14 and NBD-PC 15 require an additional 30 min of a sonication step after dissolving in solution. Nile Red staining requires cell fixation first, followed by several washings, and finally adding the Nile Red solution. 16 In the present study, we have further evaluated the cell-based PLD assay using LipidTOX by miniaturizing it into a 1536-well plate format. The assay optimized in the 1536-well plate format performed well even when the number of washing steps was reduced to a single wash. We also compared the S/B ratios from the reading of one or two sites per well and found similar results. The S/B ratios for pit integrated intensity per well were 12.6 ± 3.1 for one site per well and 15.7 ± 9.0 for two sites per well. The S/B ratios for pit integrated intensity per cell were 14.3 ± 4.2 for one site per well and 17.5 ± 10.6 for two sites per well. Therefore, using one site reading per well and the reduction of washing steps greatly increased the speed of image acquisition and screening throughput.
From the screening, we have identified more than 100 PLD inducers, as listed in
Among the novel clusters of PLD inducers identified from this study, three interesting clusters (
In summary, we have developed and validated a cell-based PLD assay in a 1536-well plate format. From the primary screening of the LOPAC library, the dibenzazepine and phenothiazine classes of tricyclic antidepressants, some of which are known PLD inducers (e.g., imipramine, desipramine, clomipramine, and amitriptyline), were identified. Additional compounds, such as NAN-190, ebastine, GR127935, and cis-(Z)-flupentixol, have not been reported as PLD inducers prior to this study. Taken together, our results show that this cell-based PLD assay can be used to quickly and efficiently screen large compound collections to identify compounds that can induce PLD formation in cells.
Footnotes
Acknowledgements
We thank Paul Shinn, Daniel Van Leer, and Misha Itkin for plating the LOPAC Library and follow-up compound plates. The content of this publication does not necessarily reflect the views or policies of the Department of Health and Human Services, nor does mention of trade names, commercial products, or organizations imply endorsement by the U.S. government.
Declaration of Conflicting Interests
The authors declared no potential conflicts of interest with respect to the research, authorship, and/or publication of this article.
Funding
The authors disclosed receipt of the following financial support for the research, authorship, and/or publication of this article: This work was supported by the Intramural Research Programs (Interagency agreement Y2-ES-7020-01) of the National Toxicology Program, National Institute of Environmental Health Sciences, and the National Cancer Institute (Contract No. HHSN261200800001E), National Institutes of Health.
References
Supplementary Material
Please find the following supplemental material available below.
For Open Access articles published under a Creative Commons License, all supplemental material carries the same license as the article it is associated with.
For non-Open Access articles published, all supplemental material carries a non-exclusive license, and permission requests for re-use of supplemental material or any part of supplemental material shall be sent directly to the copyright owner as specified in the copyright notice associated with the article.