
Abstract
A major hurdle for cardiovascular disease researchers has been the lack of robust and physiologically relevant cell-based assays for drug discovery. Derivation of cardiomyocytes from human-induced pluripotent stem (iPS) cells at high purity, quality, and quantity enables the development of relevant models of human cardiac disease with source material that meets the demands of high-throughput screening (HTS). Here we demonstrate the utility of iPS cell–derived cardiomyocytes as an in vitro model of cardiac hypertrophy. Exposure of cardiomyocytes to endothelin 1 (ET-1) leads to reactivation of fetal genes, increased cell size, and robust expression of B-type natriuretic peptide (BNP). Using this system, we developed a suite of assays focused on BNP detection, most notably a high-content imaging-based assay designed for phenotypic screening. Miniaturization of this assay to a 384-well format enabled the profiling of a small set of tool compounds known to modulate the hypertrophic response. The assays described here provide consistent and reliable results and have the potential to increase our understanding of the many mechanisms underlying this complex cardiac condition. Moreover, the HTS-compatible workflow allows for the incorporation of human biology into early phases of drug discovery and development.
Introduction
The human heart exhibits remarkable adaptive responses to a wide array of genetic and external factors to maintain healthy contractile function. For example, some normal physiological stresses (i.e., exercise or pregnancy) can cause an increase in cardiomyocyte size and ventricular myocardium thickness to keep pace with elevated blood pressure and increased functional demand on the heart. This compensatory response is generally known as physiological cardiac hypertrophy. 1 Such enlargement of cardiac myocytes may also be observed, however, in response to abnormal stresses (e.g., hypertension and valve disease) or genetic mutations. Structural alterations under these conditions may not be sustainable, and severe medical complications from pathological cardiac hypertrophy can result—including arrhythmia, contractile dysfunction, heart failure, and even death. 2 According to the American Heart Association, an estimated 1 out of every 500 people acquires pathological hypertrophy (www.heart.org). Given its importance in cardiovascular disease research, we sought to develop an in vitro system to model cardiac hypertrophy with human cells that could be used in the discovery and development of new pharmaceuticals to modulate this response.
The design and characterization of in vitro models that represent in vivo disease processes (referred to as disease modeling) is a critical component of biomedical research. Most of the current systems, however, use cardiomyocytes from nonprimate animals (i.e., rodents and canines) or immortalized cell lines. While such cellular models have been in practice for decades, the isolation of primary cells is quite labor intensive, they often lack consistency between donors, and their relative amounts are generally insufficient for large high-throughput screening (HTS) campaigns. In addition, both primary cells and immortalized cell lines may not faithfully reproduce the specific biology under investigation and ultimately may require suboptimal translation to the human condition. In contrast, the use of human-induced pluripotent stem (iPS) cell technology can significantly help to overcome these hurdles.
Since the advent of iPS cell technology in 2007,3,4 considerable advancements have been made in the derivation of iPS cells and their differentiation into many other tissue cell types (including cardiomyocytes). 5 The iPS cell–derived cardiomyocytes used here are well characterized and have been shown to be electrically, biochemically, and mechanically active in culture previously. 6 Moreover, they display stable cardiac gene and protein expression profiles, as well as the expected electrophysiological and contractile characteristics of native cardiac myocytes.7–9 Such predictable features are also due in part to the fact that the source iPS cell line was from a “normal” donor with no known disease phenotype and because that cell line was carefully screened at the clonal level to minimize downstream variability.
In addition to recapitulation of typical cardiac behavior, iPS cell technology also enables the large-scale production of functional human cardiomyocyte material at very high purity (>95%). This has helped to drive adoption of the cells in predictive toxicology and safety pharmacology applications across a variety of different platforms.10–14 In an effort to further establish the use of these cardiomyoctes in workflows that would be amenable to HTS and relevant to drug discovery, we sought to generate an in vitro disease model of “pathological” cardiac hypertrophy.
Here we report the development of a cardiac hypertrophy assay with human iPS cell–derived cardiomyocytes that is induced by treatment with endothelin 1 (ET-1). We built our system based on some trademark characteristics of hypertrophy established previously with rodent and human primary cell models, including fetal gene reversion, changes in cardiomyocyte cell size, and actin cytoskeleton rearrangement. The assay methods we developed and report here, however, focus primarily on monitoring the expression of NPPB or the corresponding gene product, B-type natriuretic peptide (BNP), as a surrogate indicator of the hypertrophic response. Our cellular model is shown to exhibit the expected pathology as early as 5 days in culture, and NPPB/BNP expression was detected via multiple end-point readouts, including quantitative real-time PCR (qPCR), enzyme-linked immunosorbent assay (ELISA), flow cytometry, and high-content imaging (HCI). Robust and reproducible assay performance in 96-well plates was demonstrated across each assay, and we then optimized the HCI-based assay further into 384-well plates. Using this miniaturized format, we profiled a series of small molecules known to target hypertrophy-related pathways. Several compounds were shown to reverse the effects induced by ET-1 with potencies in the low to sub-micromolar range. This robust cellular system, coupled with the genetic and phenotypic screening data presented here, supports the use of human iPS cell–derived cardiomyocytes as a valid in vitro disease model of cardiac hypertrophy suitable for use in HTS-compatible applications.
Materials and Methods
Cells, Media, and Reagents
Cryopreserved iPS cell–derived cardiomyocytes (“iCell Cardiomyocytes”) were obtained from Cellular Dynamics International (CDI, Madison, WI). The human iPS cell line used for derivation of the cardiomyocytes featured in this study has been described previously, 8 specifically with respect to the source of the starting material, the manner in which it was reprogrammed, the method of differentiation, and details around characterization. Cardiomyocytes were thawed from cryopreserved vials into iCell Cardiomyocytes Plating Medium (iCPM) according to the product user’s guide. Cell culture plates were coated for 1 h at 37 °C with 5 µg/mL fibronectin from Roche Applied Science (Indianapolis, IN) diluted in phosphate-buffered saline (PBS). Supplemented William’s E (SWE) medium was prepared by diluting Cocktail B from the Hepatocyte Maintenance Supplement Pack from Life Technologies (Carlsbad, CA) into William’s E Medium (Life Technologies) at a ratio of 1:25. Brefeldin A (BFA), ET-1, fenofibrate, SAHA, and verapamil were from Sigma-Aldrich (St. Louis, MO). Cyclosporin A and BEZ-235 were from LC Laboratories (Woburn, MA).
Cardiac Hypertrophy Assay Workflow
Cardiomyocytes were plated at a density of 20,000 cells/well in 100 µL or 5000 cells/well in 25 µL (taking into account plating efficiency) in 96-well or 384-well plates, respectively. Plated cells were left undisturbed in the cell culture incubator at 37 °C and 7% CO2 for 48 h to maximize cell attachment. On day 2 postthaw, iCPM was replaced with freshly prepared SWE medium. On day 4 postthaw, the SWE medium was exchanged and cells were treated with ET-1 to induce hypertrophy. A time course experiment was performed to determine the point at which detection of ET-1–induced NPPB/BNP expression was optimal (i.e., 18 h poststimulation;
Gene Expression Analysis
On day 5 postthaw and following induction with ET-1 for 18 h, cardiomyocytes were lysed and reverse transcription was performed according to the TaqMan Gene Expression Cells-to-CT Kit User Guide (Life Technologies). Expression of NPPB was determined using qPCR and the TaqMan Gene Expression Assay for NPPB (Hs00173590_m1; Life Technologies). The resulting threshold cycles (CT) for each reaction were averaged and NPPB expression was determined relative to an endogenous control gene (e.g., B2M or 18S rRNA). Alternatively, total RNA was extracted and treated with DNase I using the RNeasy Micro Kit (Qiagen, Valencia, CA) following the manufacturer’s directions. Quantification of RNA samples was determined spectrophotometrically at 260 nm. For gene expression assays, 500 ng total RNA from each treatment was converted to complementary DNA (cDNA) by using the High Capacity RNA-to-cDNA kit (Life) according to the standard protocol. For the TaqMan MicroRNA assay, 10 ng total RNA was reverse transcribed using the TaqMan miRNA Reverse Transcription Kit with assay-specific primers (Life Technologies). PCR reactions were performed in a total volume of 10 µL containing 1× TaqMan Universal PCR Master Mix and 1× TaqMan probe. Each cDNA sample was assayed in triplicate. The geometric mean of two stable genes (i.e., Pol2A and B2M) was used for normalization, and the relative expression was calculated by ΔCT method. The fold change was calculated by dividing the relative expression of induced (10 nM ET-1) by the untreated (0 nM ET-1) samples. Finally, induced and untreated cardiomyocytes were also subjected to expression analysis on an Affymetrix GeneChip Array (Human Genome U133 Plus 2.0; Affymetrix, Santa Clara, CA) according to standard methods.
ELISA Protocol
On day 5 postthaw and following induction with ET-1 for 18 h, supernatants from the cardiomyocyte cell culture plate were analyzed by a sandwich ELISA developed at CDI for the detection of secreted BNP. Anti-proBNP mouse monoclonal antibody [5B6] (Abcam, Cambridge, UK) was immobilized on a 96-well immunoplate overnight at 4 °C. Blocking was accomplished with a Dulbecco’s PBS (D-PBS) buffer containing 1% (w/v) nonfat dry milk and 0.05% (v/v) Tween-20 for 1 h at room temperature (RT). Test samples were diluted 1:20 in blocking buffer and then incubated in the ELISA plate for 2 h at RT. The human N-term proBNP (1-76) peptide (Phoenix Pharmaceuticals, Burlingame, CA) was included as a standard. Horseradish peroxidase–conjugated anti-proBNP mouse monoclonal antibody [16F3] (Abcam) was used for detection. Washing of the ELISA plate was performed in between each step with 0.05% (v/v) Tween-20 in D-PBS. Absorbance at 450 nm was measured following colorimetric detection with TMB peroxidase substrate (KPL, Gaithersburg, MD). A standard curve was generated by averaging the raw absorbance values from the ELISA standard, and the data were curve fit using a four-parameter logistics nonlinear regression model. The amount of BNP present in each well was calculated in fmol/mL.
Flow Cytometry Procotol
On day 5 postthaw and following induction with ET-1 for 15 h, cardiomyocytes were treated with 10 µg/mL BFA and incubated for an additional 3 h. This step prevented the secretion of BNP and thus increased its intracellular levels. Cells were then detached from the plate with 0.5% trypsin-EDTA (Life Technologies) and transferred to a 96-well V-bottom microplate. Staining with a LIVE/DEAD fixable green dead cell stain kit (Life Technologies) was performed according to the manufacturer’s instructions. Cells were fixed in a 4% (v/v) formaldehyde solution in D-PBS for 15 min and permeabilized in a D-PBS buffer containing 2% (v/v) fetal bovine serum (FBS) and 0.1% (w/v) saponin (Sigma-Aldrich). Cells were subsequently incubated with anti-proBNP mouse monoclonal antibody [15F11] (Abcam) for 1 h at RT, followed by fluorescent staining with an Alexa Fluor 647–conjugated donkey anti–mouse secondary antibody (Life Technologies) for an additional hour at RT. Washing of the trypsinized cells was performed in between each step with 2% (v/v) FBS in D-PBS. Labeled cells were then transferred to standard flow cytometry tubes for analysis on a BD Accuri C6 flow cytometer (BD Biosciences, Franklin Lakes, NJ). Using an isotype control to set negative population gates, the median fluorescence intensity (MFI) for each sample was used to determine relative expression of BNP in the cardiomyocytes.
High-Content Imaging and Analysis
Cardiomyocytes were plated in either 96-well or 384-well optical imaging, flat, clear-bottom, black microplates (from various manufacturers) for this assay. On day 5 postthaw and following induction with ET-1 for 15 h, cells were treated with BFA as above for analysis by flow cytometry. Cells were fixed in a 4% (v/v) solution of ultrapure methanol-free formaldehyde (Polysciences, Inc., Warrington, PA) in D-PBS for 15 min and permeabilized in a D-PBS buffer containing 3% (w/v) nonfat dry milk and 0.1% (v/v) Triton X-100. Cells were then incubated overnight at 4 °C with anti-proBNP mouse monoclonal antibody [15F11] (Abcam) diluted 1:1000 in permeabilization buffer. The following day, cells were stained with Alexa Fluor 647–conjugated donkey anti–mouse secondary antibody (diluted 1:1000 in permeabilization buffer) for an additional hour at RT. Finally, nuclei were stained with Hoechst 33342 (Life Technologies) at a final concentration of 2 µg/mL. Fixed cells were washed in between each incubation step with D-PBS containing 0.05% (v/v) Triton X-100. For compound profiling experiments in a 384-well format, serial dilutions of inhibitor were performed in DMSO, diluted 1:100 in SWE medium, and then added to the cells as 10× solutions (4 µL per well) for 1 to 2 h prior to induction with ET-1 (1 nM final concentration). The total reaction volume was typically 40 µL in the 384-well plate with a final DMSO percentage of 0.1%.
Data acquisition was performed on the ImageXpress Micro High Content Screening System from Molecular Devices (Sunnyvale, CA). Images were collected at 10× magnification at two different wavelengths (i.e., “DAPI” and “Cy5”) with enough sites per well of a 384-well plate to examine ≥1000 cells. Data analysis was performed on MetaXpress software (Molecular Devices) using the Multi Wavelength Cell Scoring module. The expression of BNP was determined on a cell-by-cell measurement, and the intensity of cytoplasmic fluorescence staining was used to calculate the signal in the assay. For cell size determinations, the image acquired by the instrument was processed using a pixel-to-micron calibration value to calculate the total area of the cell in square microns (based on the combination of wavelengths staining both the nucleus and cytoplasm).
Results and Discussion
Cardiomyocytes derived from pluripotent stem cell lines can be induced to exhibit the hallmarks of pathophysiological conditions, such as hypertrophy.13,15–17 Cardiac hypertrophy is manifested by numerous transcriptional, biochemical, and structural transformations—including increased cell size, enhanced protein synthesis, and remodeling of the actin cytoskeleton.18,19 In addition, reversion back to the cardiac fetal gene program is a distinctive characteristic of hypertrophy. 20 This embryonic expression profile, however, is also highly associated with numerous stress response genes. Previous research in our laboratory has shown that cryopreserved iPS cell–derived cardiomyocytes exhibit stress markers immediately postthaw (data not shown). Generally, though, prolonged time in culture can result in decreased expression of these stress-related genes as the cells recover through the reanimation process.
A link between metabolism and regulation of fetal gene expression in the heart has also been proposed in the literature. 21 Building on this concept, we identified media conditions that could promote fatty acid oxidation in iPS cell–derived cardiomyocytes and accelerate the time in culture needed for changes in fetal gene (or stress-related gene) expression to occur. As illustrated in Figure 1A , extended time in culture under standard maintenance medium conditions led to a steady decrease in NPPB gene expression. On the other hand, culturing the cardiomyocytes in a fatty acid–based, serum-free medium (i.e., SWE medium) brought the levels of NPPB down to the same baseline much more quickly (as early as day 4 in culture). In either case, it was evident that this representative marker of the fetal gene program was essentially turned off. This was an important first step in the generation of a disease model for cardiac hypertrophy.
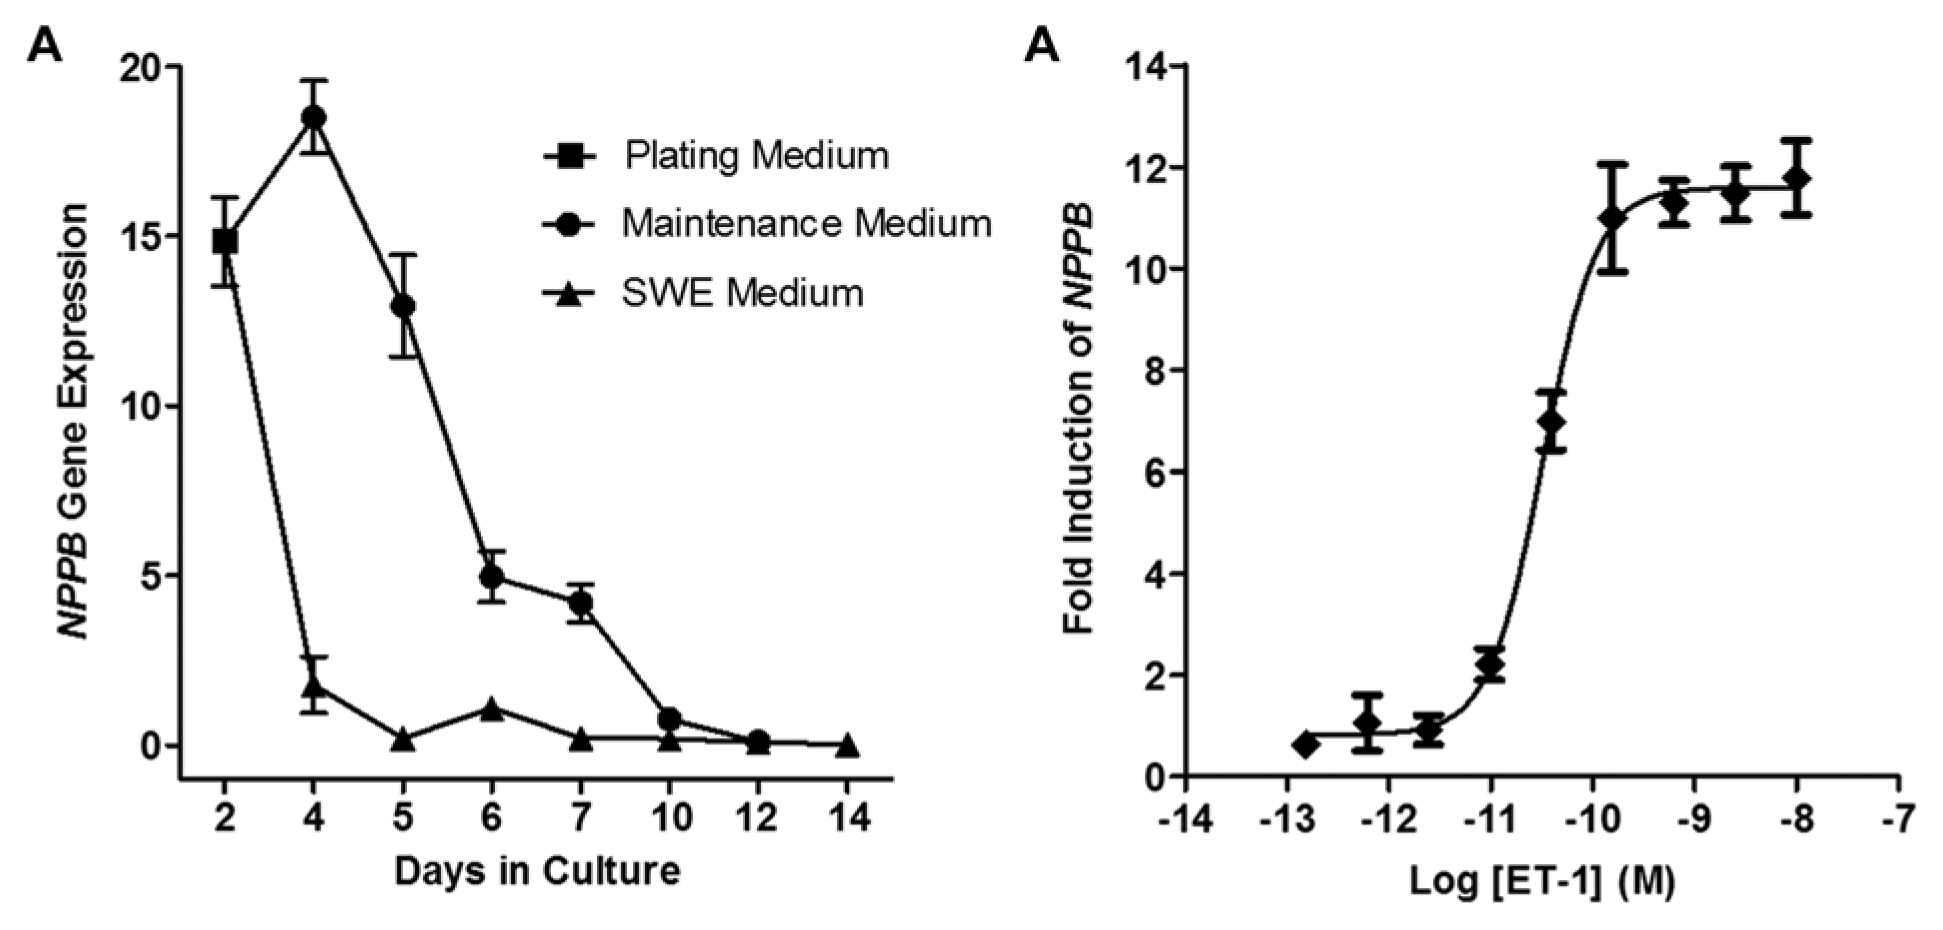
Regulation of NPPB fetal gene expression. (
Various treatments are known to induce hypertrophy in cultured cardiomyocytes. Besides mechanical or stretch-induced conditions, traditional ligand-based stimuli include angiotensin II, phorbol esters, and α- and β-adernergic receptor agonists (phenylephrine and isoproterenol, respectively). ET-1 (a 21–amino acid vasoconstrictive peptide) has also been shown in several examples to induce cardiac hypertrophy, specifically with rodent primary cardiomyocytes.22,23 When we treated the iPS cell–derived cardiomyocytes with ET-1, we consistently observed dose-dependent increases in NPPB expression as measured by qPCR ( Fig. 1B ). Across six different experiments and between multiple lots of cardiomyocytes, EC50 values in the range of 32 ± 16 pM were obtained. On the basis of the robust response and expected pharmacology with ET-1, we chose to focus solely on the use of this agonist in the development of our cell model. Moreover, these results are quite comparable with other data from primary cell models for ET-1–induced hypertrophy.22–26
To further establish the use of iPS cell–derived cardiomyocytes as a disease model for cardiac hypertrophy, we more rigorously explored additional markers as defined previously by other cell models. We compared induced (i.e., 10 nM ET-1) versus uninduced (i.e., no or 0 mM ET-1) samples via analysis by qPCR and DNA microarray. Consistent with the data described above, robust induction of NPPB was repeatable. In addition, several other genes, including skeletal muscle α-actin (ACTA1), cardiac muscle α-actin (ACTC1), α-actinin (ACTN-1), myosin heavy-chain β (MYH7), natriuretic peptide A (NPPA), and SM22α (also called transgelin; TAGLN), were upregulated following treatment with ET-1 (
Fig. 2
).
20
The increased expression of SM22α was also characterized at the protein level by immunofluorescence (
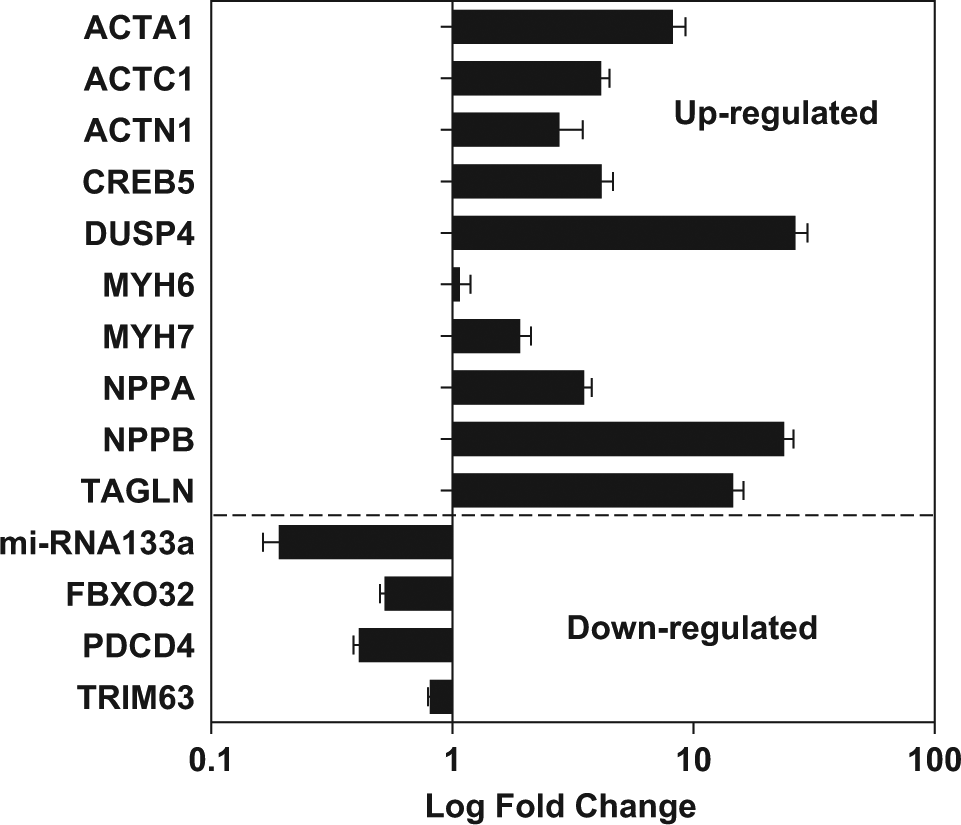
Regulated expression of hypertrophy-related targets. Induced pluripotent stem (iPS) cell–derived cardiomyocytes were treated with endothelin 1 (ET-1) (10 nM) to induce hypertrophy. Gene expression of several targets was analyzed by quantitative PCR and represented by fold change (log scale). Induced samples were compared with untreated cells (0 nM ET-1) to determine the relative levels of up- or downregulation. Increased expression of NPPB was demonstrated again in this experiment. Please refer to the text for additional details regarding the other targets.
We also detected altered expression of additional hypertrophy-related targets, including increased levels of dual-specificity phosphatase (DUSP4)
27
and decreased levels of microRNA-133,
28
both of which have been reported previously (
Fig. 2
). Downregulation of other putative anti-hypertrophic genes noted in the literature, such as FBXO32, PDCD4, and TRIM63, was also observed.29
–31 The patterns of gene expression described here were also reproduced with independently prepared samples analyzed by DNA microarray analysis (
In addition to the numerous changes that occur at the genetic level during cardiac hypertrophy, increased cell size and structural reorganization of the actin cytoskeleton are classic and accepted cellular features of the hypertrophic response. We observed clear differences between untreated and ET-1–induced cardiomyocytes when stained with fluorescently labeled phalloidin (
Fig. 3A
and
3B
, respectively). The hypertrophic cells were visibly larger and actin remodeling was very evident. Indeed, upon high-content analysis, increases in cell size could be quantified (
Fig. 3C
), yielding a similar EC50 value to that for BNP detection by qPCR. Additional images of ET-1–induced cardiomyocytes immunostained with antibodies against sarcomeric α-actinin and cardiac troponin T can be found in the supplementary material (
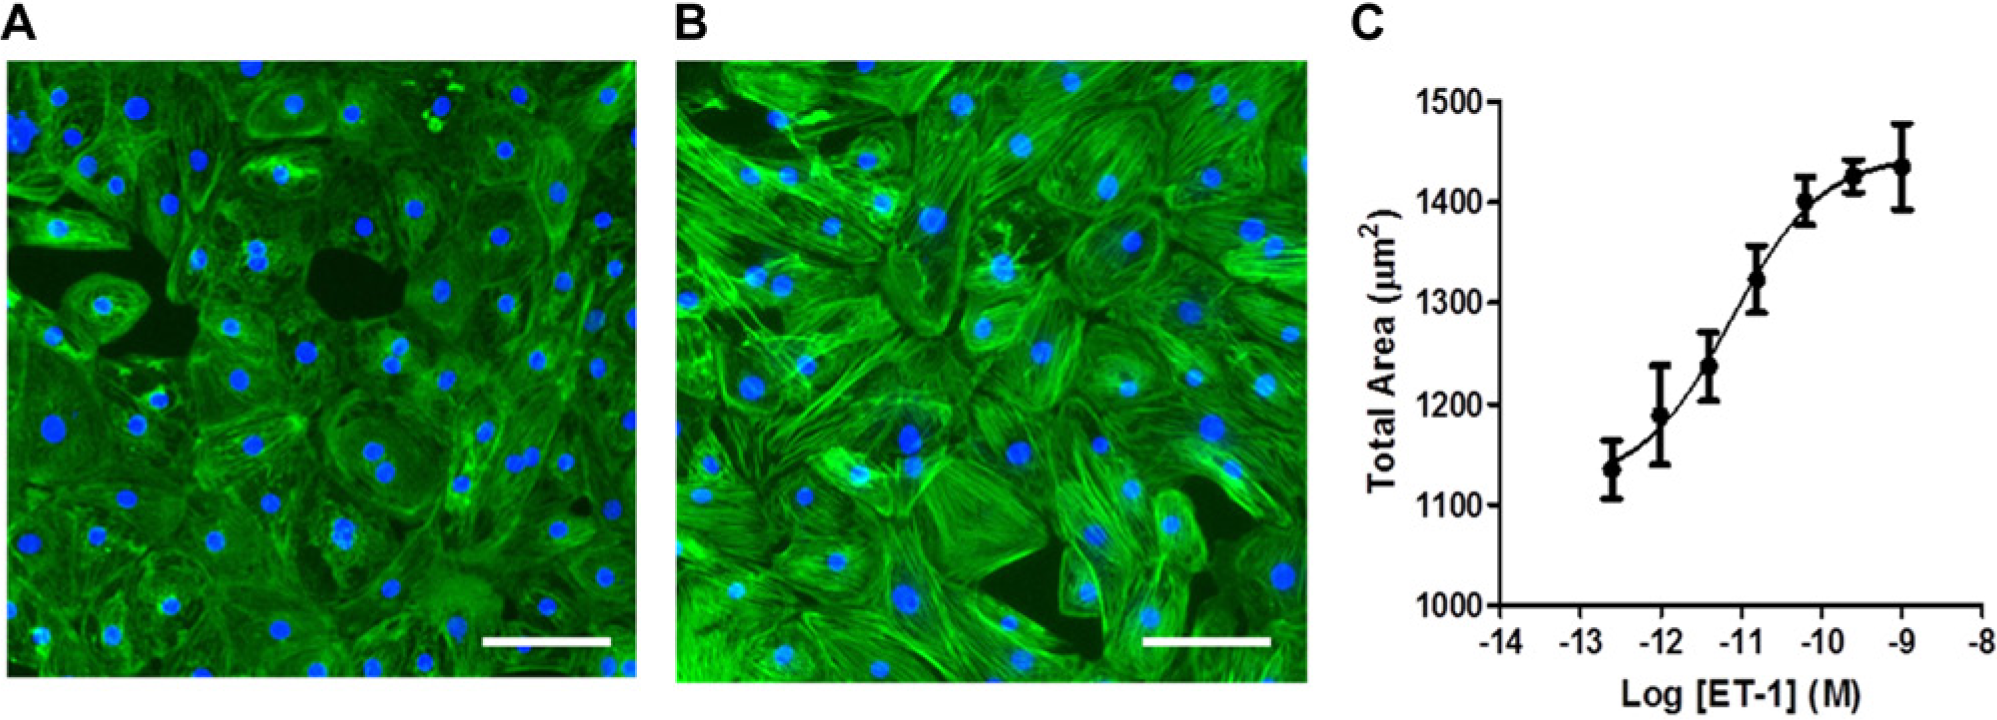
Cell size changes during hypertrophy. Representative images are shown for (
Following up the establishment of the model, we next focused on the development of various end-point assays to detect BNP protein expression in these cardiomyocytes. B-type natriuretic peptides (BNP or NT-proBNP) have been studied extensively in recent years, and their expression is an accepted indicator of the hypertrophic response in cardiomyocytes. 32 First, we custom developed a sandwich ELISA using a pair of anti–NT-proBNP antibodies to detect BNP secreted in the cell culture media. As shown in Figure 4A , dose-dependent increases in the amount of BNP were measured (in fmol/mL), with an average EC50 value of 24 ± 11 pM calculated from triplicate experiments between two different lots. Other commercially available ELISA kits for this same target analyte are available, but they were not tested for comparison.
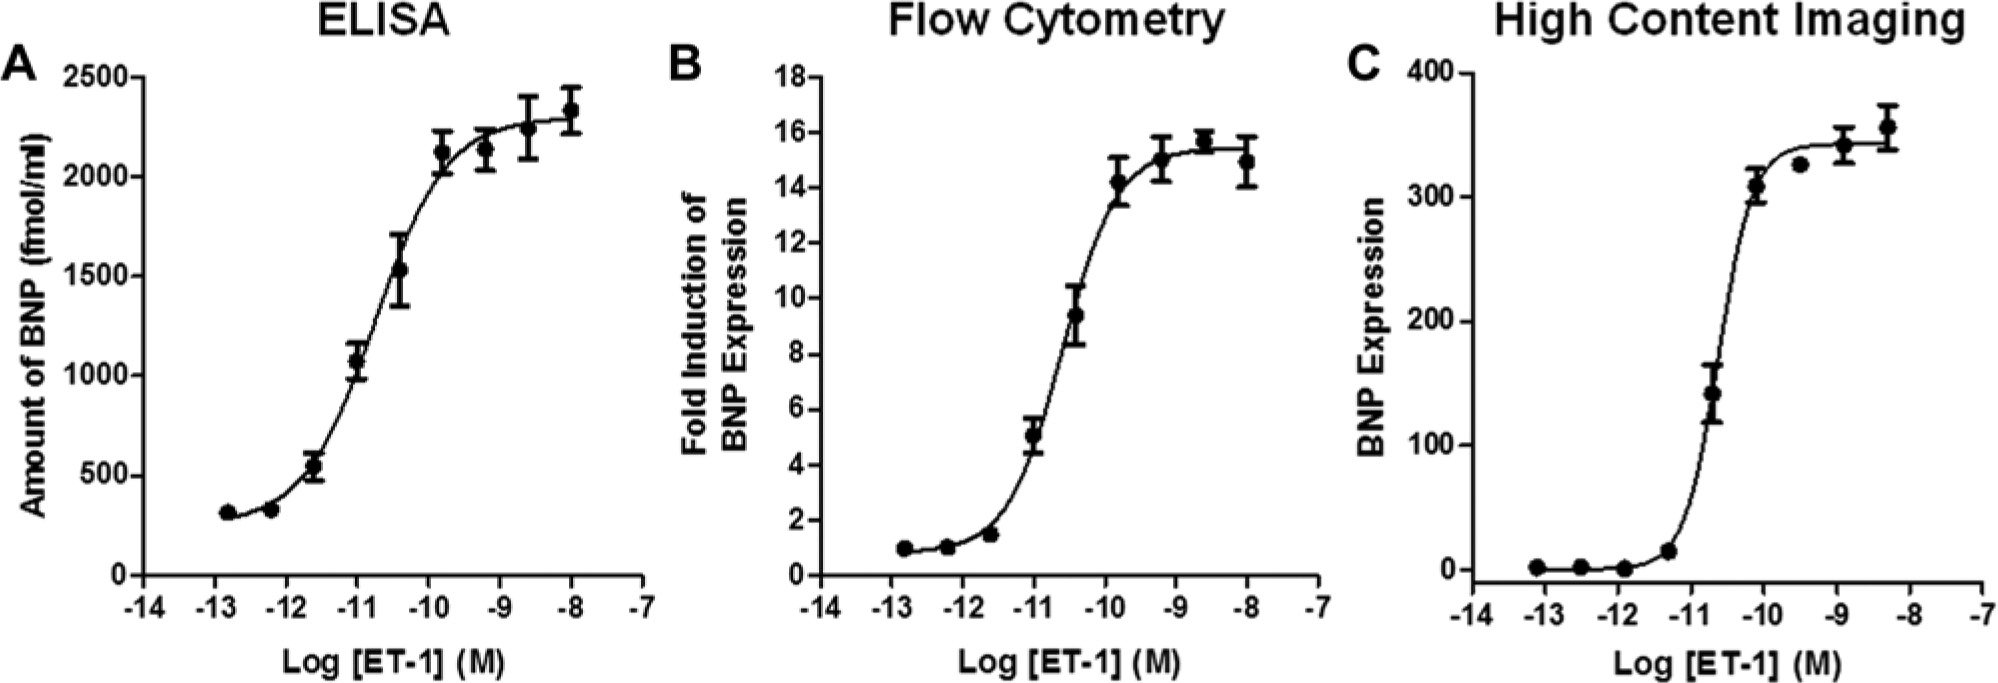
Multiple B-type natriuretic peptide (BNP)–based end-point readouts. Dose responses of endothelin 1 (ET-1) were added to the cells in a 96-well format, and the hypertrophic response was measured by either (
In addition to measurement for NPPB messenger RNA (mRNA) and secreted BNP peptide, we also built assays for the detection of intracellular BNP by flow cytometry and HCI (
Fig. 4B
,
C
). Similar to qPCR and ELISA, these experiments were performed in 96-well plates and used the same assay workflow. The only required change to the method was the addition of BFA for 3 h before fixing the cells for analysis (i.e., 15 h postinduction with ET-1). Short-term incubation with BFA blocks the exit of secretary proteins from the endoplasmic reticulum and dramatically affects the signal in either assay end point (
Due to the demand for HTS-compatible assays to interrogate relevant human cell models, coupled with the fact that cardiac hypertrophy is a disease that likely does not converge on a single target, we deepened our focus on the HCI assay. This technology combines fluorescent microscopy with an automated digital cellular imaging system and is ideally suited for a phenotypic screening approach.33,34 Recently, iPS cell–derived cardiomyocytes have proven to be compatible with HCI-based approaches for cardiotoxicity. 13 We miniaturized the cardiac hypertrophy assay to a 384-well format and verified the induction of BNP expression. Treatment of the cardiomyocytes with ET-1 in this configuration resulted in images with excellent signal to background ( Fig. 5A ), consistent EC50 values for ET-1 in the low picomolar range (data not shown), assay windows greater than 20-fold, and excellent statistical data (Z′ > 0.5) for screening. Importantly, these results were reproducibly generated across two different manufacturing lots of cardiomyocytes ( Fig. 5B ). In other words, independent differentiation runs from the same iPS cell line, and following the same protocol yielded cardiomyocytes that performed with the consistency and statistical reproducibility required for HTS applications.
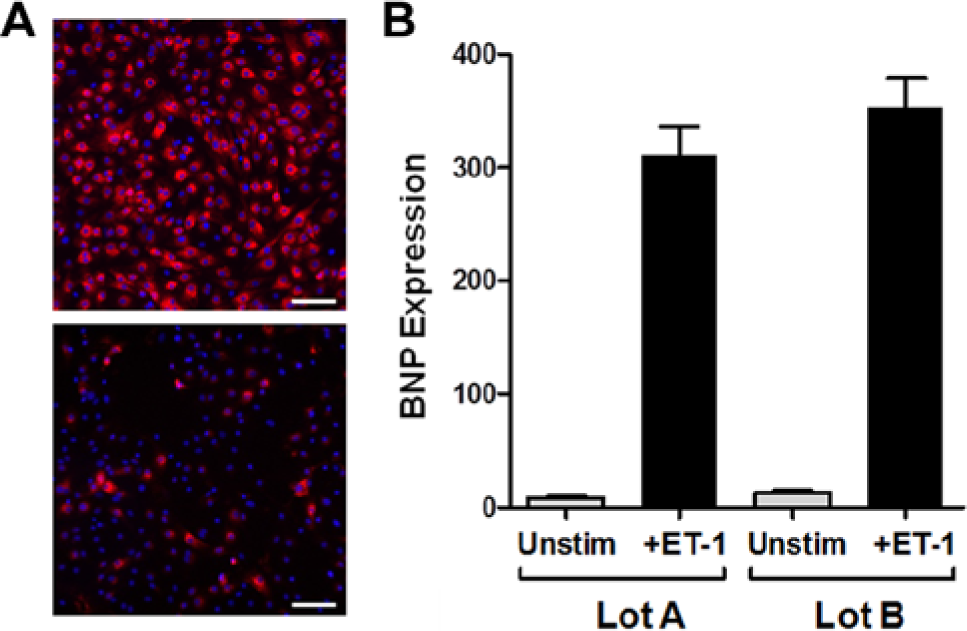
Robust assay performance in a 384-well format. (
To further highlight the utility of this assay for phenotypic screening, we profiled a small set of compounds known to modulate the hypertrophic response. 35 Cardiomyocytes were treated in “antagonist mode” with a 10-point dose response of inhibitor in quadruplicate on day 4 postthaw, followed by stimulation with a saturating concentration of ET-1 (1 nM). We have featured five different compounds that demonstrated inhibitory activity in the HCI assay ( Fig. 6 ). Verapamil, a known calcium channel blocker, proved to be the most potent compound tested (IC50 value = 35 nM) and could reproducibly modulate the BNP signal to the greatest extent. BEZ-235, a dual PI3K-mTOR inhibitor, displayed partial inhibition with an IC50 value of 80 nM. Cyclosporin A was also a partial inhibitor with a potency of 1.9 µM. 36 Fenofibrate modulated BNP expression, putatively through activation of peroxisome proliferator-activated receptor α, with an IC50 value of 6.5 µM. 23 Finally, the broad-spectrum histone deacetylase inhibitor, SAHA, also completely ablated the assay signal with an IC50 value of 3.8 µM. SAHA was the only compound presented here that caused any significant toxicity and only at the highest concentrations (≥10 µM), as witnessed by the decrease in nuclear cell count during high-content analysis. Illuminating the mechanism of action for each of these compounds is beyond the scope of this study, but these example data underscore the robustness and usefulness of iPS cell–derived cardiomyocytes for pharmacological testing and drug development through disease modeling.
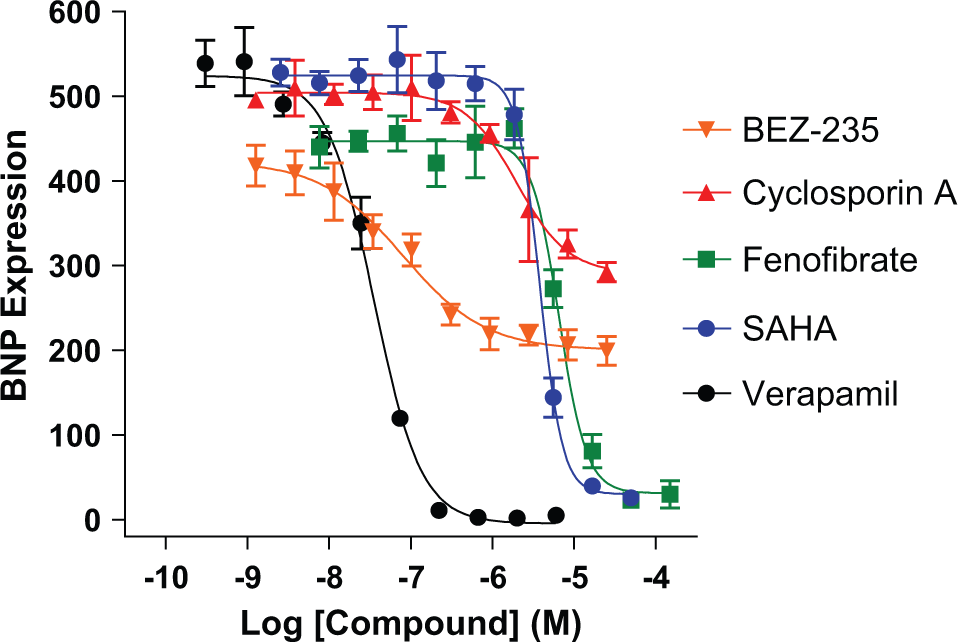
Small-molecule modulation of cardiac hypertrophy. Representative data are plotted from multiple compound profiling experiments. Induced pluripotent stem cell–derived cardiomyocytes were treated on day 4 with a dose response of compound for 1 h prior to induction of hypertrophy with endothelin 1 (ET-1) (1 nM) for 18 h in a 384-well format. Cells were analyzed for B-type natriuretic peptide (BNP) expression by high-content imaging on day 5 according to the protocol described in the Materials and Methods. Verapamil (black circles) was the most potent inhibitor, with an IC50 value of 35 nM. The inhibitory potencies of other compounds tested are listed here: BEZ-235 (orange triangles; 80 nM), cyclosporin A (red triangles; 1.9 µM), fenofibrate (green squares; 6.5 µM), and SAHA (blue circles; 3.8 µM).
In summary, we have shown here how a phenotypic screening approach using iPS cell–derived cardiomyocytes is a promising avenue for the integration of native human biology into early phases of drug discovery. We recognize that cardiac hypertrophy can be induced through and read out by various means, but for these studies, we chose to develop a panel of assays that monitor changes in NPPB gene expression or BNP protein production following induction with ET-1. Identification of a unique serum-free medium formulation that promotes fatty acid oxidation and rapid reduction of fetal gene program expression levels was critical to the development of all the assays presented here. Importantly, we applied the optimized assay workflow to an HTS-compatible HCI assay in a 384-well format that is useful for inhibitor profiling, compound library or small interfering RNA screening, and potentially even toxicity assessment. Together, with the power of iPS cell technology and disease- or patient-specific iPS cell lines, the quantitative cell-based assays described here should provide new ways to conduct drug discovery for cardiac hypertrophy, as well as complement the existing methods currently used to study this complex condition of the human heart.
Footnotes
Acknowledgements
The authors thank their colleagues at CDI who performed the reprogramming and differentiation steps in the process of manufacturing iPSC-derived cells.
Declaration of Conflicting Interests
The authors are employees of Cellular Dynamics International, Inc.
Funding
The authors are employees of Cellular Dynamics International, Inc.
References
Supplementary Material
Please find the following supplemental material available below.
For Open Access articles published under a Creative Commons License, all supplemental material carries the same license as the article it is associated with.
For non-Open Access articles published, all supplemental material carries a non-exclusive license, and permission requests for re-use of supplemental material or any part of supplemental material shall be sent directly to the copyright owner as specified in the copyright notice associated with the article.