
Abstract
Screening small interfering RNA (siRNA) libraries holds the potential to elucidate gene function as well as discover new targets for the therapeutic treatment of disease. Since the inception of siRNA as a discovery tool, there have been progressive improvements in siRNA design algorithms, the transfection reagents used to deliver them, and the assay formats used to monitor phenotypic changes. These changes have helped to improve the quality of the data emerging from siRNA screens. One variable that introduces inconsistency into high-throughput screening (HTS) of siRNA libraries is the state of the cells used in the assays. Multiple factors can contribute to differences in transfection efficiency as well as the basic cell biology, which can lead to differences in the genes identified in siRNA screens. The authors have developed a system using frozen cell aliquots to use in siRNA HTS, so that a major source of variability introduced into cell-based screens can be standardized. In addition, by transiently transfecting plasmids into cell lines and then freezing these cells down to use in siRNA transfection experiments, they have used this same technology to create new cell lines. This process of using aliquots of frozen cells is logistically advantageous in an HTS setting, as it reduces the time spent maintaining cell lines, as well as reducing possible downtime in screening due to lack of cells or poor cell health.
Introduction
S
One potential for reducing run-to-run variability due to changes in cell biology is to standardize the cells used in screens by using aliquots of frozen cells directly in the transfection experiment. Treating the cells as an assay reagent increases consistency among experiments because the cells used in different runs will be biologically similar. Although changes in cell biology can be minimized in cultured cells via stringent cell culturing and monitoring of passage number, in addition to regularly thawing out and expanding fresh vials of low-passage cells, using frozen cell aliquots is a more amenable process in a high-throughput screening (HTS) campaign. Multiple research groups have successfully used frozen cells in assays for different research applications, including compound profiling by fluorometric imaging plate reader (FLIPR), hERG inhibition by Rb+ efflux, and hepatitis C replication by beta-lactamase reporter. 4-6 We have developed a novel platform to screen siRNA libraries using frozen cell aliquots. At the beginning of each project, a large batch of cells is cryopreserved for use throughout the lifetime of the project, thus minimizing differences in the major reagent in a cell-based screen.
This technology has also been expanded to create new cell systems by transiently transfecting cells with a plasmid of interest and then freezing them down for later use in an siRNA transfection experiment. Transiently transfected cell lines can be made within 1 week, whereas the creation of a stable cell line can take weeks or even months. Our experiments show that data generated from assays using frozen cells are reproducible and correlate well with data generated from cultured cells. This is true both at the siRNA and at the gene level. Our system of using frozen cell aliquots in siRNA HTS has been used to screen more than 30 cell lines to date, with multiple phenotypic endpoints. This modification to standard siRNA screening applications is a viable and comparable alternative to screening with cultured cells and reduces time spent subculturing cell lines and HTS downtime due to lack of cells or poor cell health.
Materials and Methods
Cells and cell culture
The 293T-STF-RL cell line is a 293T cell that stably expresses a luciferase reporter under control of 8 copies of the TCF response element and a renilla luciferase under control of an SV40 promoter (pTA-STF-Luc plasmid). These cells were cultured in Dulbecco’s modified Eagle’s medium (DMEM) supplemented with 10% fetal bovine serum (FBS), 1% glutamine, 1% penicillin/streptomycin, and 1 µg/mL puromycin. The cell lines Capan-1 (HTB-79), DLD-1 (CCl-221), MCF7 (HTB-22), PANC-1 (CRL-1469), PC-3 (CRL-1435), and SKOV-3 (HTB-77) (ATCC, Manassas, VA) were cultured in RPMI media supplemented with 10% FBS, 1% glutamine, and 1% penicillin/streptomycin. All cells were maintained at 37°C/5% CO2.
Cryopreservation
Cells were harvested with trypsin/EDTA and then centrifuged at 1200 rpm for 5 min. Cells were resuspended in cryoprotective media (80% growth media, 10% FBS, 10% DMSO) at 1 × 10⁷ cells per mL. Then, 1 mL of cells was added to each cryovial and frozen overnight at –80°C in a slow-rate freeze box. Vials were transferred to liquid nitrogen for storage.
siRNAs and siRNA transfection
siRNA libraries used in this study were obtained from Qiagen (Valencia, CA) and Dharmacon (Lafayette, CO). They were diluted into siRNA dilution buffer (100 mM potassium acetate, 30 mM HEPES-KOH, 2 mM magnesium acetate, pH 7.4; Qiagen) and replated into 384-well plates. We used 3 different approaches to design nontargeting (NT) siRNAs. First, we generated 15 random DNA sequences from 1000 to 3000 bp; second, we chose several Escherichia coli genes; and third, we chose genes from the M13 bacteriophage. These sequences were input into Qiagen’s online design tool (no longer available). The top 6 to 8 scoring siRNAs targeting each of these random sequences or genes were BLAST-searched against the human and mouse transcripts and expressed sequence tags. The siRNA designs with significant homology to any known transcripts were eliminated from further consideration. In total, 79 NT siRNAs were selected for synthesis at the 20-nmol scale (Qiagen). Following a reverse transfection protocol, siRNAs were diluted into white, clear-bottom, tissue culture–treated 384-well assay plates (#353963, BD Biosciences, Billerica, MA) in basal media. Final siRNA concentration ranged from 10 to 30 nM depending on the cell line. Lipofectamine RNAiMAX from Invitrogen (Carlsbad, CA) was diluted into basal media and then added to the diluted siRNA. This transfection complex incubated 20 min at room temperature. Cells (either cultured or frozen) were overlaid, 1000 cells/well, and the assay plates were then shaken 1 min and then transferred to 37°C/5% CO2.
Cultured cells were harvested using trypsin/EDTA, and following a 5-min centrifuge at 1200 rpm, cells were resuspended in growth media at 50,000 cells/mL. Vials of frozen cells were thawed in a 37°C water bath, and the cells were then transferred into 10-mL growth media. Following a 5-min centrifuge at 1200 rpm, cells were resuspended in 10-mL growth media, followed by a second centrifugation. Cells were resuspended in growth media at 50,000 cells/mL.
HTS campaigns were carried out in both cultured and frozen 293T-STF-RL cells. A panel of ~6000 siRNAs was screened in quadruplicate, on separate screening days. Following transfection with siRNA and 4-day incubation at 37°C/5% CO2, cells were assayed using Cell Titer Glo (CTG) cell viability assay from Promega (Madison, WI) according to the manufacturer’s instructions. Plates were read on an LJL Analyst luminometer, from the top of the well, for 100,000 µs per well.
Screening campaigns were carried out in cultured and frozen Capan-1, MCF7, PANC-1, and SKOV-3 cell lines. A panel of ~630 siRNAs was screened. Following transfection with siRNA and 4-day (MCF7 and SKOV-3) or 5-day (Capan-1 and PANC-1) incubation at 37°C/5% CO2, cells were assayed using CTG cell viability assay as described above. Transfection conditions are listed by cell line in Supplemental Table 1.
Frozen and cultured PC-3 and 293T-STF-RL cells were transfected with a small panel of ~40 siRNAs at 10 and 30 nM, respectively, using 3 different transfection reagent concentrations. Following transfection, percentage confluency was measured every 3 h using the IncuCyte imager (Essen Instruments, Inc., Ann Arbor, MI) for ~4 days. At the end of the 4-day incubation, cells were assayed using CTG cell viability assay as described above.
Transient plasmid transfection
Cells were seeded into T175 flasks at 8 to 10 million cells per flask in growth media without antibiotics. Cell density was selected so that cells would be approximately 80% confluent on the day of transfection. The following day, cells were transfected with pTA-STF-Luc plasmid using Roche FuGene HD (Indianapolis, IN) transfection reagent. A 6:2 ratio of transfection reagent to DNA was used. Twenty-four hours post transfection, cells were harvested using trypsin/EDTA and cryopreserved using the previously outlined protocol (cells now identified as DLD1-STF-Luc) Transfection efficiency was tested by transfecting in a Wnt pathway control siRNA. Following a 3- to 4-day incubation with the siRNA, cells were assayed using PerkinElmer’s steadylite plus™ Reporter Gene Assay System (Waltham, MA) according to the manufacturer’s instructions.
Data analysis
Data from HTS campaigns were processed in the cellHTS package, 7 and statistics were performed using the stats package as implemented in R. 8 Raw intensity values were normalized by dividing each measurement by the median of the negative controls on each plate. Normalized values were used to calculate one-sided Wilcoxon rank sum p-values for each gene as implemented by the wilcox.test function. These p-values were corrected for multiple testing using the methods of Benjamini and Hochberg 9 as implemented in the p.adjust function in the stats package of R. Genes were ranked using uncorrected p-values.
For individual experiments, percent of control (POC) values are calculated as follows:

or

EC50 values were calculated in PRISM (GraphPad Software, La Jolla, CA) using nonlinear regression (curve fit) analysis with the equation sigmoidal dose response (variable slope). Comparison of the best-fit values of the LOG EC50 was performed using the extra sum-of-squares F test in PRISM resulting in an F ratio. p-values were calculated from the F ratio.
Results and Discussion
Cell variability with time in culture
When screening siRNA libraries in cultured cells, one indicator that the cell biology has started to change is a decrease in the functional transfection efficiency. In the midst of an HTS campaign for modulators of the Wnt signaling pathway using cultured 293T-STF-RL cells, we began to observe a shift in the functional transfection efficiency as indicated by a decrease in correlation of the data from control plates included in each screening run as a quality control measure. During any extended screening campaign, we track the transfection efficiency of the cell line by measuring cell viability following transfection of cells with siRNAs targeting essential genes (EG). The comparison of EG siRNAs to NT siRNAs at a single dose may not capture a true difference in transfection efficiency because the siRNA concentration may be well above a saturating dose for those siRNAs under the screening conditions. A better way to determine the efficiency of siRNA delivery is to compare the EC50 values derived from cells transfected with a range of siRNA concentrations. Because the ratio of siRNA to lipid will affect the transfection, the total siRNA concentration needs to be kept constant while altering the concentration of the siRNA being queried. The EG siRNAs are serially diluted into NT siRNAs and transfected into the cell line of interest. Each screening run includes a plate containing this serial dilution. Although relatively constant up until day 39 in culture, Figure 1 shows that the increase in EC50 values was rapid after this time, indicating that cells are less susceptible to transfection with KIF11 and PLK1 siRNAs. It is unlikely that the cells have lost dependence of these proteins because they are involved in mitosis and essential in nearly all cell lines. 10,11 Day 35 was used as the reference run, and each subsequent screening run was compared against this run. Statistical analysis revealed that the sharp shift in EC50 values observed after day 40 was significant, pointing to a resistance to transfection, rather than normal day-to-day variability between assays.
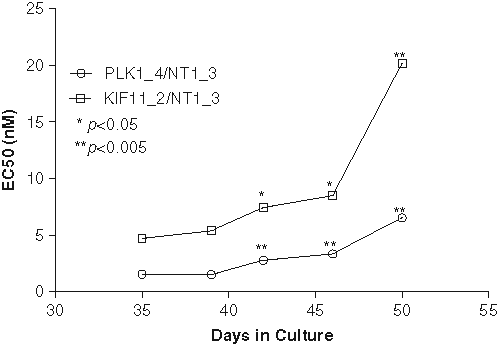
Transfection efficiency shifts with time in culture. Small interfering RNAs (siRNAs) were transfected into cultured 293T-STF-RL cells, and viable cell mass was measured after 4 days as described in Materials and Methods. EC50 values for siRNA targeting essential genes PLK1 and KIF11 are plotted against the number of days that the cells remained in culture. A p-value for each screening day is indicated at each EC50 point; p-values were generated in GraphPad Prism using day 35 as the reference for all comparative analysis.
A second control plate contains a panel of 79 NT siRNAs (data not shown). These NT siRNAs were designed to target random DNA sequence using algorithms similar to those used to design the libraries being used in the screen. However, they do not target specific transcripts but instead are used for testing the range of potential off-target effects of siRNAs in a given cell line under the transfection conditions tested. Viability measurements from individual NT siRNAs correlated very well when the cells used were tested within the first 3 to 5 weeks. As the time in culture was extended, correlation between runs began to decrease and rapidly became worse over time. It was apparent that cells were less susceptible to the off-target effect of the NT siRNAs.
Our data indicated that the biology of the 293T-STF-RL cells had changed over the course of HTS and that data from different screening runs were no longer comparable. The efficiency of functional siRNA transfection had changed over time. This functional outcome may have been due to an alteration of the cells’ ability to take up the siRNA or their ability to incorporate them into the RNA interference pathway. Our assay endpoint is measuring functional transfection efficiency, and it was beyond the scope of this study to determine which factor had caused the change in the cells. Although one option for proceeding was to thaw a fresh vial of low-passaged cells, a more agreeable alternative from an HTS standpoint was to develop an assay transfecting siRNAs into cells thawed directly from liquid nitrogen. If the data were comparable with that from cultured cells, not only would this address the issue of changing cell biology but it would also reduce the time spent routinely culturing and maintaining cell lines, as well as potentially reducing downtime in HTS because of low cell counts.
Assay development
We initially performed experiments to examine how to process the cells once they had been thawed out of liquid nitrogen. The cryogenic preservation media contain 10% DMSO, and this needs to be completely washed away to keep cell viability high, especially as the cells are going to be transfected immediately. Washing the cells 2 times in complete cell growth media was enough to wash the cells thoroughly while still maintaining cell viability (data not shown).
Next we explored whether siRNA transfection of newly thawed cells (henceforth termed frozen cells) would be as efficient as transfection of cells in culture and how transfection conditions in frozen cells compared with those in cultured cells. A panel of EG and NT siRNAs was tested with transfection reagents from 0.045 to 0.075 µL/well while maintaining siRNA concentration at 30 nM and cell density at 1000 cells/well. A mock transfection was also included to assess reagent affects on viability. The range of conditions was selected based on the transfection conditions previously determined for cultured cells: 1000 cells/well, 30 nM siRNA, and 0.06 µL/well transfection reagent. The viability of cells was monitored 4 days following transfection. We were able to obtain good transfection as indicated by the difference in viability following transfection with the NT and EG (i.e., PLK1, KIF11) siRNAs while maintaining cell viability within an acceptable range ( Fig. 2A ). Optimal transfection conditions were the same for both frozen and cultured cells. To assess transfection efficiency, EG siRNAs were serially diluted into NT siRNAs in siRNA dilution buffer and transfected into 293T-STF-RL cells (either cultured or frozen). As shown in Figure 2B , the EC50s for EG siRNAs were the same when comparing frozen and cultured cells, indicating that transfection efficiency was not affected by the process of freezing and thawing the cells. To compare the functional effects of siRNA transfection in frozen and cultured cells, we performed transfection with a panel of 79 NT siRNAs and assessed viability after 4 days (data not shown). The normalized viability measurements following transfection with the NT siRNAs had excellent correlation between the frozen and cultured cell (r2 = 0.92). The outstanding correlation between these screening conditions suggests that the biology of the cell line under screening conditions was similar.
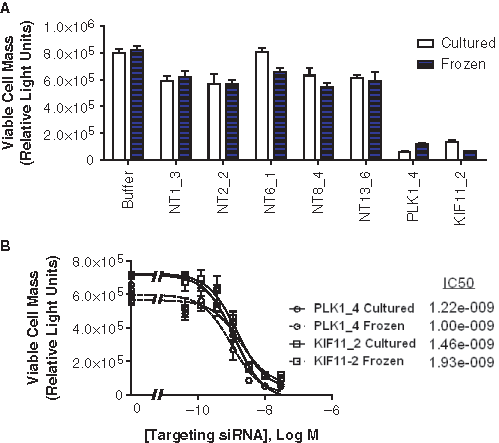
Transfection efficiency correlates well between cultured and frozen cells. Small interfering RNAs (siRNAs) were transfected into cultured or frozen 293T-STF-RL cells, and viable cell mass was measured after 4 days as described in Materials and Methods. (
Overall, the data generated from these initial experiments suggested that performing siRNA experiments using frozen cells is feasible. Although these experiments indicate good correlation among cultured and frozen cells, a larger data set is needed to determine if this pattern is reproducible. We proceeded to screen a panel of ~6000 siRNAs arrayed in 384-well plates in both cultured and frozen cells using the optimized transfection conditions determined for each. Although screens for both Wnt-induced luciferase reporter activity were run in parallel with screens assessing viability, the focus of this report is on the data derived from measurement of cell viability.
High-Throughput Screening
Eight separate HTS runs were carried out using 293T-STF-RL cells, 4 each using cultured or frozen cells. The first 2 runs for each cell condition, Cultured1/Cultured2 (C1/C2) and Frozen1/Frozen2 (F1/F2), were carried out within 1 week of each other. The third and fourth HTS runs, C3/C4 and F3/F4, were carried out within 2 weeks of each other, approximately 2 years after the original HTS runs. The same lot of frozen cells was used for all 4 HTS experiments.
Viable cell mass at the end of 4 days was measured using the CTG assay. The values for individual siRNAs from each run were compared, and the Pearson correlation coefficient values (r) for each cell condition were excellent, ranging from 0.92 to 0.98 in HTS runs using cultured cells and 0.90 to 0.96 in HTS runs using frozen cells. Comparing across cell conditions, r values ranged from 0.89 to 0.97. Correlation of siRNAs at the plate level as opposed to at the run level indicates a high degree of reproducibility. Outliers are more easily masked at the run level because of the larger data set—in this case, ~6000 siRNAs—whereas a single plate only contains 300+ siRNAs. Correlation of each of the plates within a run within the same condition is very high, and the correlation coefficient remained high comparing runs of different cell conditions as well (Supplemental Figure 1). Although this is important, it does not necessarily indicate that the genes identified as hits from the different cell conditions will also be the same.
Identification of a gene involved in a phenotype requires that the siRNAs targeting that gene affect the phenotype to a greater extent than the rest of the siRNAs used in a screen. To identify genes in a screen, a p-value is generated using the Wilcoxon rank sum test. For this test, siRNAs for a given gene are compared with the remainder of the siRNAs in the screen, and the p-values generated are adjusted for multiple hypothesis testing as described in Materials and Methods. For the first 2 screens of each condition (C1/C2 and F1/F2), p-values and gene rankings were generated and compared. As shown in Figure 3A , the correlation at the gene level is excellent, both within and among different cell conditions.
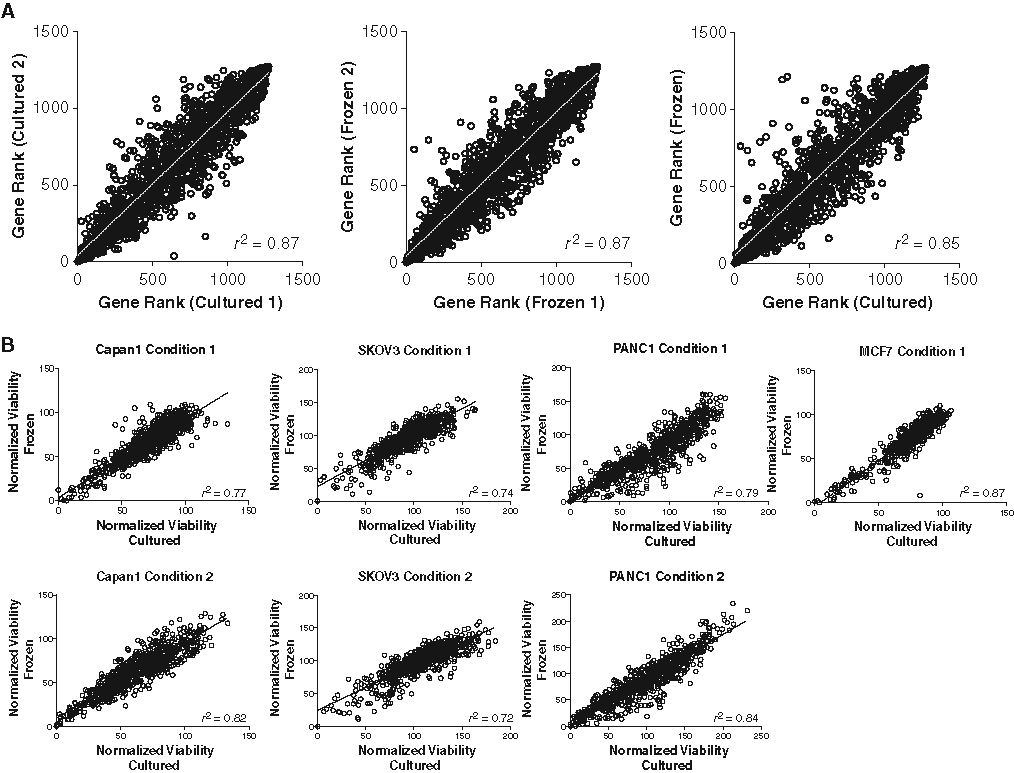
High-throughput screening data using cultured and frozen cells correlates at the gene level. Small interfering RNAs (siRNAs) were transfected into cultured or frozen 293T-STF-RL cells, and viable cell mass was measured after 4 days. Gene rank calculations were calculated as described in Materials and Methods. (
The data generated from the HTS campaigns using both cultured and frozen cells are quite robust. The fact that the data from the frozen cells are so reproducible and correlate so well with that from the cultured cells suggests that the siRNAs tested are having a similar effect because of similar cell biology. With the long-term reproducibility of the system added to the convenience, we believe that using frozen cells in siRNA experiments represents a significant advance in siRNA screening. Logistically, there is less time spent culturing cells in addition to reduced downtime due to a lack of cells or differences in cell confluency. Biologically, the ability to be able to run experiments using the same lot of cells over the entire length of a project ensures that the cells are at the same biological starting point.
Multiple cell line screening campaign
To assess the reproducibility of this technology across multiple cell lines, a smaller panel of siRNAs was screened against 4 cell lines—Capan-1, PANC-1, SKOV-3, and MCF7—using both cultured and frozen cells. All cell lines with the exception of MCF7 were screened under 2 different conditions, with transfection reagent and/or siRNA concentration varying (Supplemental Table 2). The siRNA library consisted of ~630 siRNAs representing 85 genes (4-12 siRNAs per gene), ~35 essential genes (1-4 siRNAs per gene), and ~80 nontargeting siRNAs. In all of the cell lines, correlation of data between frozen and cultured cells was high, and screens run using different transfection conditions using the same cell line also had high correlation values. As seen in Figure 3B , r 2 values ranged from 0.72 to 0.87. Although there are individual siRNAs that have a variable affect on the viability of cells from fresh culture or frozen aliquots, this variability is unlikely to be biologically relevant given that multiple siRNAs targeting the same gene did not show the preferential killing of one type of cell preparation (off-diagonal outliers). In addition, none of the off-diagonal outliers were shared between the cell lines, suggesting that these outliers are likely to represent noise. Although the siRNA library is smaller than the library used for the HTS campaign in 293T-STF-RL cells, the increased number of cell lines and multiple screening conditions strengthen the data set overall and show that this technology is applicable and reproducible across multiple cell lines of different tissue types.
Growth rate comparison
Finally, following siRNA transfection into 2 cell lines using both frozen and cultured cells, growth rates were compared to determine if significant growth rate differences occurred between the 2 conditions. Cultured and frozen 293T-STF-RL and PC-3 cells were transfected with a small panel of ~30 NT and EG siRNAs. The confluency of each cell line was measured every 3 h for approximately 4 days. The data for the buffer and nontargeting siRNAs are shown for each cell line. The growth of cultured and frozen cells was comparable for both cell lines. For certain siRNAs, the timing of growth varied slightly between the 2 conditions, although overall, the siRNA had the same affect on the cell line, cultured or frozen. Figure 4 depicts growth curves for both conditions of each cell line for 3 representative nontargeting siRNAs as well as buffer only. Overall, the correlation in the growth patterns for our test cell lines was high and helped to strengthen the data set showing that using frozen cells in siRNA assays is feasible.
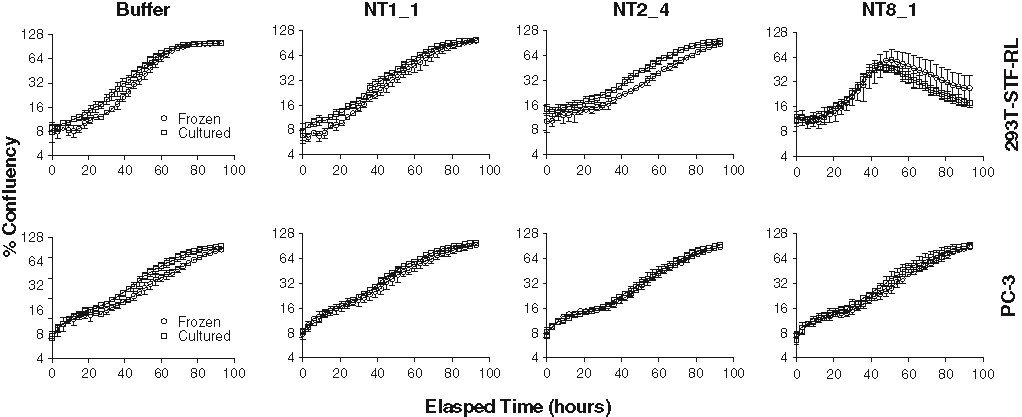
Growth rates of frozen and cultured cells correlate well. A panel of ~30 nontargeting (NT) and essential gene small interfering RNAs (siRNAs) was transfected into cultured and frozen 293T-STF-RL and PC-3 cells. Cell growth was measured as described in Materials and Methods, and percentage confluency is expressed as a log2 scale. The growth for cultured and frozen cells from both cell lines is compared for 3 NT siRNAs and the buffer-only wells.
Our goal was to be able to assay siRNA libraries on an HTS scale using frozen cells to generate data that were reproducible between experiments and that correlated with data from cultured cells both at the siRNA and at the gene level. The data presented here have shown that this is a viable technology. Some cell lines may not recover well from a freeze and may not be amenable to siRNA transfection immediately out of a thaw. Our experience has shown that some suspension cell lines do not adapt well to this technology (data not shown). In addition, some phenotypic endpoints may be influenced by the freezing process, but in most cases, 3 to 4 days in culture should be enough for recovery of the cells and manifestation of most phenotypes that would be studied in an siRNA screen. Using frozen cells, we have screened more than 30 cell lines in a variety of assays, including cell viability, reporter assays, and high-content imaging assays. In each case, the frozen cells gave us highly reproducible results between runs and allowed for excellent technical confirmation rates (using the same siRNA in the same cell line).
Transiently transfected cells
The focus of our original screen was to identify proteins involved in the Wnt-signaling pathway. DLD-1 cells contain a mutation in the adenomatous polyposis coli (APC) gene, 12 which causes constitutive stabilization and translocation of beta-catenin (derived from the CTNNB1 gene) to the nucleus. Beta-catenin pairs with the TCF transcription factors, resulting in transcription of genes under control of CTNNB1/TCF promoters. 13 DLD-1 cells containing the pTA-STF-Luc plasmid should constitutively express luciferase due to the constitutive activation of the pathway as a result of the APC mutation. DLD-1 cells were transiently transfected with a plasmid containing an 8× TCF-Luc reporter (STF) and then cryopreserved. Knockdown of CTNNB1 by siRNA transfection should decrease luciferase signaling in this cell line. Conversely, luciferase signal should increase after siRNA transfection with a gene that activates CTNNB1-driven luciferase signaling. Although other labs have used cryopreserved transiently transfected cells in receptor-based experiments, 14,15 we believe their use in siRNA experiments to be novel.
To test the transfection efficiency of the luciferase reporter into the DLD1 cell line, siRNAs targeting CTNNB1, IK (cytokine down-regulator of HLA II), and a nontargeting siRNA were serially diluted in nontargeting siRNA to yield a final concentration of 10 nM. The serial dilutions were transfected into DLD1-STF-Luc cells and assayed for luciferase activity (SteadyLite) and cell viability (CTG) 3 days posttransfection. Knockdown of CTNNB1 did decrease luciferase signaling in a dose-dependent manner yet did not have an effect on cell viability ( Fig. 5A , B ). This is likely a gene-specific effect because 3 of 4 siRNAs against CTNNB1 decreased luciferase signaling in a single-point assay in DLD1-STF-Luc cells ( Fig. 5C ). Conversely, knocking down IK in DLD1-STF-Luc cells increased luciferase activity in a dose-dependent manner ( Fig. 5B ). Four of 4 siRNAs against IK increased luciferase activity significantly, as shown in Figure 5D . The single-point assays were run on separate days using 2 separate batches of DLD1-STF-Luc cells. The nontargeting siRNA serial dilution did not have a significant effect on luciferase activity, although a slight increase in reporter activity was observed at the highest concentration. This is likely due to the diluent nontargeting siRNA exhibiting slightly more toxicity to this cell line than the nontargeting siRNA of interest ( Fig. 5A ).
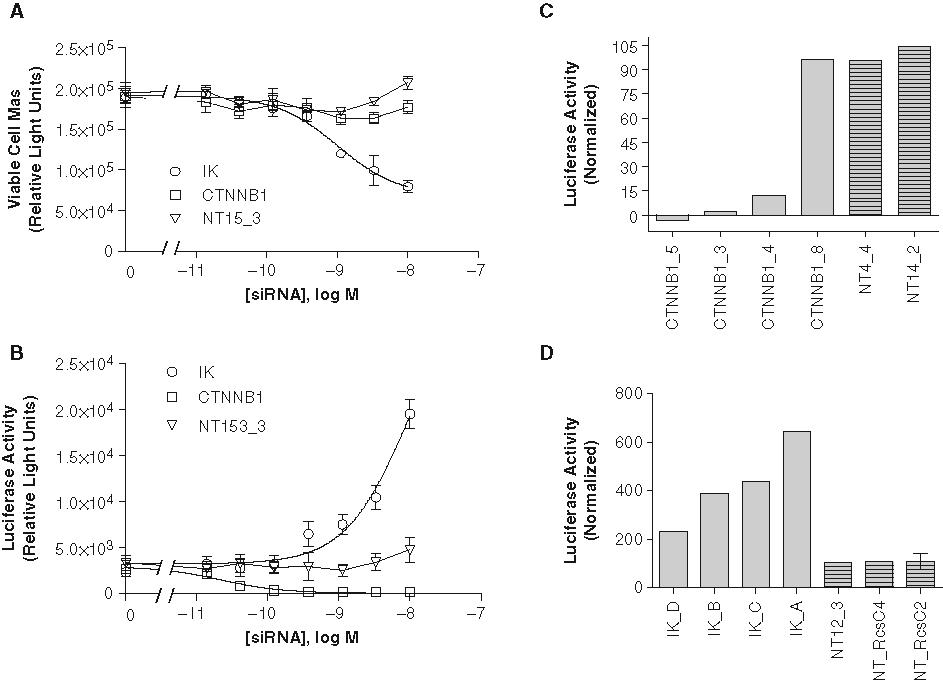
Transient plasmid transfection generates Wnt-reporter cell line for use in small interfering RNA (siRNA) transfection. DLD1 cells were transiently transfected with pTA-STF-Luc and cryopreserved prior to transfection with siRNAs as described in Materials and Methods. Wnt-pathway-driven luciferase activity (
The effect on luciferase reporter activity due to knockdown of CTNNB1 and IK indicates that transfection of the luciferase reporter into the DLD-1 cell line was successful and that these cells can be used to identify pathway components with both positive and negative effects on activity. The decrease in signaling attributed to CTNNB1 was expected and is easily explained by the well-known role of the beta-catenin protein in TCF promoter activity. However, the increase in activity following knockdown of IK is not readily explained. Our library annotates the siRNAs as targeting IK, which was initially described as a cytokine that caused downregulation of major histocompatibility class II expression. 16 However, the gene (RED) encoding this protein appears to encode a larger protein that localizes to spots in the nucleus of the cell, 17 and the ortholog in Caenorhabditis elegans is involved in mRNA splicing. 18 It is not known whether knockdown of IK/RED is increasing luciferase mRNA expression, altering the stability of the transcript, or affecting the stability of the luciferase protein. It is also not known how specific this effect is. Knockdown of IK shows little effect on viability in short-term assays but at later time points results in large-scale cell death of nearly all cell lines we have tested to date (data not shown).
Our data show that transiently transfecting cells and cryopreserving them for later use in siRNA experiments is a viable technology. The creation of new cell lines via transient transfection can be accomplished in days, whereas stable cell line creation can take weeks. In addition, the biology of these cell lines might be closer to that of the parental cell line as it will represent a larger portion of the cell population versus a stable clone selected over a long period of time from this initial population. This method can be used to quickly generate new systems for the study of phenotypes that require exogenous reporters. We have been successful in using several different transcriptional reporters in multiple cell lines. Conceivably, this procedure could be used for the testing of wild-type or mutant protein overexpression constructs, including fluorescent protein fusions that could be used for the tracking of protein stabilization, degradation, or localization in the context of an siRNA screen.
Summary
We have developed a novel system using cryopreserved or transiently transfected and cryopreserved cells in siRNA experiments. Our data generated from screening siRNA libraries using frozen cell aliquots are reproducible and correlate well with data from cultured cells at the siRNA and the gene level. Screening with frozen cell aliquots helps to standardize a potential source of variability introduced into cell-based screening and reduces assay downtime due to differences in cell health or biology. The transiently transfected cell system can be used to generate new cell lines for siRNA and other experiments in days versus weeks and can be used in assays where endogenous cell systems would not work. We have demonstrated that the use of cryopreserved cells in siRNA experiments can yield comparable data with that produced with freshly cultured cells and believe that this can be translated to other screening endpoints. With the added convenience of cells as reagents, this procedure could become typical in siRNA screening laboratories.
Footnotes
Acknowledgements
The authors thank Dr. Jennitte Stevens (Amgen, Inc., Protein Sciences) for her contribution of the 293T-STF-RL cell line. We also thank Priya Mitty (Amgen, Inc., Lead Discovery) for her contribution on the screening campaigns.