
Abstract
Many modern compound-screening technologies are highly miniaturized, resulting in longer-lasting solution stocks in compound management laboratories. As the ages of some stocks stretch into years, it becomes increasingly important to ensure that the DMSO solutions remain of high quality. It can be a burden to check the quality of a large library of compound solutions continuously, and so a study was devised to link the effects of initial compound purity and physicochemical properties of the compounds with the current purity of DMSO solutions. Approximately 5000 compounds with initial purity of at least 80% were examined. Storage conditions were held or observed to be relatively constant and so were eliminated as potential predictors. This allowed the evaluation of the effects of other factors on the stability of solutions, such as initial purity, number of freeze-thaw cycles, age of the solution, and multiple calculated physicochemical parameters. Of all the factors investigated, initial purity was the only one that had a clear effect on stability. None of the other parameters investigated (physicochemical properties, number of freeze-thaw cycles, age of solutions) had a statistically significant effect on stability.
Introduction
With the advent of high-throughput screening, compound collection sizes exploded. It is common these days to screen hundreds of thousands of compounds against a new target to identify hits. 1 Solutions are easily handled with automated and multiplexed robotics. Meanwhile, the introduction of acoustic technologies has resulted in the miniaturization of solution dispensing (nanoliters) with unprecedented accuracy and precision. In turn, these factors contribute to solution stocks lasting longer before being exhausted.
It is well accepted that the stability of solid compounds is significantly better than that of solutions. 2 Unfortunately, there are very limited options for weighing solids in small amounts (milligrams). The current limitations of solid dispensing together with the advances in liquid dispensing have led many laboratories to employ strategies that make the most use of the solution compound collection with minimal replenishment from solid. 3 The main downside to this strategy is the potential instability of compound solutions in storage.
Several published reports have looked at the impact of factors on the stability of small molecules in DMSO solutions. The impacts of temperature, number of freeze-thaw cycles, oxygen, water, container type, inert environment, and solvent were studied.4–9 One study found that >90% of the compounds were still pure (>80%) after six years in storage in DMSO at −20 °C but did not report anything related to the properties of the compounds analyzed. 3 Meanwhile, a study that looked at storage under argon or ambient atmosphere at −20 °C and +15 °C reported that compounds with an initial purity of 50% to 75% generally degraded faster than compounds with an initial purity >75%. 10 Another study attempted to build a predictive stability model for solutions stored at +50 °C for 105 days and was able to achieve only ~70% success. 11 There does not appear to be a historical comprehensive analysis of the effect of initial purity and structural characteristics of the compounds on stability of compounds in storage at −20 °C in DMSO over longer time periods.
Two experiments (study 1 and study 2) were conducted to examine the link between a compound’s purity at the current time in storage with its initial purity and its physicochemical properties. Study 1 represented a pilot study with 364 compounds, and study 2 was a validation set with 1222 compounds. The results from studies 1 and 2 indicated that compounds ≥95% pure at the time of solution creation had a high probability to be ≥80% pure at the current time. Therefore, a strategy was developed for any large (generally greater than 10,000) sample set request in which all solutions with an initial purity of <95% are reanalyzed and all solutions ≥95% initial purity are processed for screening without additional quality control (QC).
Study 3 represents an application of the strategy described above in processing a request for 30,000 existing solutions. A total of 3891 solutions of the 30,000 request that had been stored under different conditions from the study 1 and study 2 solutions, of which 3677 were <95% pure initially, were analyzed. Even though the storage conditions were different (and more optimal) for study 3 compounds, results from all three studies clearly indicated that initial purity has a strong impact on final purity of a compound in DMSO solution. Solutions with high initial purity (e.g., >90% or > 95%) had a high probability of retaining enough purity so that further QC measurements were deemed of low value. Solutions with lower initial purity (e.g., between 80% and 90%) may need to be reassessed.
Materials and Methods
Compound Storage Conditions
Three sets of compounds were investigated. The first two sets of 364 (study 1) and 1222 (study 2) compounds belonged to a group of ~125,000 legacy compound solutions in DMSO that had been stored over several years at −20 °C in a walk-in freezer in 96-deep-well racks (cat no. 3961, Corning Life Sciences, Tewksbury, MA). For every request, all of the 96-deep-well racks were thawed at room temperature for about 2 h and then unsealed and placed on a liquid handler bed in the open laboratory. The laboratory was maintained at 20 °C and 40% to 50% relative humidity. The 96-deep-well racks were resealed with adhesive seals (cat no. 676090, Greiner Bio-One, Monroe, NC) immediately after the liquid-handling operation was completed, generally taking 1 to 2 h and always less than 8 h. The requests, all of which were recorded, equate with the number of freeze-thaw cycles included in the analysis. About 39% of compounds went through 15 to 50, 23% through 50 to 100, and 38% through >100 freeze-thaw cycles. Compounds from these sets were in storage for 2 to 7 y. The 125,000 complete set contained logically designed focused subgroups, which were each created at the same initial time and were always requested together. Therefore, the number of freeze-thaw cycles and age of compounds are nonindependent variables, and their individual effect could not be investigated separately.
The third set of 3891 compounds (study 3) were not part of the 125,000 legacy compound solutions. They differed from the compounds in studies 1 and 2 both structurally and in terms of storage conditions. Study 3 DMSO solutions were prepared for storage directly into the automated large tube stores at GSK (ALS, Brooks, Chelmsford, MA; and LTS, TAP Biosystems, Royston, UK). These solutions were made into sealed ABgene tubes (cat no. SP-1494, Fisher Scientific UK Ltd, Loughborough, UK) and stored at −20 °C. Any request for these tubes was made at the individual tube level. All processing for these tubes was performed within the automated store. Rapid thawing (30 min) takes places in a station that blows room-temperature air on the tubes. Liquid handling is performed through the pierced tube septa. The number of freeze-thaw cycles or age in storage for the third set of compounds was not available.
Water Content Determination
The measurement of water content in DMSO solutions was performed in situ using an Echo 550 acoustic dispenser (Labcyte, Sunnyvale, CA). All solutions were measured using Echo-qualified microtiter plates.
Analytical Method
A slightly modified version of the LC-UV-MS method described by Smith et al. 12 was used for purity measurements. Briefly, the system was composed of an Acquity autosampler, an Acquity ultra performance liquid chromatography (UPLC) binary pump system, an Acquity SQD single quadrupole MS, an Acquity photodiode array detector, and an Acquity ELS detector (all from Waters, Milford, MA). The UPLC was fitted with a 1.7 µm Acquity UPLC BEH C18 column (2.1 × 50 mm) maintained at a temperature of 80 °C. The injection volume was 1 µL, the pump flow rate was 1 mL/min, solvent A was water + 0.1% formic acid, and solvent B was ACN + 0.075% formic acid. A 2 min gradient method was run, from 97% solvent A at time 0 to 100% solvent B at 1.5 min, maintained at 100% solvent B until 1.9 min and back to 97% solvent A at 2 min. The Waters SQD mass spectrometer was used for identity confirmation and was set up using both positive and negative ionization with an ESI source, a capillary temperature of 150 °C, and a capillary voltage of 3.10 kV. Full scan mode was used for detecting ions between 125 and 1000 Da at a scan rate of 0.2 s. Purity was measured on the photodiode array detector by scanning from 210 to 350 nm with a 1.2 nm resolution. The ELS detector is generally used for purity determination of very polar and non-UV active molecules; however, none of the data in this report used purity determined on the ELS detector. Precision of the analytical method was ±2%.
Compound Selection
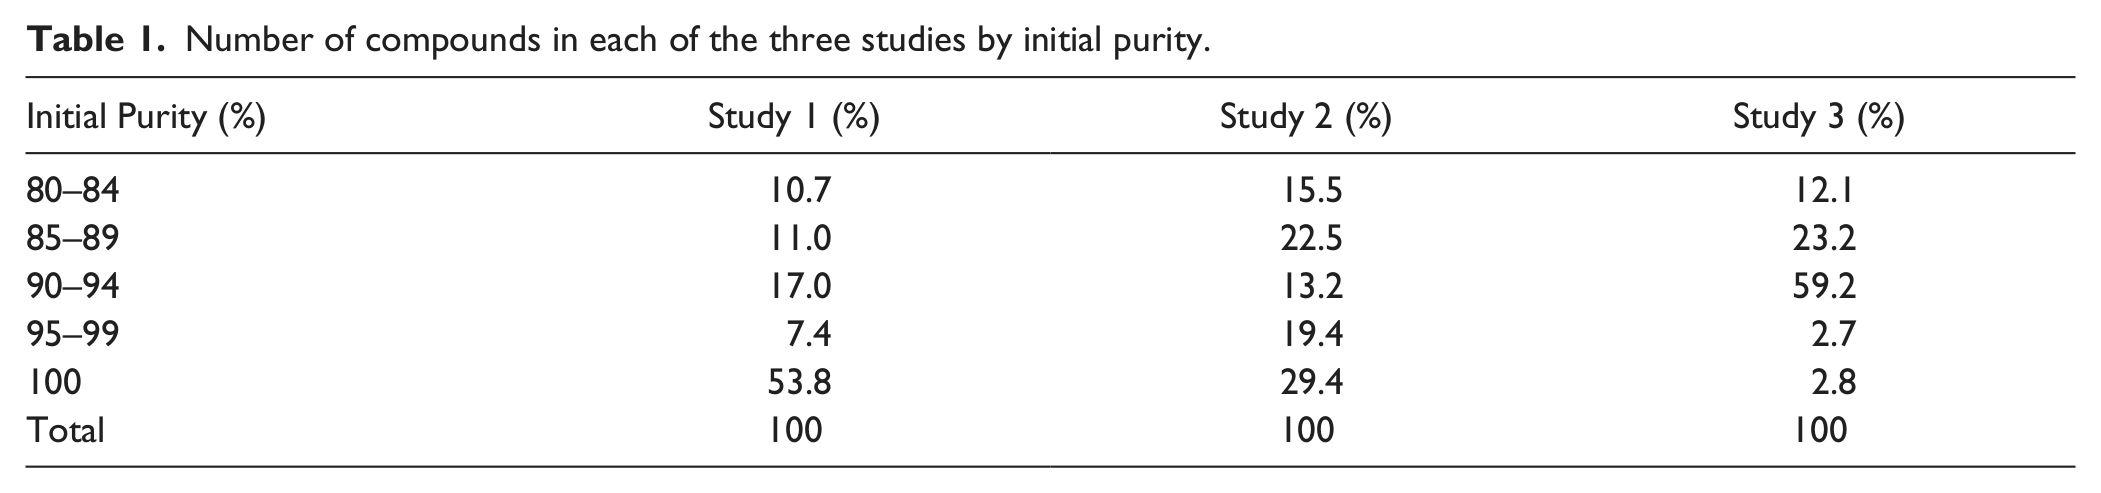
The compounds in study 1 were selected such that the distribution of the molecular properties investigated, as well as the number of freeze-thaw cycles and age of solutions, mirrored that of the 125,000 full set. The initial purity was known and included in the data analysis; however, it was not considered as part of the selection of samples for study 1. The results of study 1 indicated a strong influence of initial purity on the final purity. Study 2 compounds were therefore selected to reflect both the distribution of molecular properties, age, and freeze-thaw cycles of the full 125,000 set and a relatively equal distribution of initial purity. Study 3 was an application of the QC strategy developed based on the results from studies 1 and 2 for a set of 30,000 leadlike compounds. 13 Table 1 shows the distribution of compounds in all studies by initial purity. Figure 1 shows the distribution of some of the calculated physicochemical properties for the compounds in all three studies.
Number of compounds in each of the three studies by initial purity.
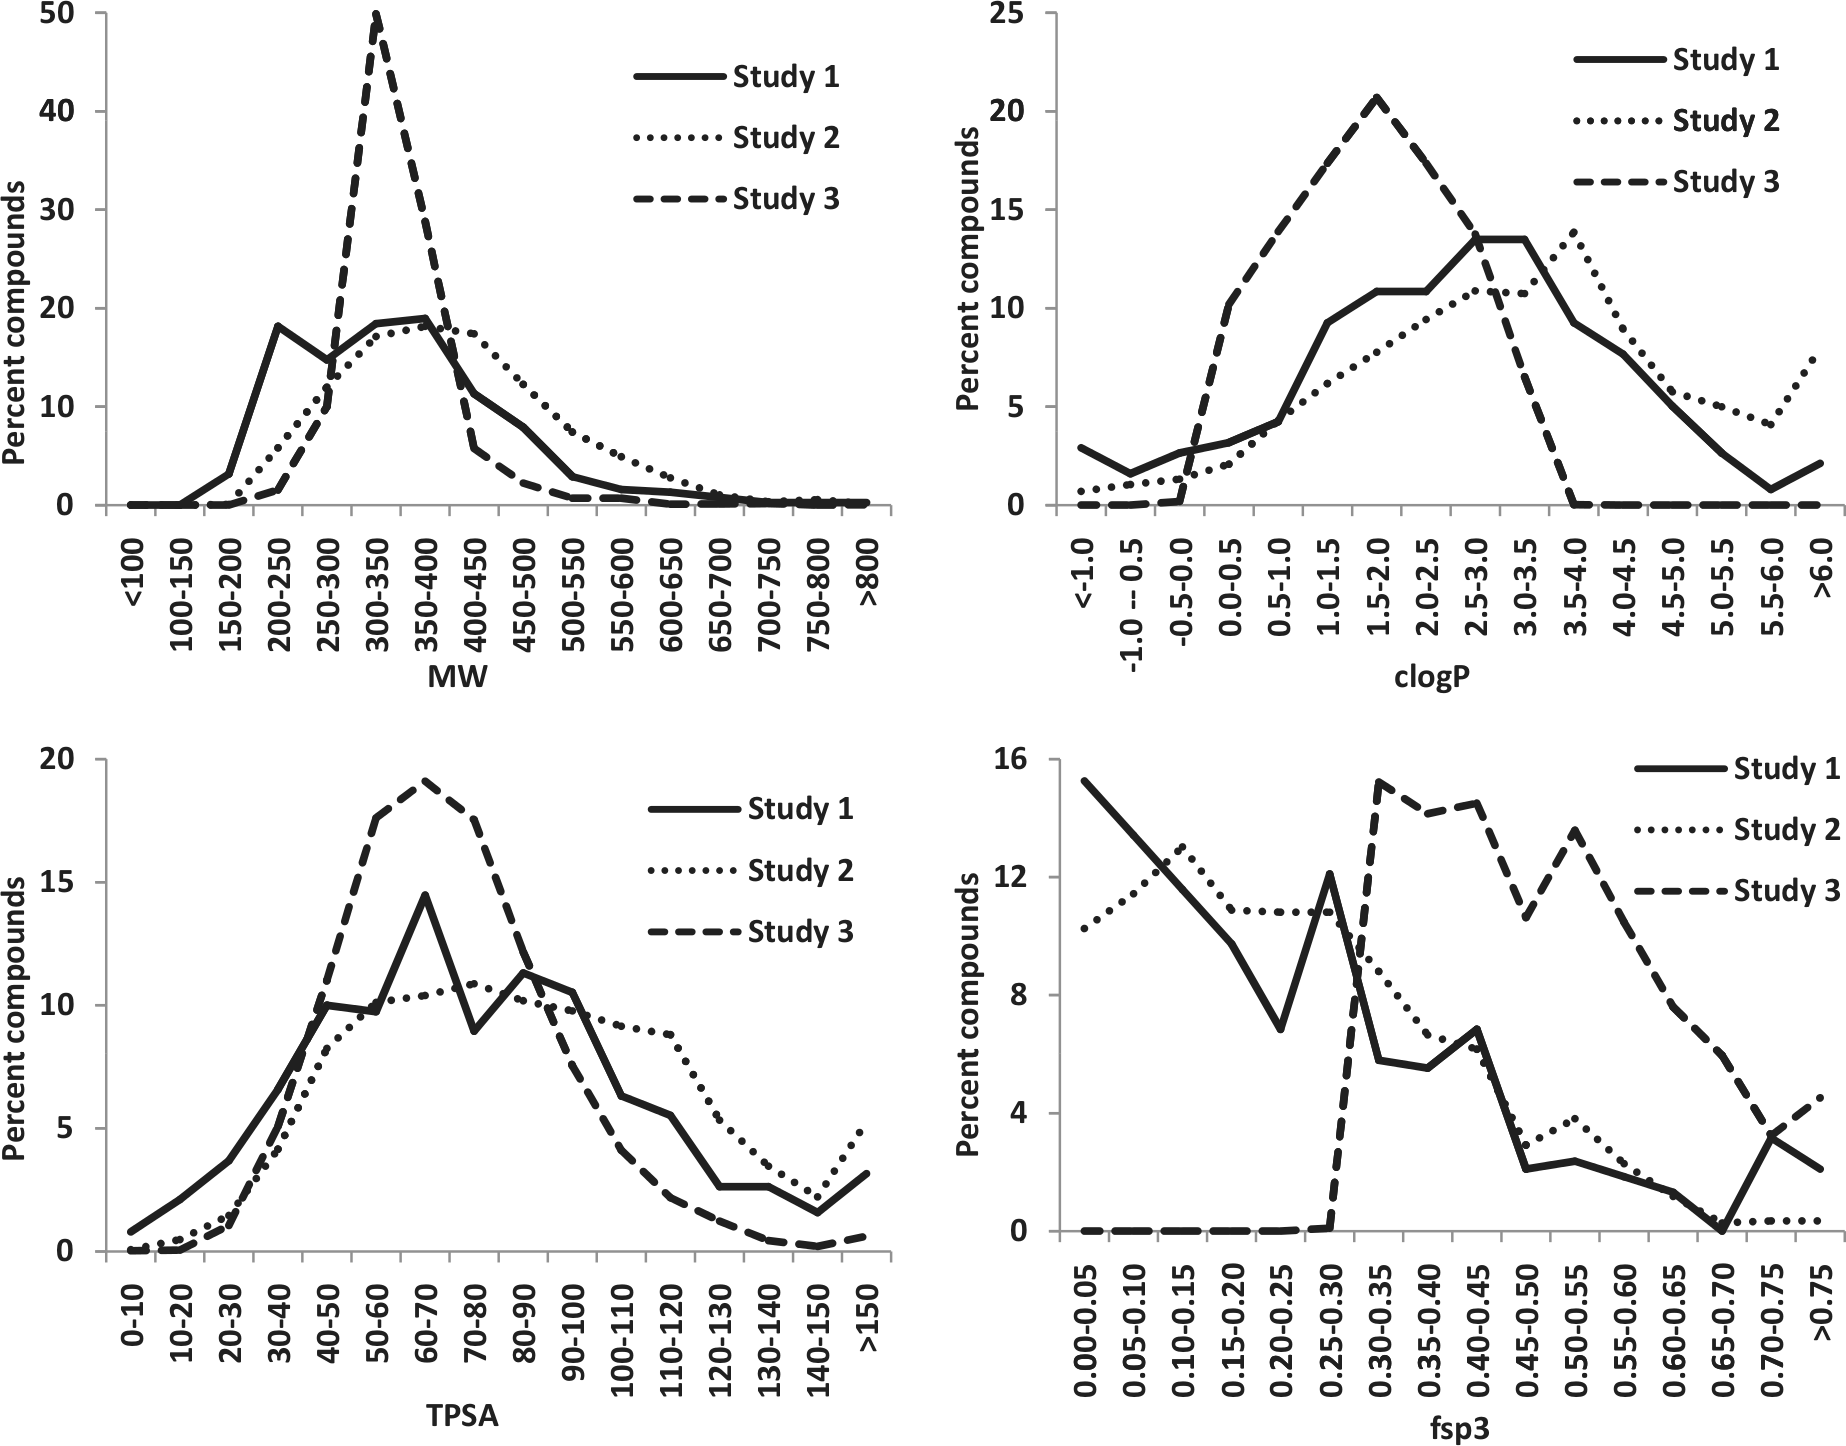
Distribution of molecular weight, clogP, topological polar surface area, and fraction of sp3 carbons for the compounds analyzed in studies 1, 2, and 3.
Data Analysis
The data from study 1 and study 2 were combined. The binary response variable Final Purity > 80% (Yes/No) was constructed and linked via the random forest algorithm 14 with initial purity, number of freeze-thaw cycles (Num-FT), molecular weight, clogP, number of aromatic rings, topological polar surface area, number of hydrogen bond acceptors, number of hydrogen bond donors, number of rotatable bonds, fraction of sp3 carbons, number of heteroatoms, chromatographic log D 15 , and chromatographic log P. A generalized cross-validation (GCV) algorithm with random forest was employed to determine the number of significant variables required to predict the binary response. Because of the imbalance in sampled compounds with >80% purity, the random forest model cutoff variable was adjusted to equilibrate the prediction errors. A logistic regression model was also built to link the binary response to initial purity. Data from study 3 were analyzed similarly, but separately, and without the Num-FT variable as it was unavailable.
Results and Discussion
Studies 1 and 2
This project was initiated when a large number of solutions (~125,000) from a legacy system needed to be transferred into the automated tube store. All solutions in the legacy system were initially QC checked, and all 125,000 were ≥80% pure at the time of solubilization in DMSO. At the same time, only compounds with at least 80% current purity would be allowed to enter long-term storage in the tube stores. Although the initial purity information was known to be ≥80%, there was no information available regarding current purity. At the time of the transfer, compounds were in solution for at least 2 y (and a maximum of 7 y) and had undergone multiple freeze-thaw cycles (a minimum of 15, a maximum of 125), with subsequent liquid handling cherry-picking operations performed in ambient atmosphere for several hours at a time. Because of the high burden of retesting the entire compound set, it was desirable to develop a strategy to predict compound purity from known and calculated compound properties so that only a smaller subset of solutions would require new QC measurements.
These samples already existed; therefore, storage conditions (temperature, container type, and atmosphere) were unmodifiable and not included as variables. One important factor shown to have a strong negative affect on stability of DMSO solutions is water content. 4 It has been reported that DMSO will absorb water up to about 30% as a hyperbolic function of time, with the first 10% increase occurring in about 6 h under standard laboratory conditions. 16 Engeloch et al. 17 reported that only 6% of the Novartis Compound Archive 2 mM solution stocks in a 90/10 DMSO/water mixture had a lower purity after 2 y of storage at 4 °C and 20% relative humidity compared with the beginning of their study. All 125,000 solutions from which study 1 and study 2 compounds were selected had been through a minimum of 15 freeze-thaw cycles, and each freeze-thaw cycle involved at least 1 h of exposure to ambient laboratory conditions (18 °C−20 °C and 40%–50% relative humidity). Although the water content in the DMSO solutions at time 0 was not measured, we did measure it at time current and found it to be consistent across all samples (91.5% ± 2.6% DMSO). Because it was not found to vary across solutions, it was not included as a variable in building the prediction model. Rather, we decided to focus on other available variables to try to predict current purity: we calculated physicochemical properties of each compound, initial purity, freeze-thaw cycles, and age of solutions. It is important to note that age and the number of freeze-thaw cycles for studies 1 and 2 solutions are statistically confounded as variables. This is because there were several logically designed focused subgroups of solutions within the 125,000 set, and each one of these subgroups was prepared at the same time and was always processed as a whole subgroup.
Study 1 was designed as a small experiment (all solutions fit onto a single 384-well plate) to get a quick read into the importance of the variables considered for the prediction model. The criteria for the selection of the 364 compounds in study 1 were that the distribution of molecular properties, as well as the number of freeze-thaw cycles/age mirrored that of the 125K full set. The initial purity was known, however it was not considered as part of the selection of samples for study 1. The results of study 1 indicated an influence of initial purity on the final purity. The more comprehensive selection of study 2 compounds involved both the distribution of molecular properties, and freeze-thaw cycles/age similar to that of the full 125K set, as well as a relatively equal distribution of initial purity, as seen in Table 1 .
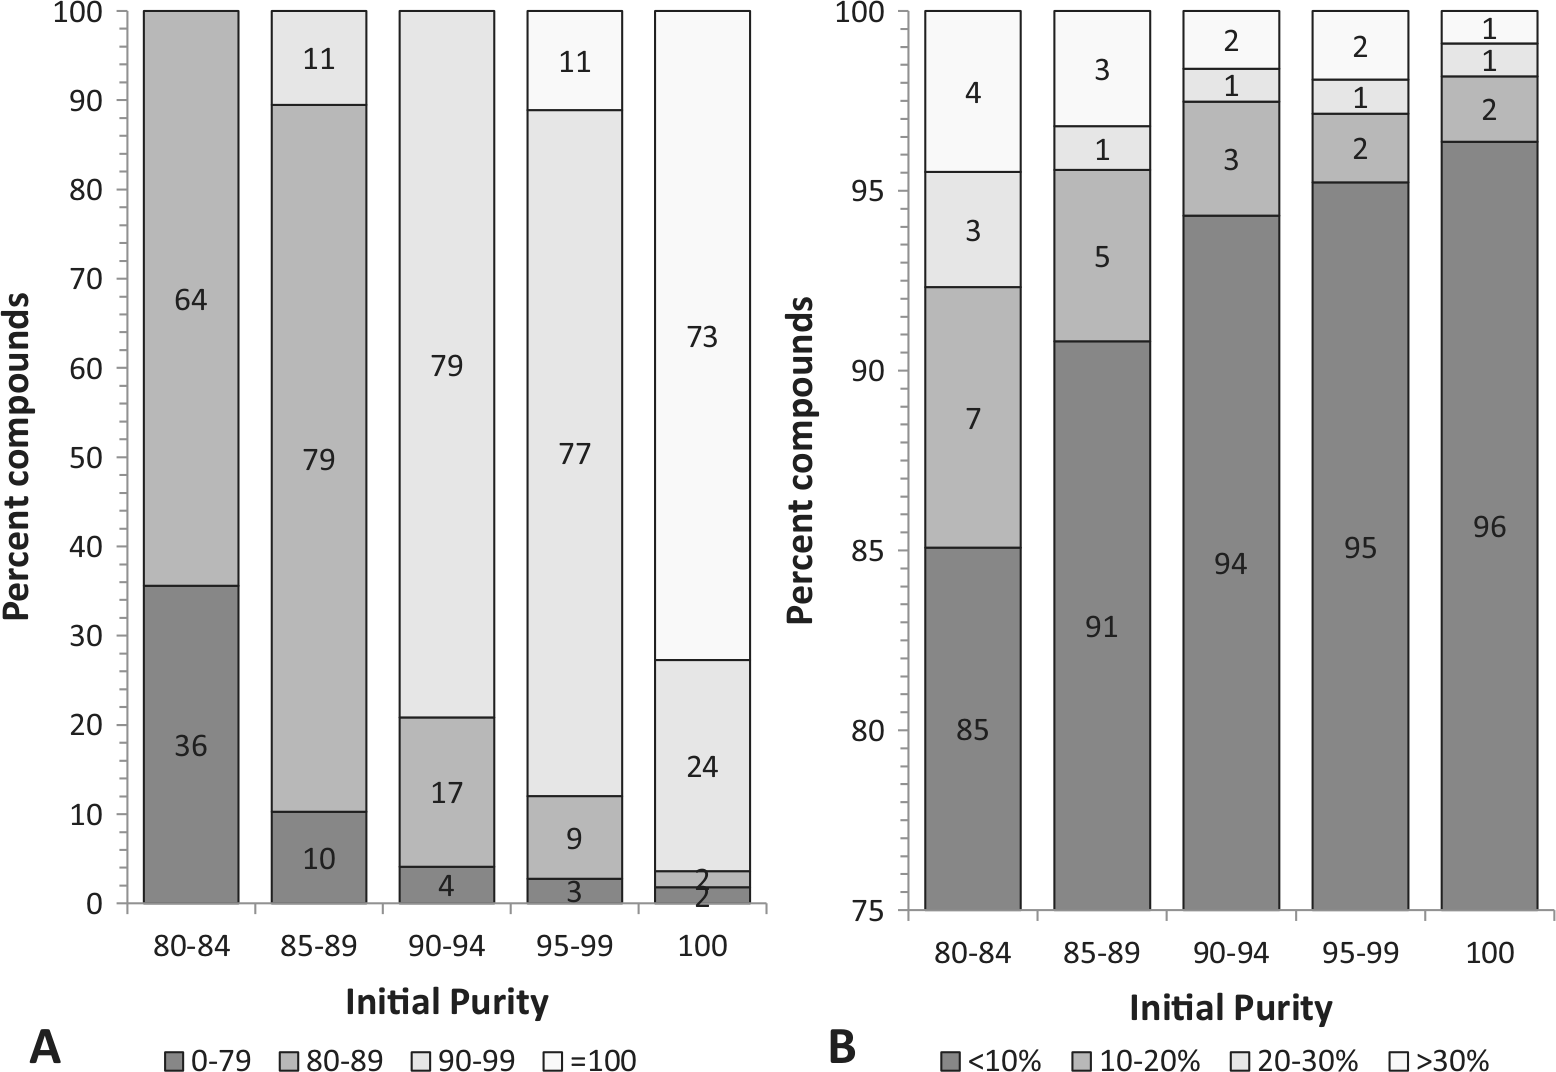
To strengthen the power of the model, study 1 and study 2 compound sets were analyzed together. The preliminary results from study 1 indicated that a total sample size of ~1500 would be adequate for the overall data analysis. Therefore, the number of samples selected for study 2 (1222) was such that the total number of samples analyzed was ~1500. Other laboratories deciding to undertake this type of analysis might want to perform a statistical sample-size analysis to create an experimental design. Figure 2A shows the relationship between final purity and initial purity. The x axis shows binned initial purities, and each bar represents the distribution of the final purity bins: the darker the color, the less pure the compounds are at the current time point. For example, of the compounds that were 100% pure at time 0, 9% of these are now <80% pure, 8% are 80% to 89% pure, 32% are 90% to 99% pure, and 51% are still 100% pure. Figure 2B shows the same data, represented as percentage degradation. In this panel, the darker the color, the less the compounds degraded. For example, of the compounds that were 100% pure at time 0, 82% degraded less than 10% (they are currently >90% pure), 8% degraded 10% to 20% (they are currently 80%–90% pure), 4% degraded 20% to 30%, and 5% degraded more than 30% (are currently less than 70% pure). The trend is quite clear in this representation: the more pure a solution is initially, the more likely it is to remain pure after storage and handling.
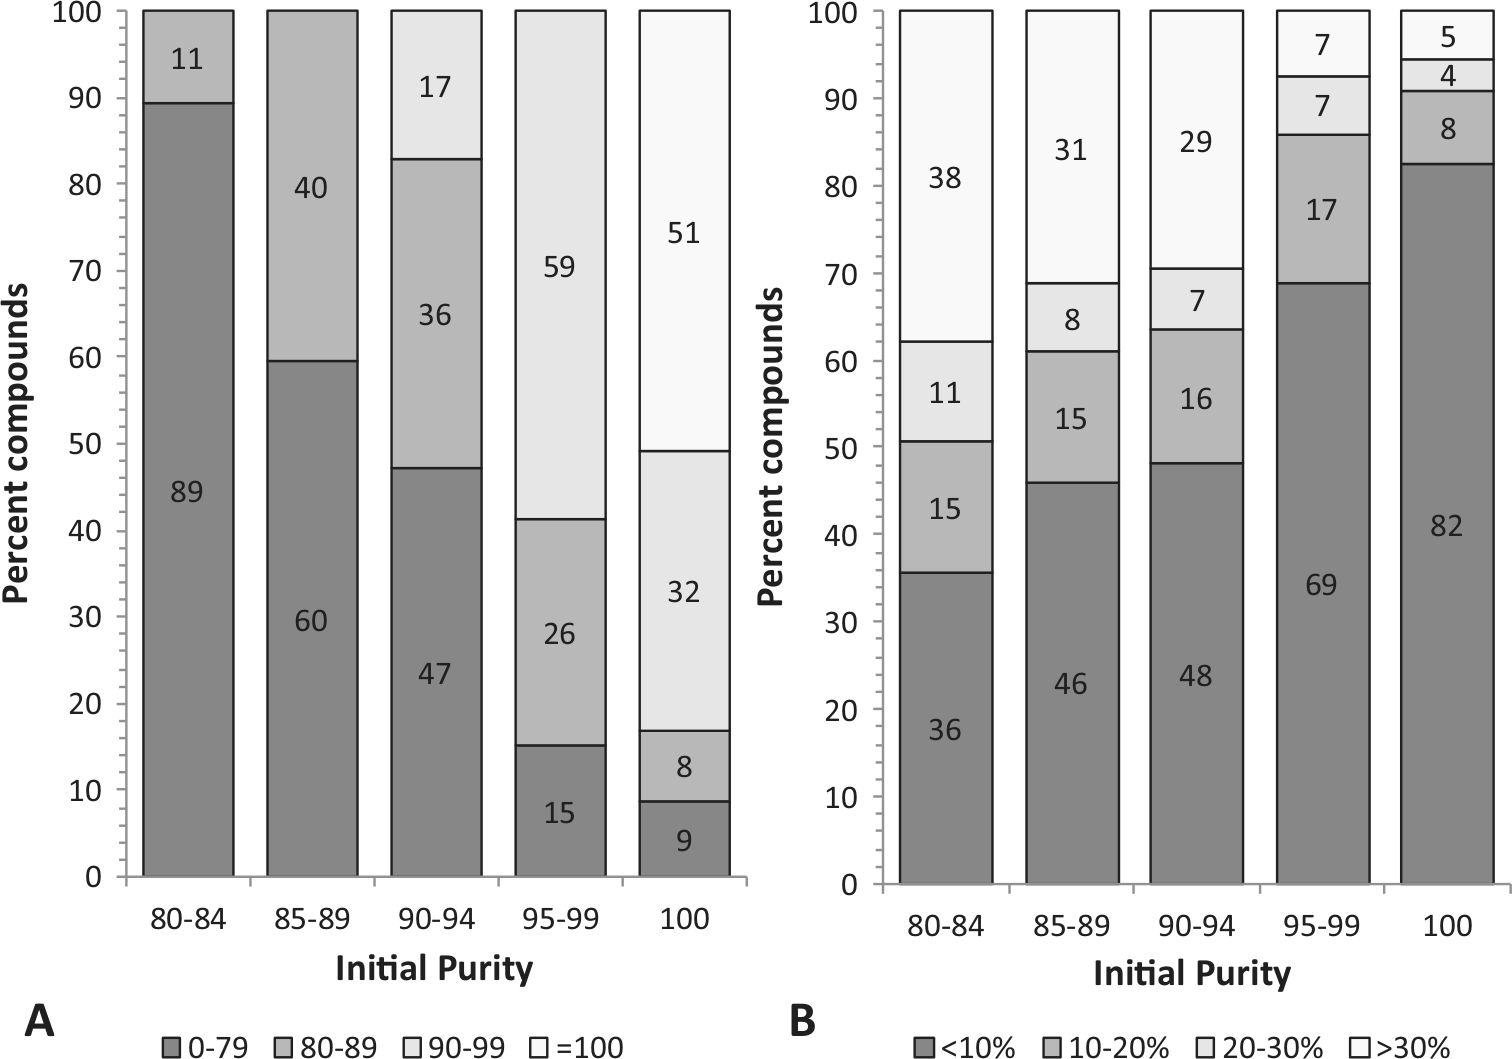
Distribution of study 1 compounds by initial and final purity. (
In the work of Zitha-Bovens et al., 11 the authors use a variety of methods to link compound qualities with the binary response of final purity >80% (Yes/No). Of the four methods in that report, we examined principal least square regression (PLSR) and random forest. Although commonly used and a reasonable tool, PLSR is not the most appropriate for binary-response data as the algorithm assumes a continuous response is supplied. We decided to use the random forest approach to determine the importance of each variable, followed by a logistic regression between the only important factor (initial purity) and the binary final purity response.
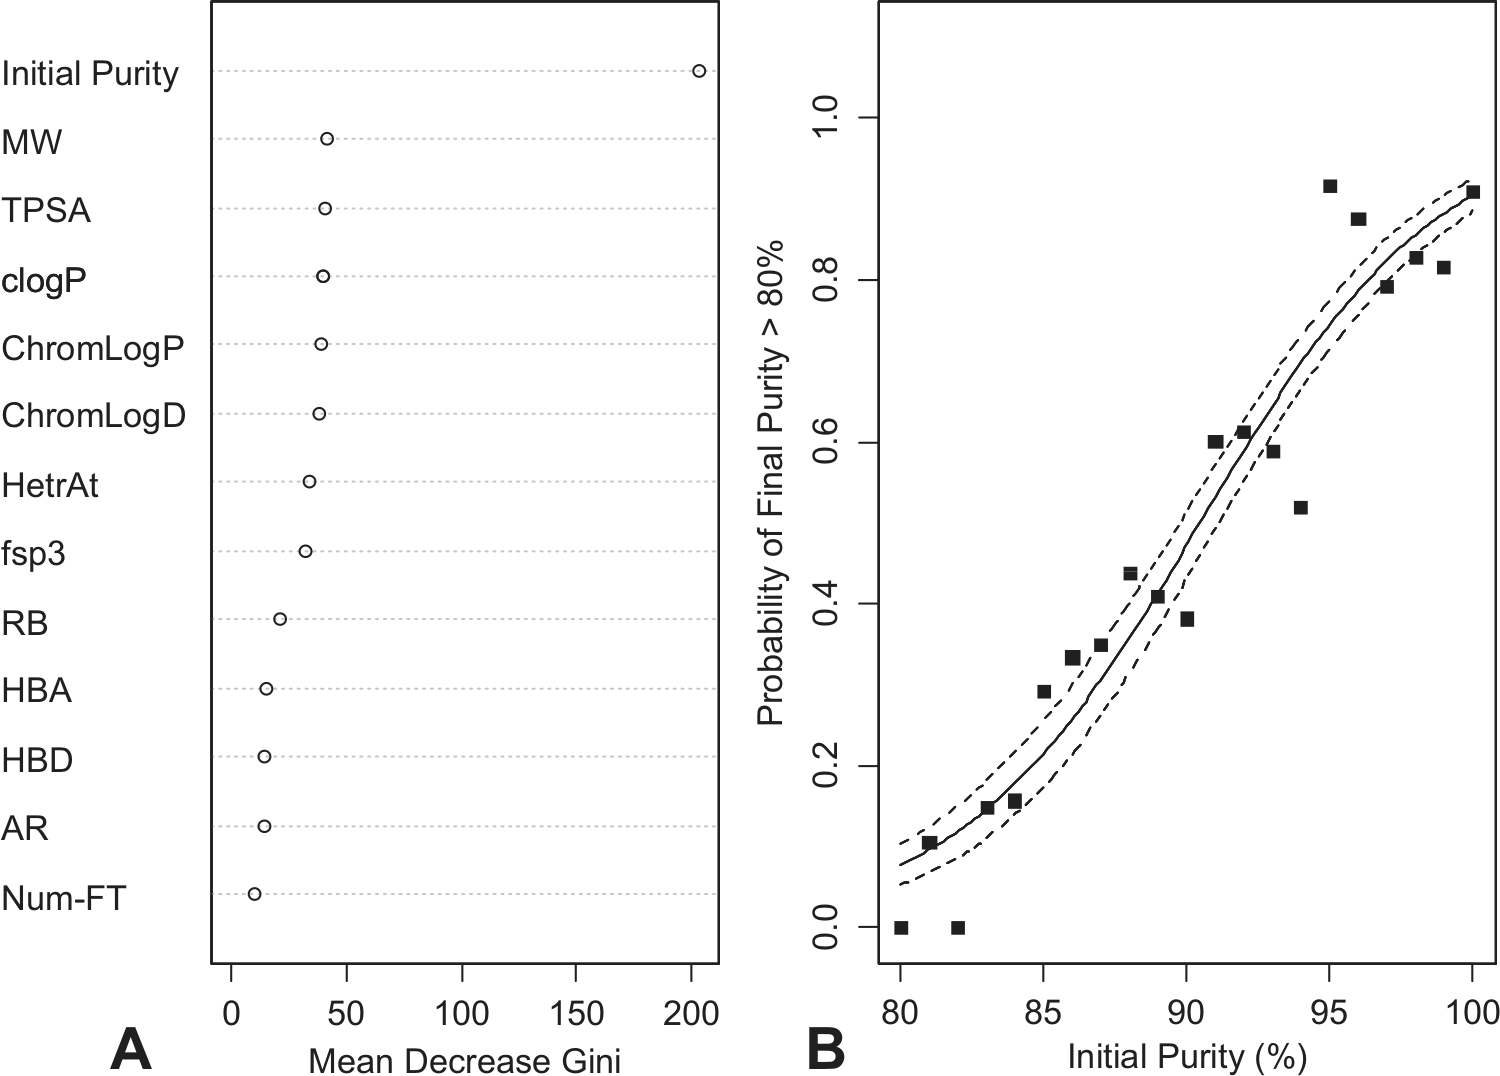
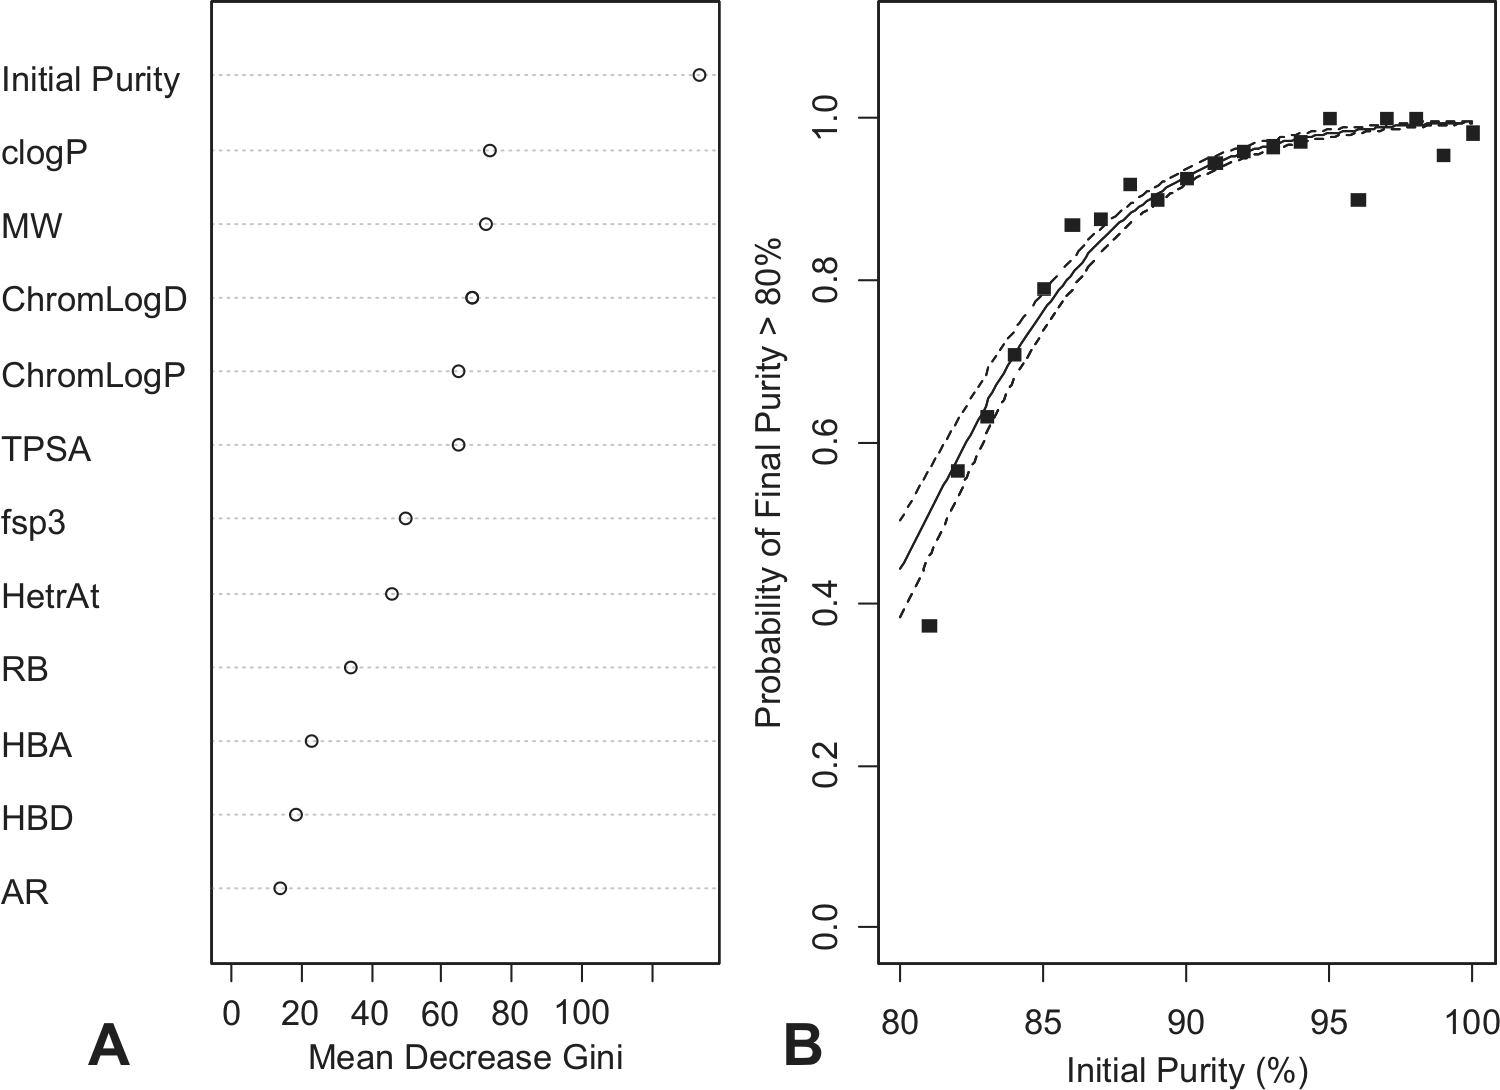
The random forest algorithm creates thousands of decision trees. Each tree is built by randomly selecting (random with replacement) rows of input data (compounds) and variables (physicochemical properties, freeze-thaw cycles/age, initial purity). Each decision tree is evaluated for quality and for the utility of the selected variables used in building that tree. The random forest algorithm evaluates each variable and orders them by importance as measured by their ability to predict the binary response (final purity >80% = yes/no). A second five-fold GCV algorithm was run to show that only the most important variable was necessary to make predictions. Figure 3A shows the random forest variability importance plot for studies 1 and 2. The x axis shows the mean reduction in the Gini index, which measures the purity of class assignments within each node of a decision tree. A smaller Gini index suggests that the decision tree is making better choices. The random forest algorithm tests each input variable and computes the mean reduction in the Gini index attributable to that variable. The variability importance plot of Figure 3A shows the mean reduction in the Gini index, in rank order, for all of the factors in the analysis.
(
The analysis strongly suggested that only one variable, initial purity, was statistically significant. The random forest prediction error was 22% for predicting both final purity ≤80% and final purity >80%. The prediction error rate reflects the strength of the variable-importance calculations. A secondary generalized cross-validation analysis was run that showed the need for only the most important variable to minimize prediction error for the random forest analysis.
Once determined that initial purity was the only factor of interest, a logistic regression model was fitted to relate the binary response to initial purity as shown in Figure 3B . One can use the logistic regression model to predict the probability that final purity >80% for any value of initial purity. For example, if the initial purity is 95% or higher, the probability that the final purity is >80% is 0.75.
One finding that might seem somewhat surprising is the low rank ordering of the number of freeze-thaw cycles variable. As noted, in study 1 and study 2, the number of freeze-thaw cycles and age of solutions are nonindependent and were investigated as a single variable. Therefore, our results seem to contradict previous studies that have shown that both freeze-thaw cycles and age of solutions had a significant effect on the stability of solutions.3,6,10 The number of freeze-thaw cycles has been related to compound instability only indirectly through the increased water content. 3 For the solutions investigated herein, the water content was determined to be fairly consistent. This is a plausible explanation for the low ranking of the importance of this variable on output stability. Time in storage was reported to be related to compound degradation in a nonlinear fashion, with most of the degradation occurring in the first 2 y in storage, with a minimal additional degradation occurring over the following 4 y in storage. This is again in line with our finding of a low importance of the number of freeze-thaw cycles/age variable because all compounds in this study had been in storage for at least 2 y.
Once the results from studies 1 and 2 were analyzed, a practical decision was made to transfer solutions with an initial purity ≥95%, which, according to the logistic-regression model, would provide at least 0.75 probability that the final purity was >80%. Of the initial set of ~125,000 legacy solutions, ~100,000 (82%) met this criterion and were transferred without any additional analytical QC. The ~25,000 remaining solutions were analyzed for multiple other factors, such as similar analogues already present in the automated stores, undesirable physicochemical properties, duplicate solutions already existing in other stores, and so forth. It was determined that only a small fraction (<1%) of these compounds were desired to be available in the automated long-term solution stores. Rather than QC the legacy solutions for the 1%, fresh solutions were created from solids for those compounds.
Study 3
Shortly following the 125,000 project, a new cherry-pick request for 30,000 solutions was received by the Sample Management group. These 30,000 solutions differed from the original study in that they had been made from solid and from the very beginning stored in the automated liquid stores. Given the very limited exposure to ambient factors and the much lower number of freeze-thaw cycles (only individual tubes get thawed, as opposed to entire 96-deep-well racks), these solutions were presumed to be of better quality at time current. Only 12% (3677) of these 30,000 solutions were 80% to 95% pure at time 0; the remaining 88% were >95% pure. A total of 3891 compounds from this set were sampled and analyzed for purity. The 3891 samples included all of the 3677 solutions that were 80% to 95% pure in the full set of 30,000 requested as well as 214 solutions that were >95% pure initially. Table 1 shows the distribution of initial purity within the 3891 sampling set. The same analysis was performed as described above for studies 1 and 2. Unfortunately, for this set of compounds, the age and number of freeze-thaw cycles for each individual tube were not available. Although these solutions were also up to 7 y old (same as study 1 and 2 solutions), it was known that the majority of the samples were subjected to a much lower number of freeze-thaw cycles and that the processing of individual tubes takes place through tube septa with minimal exposure to environmental factors. A subset of the samples in study 3 was measured for water content in DMSO. The %DMSO was found to be 96.3% ± 2.2%, which is also lower water content than the study 1 and 2 solutions, undoubtedly due to the more limited exposure to ambient humidity.
Of the 3891 solutions analyzed, 360 are now less than 80% pure. This represents 9.3% of the sample size, which is fully in line with the finding of Blaxill et al. 3 that “less than 10% had degraded over that time period” (6 y). The samples in study 3 came from the same automated stores as the samples in the Blaxill et al. study, 3 whereas the solutions in studies 1 and 2 were stored and processed under much less optimal conditions. Figure 4 shows the distribution of study 3 compounds by initial and final purity. The same trend noted in Figure 2 for studies 1 and 2 compounds is also present. Although the trend is the same for all three studies, the vastly different handling conditions and the difference in water content are very likely the reasons for the better overall stability seen in study 3. 10
Distribution of study 3 compounds by initial and final purity. (
For study 3 compounds, another random forest model was built to relate the physicochemical properties and initial purity with the binary response of final purity >80% (yes/no). A GCV method was used in conjunction with random forest to estimate the number of important variables required to predict the binary response. As seen for studies 1 and 2, the GCV analysis again strongly suggested that only one variable, initial purity, was statistically significant, as shown in Figure 5A . The random forest prediction error was about 30% for predicting both final purity ≤80% and final purity >80%. Figure 5B shows the logistic regression model fitted to relate the binary response to initial purity. For the data in studies 1 and 2, as seen in Figure 3 , solutions with an initial purity of at least 95% had a 0.75 probability that they would be at least 80% pure at time current. For study 3 samples, solutions with an initial purity of 85% or greater had a 0.75 probability of remaining >80% pure in storage, as shown in Figure 5 . Solutions with an initial purity of 95% or greater in study 3 had a probability of almost 1.0 to remain >80% pure in storage.
(
The results in this report showed that, given set storage conditions, the main factor that influenced the stability of compounds in solution was initial purity. None of the calculated physicochemical properties investigated appeared to be associated with final purity. The higher the initial purity of a solution, the likelier it was to remain stable in storage. A reasonable question one might ask is: What is an ideal purity cutoff when a solution is first made? In reality, there isn’t one; it will depend on the risk one is willing to take versus the number of compounds that will be rejected through the purity cutoff and the capacity for purity measurement. And, as noted in multiple previous studies, it will be highly dependent on the storage and handling conditions chosen for the solutions.
In our laboratory, we used the logistic regression model to provide guidance in determining a reasonable cutoff for initial compound purity that will dictate the number of samples that will undergo further QC. The strategy we implemented remeasures the purity of compounds that had an initial purity less than 95% and that were requested for follow-up studies. All compounds measured to be less than 80% purity at time current are removed from the follow-up request. All compounds with a measured initial purity of ≥95% and a measured current purity of ≥80% are included. Other approaches could also be envisioned. For example, a lower initial purity cutoff can be used (even less than 80%), and compounds close to the threshold are either maintained for shorter time periods or rechecked for purity at regular intervals or upon request.
Footnotes
Acknowledgements
We would like to thank John Russell for his help with developing a process to allow the automated transfer of solutions from the 96-deep-well racks into tubes. We are also grateful to Stephen Besley and Zoe Blaxill for their input and feedback in implementing the purity check strategy.
Declaration of Conflicting Interests
The authors declared no potential conflicts of interest with respect to the research, authorship, and/or publication of this article.
Funding
The authors received no financial support for the research, authorship, and/or publication of this article.