
Abstract
An explanation for randomly occurring spikes on microplates in fluorescence-based assays employing shorter-wavelength readouts is presented. It is demonstrated that lint originating from standard (white cotton) lab coats is most likely to be responsible for such artifacts in assays applying wavelengths at 380 nm excitation and 450 nm emission. The fluorescence properties of this lint are discussed and compared with those of optical brighteners. An alternative to the use of cotton-based lab coats is presented, which led to a reduction of spikes in a high-throughput screening campaign by 90%.
There are many laboratories developing assays involving different ranges of wavelengths depending on the target under study.
The projects they serve vary and hence so do the type and format of assays. Very often, the readouts of these assays are optical ones (e.g., fluorescence-based measurements).
False-positives due to compound interference— especially at shorter wavelengths—are a well-known phenomenon in high-throughput screening (HTS). 1 The wavelengths used in most cases can be chosen in a way that compound interference is minimized. Longer wavelengths (“red region” >500 nm) are useful here. 2
However, in some cases, the use of shorter wavelengths cannot be avoided, for example, when coumarin derivatives are used in protease assays. This needs a certain amount of attention, not only with regard to compound interference.
Here we show examples of how lint shed from standard lab coats interferes with fluorescence-based assays run at about 380 nm excitation and emission at about 450 nm.
We describe our findings during assay development of fluorescence-based assays at these wavelengths with respect to spikes, which were found to be abundant under standard lab conditions. We could track most of the spikes back to lint originating from standard white cotton lab coats. This kind of lab coat is used worldwide, and the coats are likely to be cleaned according to common industry cleaning procedures using detergents and brighteners. The latter seem to interfere with the assay signals in the wavelength region mentioned above.
Materials and Methods
Measurements were performed on an Envision 2104 from Perkin Elmer (Waltham, MA). The fluorescence measurements were performed at ex 380 nm, em 450 nm, five flashes per well, 1 s per well. For the three-dimensional (3D) spectrum, the monochromator function of this instrument was used.
For the tests, empty microplates were used, which had been exposed to different types of lab coats in order to collect lint from them (see the text below). Microplates were from Greiner (384 wells, black, small volume).
Standard lab coats were rented from Bardusch and cleaned according to standard industry-grade washing procedures. Disposable plastic lab coats were from different vendors (see the text below).
Results and Discussion
During the assay development of two different assays formats, both involving excitation wavelengths at about 380 nm and emission wavelengths at about 450 nm, spikes (i.e., strong and unexpected individual fluorescence signals) were found regularly when running the assays in microplates. One of the assays was based on fluorescence intensity and the other on fluorescence lifetime. In both cases, about 5 to 10 randomly distributed spikes (signals up to 8 times higher than a normal assay signal) were found on each 384-well plate. This would have led to 1% to 2% of false-positives in HTS applying these assays.
The occurrence of such spikes was not dependent on the brand or type of the microplates. Moreover, it was not dependent on the laboratory: Even a lab at a different company (working on the same assay) reported such spikes.
Because there were no alternatives regarding the choice of wavelengths, the question arose as to the origin of these artifacts, and options for their effective prevention were considered. To spot the source of the spikes, a series of experiments was conducted using empty microplates. The use of empty microplates clearly demonstrates and overemphasizes the effects.
Figure 1 shows the situation found in which a microplate was taken out of a closed bag and measured immediately at ex 380/em 450 nm. Here, no spikes were found: All of the signals were in the range of less than 70 RFU.
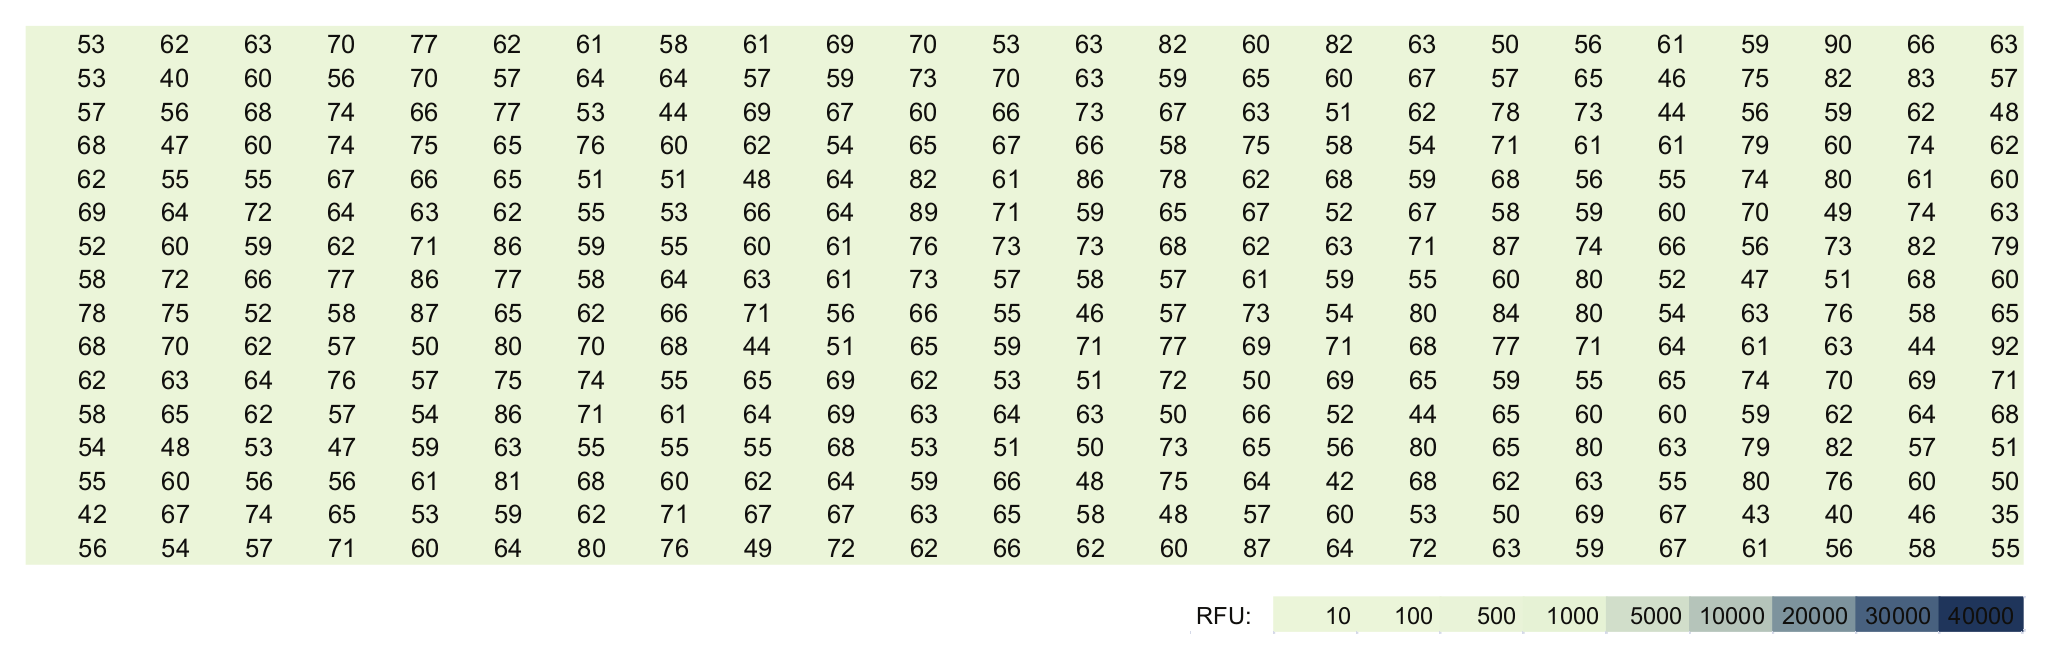
Empty microplate, freshly taken out of a closed bag. Fluorescence readout at 380/450 nm ex/em. The medium signals were less than 70 RFU.
Figure 2 shows measurements (ex 380 nm/em 450 nm) of the same plate after simply moving it about for 2 min freely within the lab. We obtained 13 spikes (framed in the picture) that had a signal larger than twofold of the base signal. Some spikes were found up to 100-fold of the base signal (colored spots in the picture). Repetitions of this type of test on different days showed similar results. Microplates taken out of bags, which had been open for a while, showed similar results. Some kind of dust—free floating within the lab—must have been the reason for these spikes.
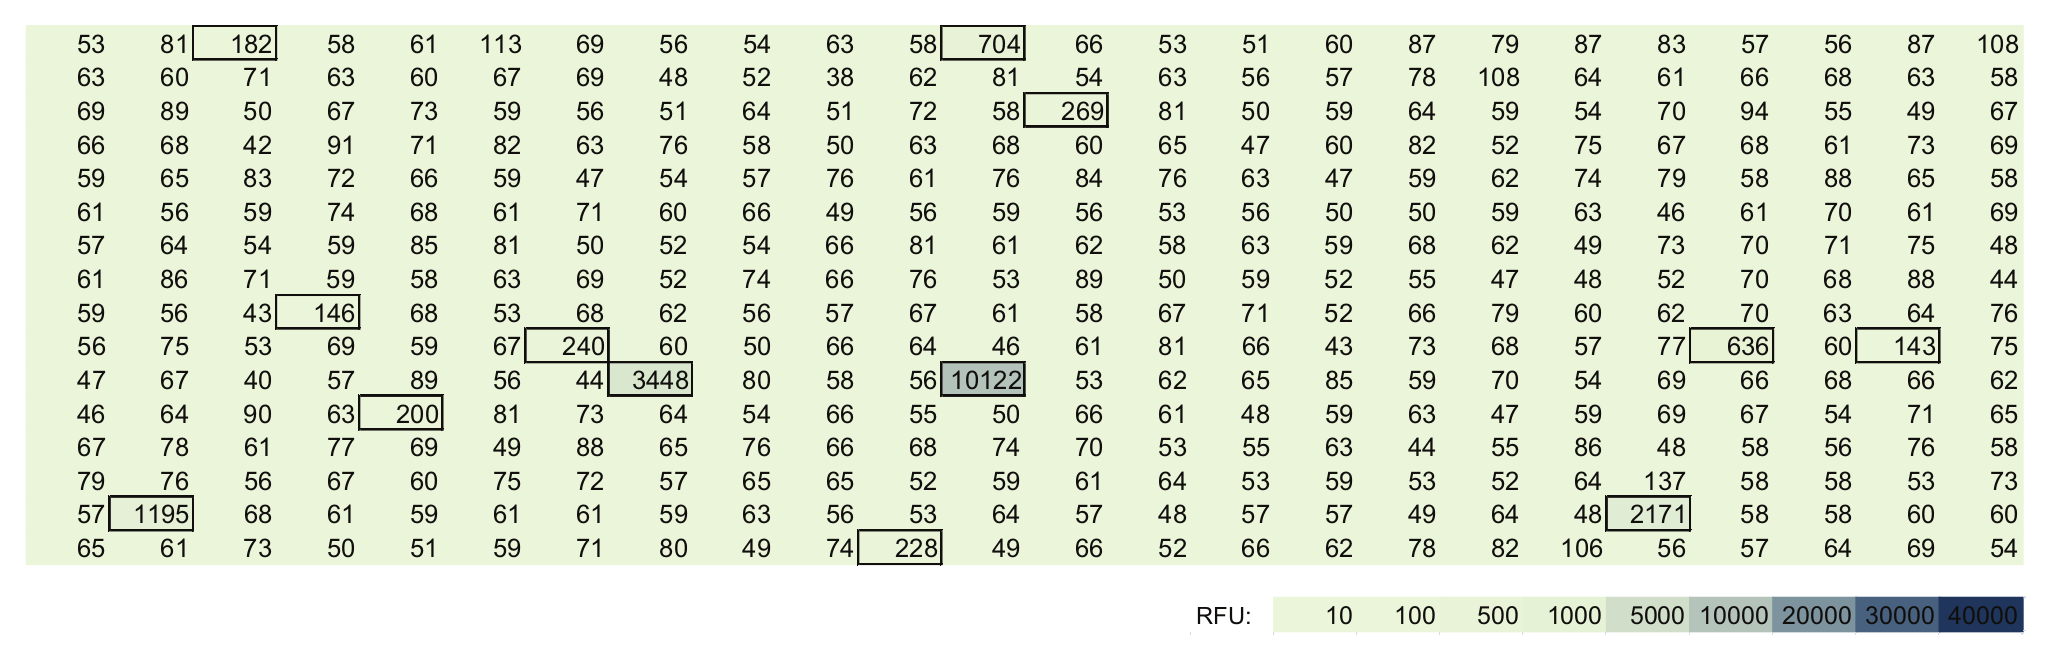
Measurement of the same plate after moving it for 2 min in free laboratory air. Spikes up to 10 000 RFU were observed here.
Apart from dust particles originating, for example, from the air conditioning system, a different reason could be that those particles might be the result of lint arising from abrasion and “wear and tear” of lab coats during their use in daily work. To test this hypothesis and to find out the origin of the dust particles, several types of lab coats were tested for lint arising from abrasion.
A microplate was sealed partly, leaving only four columns open for access. The plate then was vigorously rubbed against a lab coat for 3 to 5 s. The open area was sealed, a new area was opened, and it was rubbed against a different coat. Figure 3 compares the rate of spikes obtained from a standard freshly washed cotton lab coat to different brands of disposable plastic coats. All disposable coats were made from plastic materials, and none of these showed significant spikes as the signals were in the range of 70 RFU. There are a few mini-spikes visible, but they were presumably caused by contamination via lab air during the de-sealing and sealing procedures. However, rubbing the plate against a white cotton coat resulted in drastic spikes in all 64 wells. All wells showed signals at least 70-fold above the base level of unexposed wells. Some of them were up to 400-fold of the base level of the untreated wells. Here, the rubbing test had captured abrasions from the surface of this type of lab coat. When such plates were measured at ex 485/em 520, no such high spikes were observed. At these wavelengths, the rubbing test revealed a maximum of 10-fold of base signal in all wells exposed to cotton lab coats (data not shown). When a reusable blue cleanroom coat was tested with the rubbing method, the body part of this coat revealed the same results as the disposable plastic coats showed: no significant spikes. Interestingly, the white wristband of this coat caused spikes in the same range shown by the cotton coats.
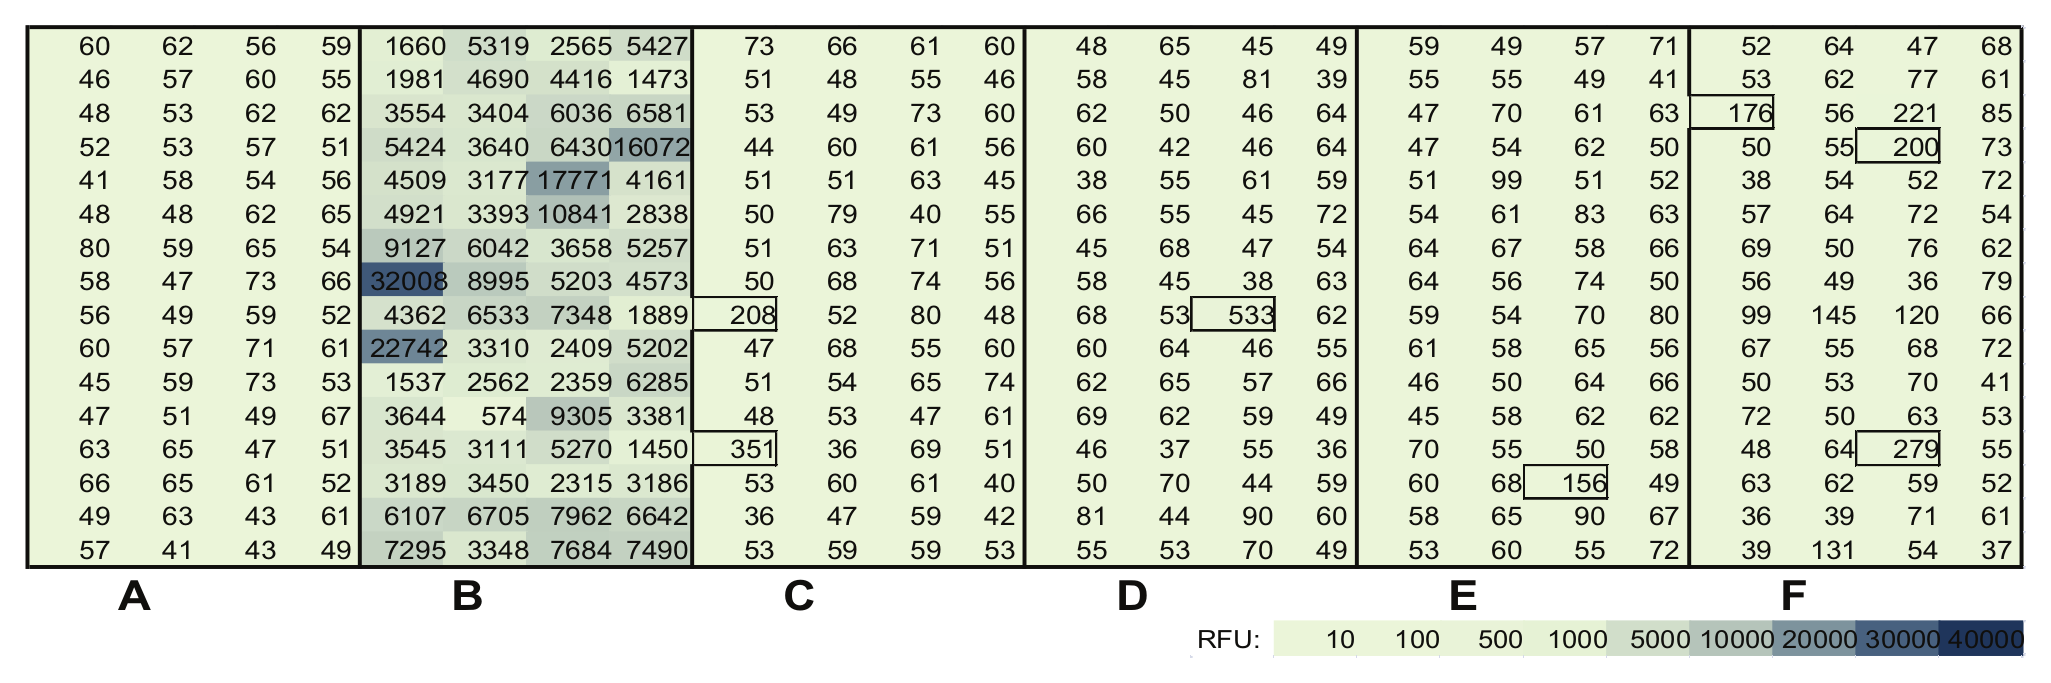
An empty microplate partially exposed to different types of lab coats by extensively rubbing the exposed wells in the material of the coats for 3 to 5 s. (
To analyze the spectral properties of these rubbing-derived lint samples, spectra were taken from wells, which showed high signals in the tests mentioned above. All spectra were nearly identical. An example of a 3D spectrum is shown in Figure 4 . At an excitation of about 390 nm, the fluorescence emission peak around 435 nm can be seen as well as the low shoulder up to the 560 nm range. These emission and excitation characteristics are in the same range, where optical brighteners normally operate. 3
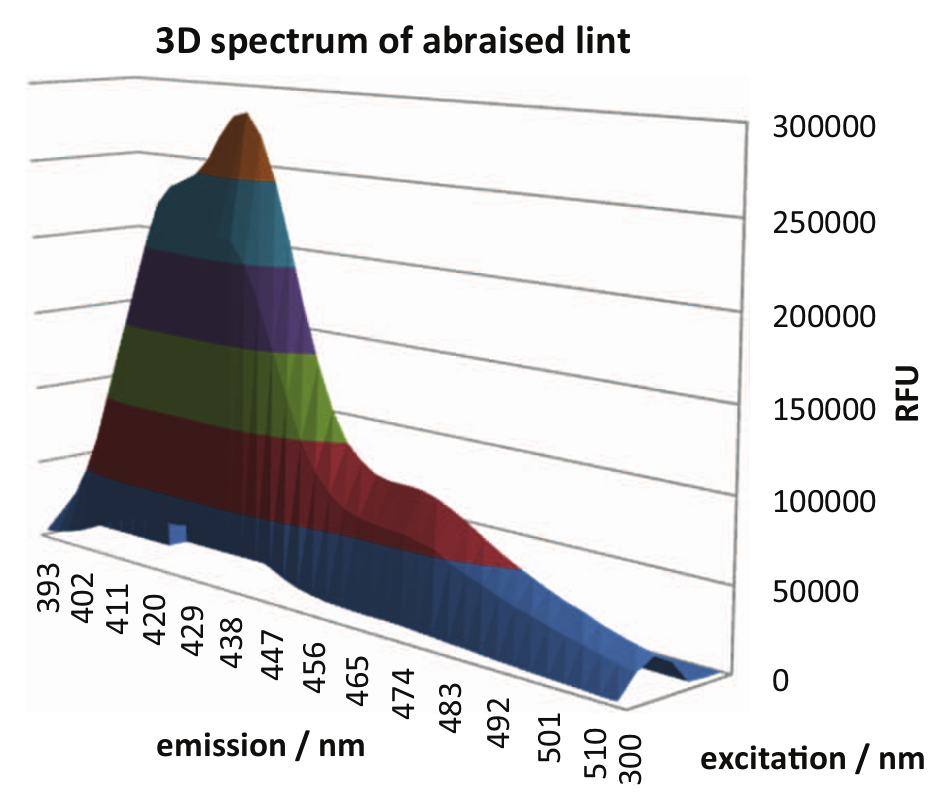
Three-dimensional spectrum of abrasions from a white cotton lab coat captured in a well of a microplate. Excitation from 300 to 475 nm, emission from 393 to 513 nm.
Based on this good fit of the regions of wavelengths, we concluded that the abrasions were likely to consist of optical brighteners, which are very often involved as laundry additives in the cleaning process of reusable cotton white working clothing.
As a consequence of these findings, employees and visitors in the labs were required to wear plastic disposable coats during the assay development period and, more importantly, throughout the HTS campaign. This dress code was started 3 wk prior to the start of any work on the assays and the HTS campaign. The change of coats could not prevent all spikes but did reduce the amount of spikes down to one to two per two microplates in the HTS campaign. Compared with the situation without such preventative measures (5–10 spikes per plate if cotton lab coats would have been worn), this was a significant improvement: More than 90% reduction of spikes could be achieved.
Footnotes
Declaration of Conflicting Interests
The authors declared no potential conflicts of interest with respect to the research, authorship, and/or publication of this article.
Funding
The authors received no financial support for the research, authorship, and/or publication of this article.