
Abstract
Loss of normal cell cycle regulation is a hallmark of human cancer. Cyclin-dependent kinases (CDKs) are key regulators of the cell cycle and have been actively pursued as promising therapeutic targets. Likewise, members of the CDK family are functionally related to transcriptional modulation, a molecular pathway suitable for therapeutic intervention. We used a set of 2500 compounds in the U2OS cell line to evaluate its effect in the cell division process. Interestingly, out of this analysis, we identified a subpopulation of compounds that are able to inhibit RNA polymerase activity, thus interfering with gene transcription processes. After this finding, we developed, validated, and fully automated a multiparameter high-content imaging (HCI) assay to measure phosphorylation of the RNA polymerase II carboxyl terminal domain (pCTD). Simultaneously, we measured both the DNA content and cell proliferation index in the treated cells. The linear regression analysis comparing the IC50 for pCTD and the 4N EC50 for DNA content or IC50 for cell proliferation showed an excellent agreement (r2 = 0.84 and r2 = 0.94, respectively). Our results confirm that this method allows discriminating between cell cycle and transcription inhibition and confirms HCI as a powerful technology for the identification of compounds with an effective and selective pathway phenotype.
Introduction
Cyclin-dependent kinases (CDKs) first emerged as the key regulators of two major transition points within the cell cycle, the initiation of the DNA synthesis (S) phase and the mitosis onset. 1 This regulation is executed by an orchestrated interaction with a family of proteins designated as cyclins. 2 The discovery and characterization of these regulators rapidly translated into the search of targeted therapies to block the cell cycle. 3
More recently, a number of additional CDKs and cyclins have been associated with diverse roles such as neuronal migration and differentiation, RNA splicing, and as part of conserved components of the RNA pol II transcriptional machinery.4–6
The dual role of Cdk7 in cell cycle control and transcriptional regulation has been well documented. In association with the general transcription factor TFIIH, the Cdk7/cyclin H complex plays a critical role in the promotion of transcription by regulating the phosphorylation of the large subunit of the RNA polymerase II carboxyl terminal domain. 7 In addition, Cdk8 (in complex with cyclin C) and Cdk9, together with closely related cyclins T1, T2a, and T2b or cyclin K, form the transcription elongation factor b (P-TEFb), which also regulates the transcriptional machinery.8,9
The boundaries between regulation of the cell cycle and inhibition of gene transcription are very subtle, as often compounds show dual activity, or the effect on one or another pathway is dose dependent. More precise experimental approaches are therefore needed to dissect whether potential therapeutic compounds interfere with cell cycle or gene transcription in a cell environment. In this context, high-content imaging (HCI) offers a valuable alternative to the traditional single-readout cell-based assays as the ability to multiplex divergent immunofluorescence assays results in additional data to link the interaction of the molecule with the target and the resulting phenotype. This technology might even prevent the advancement of molecules with undesirable off-target effects, by showing a phenotype that is not linked with the target for which they have been synthesized. 10
Although in recent years, several methods have been developed to precisely address which are the relevant cell cycle targets and how their inhibition results in specific cellular phenotypes,11,12 there are no reported biological screenings to monitor compound effect on transcription inhibition. In the present study, we propose a new multiplexed cell-based assay to identify compounds involved in the inhibition of transcription, by measuring biological characteristics such as DNA content and cell number along with the phosphorylation of the carboxyl terminal domain of the large units of RNA polymerase II. This a very robust assay and has been fully validated and used for the screening of a library of compounds, together with commercially available standards used as reference. The profiles generated in this assay allowed us to select compounds acting as inhibitors of gene transcription and monitor the most suitable cellular readouts.
Materials and Methods
Reagents
DMSO (SU0154; Scharlab, Barcelona, Spain), ρ-formaldehyde (P6148; Sigma, St. Louis, MO), Prefer (402; Anatech, Battle Creeke, MI), mouse anti-H5 (CTD ser2) antibody (MMS-129R; Covance, Indianapolis, IN), anti–phospho-histone H1 (Thr153) (3AK2600507P; Open Biosystems, Huntsville, AL), rabbit anti–phospho-histone H3 (ser10) (06-570; Upstate-Millipore, Billerica, MA), mouse anti-Rb (ser780) (558385; BD Pharmingen, San Diego, CA), goat anti-mouse IgM Alexa Fluor 488 (A21042; Invitrogen, Carlsbad, CA), goat anti-mouse IgG Alexa Fluor 488 (A11017; Invitrogen), goat anti-rabbit IgG Alexa Fluor 488 (A11008; Invitrogen), skimmed milk (232100 [0032-17]; Difco, Franklin Lakes, NJ), bovine serum albumin (RPN412V; Amersham, Little Chalfont, UK), Ribonuclease A (R6513; Sigma), Triton X-100 (T9284; Sigma), propidium iodide (PI; P3566; Invitrogen), phosphate-buffered saline (PBS) 10× (pH 7.5; 70011-036; Gibco, Carlsbad, CA), 96-well polylysine Biocoat plates (356640; Becton Dickinson, Franklin Lakes, NJ), top seal for 96-well microplates (6005185; PerkinElmer, Waltham, MA), 96-well polypropylene plates (P7116-1CS; NUNC, Roskilde, Denmark), DRB (5,6-dichlorobenzimidazole 1-β-D-ribofuranoside; D-1916; Sigma), and α-amanitin (A-2263; Sigma) were used. Flavopiridol, RO-3306, actinomycin-D, PD0332991, tozasertib, SNS-032, AZD1152, MLN8054, vemurafenib, ON-01910Na, BM1-1026, and roscovitine were synthesized in house.
Cell Culture and Compound Treatments
HeLa (CCL2), U2OS (HTB96), Calu-6 (HTB56), and COLO 205 (CCL222) cell lines were obtained from American Type Culture Collection (ATCC, Manassas, VA) and grown and maintained according to ATCC guidelines. Cells were plated in the corresponding culture media into 96-well poly-D-lysine–coated plates 18 to 25 h prior to compound dosing and incubated at 37 °C/5%CO2. For dose-response titration, compounds were prepared at a 10-point concentration in complete growth media containing 0.75% DMSO. Three-fold serial dilutions were carried out in 96-well plates starting from 20 µM (final concentration in the assay). Then, 50 µL of compound solution was transferred from a dilution plate onto a cell plate containing 100 µL of conditioned media. Final concentration of DMSO did not exceed 0.25% in the assay.
Immunofluorescence Assays
To monitor histone phosphorylation, cells were dosed with compounds and incubated for 1 h under standard conditions, then fixed with 3.7% paraformaldehyde (PFA) for 45 min and permeated with cold methanol for 15 min, washed with PBS twice, and treated with 0.1% Triton X-100 in PBS for 10 min. After washing with PBS, cells were treated with anti–phospho-histone H1 (Thr153) or anti–phospho-histone H3 (ser10) antibodies in PBS containing 1% skim milk and incubated at 4 °C overnight. Plates were washed with PBS and then treated with goat anti-rabbit IgG Alexa Fluor 488 (Invitrogen) for 1 h at room temperature in the dark. Finally, DNA staining with PI containing 50 µg/mL ribonuclease A was carried out and kept at room temperature for 2 h prior to being read and analyzed in the Acumen Explorer instrument and software (TTP Labtech, Cambridge, UK).
DNA content multiplexing assays included RNApol II (pCTDser2), retinoblastoma (pRbser780), and mitotic index (pHH3ser10). Cells were treated and incubated with compounds for 24 h at 37 °C/5%CO2 and then fixed with Prefer (Anatech) for 30 min at room temperature, followed by permeation with 0.1% Triton X-100 in PBS for 15 min. After being washed with PBS, cells were blocked with 1% BSA in PBS to be ready for labeling. Primary antibodies were prepared at 1:1000 or 1:2000 as for pRb in 1% BSA in PBS and added to cells after removing the blocking solution and subsequently incubated overnight at 4 °C with a gentle shake. Finally, after washing the primary antibody with PBS, cells were treated with 1:1000 Alexa Fluor 488–conjugated secondary antibody. Plates were incubated for 1 h at room temperature in the dark. The last step was DNA staining with 1.4 µg/mL PI solution containing 50 µg/mL ribonuclease A. Cells were treated for 2 h at room temperature before reading and image analysis in an Acumen Explorer (TTP Labtech).
Cell Cycle Analysis by Flow Cytometry
Cells (106) were seeded into p100 dishes 18 to 24 h prior to compound treatment. Then, cells were dosed with compounds after removing conditioned media. Next, 10 mL of 6 µM flavopiridol in culture media containing 0.1% DMSO was added to cells and then incubated for 24 h at 37 °C/5%CO2. After treatment, culture media and cells were recovered and centrifuged at 1200 rpm. Pellets were washed with cold PBS and fixed with ethanol 70%. After 30 min of fixation, cells were washed with phosphate-citrate buffer and treated with 1 µL ribonuclease A to be finally stained with 0.5 mL PI (50 µg/mL) for 1 h in the dark. Samples were processed in a FACSCalibur cytometer (BD Biosciences, Franklin Lakes, NJ), and data obtained were analyzed using Modfit or FlowJo software (Verity Software House, Topsham, ME, and TreeStar Inc., Ashland, OR, respectively).
Data Analysis and Statistical Analysis
Cell population, as analyzed in the Acumen Explorer (TTP Labtech), was sorted as % positive cells after labeling with Alexa Fluor 488 and % G1-S or G2M after DNA content quantization. For target inhibition, percentage of activity or inhibition was calculated as follows:

with % inhibition = 100 – % activity.
Different cell profiles for target inhibition (% inhibition) and DNA content (% subpopulation) were analyzed with ActivityBase software (IDBS, Guildford, UK) to obtain IC50/EC50 values. The four-parameter nonlinear logistic equation (four-parameter logistic concentration-response curve) used for this purpose was

Assay performance was routinely addressed in terms of signal window (SW) and Z′ factor (Z′).13,14
All assays were validated for plate uniformity and potency reproducibility in accordance with the published Eli Lilly–National Institutes of Health (NIH) Chemical Genomics Center Guidelines for assay enablement and statistical validation (http://assay.nih.gov/assay/index.php/Table_of_Contents#Assay_Validation)
Data mining and correlation analysis were carried out using Spotfire (TIBCO, Palo Alto, CA).
Results and Discussion
Effect of Compound Treatment on DNA Content in U2OS Cells
We used a chemical library of 2568 compounds directed against Cdks and tested the ability to interfere with cell division by measuring the percentage of 4N DNA content in U2OS cells. Data for each single compound at the concentration promoting the maximum percentage of 4N stimulation are represented in a scatter plot ( Fig. 1A ). The analysis of the data revealed three different subpopulations: Compounds at the bottom of the graph were either inactive or presented a very moderate effect on the accumulation of 2N cells, suggesting either no effect on DNA content or a phenotype associated with G1-S blockage. Compounds at the very top reached a percentage of 4N accumulation close or above 90%, in agreement with molecules targeting the cell cycle after DNA replication.
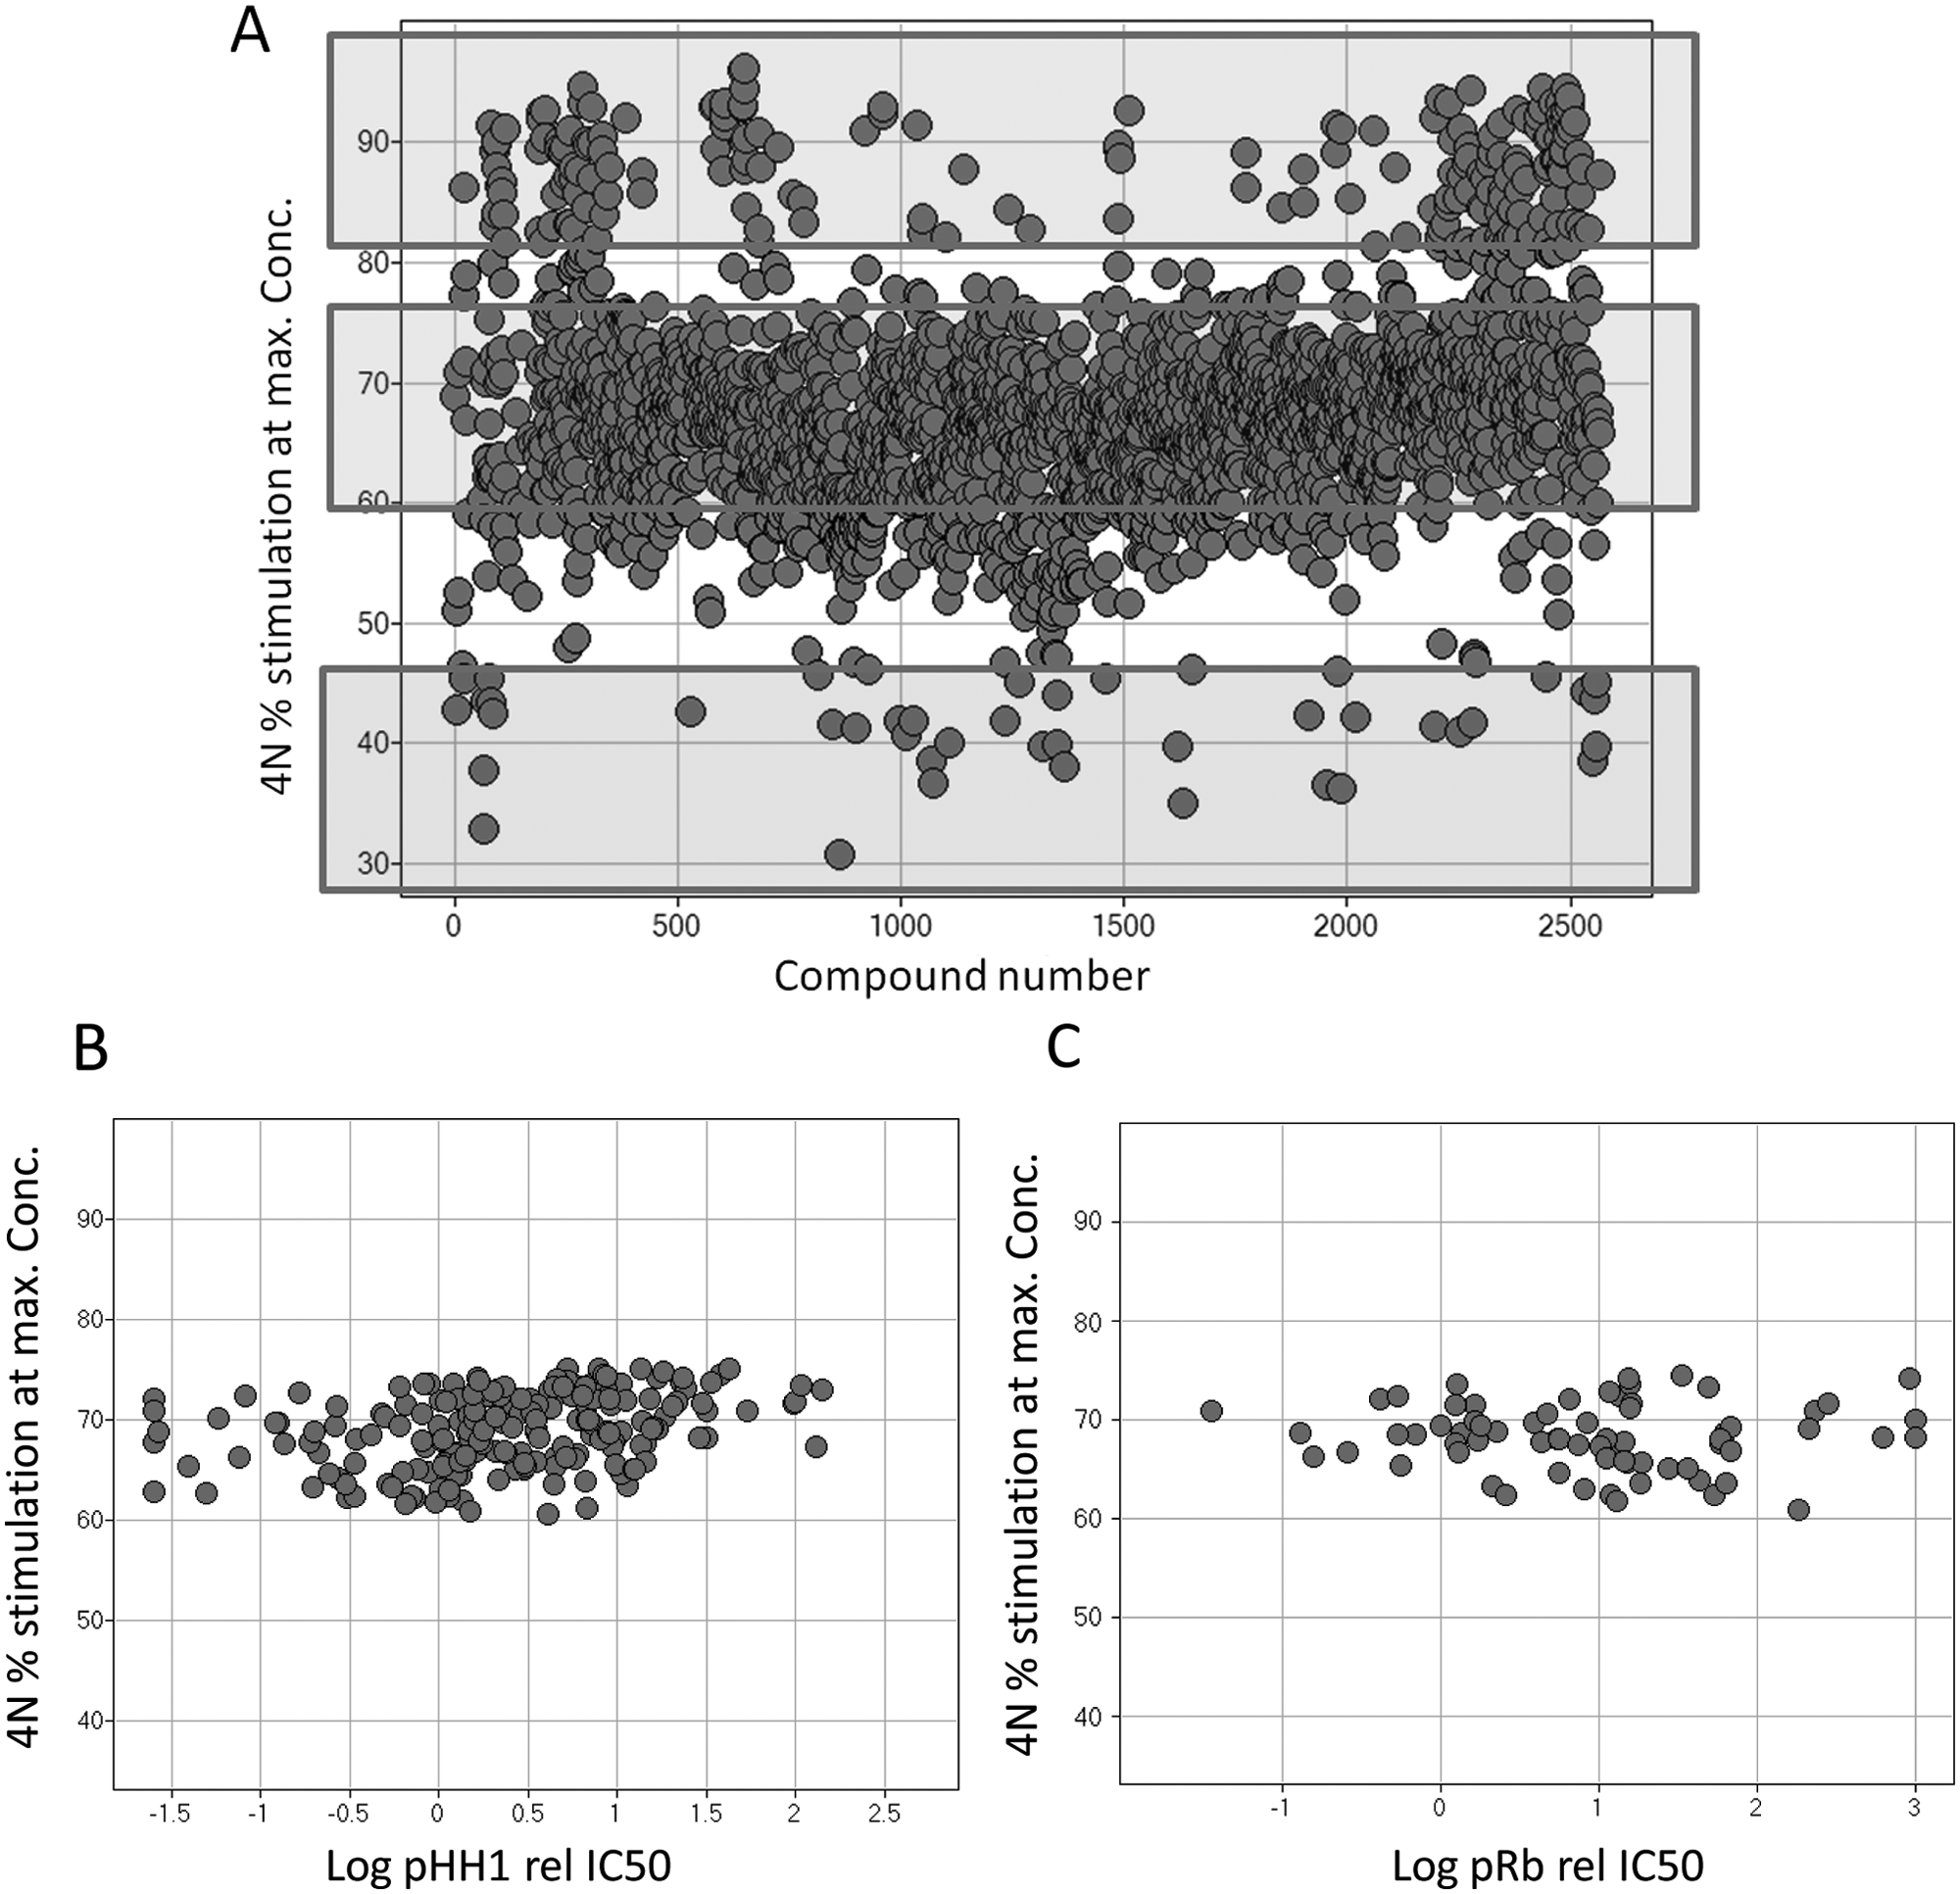
Effect of compound treatment on the percentage of 4N DNA content. (
Interestingly, the largest set of compounds within the library showed a unique phenotype characterized by their ability to increase the 4N cell population, although this increment only reached 60% to 75% of accumulation. These data suggested that this set of compounds (designated as subG2M) could be acting through a cell cycle–independent mechanism and prompted us to analyze them further.
First, we ruled out any association of the activity of the subG2M compound population with specific and well-described cellular markers for either G2M or G1S arrest. For that purpose, a random subset of the subG2M collection was monitored for the ability to inhibit the phosphorylation of histone H1 (pHH1) in the Calu-6 cell line or for the ability to inhibit the phosphorylation of retinoblastoma (pRb) in COLO 205 cells in a dose-dependent manner. The IC50s generated for pHH1 and pRb were plotted against the percentage of 4N stimulation ( Fig. 1B , C ) and the results presented no correlation, ruling out that the ability of the subG2M compound population to modulate DNA content could be mediated by a G1S or G2M cell cycle arrest.
Inhibition of Transcription Is Associated with the SubG2M Phenotype
We hypothesized that the phenotype induced by the subG2M compound population could be associated with their ability to interfere with gene transcription by inhibiting the phosphorylation of the carboxyl terminal domain of the large subunit of RNA polymerase II (pCTD). Should that be the case, we were expecting to find inhibitory activity only in compounds selected from this subpopulation and not from the lower or upper cluster of compounds analyzed in Figure 1A .
Compound 1, selected from the upper cluster, exhibited a dose-dependent accumulation of the 4N population ( Fig. 2A ), which was associated with complete inhibition of pHH1, but neither pRb nor pCTD inhibition was observed ( Fig. 2B ). On the opposite side, compound 4 presented a high percentage of 2N accumulation ( Fig. 2G ), reaching complete inhibition of pRb only ( Fig. 2H ). However, a set of selected compounds of the subG2M population, either promiscuous or selective versus cell cycle kinases and with the herein described pattern of 4N accumulation, were able to completely block pCTD (compounds 2 and 3 in Fig. 2C , D and Fig. 2E , F , respectively). Compound 2 promoted inhibition of pHH1 and pRb in the same concentration range as pCTD ( Fig. 2D ). The particular phenotype observed by the DNA content profile suggests a possible inhibition of kinases participating in transcriptional activity. This effect might have a dominant effect versus other kinases involved in cell cycle regulation, but further work is needed to clarify this possibility ( Fig. 2C ). Similarly, compound 3, a very selective compound tested by biochemical analysis (data now shown), achieved a concomitant inhibition of pCTD and a phenotype of subG2M arrest ( Fig. 2F and Fig. 2E , respectively). Interestingly, a slight pRb inhibition was obtained, although none or poor Cdk4/cyclinD inhibition was observed in an enzyme assay. This effect could be related to the fact that inhibition of transcriptional machinery promotes the inhibition of cyclin D1 expression, a critical partner of Cdks involved in the phosphorylation of retinoblastoma. 15
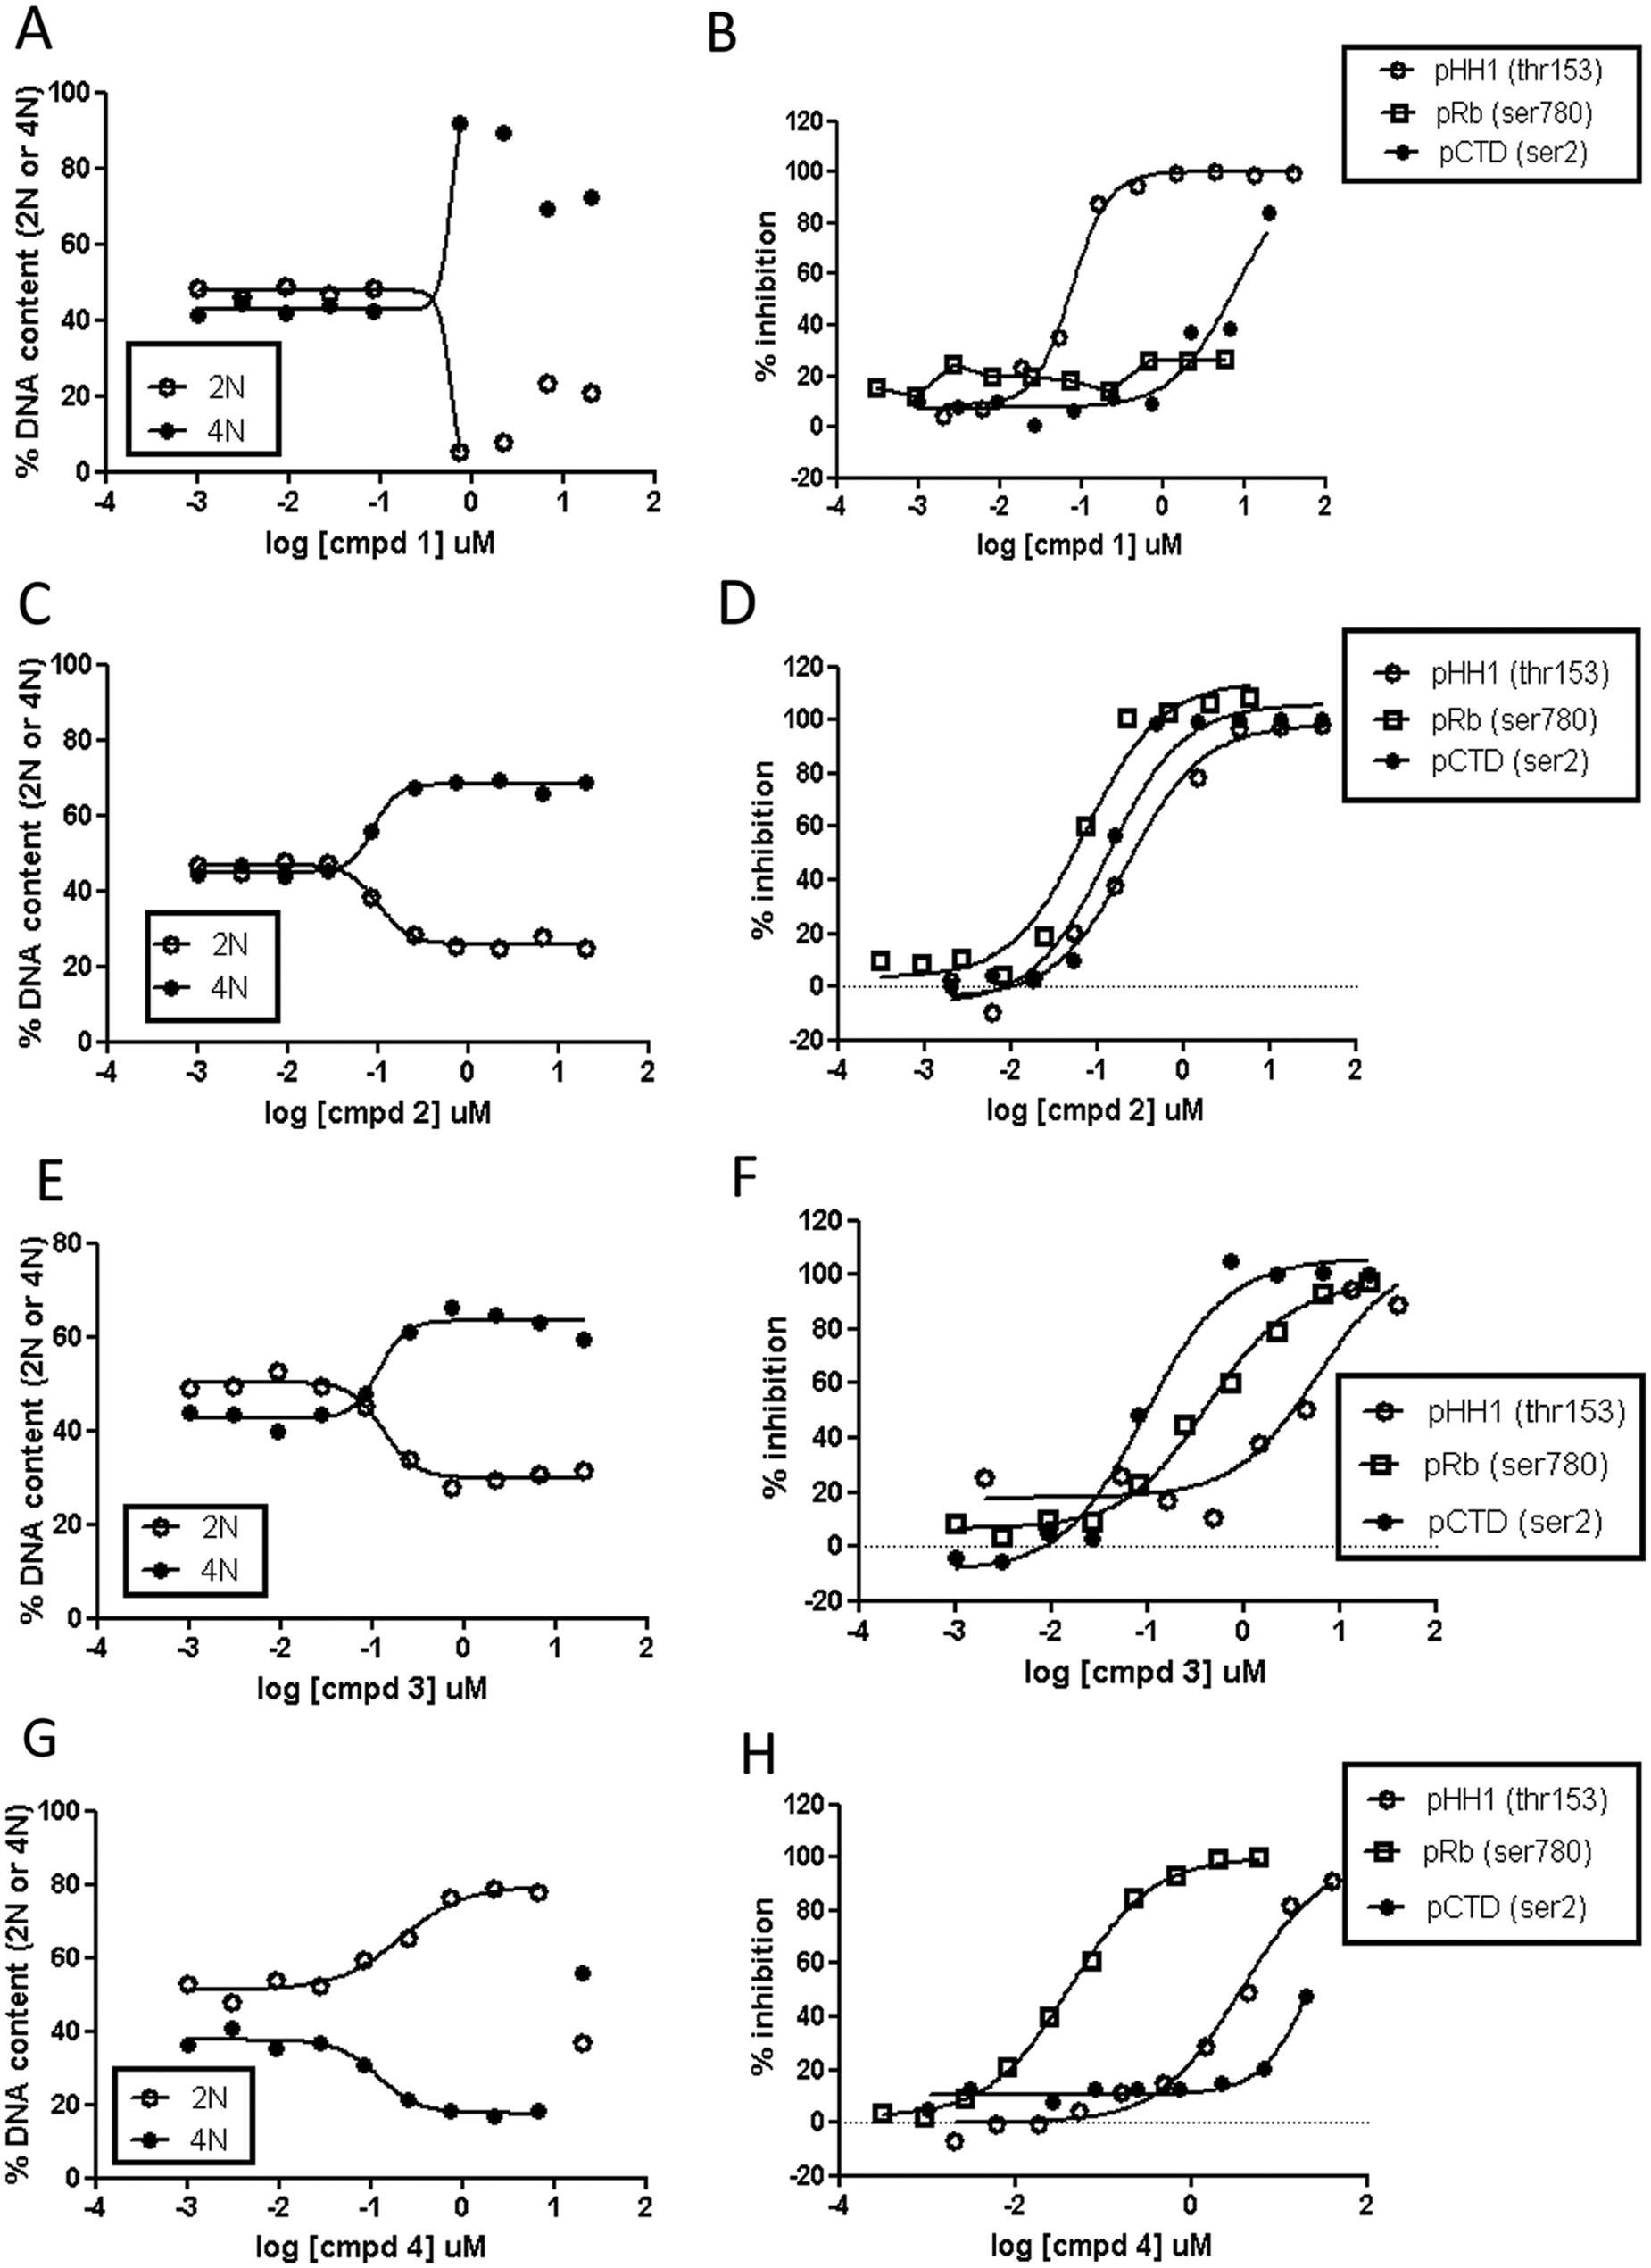
Dose-response curves of representative compounds from the different phenotype clusters described in
Figure 1
. (
To discard a possible off-target effect of this subset of subG2M compounds, U2OS cells were treated with very well-known inhibitors of the transcriptional machinery such as DRB, α-amanitin, and actinomycin D. DRB (5,6-dicloro-1-β-ribofuranosyl benzimidazole) has been used widely as a transcription inhibitor; it quickly appears to cause premature chain termination, with Cdk9 described as its major target. 16 However, the inhibition of Cdk7, a subunit of the transcription factor TFIIH, has been further reported with 3-fold lower efficiency. 17 The cyclic peptide isolated from amanitin mushrooms, α-amanitin, binds with high affinity and specificity near the catalytic domain of the RNA pol II. 18 Actinomycin D is the most popular inhibitor of transcription. It preferentially intercalates into GC-rich sequences into the DNA, stabilizing topoisomerase I–DNA covalent complexes, thus preventing RNA polymerase progression. 19
DRB promoted inhibition in a dose-response manner of pCTD with an IC50 of 40 µM, a value close to that reported in the literature (100 µM) (
All together, these results suggest that the subG2M population might induce a 4N accumulation through a mechanism involving inhibition of gene transcription, and this effect is independent of their ability to interfere with either pHH1 or pRb. This particular phenotype, so-called subGM2, can be used as a readout for selecting compounds able to inhibit the RNA polymerase II activity. By monitorization of simple changes in the DNA content, we might be able to distinguish cell cycle versus transcriptional target inhibition. Therefore, this can be a new, interesting fingerprint for Cdk activity inhibition in a cell cycle–independent manner.
Development of a pCTD ser2 and a PI Multiplexing Assay
The previous data prompted us to validate an HCI assay to measure pCTD inhibition along with DNA content, by using an Acumen (TTP Labtech) instrument. We used PI staining quantization for cell cycle analysis, and the transcriptional activity was determined by measuring the amount of pCTD at the individual cell level.
Flavopiridol (NSC649890) was used as a tool compound for the assay validation. This molecule is a semisynthetic flavonoid derived from an indigenous plant from India. It has shown potent cytotoxicity in chronic lymphocytic leukemia and is currently in clinical trials.20,21 Flavopiridol inhibits multiple Cdks by competing with the adenosine triphosphate (ATP) binding site, and although it is particularly potent against Cdk9, with a Ki of 3 nM, it retains significant activity to inhibit other Cdks with Ki values from 40 to 70 nM. 22
Four different readouts (2N, 4N, pCTDser2, and total cells) were measured by quantifying individual events in cells treated with flavopiridol (6.6 µM) for 24 h ( Fig. 3A , lower panel). Negative control data were captured in untreated cells under the same experimental conditions ( Fig. 3A , upper panel). Data were plotted generating histograms that were gated to separate diploid cells from S phase and tetraploid events in untreated ( Fig. 3B , left) and flavopiridol-treated cells ( Fig. 3B , right). Exposure to the molecule induced an expected decrease in G1 versus the control cells (37.6% vs. 65% in the controls) and a concomitant accumulation in G2M (65% vs. 40% in the control). In addition to the DNA content measurement, the green channel was used to measure nuclear pCTD (ser2) labeled with a specific antibody. Finally, we performed 10-point dose-response curves monitoring the percentage of cell proliferation inhibition. The results obtained were perfectly overlapping between cell proliferation and pCTD inhibition profiles ( Fig. 3C ).
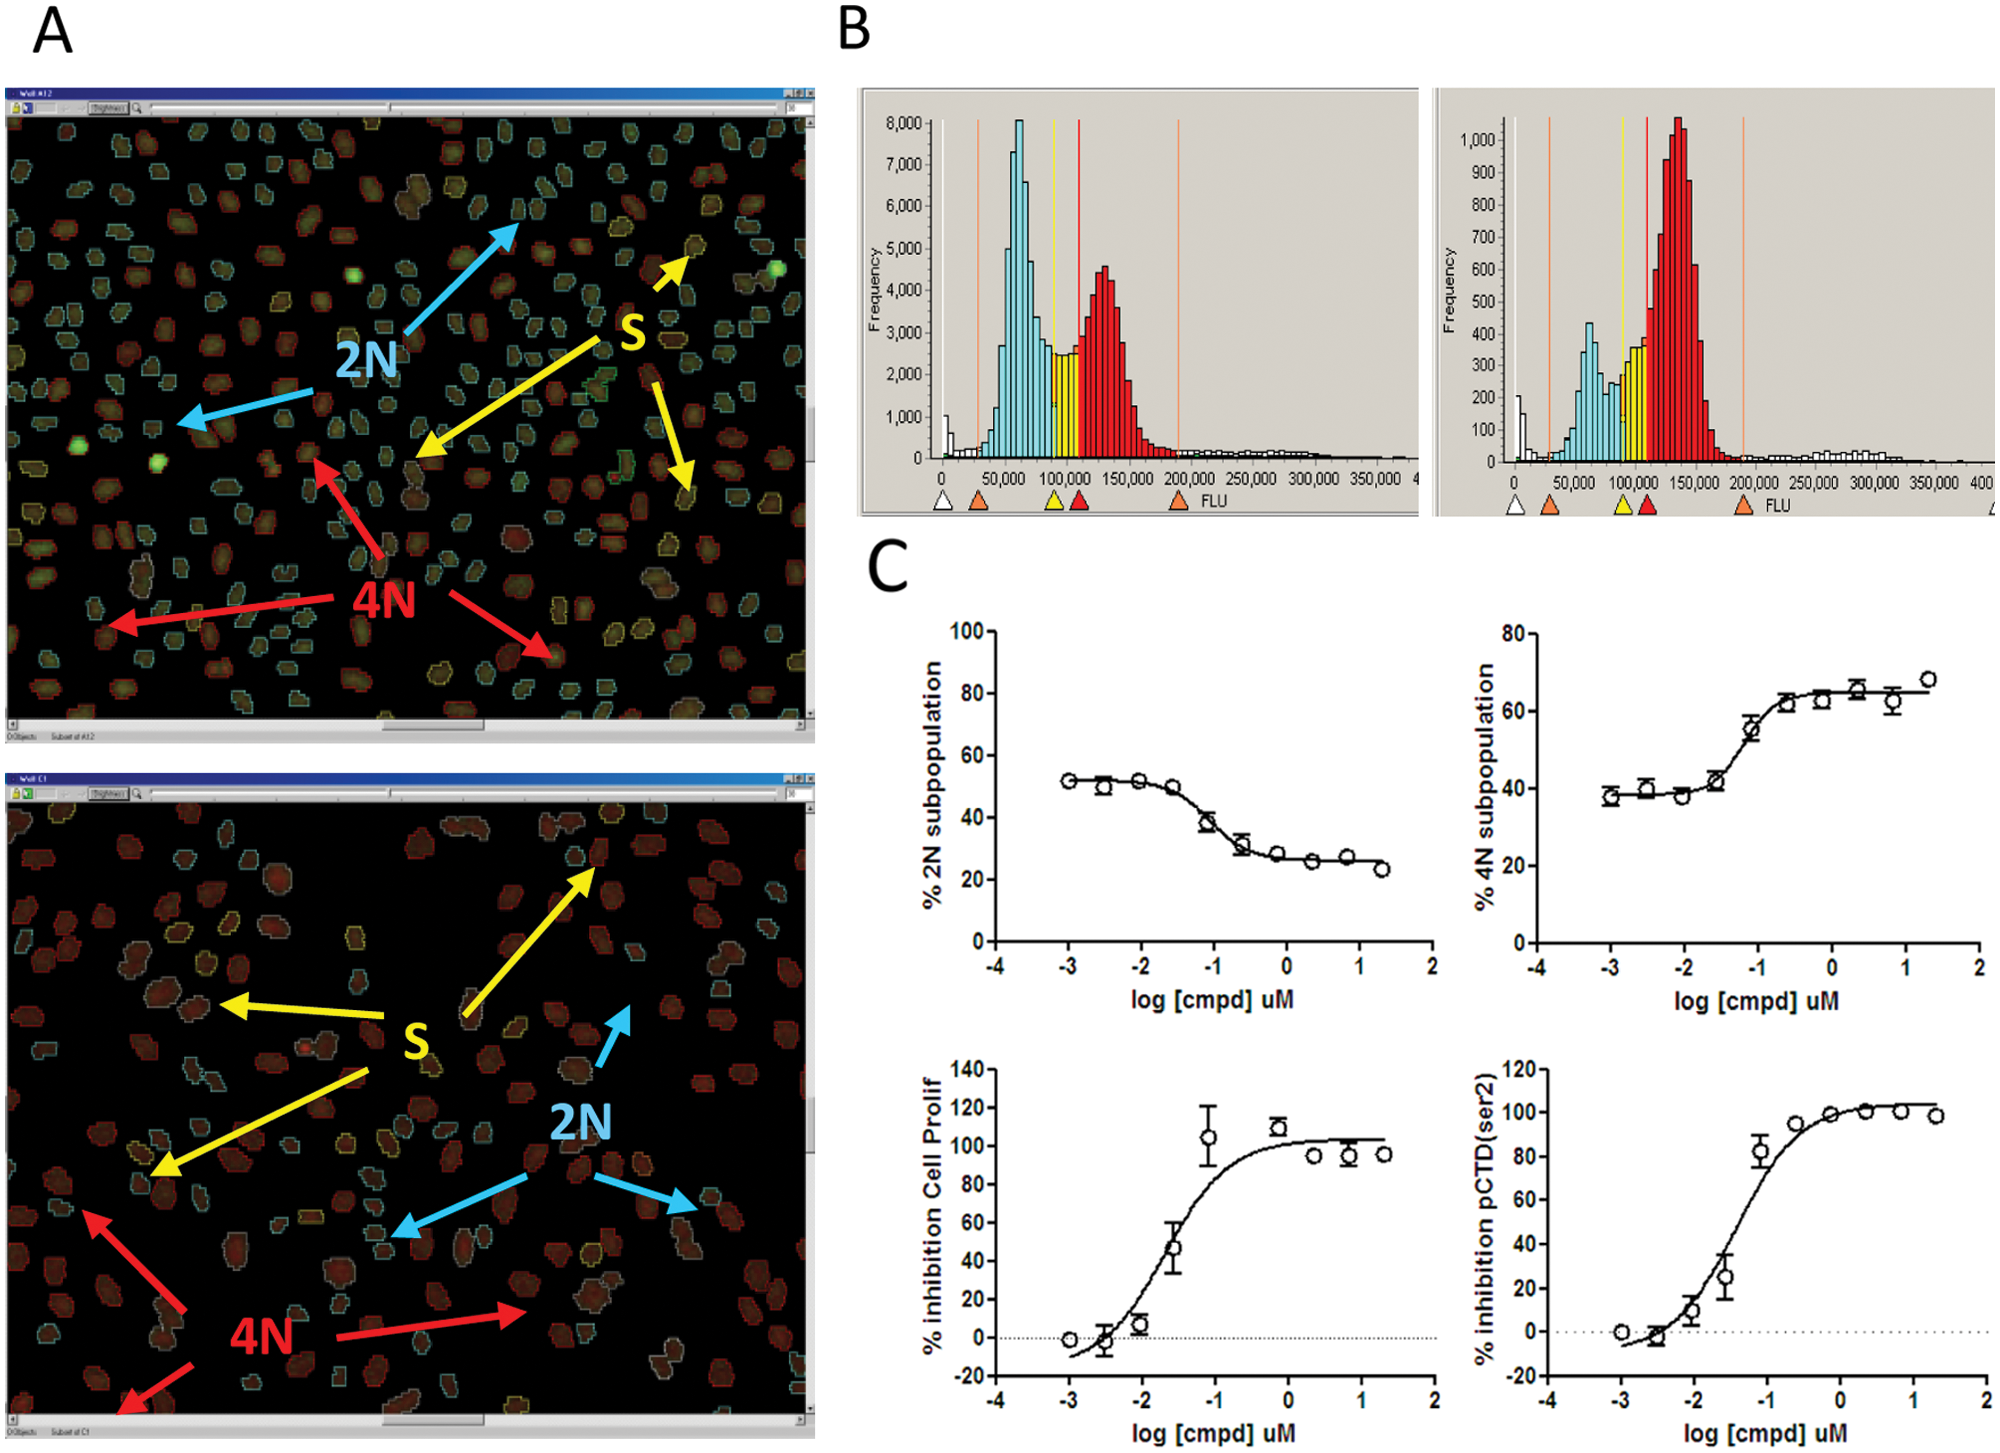
High-content imaging data for propidium iodide staining and pCTD detection. (
To verify results obtained in the HCI assay, we used the classical flow cytometry analysis to measure the response of U2OS cells to different concentrations of flavopiridol (from 0.06–6 µM). The results showed similar trends of a reduction of G1S and an increase in G2M, thus confirming HCI as a valid method for the analysis (
pCTDser2-DNA Content Assay Validation and Optimization
A series of experiments were then carried out to optimize certain parameters of the assay (i.e., cell seeding, antibody concentration, DMSO tolerance) to improve the performance of the assays and identify the most appropriate conditions. The final assay format is described in the Materials and Methods section. We then adapted the multiplex HCI pCTDser2-DNA content to be run automatically on a Tecan Evo liquid-handling station (Tecan, Männedorf, Switzerland).
To assess the reproducibility and robustness of the assay once fully automated, we performed a statistical validation that included a 3-day plate uniformity study and a replicate experiment study (data not shown), following the guidelines published in the NIH roadmap for chemical genomics (http://assay.nih.gov/assay/index.php/Section2:Plate_Uniformity_and_Signal_Variability_Assessment).
The coefficient of variation (CV) average for all parameters was below 10%, and the average Z′ factors were 0.714, 0.718, 0.462, and 0.436 for pCTD, cell proliferation, 2N, and 4N, respectively, indicating the quality of the assay performance (
pCTDser2-DNA Content Assay Allows the Identification of Compounds Interfering with Transcription Inhibition
We tested the applicability of this assay to evaluate a series of reference compounds exhibiting activity and different selectivity against different Cdks. These compounds have been described as interfering with different phases of the cell cycle and/or with gene transcription. A summary of the properties for these compounds obtained from the literature is described in Table 1 .
Drugs Targeting Different Cell Cycle Kinases.
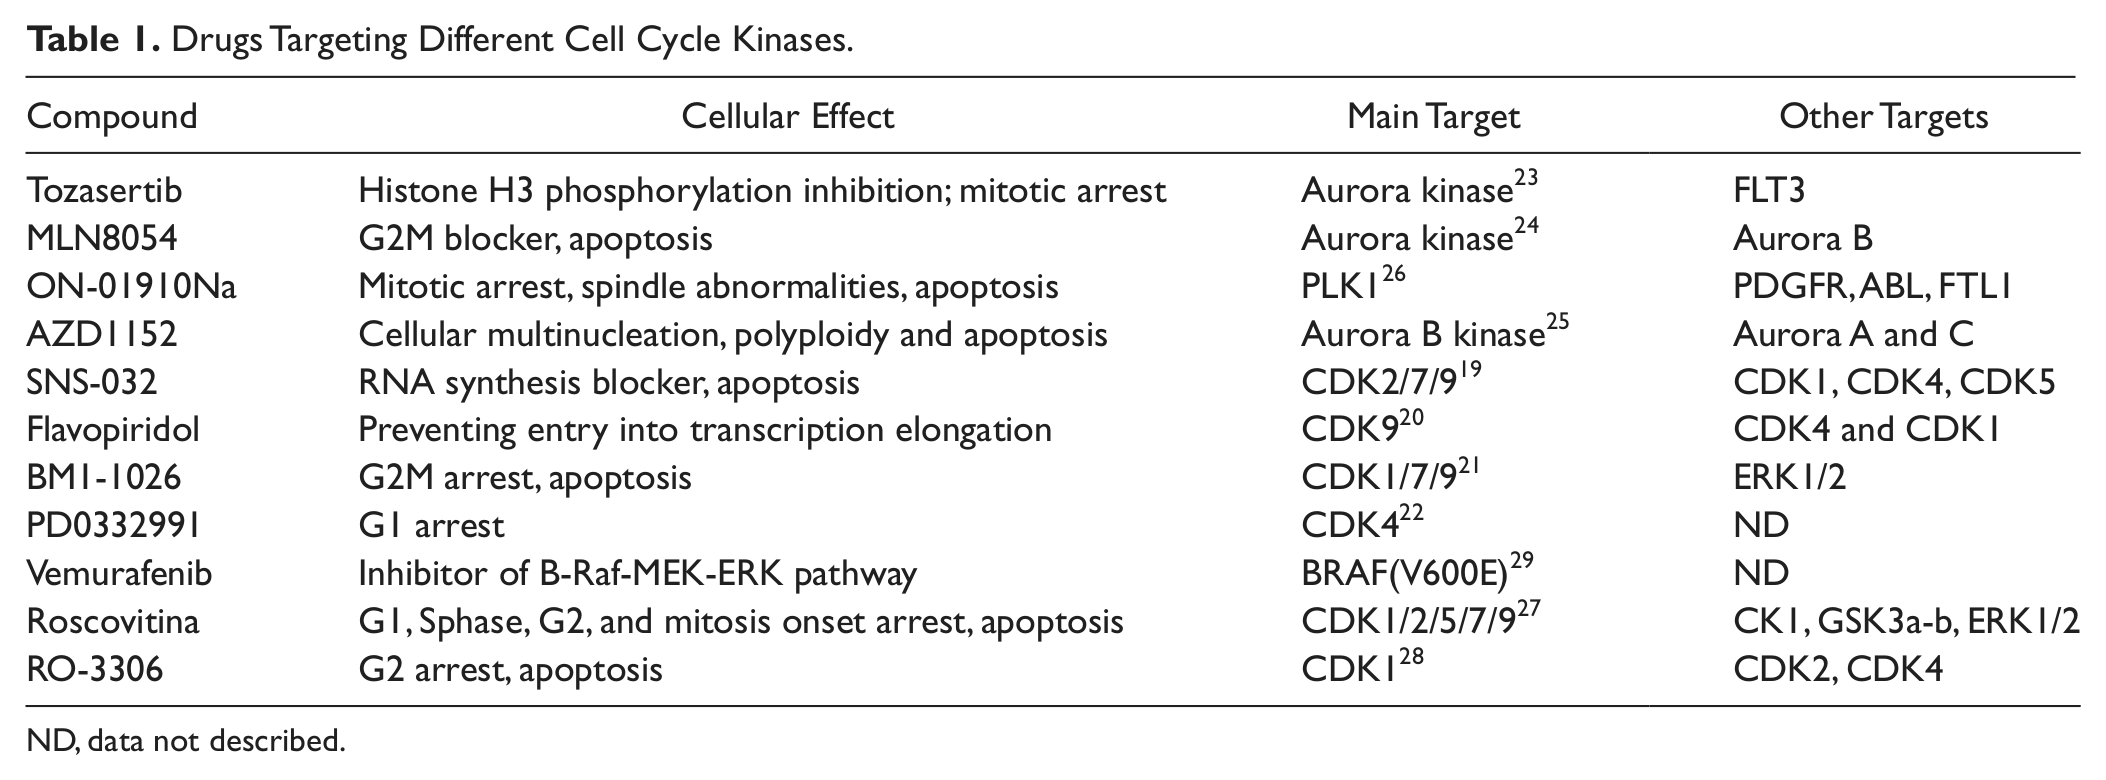
ND, data not described.
Dose-response curves were obtained for the four different readouts, 2N, 4N, cell proliferation, and pCTD ( Fig. 4 ). Tozasertib, MLN-8054, and AZD-1152, known as Aurora kinase inhibitors,23–25 revealed a strong cell proliferation inhibition associated with an increase in the 4N subpopulation (up to 85%–100%), as is expected from inhibitors modulating the mitotic phase. Thus, similarly, ON01910, a non–ATP-competitive PLK1 inhibitor, 26 promoted high cell proliferation inhibition with a phenotype corresponding to 4N accumulation. However, none of these compounds presented pCTD inhibition ( Fig. 4A and data not shown).
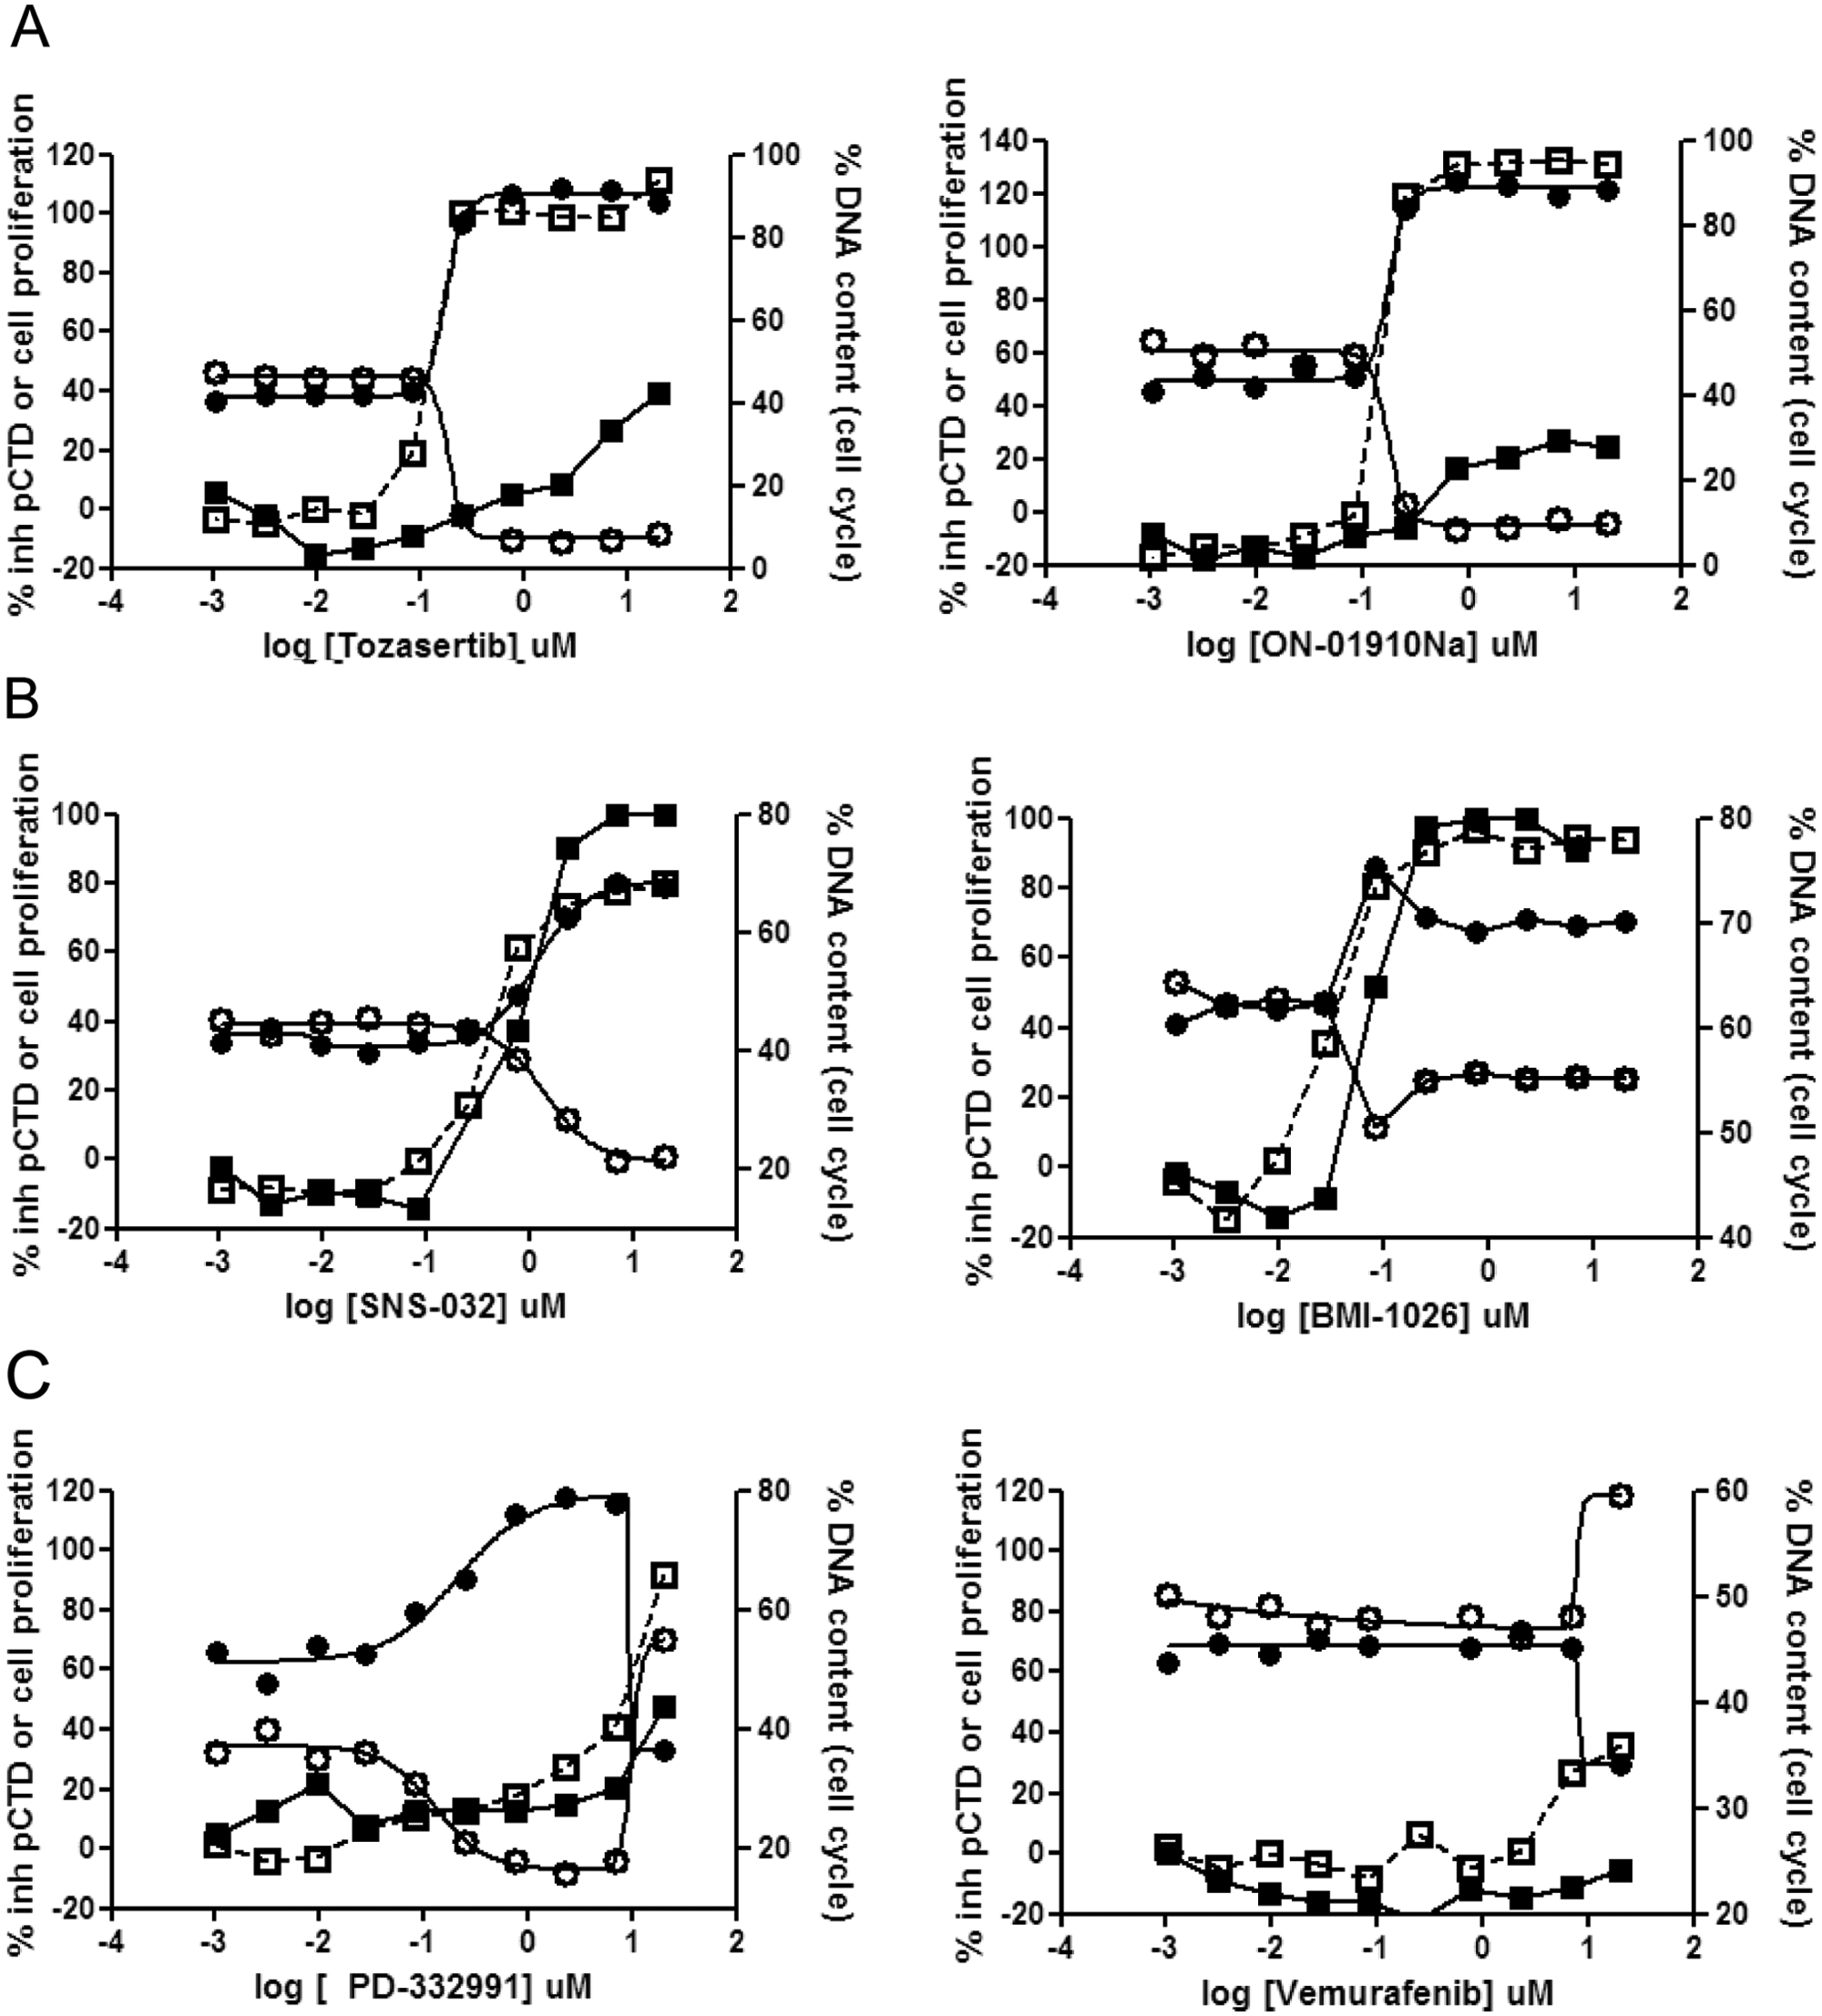
Four-parameter detection (2N, open circles; 4N, black circles; cell proliferation, open squares; and pCTD, black squares) upon U2OS cell treatment with selected reference compounds. (
Administration of SNS-032 led to a phenotype of subG2M arrest27,28 reaching a percentage of the 4N subpopulation ranging from 60% to 75% ( Fig. 4B ). Simultaneously, this compound prompted the inhibition of CTD phosphorylation, similar to the transcriptional inhibition pattern described previously for flavopiridol ( Fig. 2C ). BMI-1026 behaved as a Cdk1 inhibitor, leading to a G2M accumulation greater than 75% when dosed at concentration below 82 nM. G2M arrest was parallel to inhibition of cell proliferation. However, when its concentration increased up to 20 µM, accumulation of the 4N subpopulation dropped down to 65%. Interestingly, upon these higher doses of BMI-1026, pCTD inhibition reached the maximal effect ( Fig. 4B ). These data are in agreement with the already reported promiscuity of this compound, first targeting CDK1 and its further role as a transcriptional inhibitor. 29
We further tested the behavior of a subset of kinase inhibitors not related to either mitosis or transcription. Molecules such as PD-332991, which is claimed to be a pure G1S blocker, 30 showed an opposite phenotype to mitotic kinases inhibitors. This compound led to a remarkable accumulation of the 2N subpopulation without preventing CTD phosphorylation. Vemurafenib, which targets B-Raf (V600E) kinases, 31 did not promote any alteration in the basal pCTD status, cell proliferation, or DNA content profile ( Fig. 4C ).
Finally, compounds classified as pan-CDK1 inhibitors, such as roscovitine or RO-3306, are effective G2M arresters but do not have any activity on transcriptional regulation (data not shown).32,33
Given the multidimensional profile from this assay, we are able to sort molecules after screening based on a different phenotypic pattern at a certain compound concentration, as shown in
All together, the characterization of these compounds by the herein described multiplex assay allowed us to segregate a wide diversity of compounds with a broad range of promiscuity versus Cdks, which are involved in either cell cycle regulation or other processes such as RNA transcription. Indeed, we were also able to discriminate compounds not related to these processes since they did not reach any expected phenotype. Thus, using this high-content methodology, we can distinguish new on-target functions from what have been previously considered undesirable effects. This methodology is suitable for high-throughput screening campaigns.
It is well known that inactivation of Cdk7 and 9 in various biological model systems, as well as by pharmaceutical inhibitors (flavopiridol, SNS-032, and seliciclib), leads to cancer cell growth inhibition and apoptosis. 34 As an example of this connectivity, we conducted a correlation analysis with all of the data generated from the subG2M compound subset ( Fig. 5 ). Results confirmed a very tight correlation between the relative IC50 for pCTD inhibition and cell proliferation inhibition ( Fig. 5A ). In addition, as shown in Figure 5B , there was an outstanding correlation between pCTD and the relative EC50 for 4N DNA content.
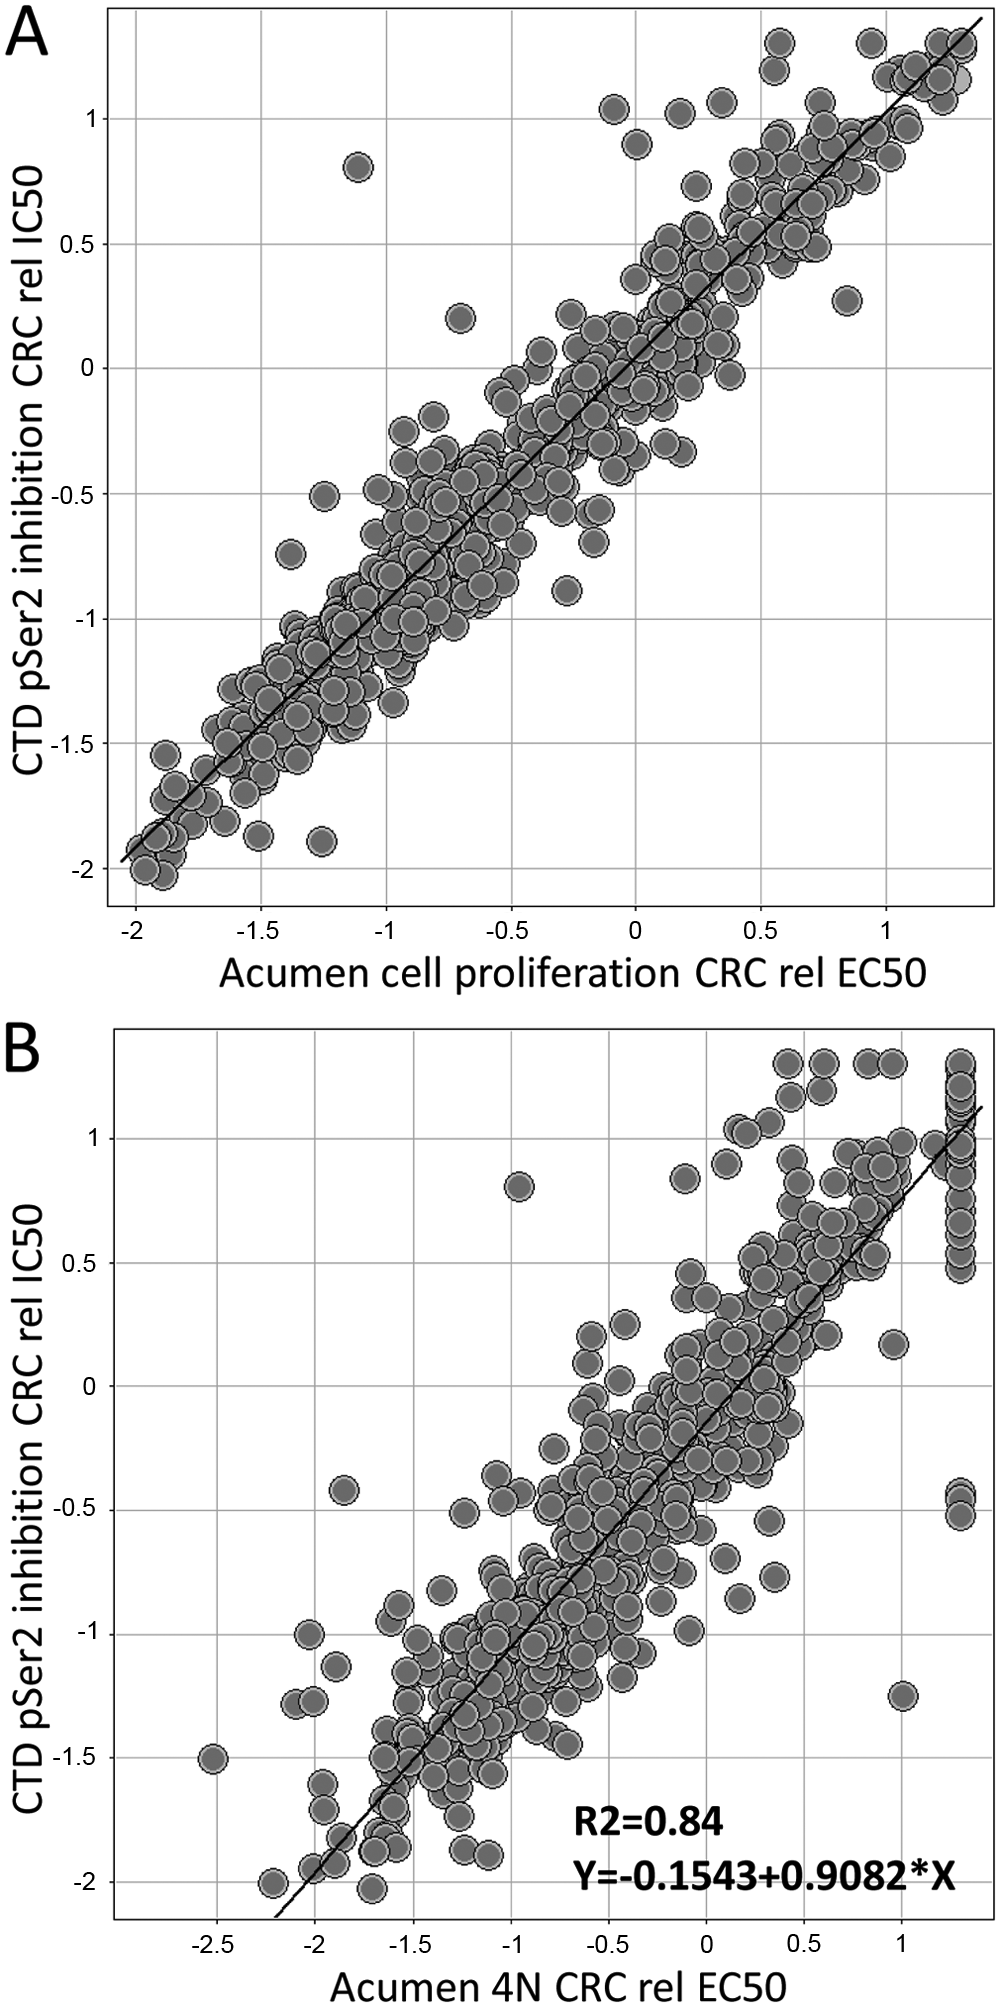
Correlation analysis of pCTD data versus cell proliferation inhibition (
Furthermore, this activity on RNA polymerase II could be predictive of an inhibitory effect on gene transcription associated with a slight increase in 4N DNA content subsequent to cell proliferation inhibition of treated cells. Taken together, our results indicate that the determination of pCTD inhibition constitutes a very robust assay to monitor compound effect on gene transcription.
The phenotypic characterization of molecular compounds, together with a complete selectivity profile for their biochemical properties against multiple kinases, might provide a better lead generation strategy for new therapeutic approaches. Whereas the cell cycle has been considered a key pathway for the identification of clinically relevant compounds, the inhibition of gene transcription has emerged as a significant cellular process suited for therapeutic intervention. In this context, the work described herein represents a new strategy to identify new phenotypes associated with this cellular process.
Footnotes
Acknowledgements
We would like to acknowledge Jose Luis Diaz-Puentes, Carmen Baquero, and Cecilia Mur for the generation of data included in this article. We are also indebted to Jian Du for critical input in the conception of this manuscript and Guillermo de Cárcer (CNIO, Spanish Nacional Cancer Research Center) for critical scientific discussions.
Declaration of Conflicting Interests
The authors declared no potential conflicts of interest with respect to the research, authorship, and/or publication of this article.
Funding
The authors received no financial support for the research, authorship, and/or publication of this article.
References
Supplementary Material
Please find the following supplemental material available below.
For Open Access articles published under a Creative Commons License, all supplemental material carries the same license as the article it is associated with.
For non-Open Access articles published, all supplemental material carries a non-exclusive license, and permission requests for re-use of supplemental material or any part of supplemental material shall be sent directly to the copyright owner as specified in the copyright notice associated with the article.