
Abstract
Despite intensive research efforts over the past years, regeneration of injured axons in the central nervous system remains elusive. In the quest for neurostimulatory agents that promote regeneration, well-defined models and analysis methods are required. Tissue explant cultures closely resemble the in vivo situation, making them ideal to study the effect of compounds on the neuro-glial network. This study reports the optimization of an explant culture technique using retinas of neonatal mice and the development of an analysis script that allows for rapid and automated analysis of neurite outgrowth from these explants. The key features of this script (i.e., local thresholding and form selection) allow for swift and unbiased detection of neurite outgrowth. The novel analysis method is compared with two commonly used manual methods and successfully validated by performing dose-response studies with molecules known to either inhibit (anti–β1-integrin antibody) or stimulate (brain-derived neurotrophic factor and ciliary neurotrophic factor) neurite outgrowth from retinal explants. Finally, the new analysis script is used to study whether retinal explant origin has any effect on neurite outgrowth.
Keywords
Introduction
For many years, the prevailing dogma held that injured or diseased axons in the adult mammalian central nervous system (CNS) are unable to regenerate. The lack of spontaneous axonal regeneration of adult neurons is in part attributed to a loss of neurotrophic support from target neurons, leading to an impaired neuronal survival. 1 Also, a number of inhibiting molecules derived from oligodendrocytes, such as Nogo, myelin-associated glycoprotein, and oligodendrocyte myelin glycoprotein, as well as from reactive astrocytes, such as chondroitin sulfate proteoglycans, prevent axonal regrowth. 2 Furthermore, adult mammalian neurons show a decreased growth potential compared with embryonic neurons. 3 The axonal regeneration failure in the adult CNS poses a major challenge to researchers and pharmaceutical companies in the development of novel treatments for CNS injuries and neurodegenerative diseases, such as spinal cord injury, Alzheimer disease, and glaucoma. The recent discovery that adult neurons can be stimulated to regenerate injured axons has formed new hope for patients affected by these disorders and awoken an increased interest of the pharmaceutical industry in the discovery of new drugs that stimulate neuroprotection and regeneration. 4
The optical circuit forms an ideal model system to study neuronal survival and axonal regeneration in the diseased or injured CNS, because of the well-characterized morphology and functionality of the retina and because axons in the optic nerve (ON) arise from a single neuronal cell population, the retinal ganglion cells (RGCs), which can be experimentally manipulated with minimal surgery. In mammals, the ON does not regenerate spontaneously after injury. However, recent novel findings demonstrate the induction of substantial regrowth of ON axons after administration of neurotrophins and inflammatory molecules, as well as the activation of the mTOR pathway. Despite these important advances, a sufficient axonal regrowth across the entire ON and subsequent synaptogenesis of RGC axons on their target neurons remains a challenge.
Animal models of axonal injury are costly, time-consuming, and labor intensive, making them unsuitable for high-throughput screening of large numbers of compounds. Thus, in vitro models that recapitulate key aspects of neuronal changes in CNS injuries are needed to accelerate the screening of potentially therapeutic agents, as well as to gain further insight in the mechanisms involved. 5 Traditionally, neuronal cell lines, such as PC12 and neuro2a, are used to screen large compound libraries. Despite the numerous advantages, such as their rapid growth and great ease of culture, these cells are tumor-derived or virally transformed and do not necessarily exhibit the same phenotype as the original primary cell. 6 Alternatively, cultured primary neuronal cells retain many of the morphological, neurochemical, and electrophysiological properties of neurons. Although studies using primary neuronal cultures already revealed important insights and identified several players in axonal outgrowth, cell dissociation disrupts the normal cell-cell interaction and can result in an adverse effect on cell responsiveness. Furthermore, a differing ratio between neurons and glial cells, or subclasses of neurons, may cause difficulties in the interpretation of experimental results. 7
Whereas cell disruption is the major disadvantage in dissociated cell cultures, the preservation of cell-cell contacts forms a main benefit of explant cultures. Tissue explants mimic the in vivo situation most accurately by preserving the histological architecture as well as the ratio of neuronal and glial cells. 8 Retinal explants have often been used to study synaptic organization, 9 retinal differentiation,10,11 cell-cell interaction, and neurite outgrowth.12–14 In contrast to analysis of cell cultures, which is mostly done automatically,15,16 analysis of neurite outgrowth from explants is typically performed manually.13,14 However, this is a very labor-intensive and time-consuming process that is prone to subjectivity and fatigue-related errors, which can be circumvented using automated analyses. Previous methods often employed semiautomatic approaches, in which a single gray value is used as a threshold to distinguish the outgrowing neurites from the background. This type of global thresholding is straightforward and can produce good results. However, it typically does not suffice for fully automated analysis since small variations in staining intensity between pictures require the threshold value to be set manually for each picture.17–19
An alternative option is to use local thresholding, in which the signal intensity of a pixel is compared with the average of the pixels locally surrounding it. The advantage of this approach is that it can handle interpicture variation of gray values better than global thresholding and thus allows batch processing of an entire experiment. A disadvantage of local thresholding is that it produces background noise, making subsequent filtering and selection steps necessary. This was elegantly performed by Weaver et al., 20 who created an algorithm for neurite tracing by selecting linear structures after local thresholding. Although their embryonic chick retinal explants showed a very linear neurite outgrowth pattern, our experience with postnatal mouse retinal explants is that they often display a dense web-like outgrowth pattern in the immediate surroundings of the explant. We therefore designed a fully automated script for analyzing neurite outgrowth of mouse retinal explants that uses local thresholding and selects neurites based on size and a “noncircular” form selection. Validation experiments, using neurite growth-inhibiting and growth-stimulating factors, were conducted to show that neurite outgrowth can be dose-dependently detected and quantified. Finally, as previous findings indicate a differential outgrowth of early to late-born RGCs, with the latter being mainly positioned in the ventral retina, we compared the neurite outgrowth from retinal explants originating from different regions in the retina. 21
Materials and Methods
Animals and Dissection
All experiments were performed using C57BL6/N mice. Mice were housed under standard laboratory conditions and raised in an 11/13-h dark/light cycle, with food and water ad libitum. All animal experiments were approved by the Institutional Ethical Committee of the KU Leuven and performed in strict accordance with the European Communities Council Directive of September 22, 2010 (2010/63/EU).
Mouse pups at postnatal day 3 (P3) were sacrificed via decapitation. After exposing the eye, the ventronasal cornea was punctured using a 23-gauge needle. The eye was dissected and put in ice-cold Neurobasal-A medium (Invitrogen, Carlsbad, CA). An incision, made using microscissors (Fine Science Tools, Heidelberg, Germany) from the ventronasal puncture point halfway toward the optic nerve, provided orientation information. The retina was dissected by carefully removing the cornea and the remaining eye tissues using Dumont #5 forceps (Fine Science Tools). Explant punches were taken from the peripheral retina at defined locations (ventral, temporal, dorsal, and nasal retina) using 0.75-mm diameter titanium punch needles (Standard Titanium-Tip FUE Punch, Next Surgical, San Francisco, CA).
Explant Culture
Four-well cell culture plates (Nunclon delta surface; Thermo Scientific, Rochester, NY) were coated overnight with 0.3 mL of a 0.25-mg/mL poly-L-lysin (poly-L-lysine hydrobromide, P1274; Sigma, St. Louis, MO) solution in autoclaved phosphate-buffered saline (PBS, pH 7.4). The wells were rinsed twice with PBS and subsequently coated with 0.3 mL of a 2-µg/mL laminin (Sigma) solution for 2 h and rinsed twice with PBS. Retinal explants were placed in the wells with the RGC nerve fiber layer contacting the laminin surface, in 0.5 mL Neurobasal-A medium (Invitrogen), containing 0.4% methylcellulose (Sigma), 1% penicillin/streptomycin, 0.2% fungizone, 0.5% L-glutamine, and 2% B-27 supplement for retina (all from Invitrogen). The explants were cultured at 37 °C with 5% CO2 for 72 h. Every day, 0.25 mL of the explant medium was replaced with fresh medium. Outgrowth stimulation experiments were performed by addition of brain-derived neurotrophic factor (BDNF) and ciliary neurotrophic factor (CNTF) (PeproTech, Rocky Hills, NJ), whereas outgrowth inhibition was achieved by administration of anti-CD29 (β1-integrin) antibody, clone HA2/5 (BD Pharmingen, San Diego, CA).
Immunohistochemistry
Following culture, the explants were fixed in 4% phosphate-buffered paraformaldehyde for 1 h, rinsed three times in Tris-buffered saline (TBS, pH 7.6), and blocked for 45 min with 20% preimmune goat serum in blocking buffer (0.5% blocking reagent from PerkinElmer TSA kit [PerkinElmer, Waltham, MA] in TBS). Next, they were incubated with a mouse antibody to β–tubulin III (clone SDL.3D10, diluted 1/500 in blocking buffer; Sigma) for 2 h and rinsed three times with TBS, followed by incubation with a fluorescently labeled secondary antibody (goat anti-mouse Alexa 488 [Invitrogen], used at 1/500) for 2 h. For double staining of β-tubulin and glial fibrillary acidic protein (GFAP), explants were, following β-tubulin staining, incubated overnight with a rabbit antibody to GFAP (Z0334 [Dako, Glostrup, Denmark], used at 1/2000), rinsed three times with TBS, and incubated with a fluorescent secondary antibody (goat anti-rabbit Alexa 568 [Invitrogen], at 1/500) for 2 h. Finally, explants were rinsed three times with TBS, counterstained with DAPI (1 µg/mL in PBS; Applichem, Darmstadt, Germany), and mounted with Mowiol solution (11.5% w/v Mowiol, 28.8% w/v glycerol, 0.1% w/v DABCO, 28.8% v/v distilled water, 57.6% v/v Tris [pH 8.5]).
Microscopy and Morphometric Analysis
All pictures were taken with a FV1000 confocal microscope (Olympus, Aartselaar, Belgium) and analyzed using Axiovision software (Zeiss, Jena, Germany). Analysis was performed using two commonly used and previously published manual methods13,22 and a newly developed automated approach, described below and depicted in Figure 1 .
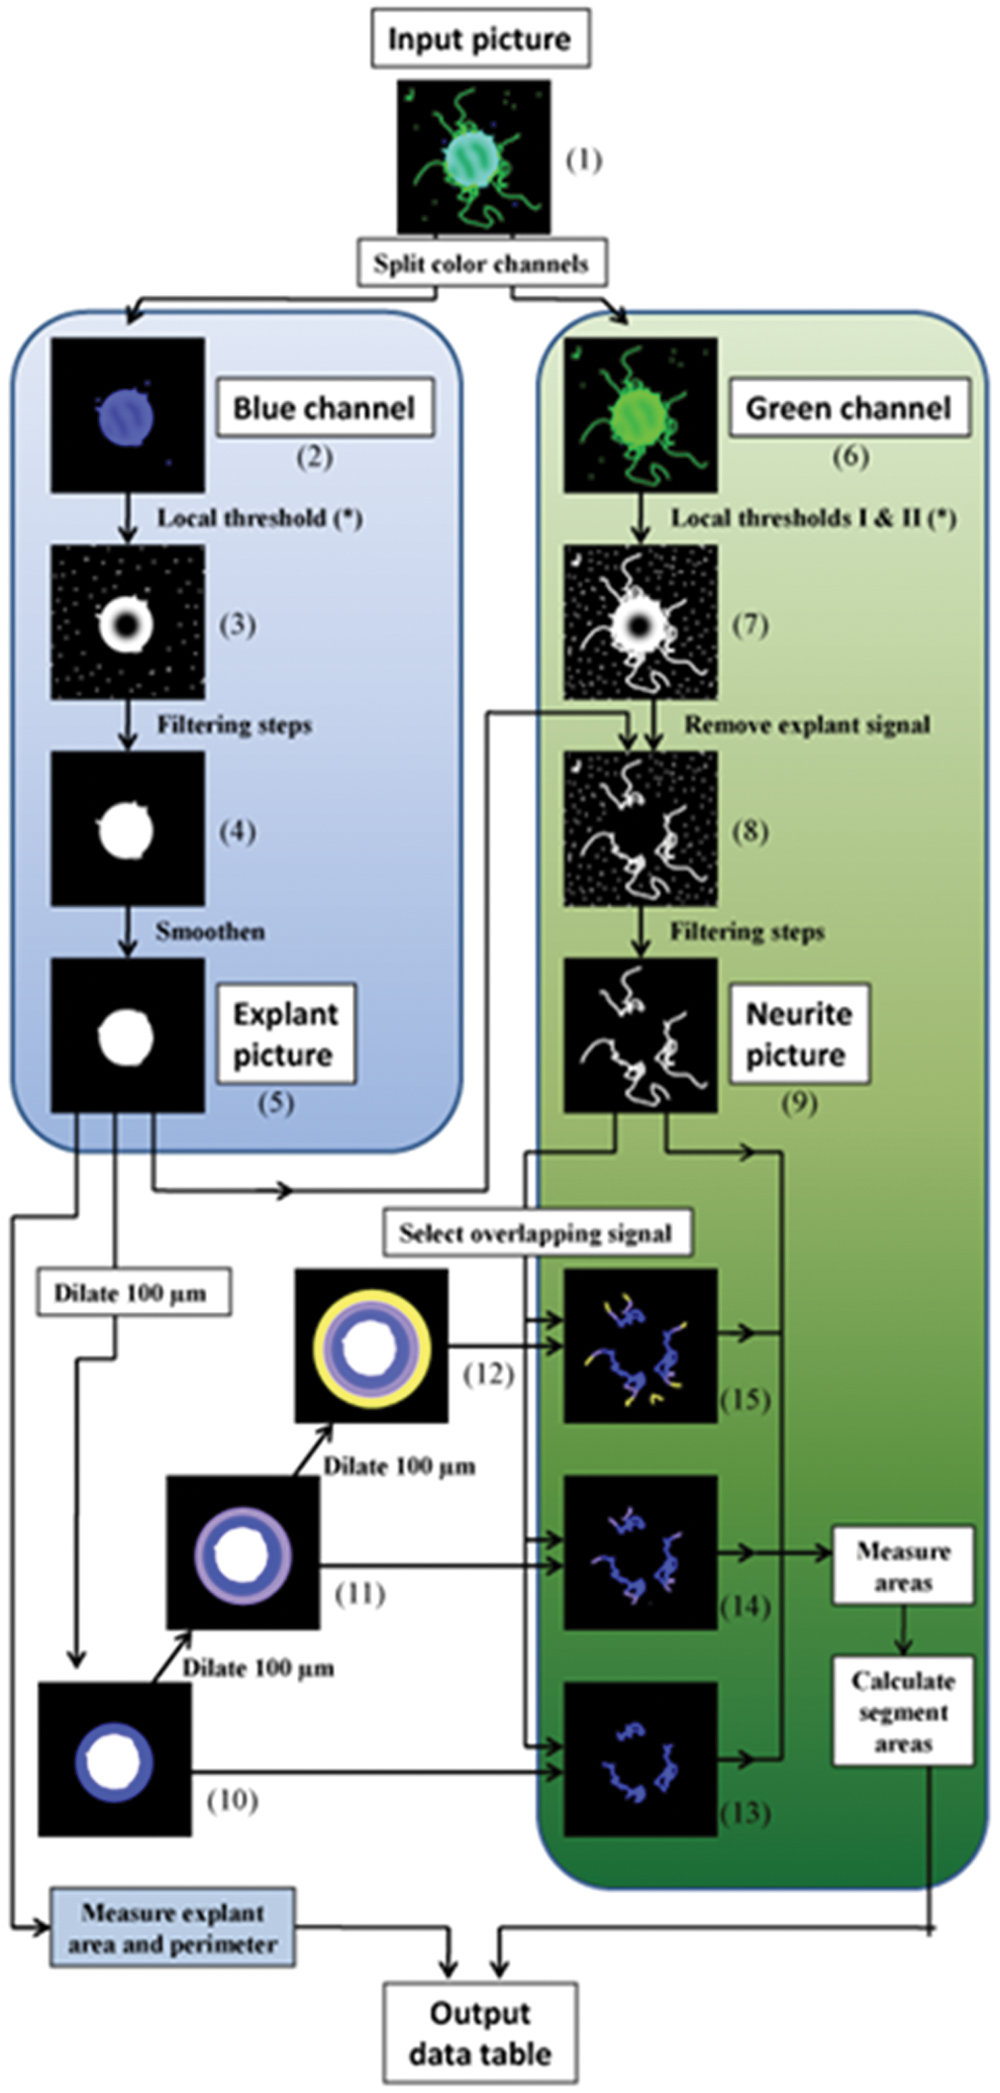
Schematic representation of the immunodetected neurite area script. Each input picture (1) is split into separate color channels. The blue channel, visualizing the DAPI signal (2), is used for explant detection. The image is binarized (3), after which several filtering steps are applied (4) (for details, see Materials and Methods) to generate an explant picture (5), from which the explant area and perimeter are measured. The green channel, visualizing the β-tubulin signal (6), is used for neurite detection. After local thresholding (7), subtraction of the explant picture (8), and several filtering steps, a neurite picture (9) is generated. To categorize the total neurite area in different segments, the explant picture is dilated by 100 µm three times (10–12). Then, the overlapping signal between the neurite picture (9) and the dilated explant pictures (10–12) is selected, yielding pictures with neurites extending from the explant to the edge of various segments (13–15). Finally, from these resulting pictures (13–15) and from the total neurite picture (9), the immunodetected area per segment is calculated.
Within this automated script, which measures the immunodetected neurite area, three input values, determining local thresholding parameters, are required. These values are determined on the first picture of a set of photographs from an entire experiment (at steps in Fig. 1 , noted with *). Once these parameters are set, all other pictures from the same experiment can be analyzed automatically, using the sequence of steps described below (references to various steps depicted in Fig. 1 are in parentheses).
Each input picture (1) (saved as a .tiff file) is split into separate color channels. The blue channel, visualizing the DAPI signal (2), is used for explant detection. The image is binarized with local thresholding (3). Next, in the first of a series of subsequent filtering steps, all objects are dilated to close any gaps in the explant edge and afterward filled up. Nuclei or tissue fragments that are slightly in contact with the explant are automatically separated from the explant using a “Separation” function. Noise produced by local thresholding and other unwanted signals are removed by eliminating all objects smaller than a preset size. A last filtering step selects for circular objects (4). Finally, the explant is slightly enlarged and smoothened and an explant picture (5) is generated, from which the explant area and perimeter are measured.
The green channel, visualizing the β-tubulin signal (6), is used for neurite detection. Two local thresholds (I and II) are performed in parallel, differing in the size of the local area. Most neurites are detected using a threshold with a small local area (I). However, this setting may generate black gaps in dense neurite areas. To alleviate this problem, a second thresholding step with a larger local area (II) is used. Both output pictures are then combined to detect the entire neurite network (7). Next, the signal from the explant itself is removed, resulting in a picture with binarized neurites, which still contains a lot of background noise and artifacts (8). These are eliminated in two subsequent filtering steps. First, a size and form filter is applied to eliminate small and circular objects. Any remaining artifacts are then removed by dilating the objects, which tends to make artifacts more like filled circles, and by repeating the size and form filter. Only the pixels present in the output pictures of both filtering steps are kept, resulting in a binarized image of the undilated neurites without artifacts, the neurite picture (9).
To categorize the total neurite area in different segments, the explant picture is dilated by 100 µm three times (10–12). Then, the overlapping signal between the neurite picture (9) and the dilated explant pictures (10–12) is selected, yielding pictures with neurites extending from the explant to the edge of various segments (13–15). Finally, from these resulting pictures (13–15) and from the total neurite picture (9), the neurite area is measured. From these measures, the immunodetected areas per segment are calculated by subtraction. All values from one input picture are put, together with the image name, in a single row in an output data table, which will ultimately contain the data from all input pictures from one experiment after completion. The script also saves a jpeg file of the neurite picture (9) to quickly perform a quality control. All functions used are described in more detail in Supplementary File 1.
Statistical Analyses
All values are represented as mean ± SEM. Statistical analysis was performed using a Student t test or a multilevel analysis (SAS Proc Mixed), with a p value of 0.05 considered statistically significant.
Results and Discussion
Validation of Staining Specificity of Neurites
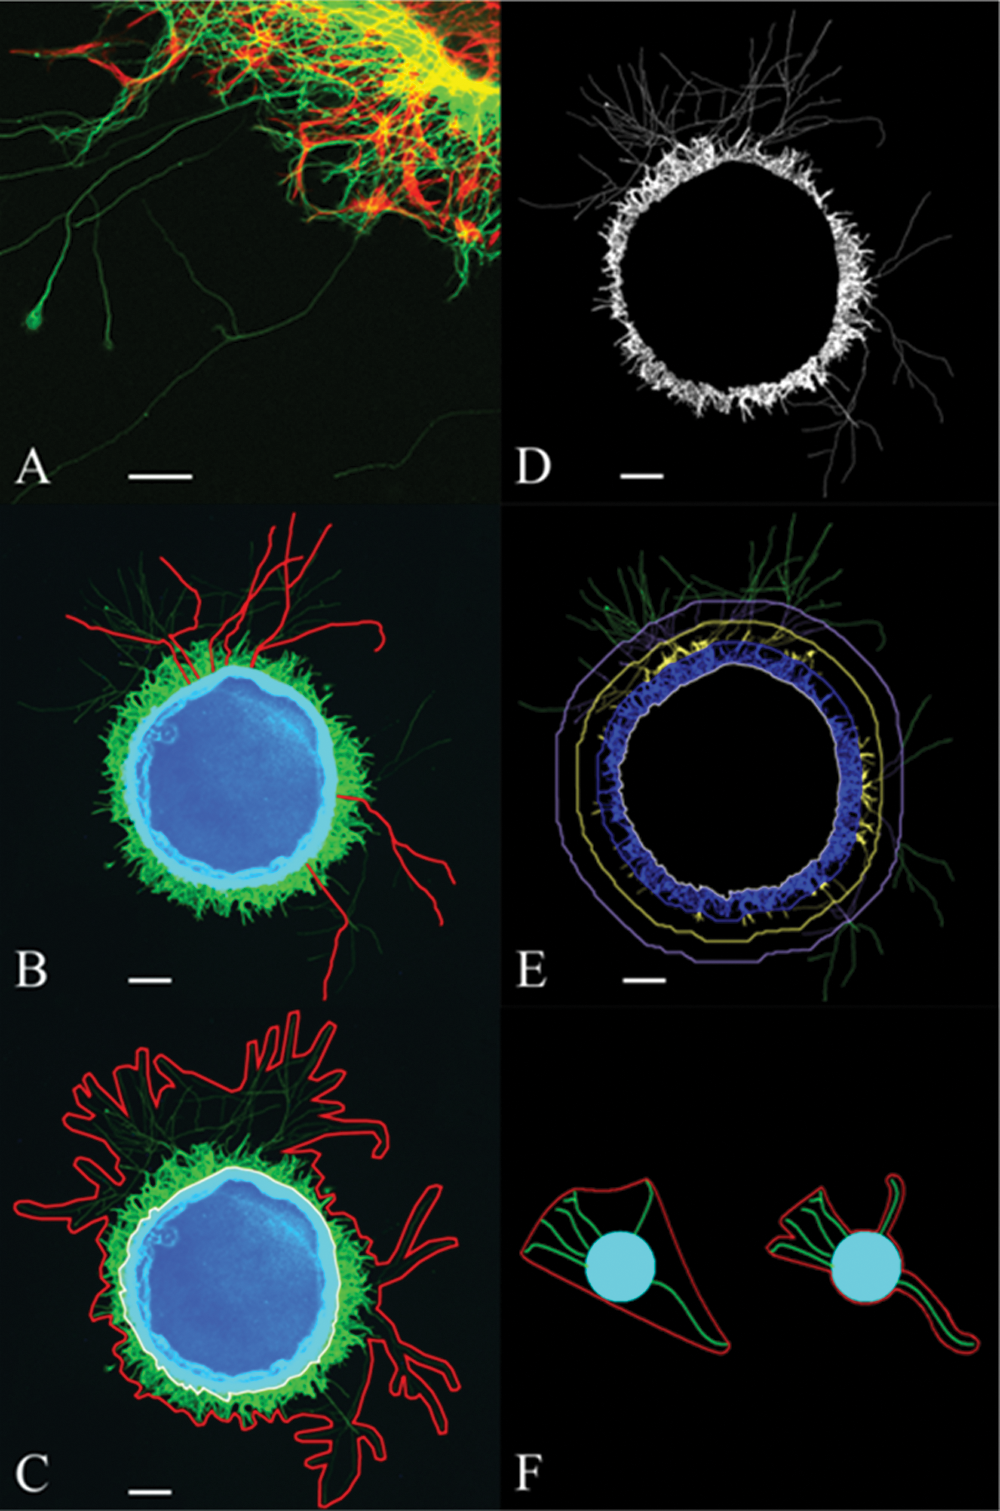
Retinal punches were harvested from P3 mouse pups, cultured for 3 days, fixed, and immunostained for β-tubulin to label the neurites for outgrowth analysis. Such staining showed a robust outgrowth of neurites from retinal explants. To determine the specificity of the neurite labeling, a double staining for β-tubulin and GFAP, a glial cell marker, was performed and revealed a clear separate labeling of GFAP-positive glial processes (red) and β-tubulin–positive neurites (green) ( Fig. 2A ). A significant number of neurites preferentially grew on the glial cells and their processes.
Immunostaining of neurites and overview of quantification methods determining neurite outgrowth in retinal explants. (
Thus, β-tubulin proved to be a specific marker for neurite outgrowth from retinal explants and was used in all subsequent experiments. We favored this approach over using phase-contrast microscopy because of a better signal strength, an improved specificity, and the clear distinction between glial and neuronal processes.
Morphometric Analysis of Neurite Outgrowth
To accurately analyze neurite outgrowth, a novel automated script for neurite outgrowth detection was developed and compared with two commonly used manual methods. The first frequently used method employs manual tracing of the 10 longest neurites ( Fig. 2B ) and averages their lengths to calculate the maximum neurite length.13,14 In a second analysis, the neurite outgrowth area is manually determined.22,23 Here, both the total neurite area (red) and the explant area (white) are outlined, from which the two areas and the explant perimeter are measured ( Fig. 2C ). The explant area is then subtracted from the total neurite area to give the neurite outgrowth area, which is normalized for explant size by dividing by the explant perimeter.
The novel automated script determines the immunodetected neurite area (
Fig. 2D
,
E
) and provides several output values, including the explant area, the explant perimeter, the surface area of the β-tubulin immunostained neurites (
Fig. 2D
), and a categorization of this neurite area into four segments (
Fig. 2E
). These segments are determined by their distance from the explant edge and include three rings with 100-µm increments in radius, as well as an outer segment covering the remaining immunodetected neurite area (
Fig. 2E
). A magnified view of neurite detection in dense neurite areas can be found in
Analysis of 299 retinal explants, all harvested from P3 pups in 12 independent experiments, revealed an average maximum neurite length of 540 ± 18 µm, an average neurite outgrowth area of 0.81 ± 0.03 mm2, and an average immunodetected neurite area of 0.14 ± 0.005 mm2.
The literature describing tissue explant analysis is rather limited, in contrast to the plentiful availability of programs or applets for the analysis of neurite outgrowth in cultured cells. However, such cell culture analysis programs are often not appropriate for explant analysis. The HCA-Vision software (CSIRO, North Ryde, Australia), which was developed to automatically analyze neurite outgrowth in cell cultures, 15 proved to be unsuitable for analysis of our explant pictures. Although the program could faithfully detect single neurites, it often failed to identify neurites in dense areas surrounding the explant. Furthermore, the software was unable to correctly select the explant body as its size fell beyond the capacity of the program (data not shown). Similarly, Wright et al. 24 reported problems with the neuronal profiler algorithm (Cellomics, Columbia, MD) when applied to dorsal root ganglion explants. Although the total neurite area coverage could be detected with this algorithm, the individual neurite length determination failed because the software assigned every neurite to the closest nucleus. 24
As a consequence of the limited availability of automated software for neurite outgrowth analysis of tissue explants, most researchers resort to manual analysis methods, such as the maximum neurite length method13,14 and the neurite outgrowth area,22,23 both mentioned above, or to semiautomatic methods, typical for neurite area detection.17,25,26 Here, we present an automated script for the analysis of the immunodetected neurite area in cultured explants. Although this analysis method was used on postnatal mouse retinal explants, it should be applicable to a broad array of tissue explants, provided the explant pictures have a good signal-to-noise ratio and there is an additional nuclear stain, such as a DAPI staining, besides the neurite signal. The use of this automated script offers many advantages. Most important, the speed of analysis is vastly greater than that of manual methods, which take several hours of hands-on time per experiment. In contrast, the current script only requires the input of three variables for the first picture of a set of pictures from one experiment, which takes less than a minute. The automated analysis itself takes approximately 20 s per image.
Of note, during analysis, the automatically selected neurites of each picture are saved as a jpeg file for a quick manual quality control afterward. Typically, there are nonnegligible artifacts in about 5% of the pictures. If needed, these photographs can be recuperated with an alternative script, in which artifacts that could not be filtered out automatically can be outlined and removed manually. However, even when some pictures fail the quality control, the time gain is tremendous.
Importantly, our automated analysis provides a great amount of objectivity and perfect reproducibility, and it eliminates user fatigue-related errors and interuser variability. Indeed, manual methods often require researchers to make nonobvious choices, which can vary depending on the user, such as the stringency for outlining the neurite outgrowth in the neurite outgrowth area method (see Fig. 2F ).
The use of local thresholding instead of global thresholding is key for the successful automation of explant analysis, as it can handle a much broader range of gray values, negating interpicture differences. Although the explant pictures in this study were taken with a confocal microscope, it is also possible to perform the automated analysis using photographs from a conventional fluorescent microscope. Here it is even more worthwhile to use local thresholding, since out-of-focus signals from the explant itself give higher background signals around the explant than those of the neurites further away. Indeed, using global thresholding for neurite detection is often an exercise of balance between minimizing the false-positive areas around the explant versus detecting a sufficient amount of the more faintly labeled peripheral neurites.
The script in its current form does not provide any information about asymmetric outgrowth and hence cannot be directly used for gradient assays of chemoattraction or repulsion. However, the binarized explant and neurite area pictures, produced by our script, can serve as a useful starting point to perform more specific analyses. To study asymmetric outgrowth, Haines and Goodhill 18 already have described a method in which they used binarized pictures of neurite outgrowth in an ellipse-fitting method.
In conclusion, we presented a detailed description of an analysis method for neurite outgrowth from retinal explants, which—thanks to the use of local thresholding and subsequent filtering steps—can be used fully automatically, thereby greatly improving analysis speed and objectivity.
Validation of the Automated Script Using Neurite Outgrowth Inhibitory and Stimulatory Agents
To test the quality and validity of the results provided by the automated script, we performed two experiments with known outcomes and compared the results of our automated analysis method with the two manual analysis methods.
First, explants were incubated with a function blocking antibody raised against β1-integrin, which is known to exert an inhibitory effect on neurite outgrowth in mouse retinal cell cultures and explants.27,28 After 72 h in culture, a typical control explant has many short and a few long neurites, whereas an explant incubated with the inhibitory antibody rarely has neurites longer than 200 µm ( Fig. 3A , B ). All three analysis methods revealed a strong and dose-dependent inhibition of neurite outgrowth, with a saturated maximal effect at 10 and 50 µg antibody per milliliter of culture medium ( Fig. 3C – E ). As depicted in Figure 3 E , F , the integrin antibody had the strongest inhibiting effect on the areas of the outer segments, showing that especially neurite elongation is affected, although outgrowth in the inner segments is decreased as well. This also explains the more dramatic reduction seen in the maximum neurite length and neurite outgrowth area analysis methods, which are both more sensitive to the disappearance of the longer neurites.
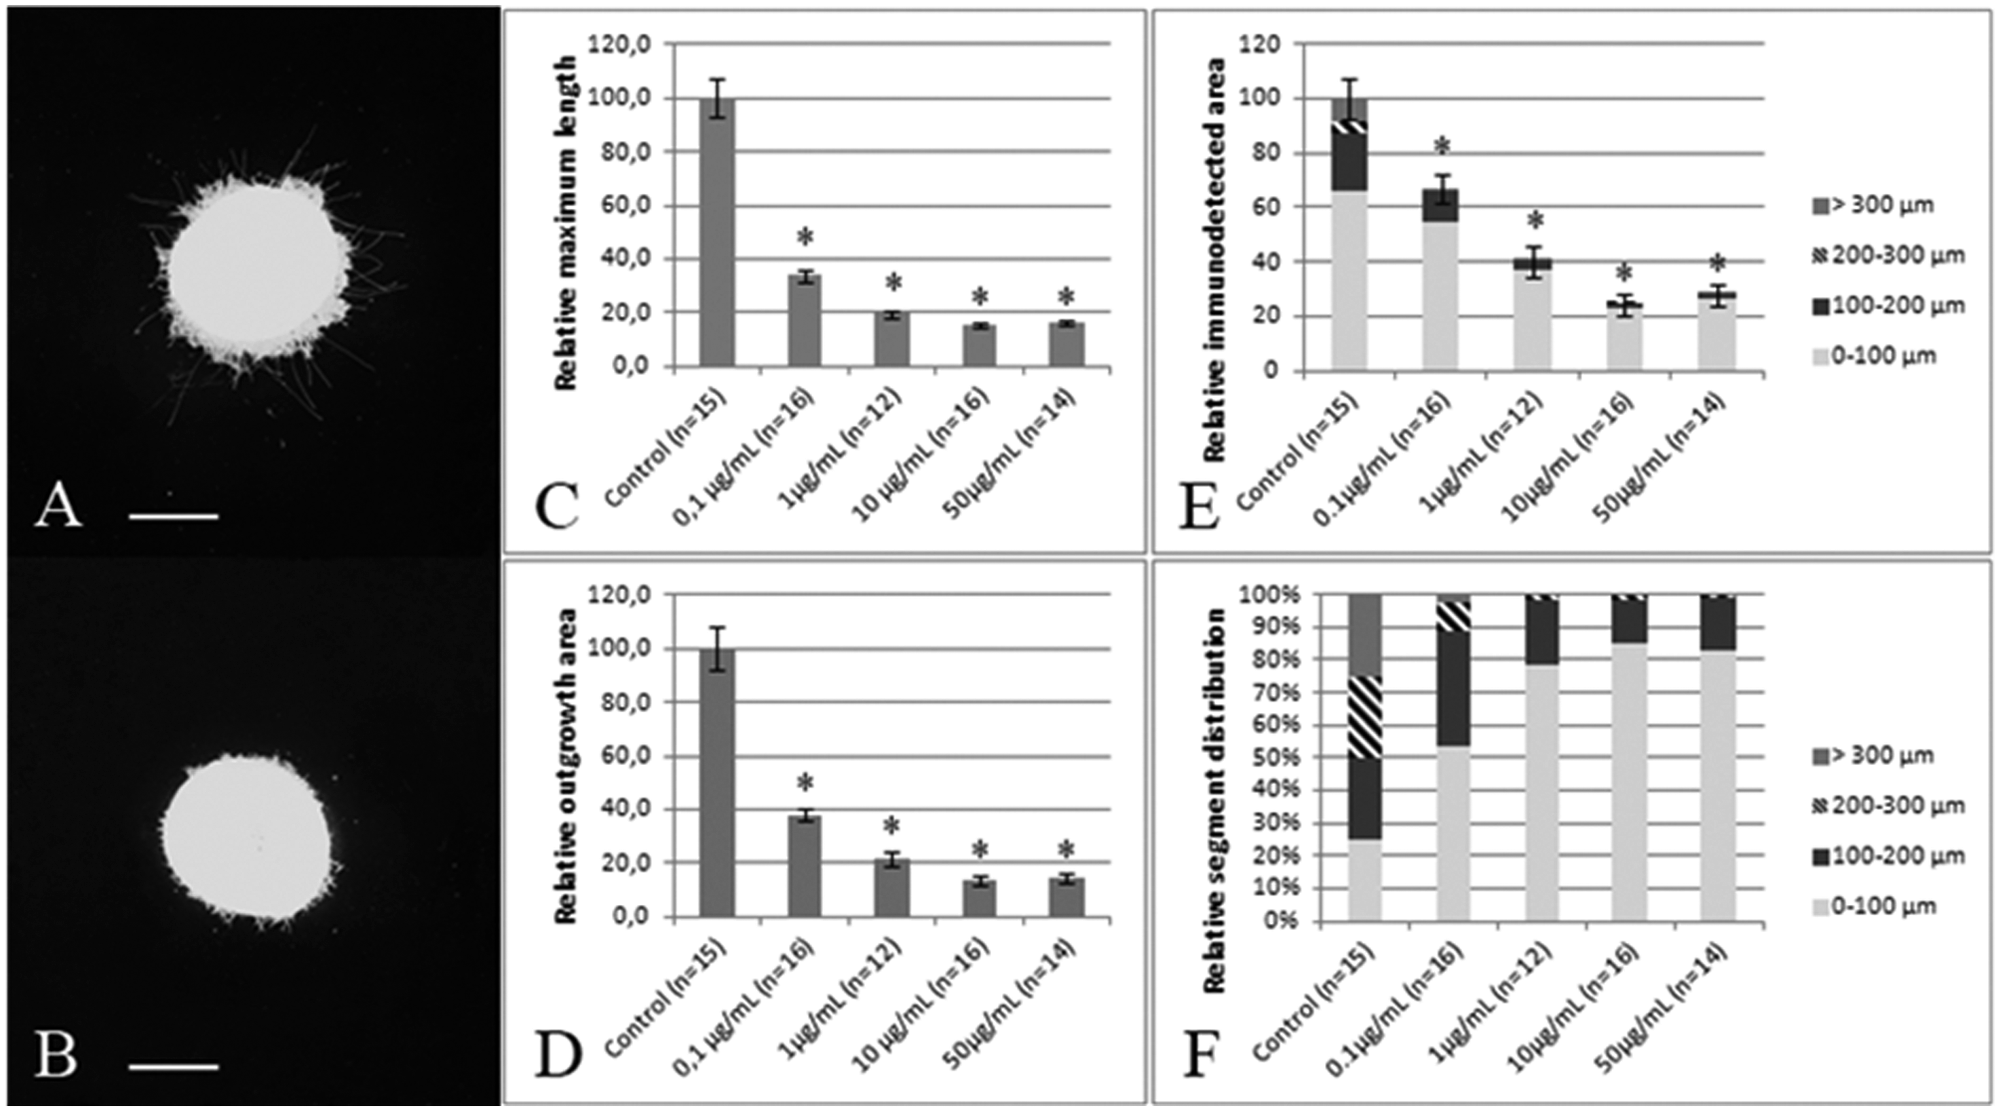
Neurite outgrowth in retinal explants is inhibited with an antibody to β1-integrin. (
Next, explants were incubated with BDNF and CNTF, two growth factors that are known to have a stimulatory effect on neurite outgrowth in mouse retinal explants. 14 Indeed, administration of the two growth factors resulted in explants displaying a strong increase in neurite length ( Fig. 4A , B ). Subsequent analysis using all three methods revealed a strong and dose-dependent stimulation of neurite outgrowth after growth factor administration, with a maximal effect around 1 ng CNTF and 5 ng BDNF/mL or 10 ng CNTF and 50 ng BDNF/mL ( Fig. 4C – E ). As depicted in Figure 4E , F , growth factor administration most strongly affects the outgrowth in the outer segments, showing that it mainly stimulates neurite elongation.
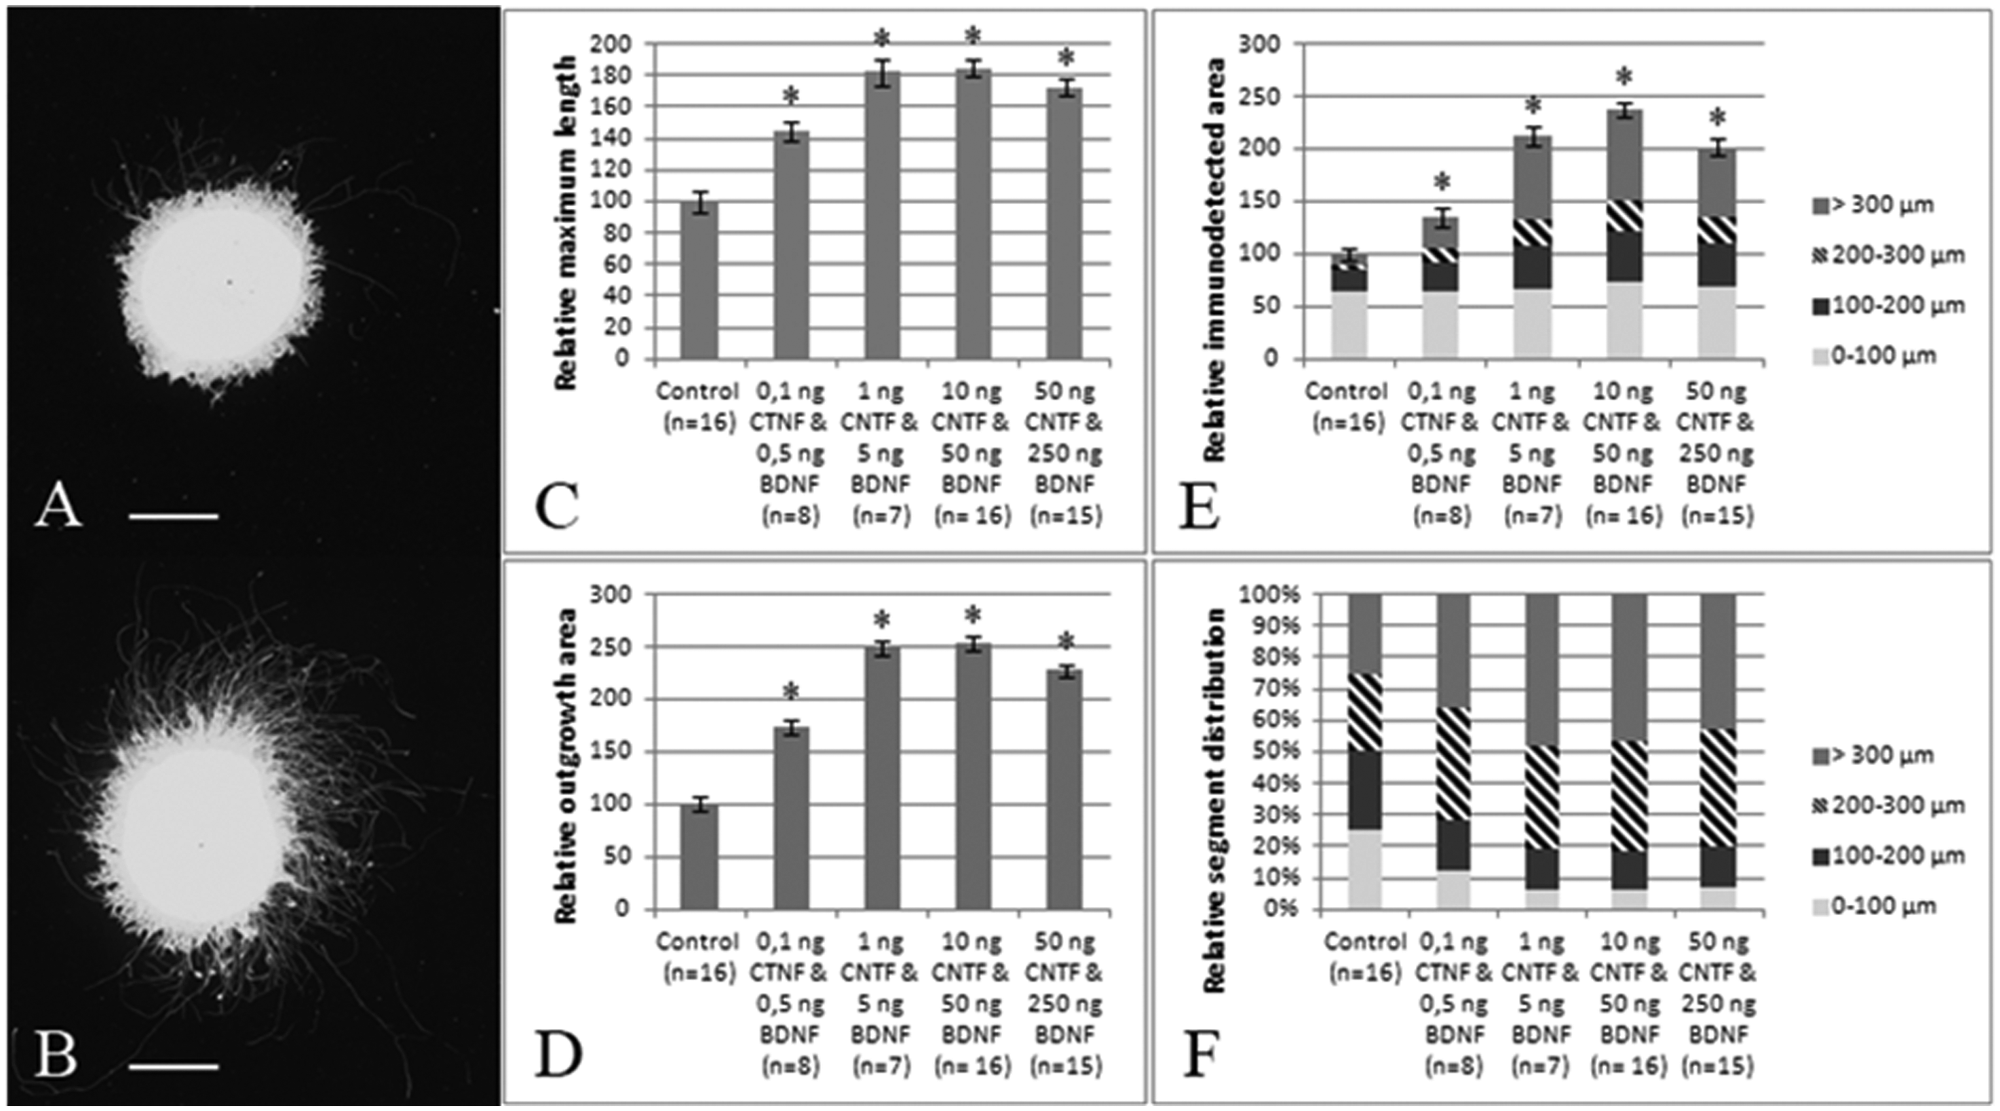
Neurite outgrowth in retinal explants is stimulated after incubation with brain-derived neurotrophic factor (BDNF) and ciliary neurotrophic factor (CNTF). (
The overall quality of the data produced by the script is very similar to that of both previously used manual analysis methods, as both the observed effect and the standard variations determined by the script are comparable to the other morphometric analyses. Although every analysis method provides a slightly different perspective on the outgrowth, the immunodetected neurite area method is the most comprehensive one, as it incorporates data from both long and short neurites, whereas the maximum neurite length and neurite outgrowth area methods are strongly biased toward the longest neurites.
Furthermore, the categorization in four separate segments within the neurite area script provides extra insight into the outgrowth data. For example, after addition of the β1-integrin antibody, almost no neurites were present in the two outer segments at 1 µg antibody/mL and higher concentrations. In contrast, the decrease in outgrowing neurites was much more subtle in the innermost segment, showing that especially neurite elongation was severely affected. Although the strong decrease in the neurite outgrowth area and maximum neurite length values indicate a similar conclusion, a drastic reduction in the number of outgrowing neurites could also lead to a decrease in these values. The use of different segments in the immunodetected neurite area script therefore helps to differentiate between these scenarios.
In conclusion, P3 explants were incubated with several doses of either an anti–β1-integrin antibody or a combination of BDNF and CNTF. In agreement with existing literature, β1-integrin inhibition attenuated neurite outgrowth, whereas addition of BDNF and CNTF stimulated neurite outgrowth in a dose-dependent manner. The data provided by the immunodetected neurite area script proved to be of similar quality to that of previously reported manual methods, validating its use for future experiments.
Effect of Punch Origin on Neurite Outgrowth in Retinal Explants
During retinal development, RGC differentiation starts around embryonic day 11 (E11) in mice and at E13 in rats and persists until birth.11,29 BrdU birth-dating studies in rat have shown that late-born RGCs (E19) are specifically localized within the ventral retina, in contrast to earlier born RGCs (E15), which have a more homogeneous distribution. 30 Furthermore, although late-born RGCs are more resistant to axotomy-induced cell death than earlier born RGCs, they have a reduced capacity to regenerate an axon in a peripheral nerve graft. 21 As these studies suggest that explants from the ventral retina might form less or shorter neurites, we compared the neurite outgrowth from retinal explants originating from the dorsal, nasal, temporal, and ventral part of the retina ( Fig. 5A ).
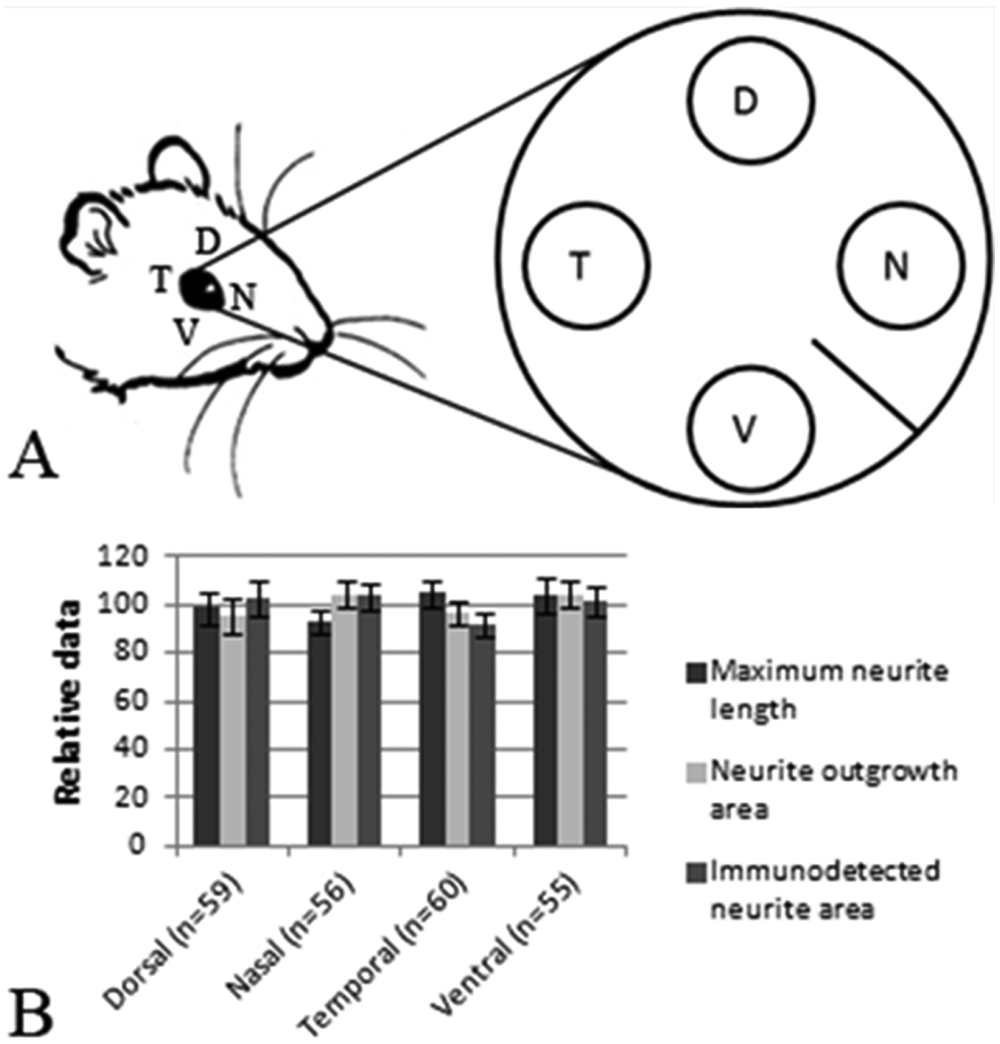
Retinal orientation has no effect on neurite outgrowth. Explants were dissected from four different orientations (dorsal [D], nasal [N], temporal [T], and ventral [V]) in the peripheral retina of pups at P3 (
In total, 230 explants from 6 independent experiments were analyzed and data were normalized by using the overall average value for all explants per experiment as 100%. Our results revealed that there is no significant effect of retinal orientation on neurite outgrowth ( Fig. 5B ). A similar experiment using 160 retinal explants from P0 pups also revealed that there is no effect of retinal orientation on neurite outgrowth in P0 retinal punches (data not shown).
Thus, we applied the immunodetected neurite area script and two manual analysis methods to investigate a possible influence of punch orientation on neurite outgrowth in retinal explants and showed that there is no such effect.
On the basis of the results of Dallimore et al., 21 who clearly showed that late-born RGCs, localized in the ventral retina, have a reduced regenerative capacity and reduced growth speed in vivo, we expected to observe reduced outgrowth in ventral explants in vitro. Our data do not confirm our hypothesis. The current setup, which only analyzes neurite outgrowth from explants after 72 h in culture, does not allow one to exclude the possibility of differential outgrowth at earlier or later time points (e.g., a difference in initial outgrowth speed or an increment of axonal elongation). However, it does provide a strong indication that neurite outgrowth is orientation independent in retinal explants. These findings do bring a significant benefit for using retinal explants in semi–high-throughput analyses. Indeed, up to eight punches can be dissected from a single P3 retina, instead of only four when taking origin into account.
Overall, to obtain a fast and objective analysis method for quantifying neurite outgrowth from retinal explants, we developed a new analysis script that works fully automatically thanks to local thresholding and form-based filtering steps. We proved that the data obtained by this script are of sufficient quality, by comparing with two previously reported manual analysis methods and by performing validation experiments in which molecules with known effects were added in a dose-dependent manner. Thus, this novel analysis can now be used for a wide variety of drug screening experiments or more basic research, including in vivo or in vitro genetic manipulation for the elucidation of gene and protein function. Finally, we used these methods to show that retinal orientation does not affect neurite outgrowth from retinal explants.
Footnotes
Acknowledgements
We would like to thank Marijke Christiaens and Lut Noterdaeme for their excellent technical assistance.
Declaration of Conflicting Interests
The authors declared no potential conflicts of interest with respect to the research, authorship, and/or publication of this article.
Funding
The authors disclosed receipt of the following financial support for the research, authorship, and/or publication of this article: Djoere Gaublomme is a fellow of the Research Foundation Flanders (FWO), Belgium, and Tom Buyens is a fellow of the Flemish Institute for the promotion of scientific research (IWT), Belgium. This work was supported by national grants from the Research Council of KU Leuven (KU Leuven BOF-OT/10/033) and the Research Foundation Flanders (FWO) (FWO G05311.10).