
Abstract
Opioids are widely prescribed analgesics, but their use is limited due to development of tolerance and addiction, as well as high variability in individual response. The development of improved opioid analgesics requires high-throughput functional assays to assess large numbers of potential opioid ligands. In this study, we assessed the ability of a proprietary “no-wash” fluorescent membrane potential dye to act as a reporter of µ–opioid receptor (MOR) activation and desensitization via activation of G-protein-coupled inwardly rectifying potassium channels. AtT-20 cells stably expressing mouse MOR were assayed in 96-well plates using the Molecular Devices FLIPR membrane potential dye. Dye emission intensity decreased upon membrane hyperpolarization. Fluorescence decreased in a concentration-dependent manner upon application of a range of opioid ligands to the cells, with high-efficacy agonists producing a decrease of 35% to 40% in total fluorescence. The maximum effect of morphine faded in the continued presence of agonist, reflecting receptor desensitization. The effects of opioids were prevented by prior treatment with pertussis toxin and blocked by naloxone. We have demonstrated this assay to be an effective method for assessing ligand signaling at MOR, which may potentially be scaled up as an additional high-throughput screening technique for characterizing novel opioid ligands.
Introduction
Opioid analgesics are the most widely prescribed drugs in the treatment of moderate to severe pain. Despite their powerful analgesic effects, the use of opioids in the treatment of chronic pain can be problematic due to the development of tolerance and physical or psychological dependence. 1 Over time, increasing doses of opioids become necessary to maintain analgesia. The increased toxic side effects such as respiratory depression, constipation, and nausea associated with escalating doses of opioids can reach unacceptable levels, leading to inadequate pain relief or overdose. Opioids, however, continue to be the mainstay of chronic pain treatment due to a lack of suitable alternative drugs. As such, there is a substantial need for the development of new opioid analgesics, with reduced adverse effects and a decreased ability to produce tolerance. The µ–opioid receptor (MOR) is the primary site of action for most clinically important opioid drugs and, as such, is the major target for the development of improved opioid analgesic drugs. 2 It is generally accepted that there are no functionally important subtypes of MOR, 3 and so aside from novel formulations or delivery strategies, the development of new pharmacotherapies targeting MOR is likely to focus on subtleties of receptor signaling and regulation.
MOR is a member of the G-protein-coupled receptor (GPCR) superfamily, ubiquitous cell surface receptors that act as cellular switches to regulate most cellular signaling processes. 4 GPCR agonists stabilize active conformations of their receptors, leading to signaling via both the α and βγ subunits of the associated heterotrimeric G-protein complex and sometimes also via non–G-protein–dependent pathways. 5 GPCR signaling is complex, with different ligands preferentially activating (or inhibiting) distinct signaling pathways at the same receptor. 5 There is also increasing evidence that distinct ligands also differentially engage pathways that regulate receptor activity during prolonged agonist exposure, a topic of intense investigation with regard to opioid receptors.6–8 These ideas have led to renewed interest in the possibility of developing ligands targeting MOR that engage only subsets of signaling systems or regulatory pathways, potentially leading to drugs with more favorable clinical profiles.
Drug development typically involves the screening of large libraries of lead compounds to identify those capable of binding to and signaling via a receptor. The vast array of lead compounds available requires high-throughput screening (HTS) methods for efficient detection of potential therapeutic compounds. Radioligand binding studies are often used to identify candidates, but determination of ligand efficacy requires some sort of signaling response. For opioid receptors, this can be achieved using cell lines expressing engineered G-proteins that couple to processes such as intracellular calcium ([Ca]i) mobilization, 9 cAMP-dependent gene transcription, or more traditional assays of adenylyl cyclase (AC) activity, which require harvesting or lysing of cells. 10 In this study, we sought to develop a minimally invasive assay that reflected a naturalistic coupling of MOR and could potentially be used to readily examine agonist regulation of receptor signaling. In mouse pituitary AtT-20 cells, heterologously expressed MOR inhibit native calcium channels (ICa) 11 and activate endogenous G-protein–gated inwardly rectifying potassium channels 12 (GIRKs), and in both cases, this signaling is subject to rapid, agonist-induced regulation. We assessed the suitability of a proprietary fluorescent membrane potential assay to act as a robust reporter of MOR activation and desensitization in AtT-20 cells, with the view to potentially providing an assay for HTS of both these important aspects of MOR function.
Materials and Methods
FLAG-MOR Transfection and Cell Culture
Mouse AtT-20 neuroblastoma cells were stably transfected with the cDNA encoding the FLAG epitope-tagged mouse µ–opioid receptor using the transfectant Lipofectamine (Gibco BRL, Gaithersburg, MD) as previously described. 11 The pcDNA3 FLAG-MOR construct was a kind gift from Dr. Lakshmi Devi (Mt. Sinai School of Medicine, New York, NY). Geneticin (500 µg/mL) was added to select for clones expressing FLAG-MOR protein. During in situ identification of positive clones using Alexa 488–coupled FLAG-MOR antibody (F7425; Sigma, St. Louis, MO), 48 potentially suitable single cells were transferred to single wells using a micropipette and were grown to confluence for subsequent determination of cell surface MOR binding density. MOR binding density was determined on intact cells by incubation with increasing triplicate concentrations of [3H] DAMGO (0.125–32 nM; PerkinElmer, Waltham, MA) at 4 °C in 50 mM Tris-Cl (pH 7.4) for 2 h. Briefly, approximately 1 × 10⁵ cells were plated in a 24-well plate coated with poly-L-lysine overnight. Cells were then rinsed gently twice with 50 mM Tris-Cl (pH 7.4) and placed on ice, and incubations in the radioligand were commenced. Nonspecific binding (less than 2% of total binding at [3H] DAMGO 5 nM) was determined in the presence of unlabeled DAMGO (10 µM). At the end of the incubation, plated cells were rinsed three times with 1 mL 50 mM Tris-Cl (pH 7.4) at 4 °C. Cells in each well were then digested for 1 h at room temperature with 100 µL of 1N NaOH. Then, 100 µL 1N HCl was added to each well and collected into scintillation vials and bound ligand determined using a liquid scintillation counter (Packard Tricarb, Perkin Elmer, Waltham MA, USA). Specific binding was plotted, and Kd and Bmax for each clone were determined using GraphPad Prism (GraphPad Software, La Jolla, CA). One clone expressing a moderate density of surface FLAG-MOR was selected for subsequent experiments. The Kd for [3H]-DAMGO binding was 1.2 nM, and receptor density was 10.2 pmol/mg protein. After counting cell numbers used for protein determination, it was estimated that 2.5 × 10⁷ cells yielded 1 mg protein. Therefore, 10.2 pmol/mg protein represents approximately 2.5 × 10⁵ receptors per cell. The selected clone of AtT-20 cells stably expressing mouse FLAG-MOR was then cultured in Dulbecco’s modified Eagle’s medium (DMEM) containing 10% fetal bovine serum (FBS), 100 U penicillin/streptomycin, and 300 µg/mL G418. Cells were passaged at 80% confluency as required. Assays were carried out on cells up to 25 passages. Cells for assays were grown in 75-cm2 flasks and used at 90% confluence. The day before the assay, cells were detached from the flask with trypsin/EDTA (Sigma) and resuspended in 10 mL of Leibovitz’s L-15 media supplemented with 1% FBS, 100 U penicillin/streptomycin, and 15 mM glucose. The cells were plated in a 90-µL volume in black-walled, clear-bottomed 96-well microplates (Corning, Corning, NY) and incubated overnight in ambient CO2.
Membrane Potential Assay
Membrane potential was measured using a FLIPR Membrane Potential Assay kit (blue) from Molecular Devices (Sunnyvale, CA). The dye was reconstituted with assay buffer supplied with the kit or with a low-K modification. The standard assay buffer contained (mM) NaCl 145, HEPES 22, Na2HPO4 0.338, NaHCO3 4.17, KCl 5.33, KH2PO4 0.441, MgSO4 0.407, MgCl2 0.493, CaCl2 1.26, and glucose 5.56 (pH 7.4, osmolarity 315 ± 5). The modified buffer was formulated without the addition of 5.33 mM KCl. Taking into account the K concentration of L-15, the final in-well concentrations of K were 5.55 mM (standard) and 2.88 mM (low K), respectively. Prior to the assay, cells were loaded with 90 µL/well of the dye solution without removal of the L-15, giving an initial assay volume of 180 µL/well. Plates were then incubated at 37 °C at ambient CO2 for 45 min. Fluorescence was measured using a FlexStation 3 (Molecular Devices) microplate reader with cells excited at a wavelength of 530 nm and emission measured at 565 nm. Baseline readings were taken every 2 s for at least 2 min, at which time either drug or vehicle was added in a volume of 20 µL. Further additions were made in volumes of 20 µL, as indicated. The background fluorescence of cells without dye or dye without cells was negligible. Changes in fluorescence were expressed as a percentage of baseline fluorescence after subtraction of the changes produced by vehicle addition, which was less than 2% for drugs dissolved in assay buffer or DMSO. The final concentration of DMSO was not more than 0.1%.
Data Analysis and Calculation of Z′ Values
Concentration-response data were analyzed using GraphPad Prism (GraphPad Software), using four-parameter nonlinear regression to fit concentration-response curves. The time course of morphine-induced receptor desensitization was fit with a single-phase exponential to obtain an estimated t/2 for the process. To calculate Z′, a measure of the robustness of the assay and its suitability for HTS, the membrane potential assay was performed on three separate occasions using assay buffer as the negative control and 300 nM DAMGO as the positive control in 96-well plates. The Z′ factor was calculated as outlined in Zhang et al. 13
Results
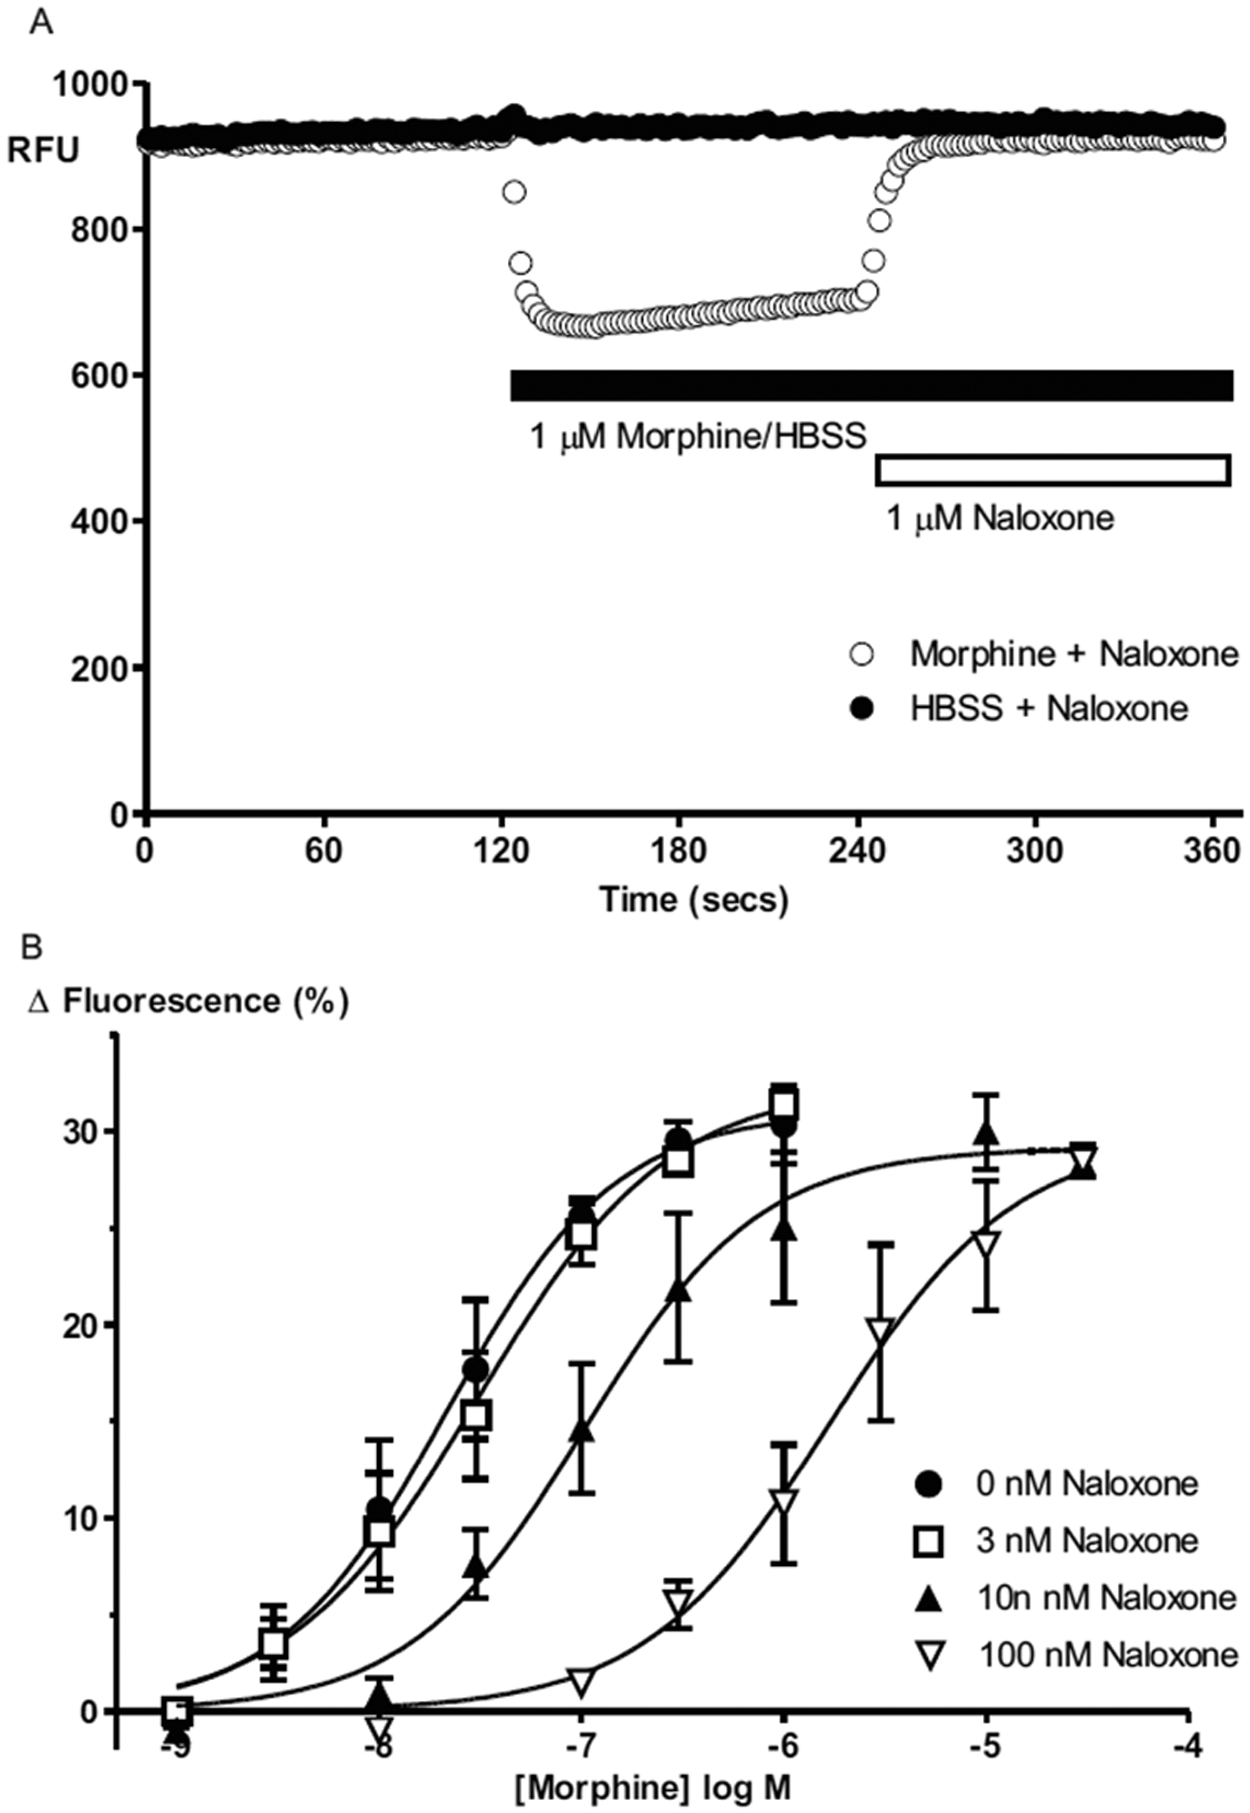
In AtT-20 cells loaded with the proprietary membrane potential dye, addition of the peptidergic MOR agonist DAMGO or the prototypic alkaloid opioid morphine produced a rapid decrease in fluorescence, consistent with hyperpolarization of the cells ( Fig. 1 ). It took about 30 s for high concentrations of morphine to maximally hyperpolarize the cells ( Table 1 ). The decrease in fluorescence produced by morphine was concentration dependent and reversed by addition of the opioid receptor antagonist naloxone ( Fig. 2A ). Addition of increasing concentrations of naloxone produced a parallel shift in the concentration-response curve for morphine, with a pA2 of −8.5 ± 0.1 (2.9 ± 0.5 nM, n = 3), a value consistent with the reported binding affinity of naloxone at mouse MOR (2 nM) 14 ( Fig. 2B ). Pretreatment of cells overnight with pertussis toxin (200 ng/mL) prevented the decrease in fluorescence by DAMGO and morphine ( Fig. 3 ). Addition of morphine or DAMGO to AtT-20 cells not transfected with MOR produced no change in fluorescence. Using the assay buffer supplied with the kit, the maximal decrease in fluorescence produced by DAMGO was 31% ± 1% (n = 6). We sought to optimize the assay by decreasing extracellular [K]Ex from 5.6 mM to 2.9 mM to make the reversal potential (Ke) for K more negative. The reduction in [K]Ex was achieved by dissolving the dye in saline containing no added KCl. The reduction of [K]Ex resulted in maximally effective concentrations of DAMGO producing a 7% greater decrease in total fluorescence (p < 0.01, Student t-test). The Emax and pEC50 for DAMGO in 5.6 mM [K]Ex were 31% ± 1% and 8.3 ± 0.1, respectively, whereas in 2.9 mM [K]Ex, Emax and pEC50 for DAMGO were 38% ± 2% and 8.3 ± 0.1, respectively ( Fig. 4 ).
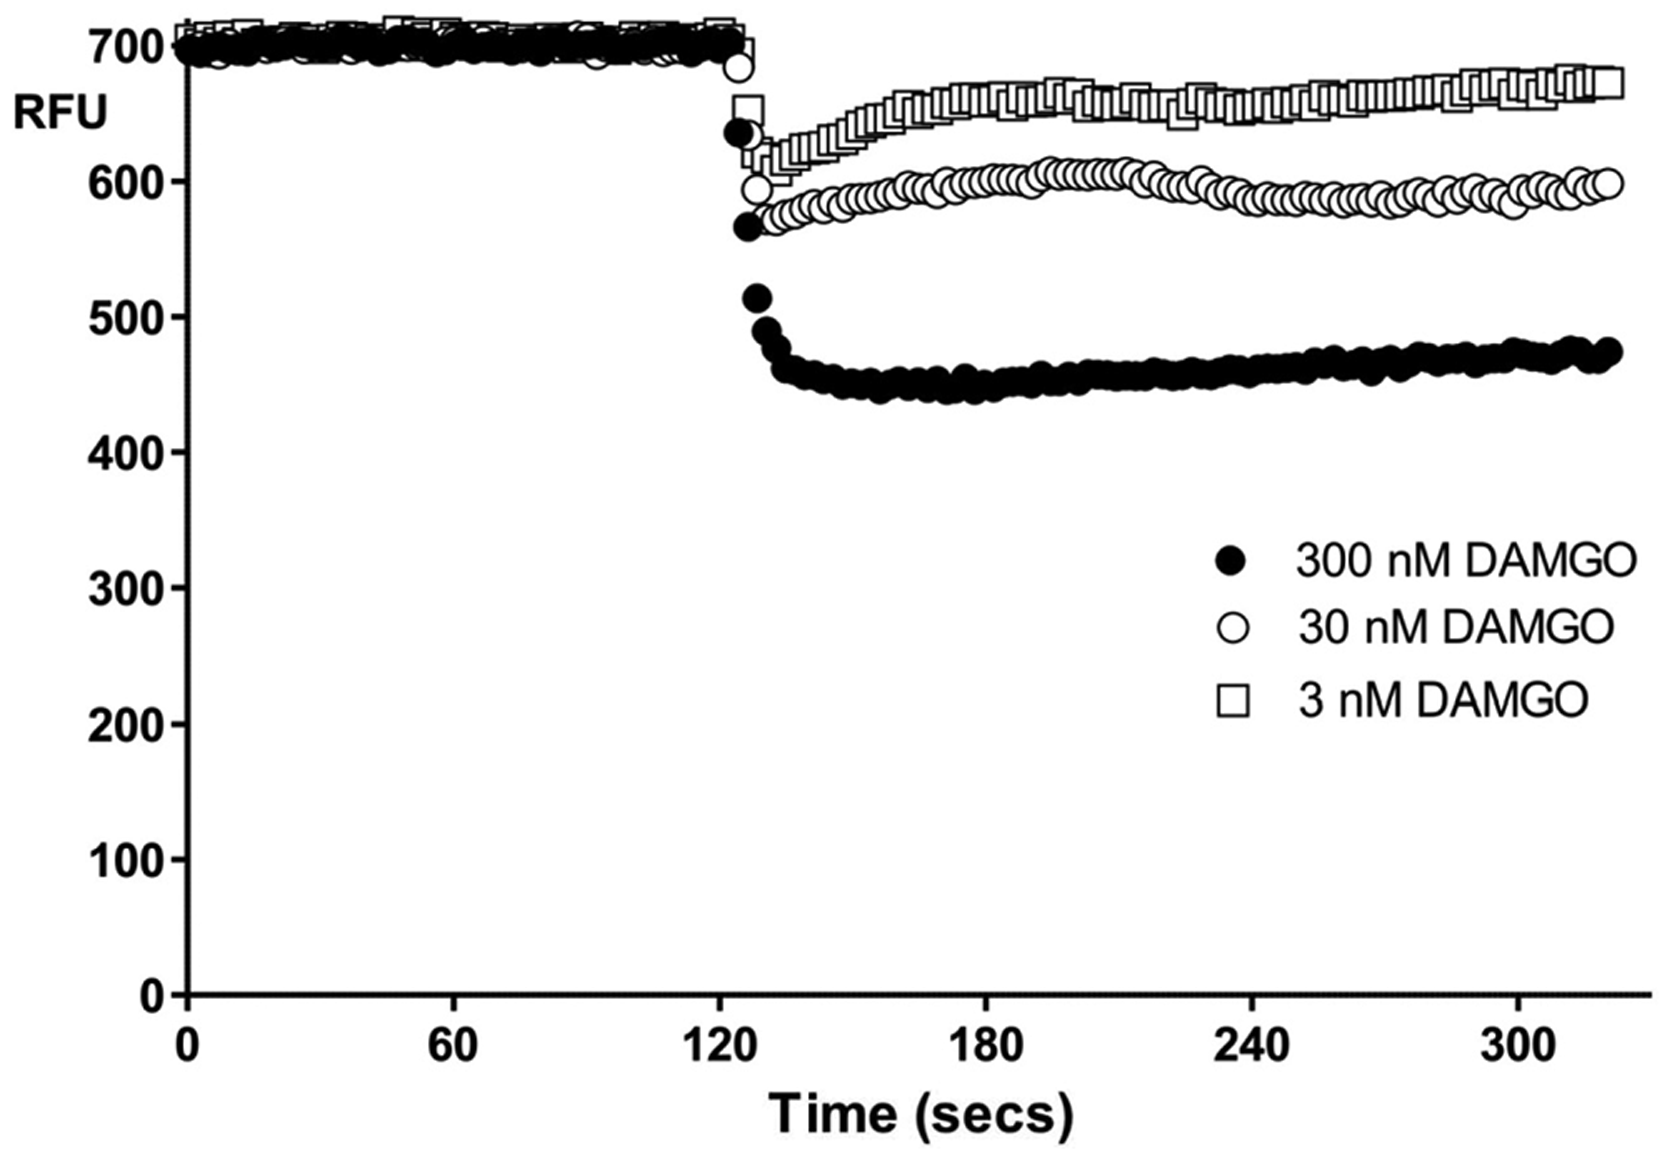
Example traces of fluorescent signal in the membrane potential assay over 300 s. Baseline readings were taken every 2 s for 120 s, at which point increasing concentrations of DAMGO (3 nM, 30 nM, 300 nM) were added to AtT-20 µ–opioid receptor (MOR) cells, resulting in concentration-dependent decreases in fluorescent signal as shown. RFU, relative fluorescence units.
Potencies and Efficacies of the Range of Structurally Distinct Opioid Ligands Tested Using the Membrane Potential Assay in AtT-20 Cells
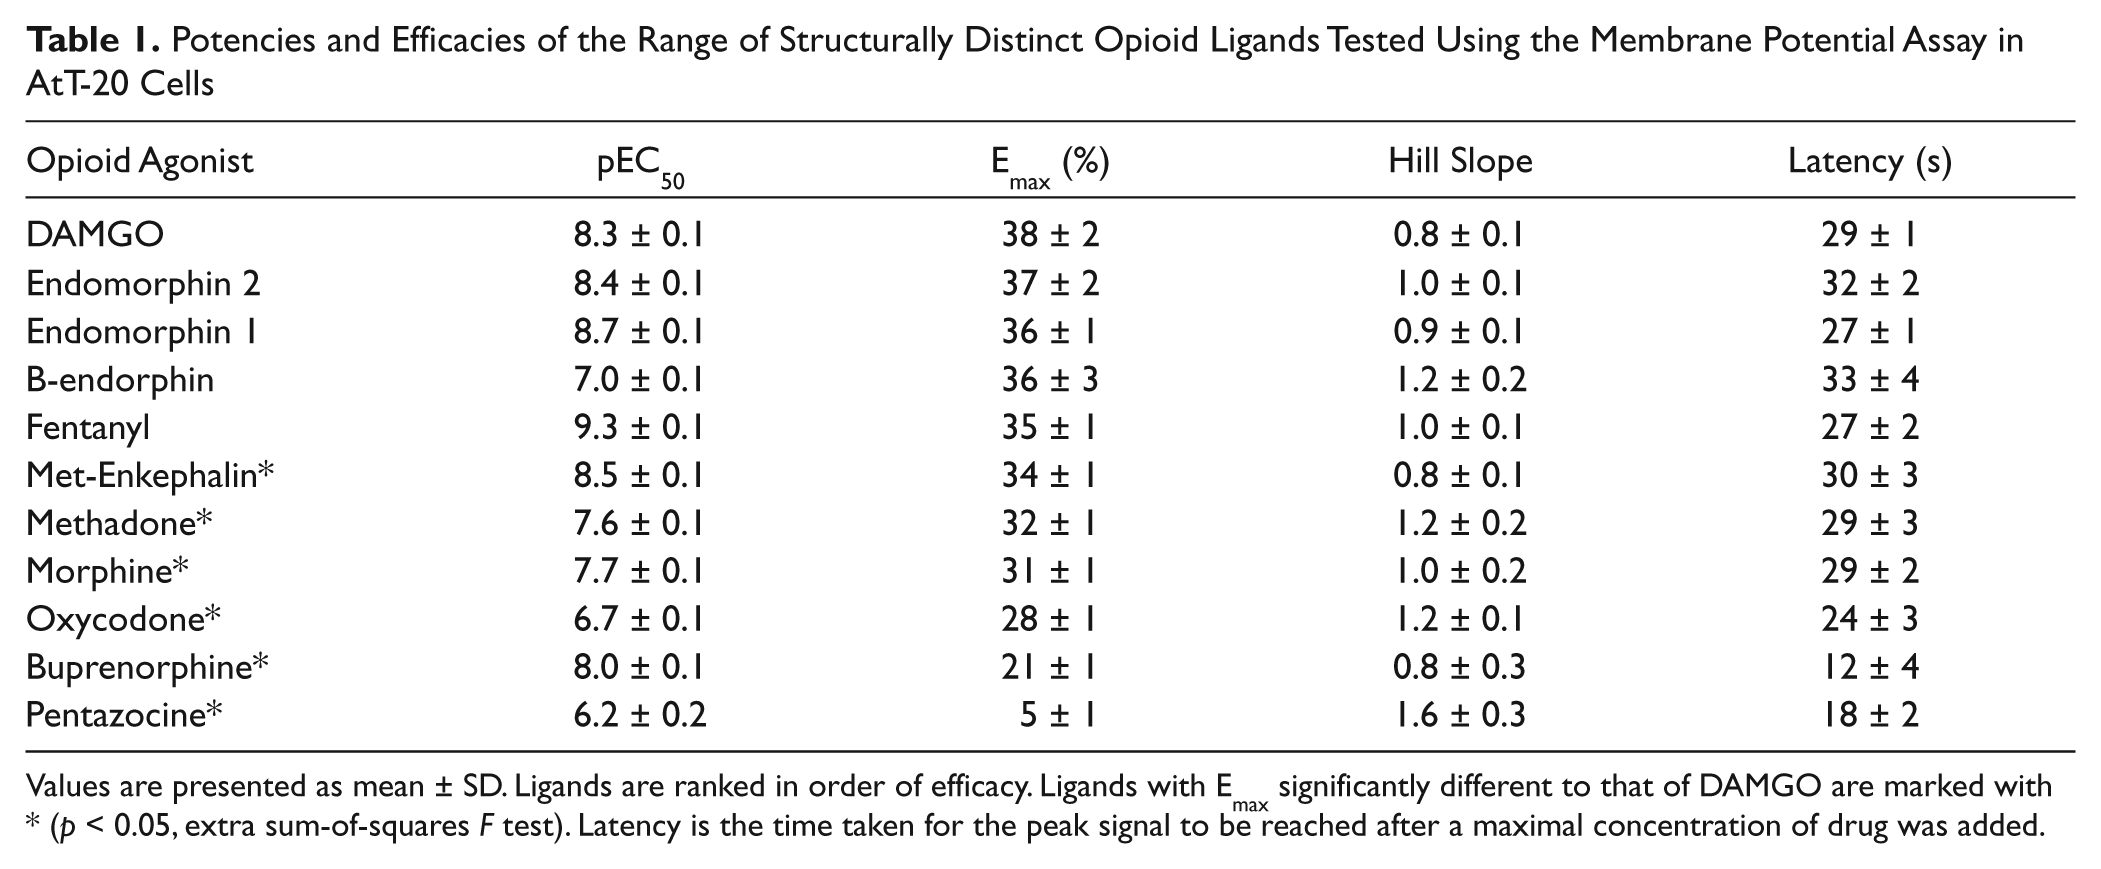
Values are presented as mean ± SD. Ligands are ranked in order of efficacy. Ligands with Emax significantly different to that of DAMGO are marked with * (p < 0.05, extra sum-of-squares F test). Latency is the time taken for the peak signal to be reached after a maximal concentration of drug was added.
(
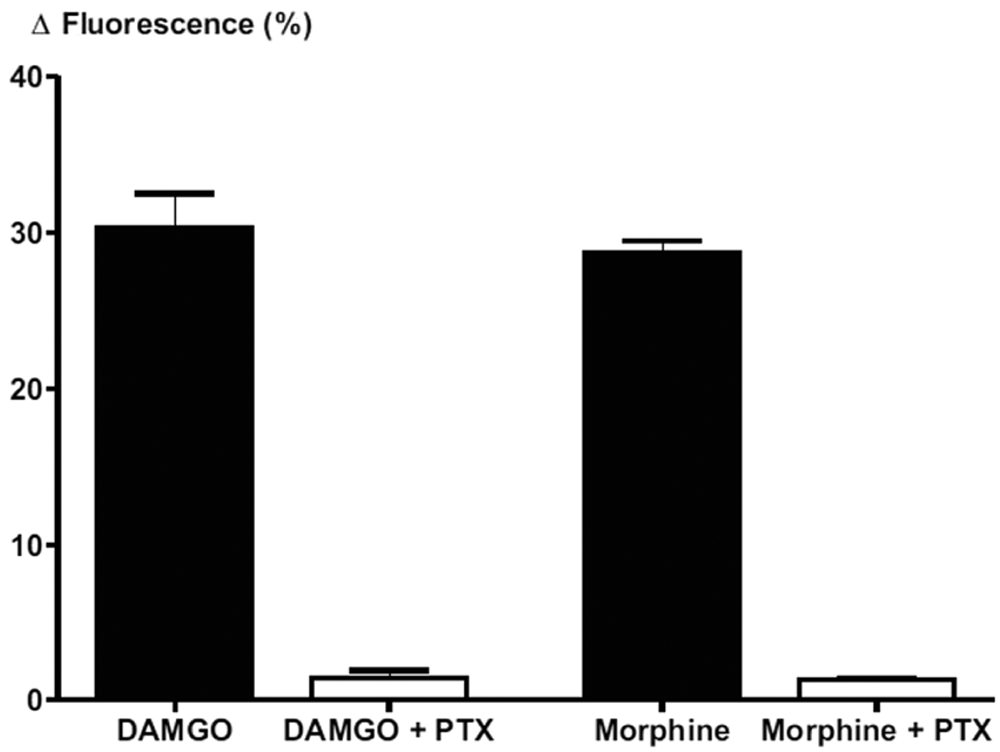
The decrease in fluorescent signal observed with 30 nM DAMGO or 100 nM morphine was abolished following overnight incubation of AtT-20 µ–opioid receptor (MOR) cells with 200 ng/mL pertussis toxin (PTX).
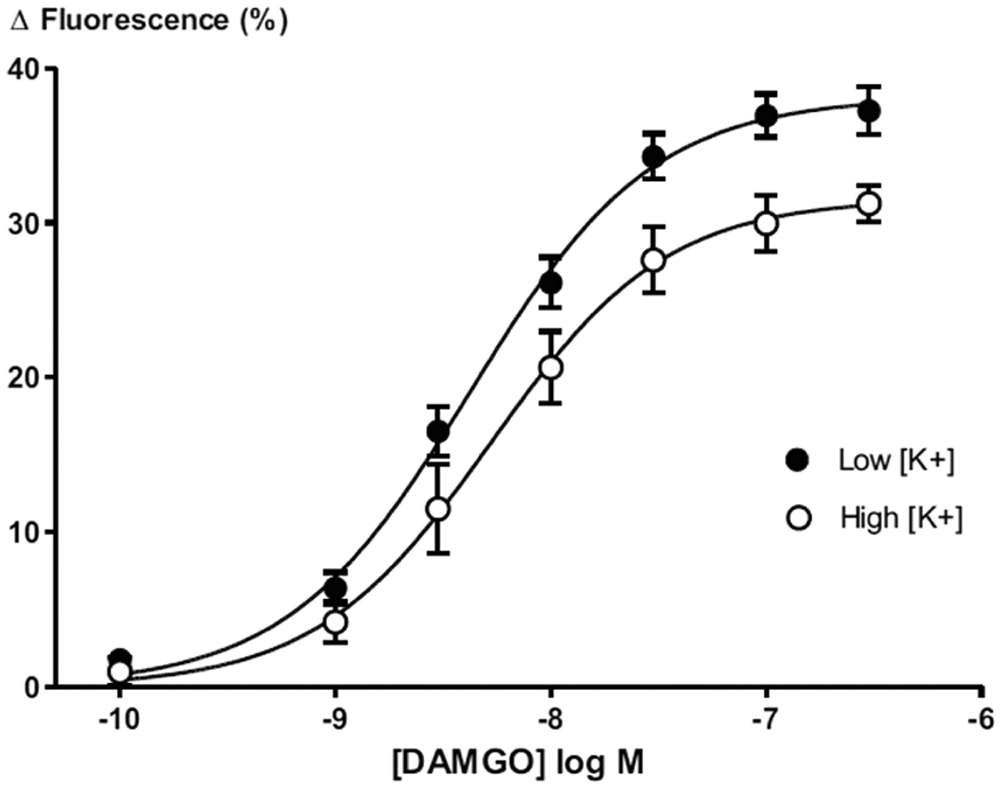
Decreasing extracellular potassium concentration ([K]Ex) increases the maximum change in fluorescent signal observed with DAMGO. Concentration-response curves were generated for DAMGO activation of G-protein–gated inwardly rectifying potassium channel (GIRK) channels in both low [K]Ex (2.9 mM) and high [K]Ex (5.5 mM) conditions. Emax in low [K]Ex was 38% ± 2%, 21% higher than in high [K]Ex (Emax 31% ± 1%; p < 0.01).
The maximum response elicited by DAMGO was similar to that elicited by somatostatin (Emax = 39% ± 3.2%, pEC50 8.7), which acts at endogenous sst2 and sst5 receptors to activate GIRK channels in AtT-20 cells. 15 We independently assessed the changes in fluorescence produced by altering the membrane K+ permeability by incubating AtT-20 cells with nigericin, a potassium-selective antibiotic ionophore. 16 A maximally effective concentration of nigericin (1 µM) produced a decrease in fluorescence signal of 50% ± 3%, which was not decreased any further upon the addition of 300 nM DAMGO. The fluorescent signal observed after nigericin incubation may reflect the signal when the membrane potential of the cells is driven to EK 16 ( Fig. 5 ).
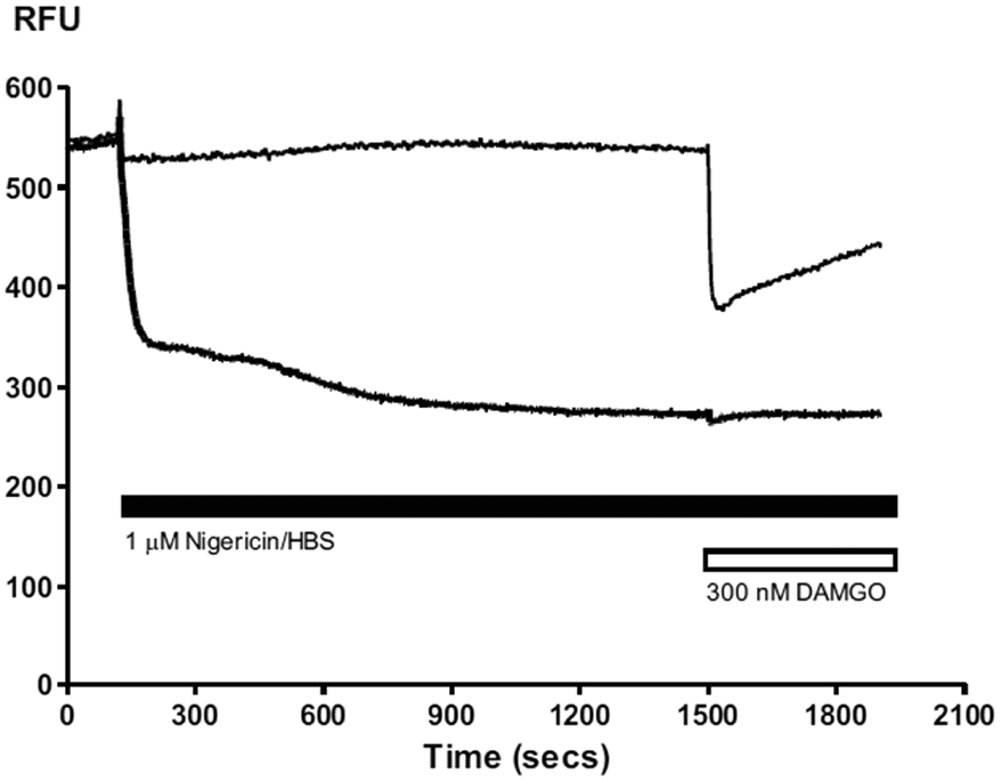
Treatment of AtT-20 µ–opioid receptor (MOR) cells with nigericin, a K-selective antibiotic ionophore, caused a greater decrease in fluorescent signal than the maximally effective concentration of DAMGO (p < 0.05). At 120 s, 1 µM nigericin (heavy trace) or vehicle (light trace) was added to cells. Nigericin caused a decrease of 50% ± 3% in fluorescent signal. Membrane potential was allowed to reach equilibrium before the addition of 300 nM DAMGO at 1500 s, which did not cause any further decrease in signal. RFU, relative fluorescence units.
We assessed the capacity of the fluorescence assay to reliably detect opioid ligands of differing efficacy by treating AtT-20 MOR cells with a range of structurally distinct opioid ligands. All agonists tested produced a concentration-dependent decrease in cellular fluorescence. High-efficacy agonists such as fentanyl, DAMGO, and β-endorphin produced a maximum decrease in fluorescence of 35% to 40%, whereas morphine, buprenorphine, and pentazocine were shown to be partial agonists ( Fig. 6 ). A rank order of ligand efficacy was established ( Table 1 ).
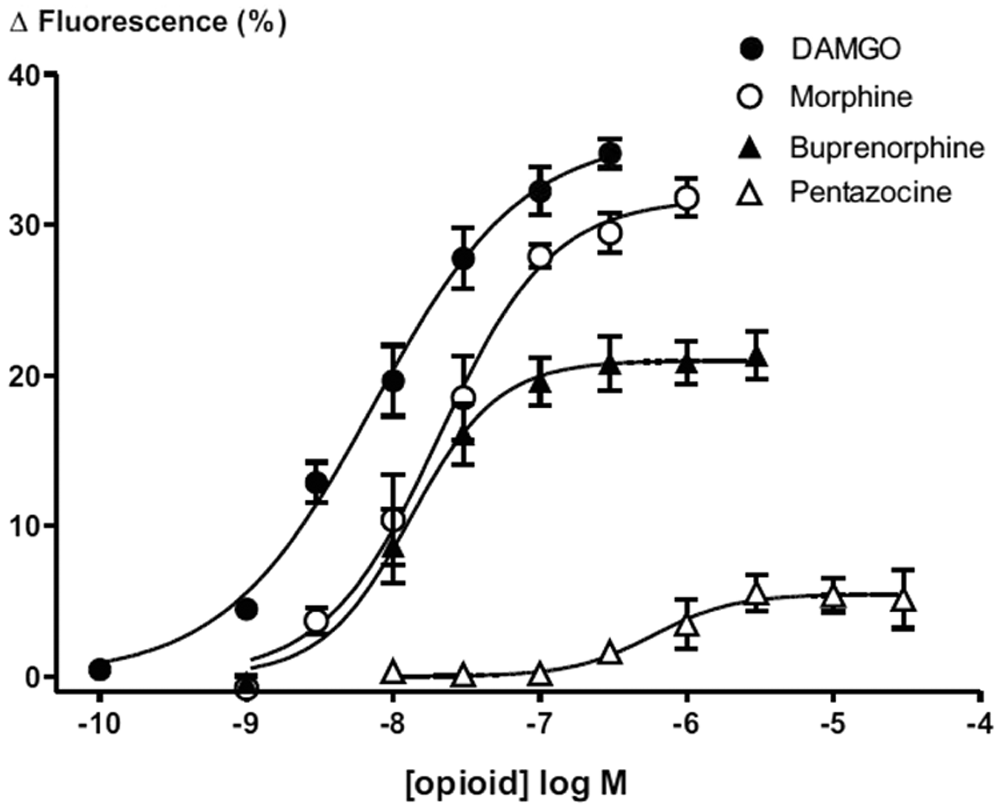
Concentration-response curves for DAMGO, morphine, buprenorphine, and pentazocine activation of G-protein–gated inwardly rectifying potassium channel (GIRK) channels, illustrating the differences in agonist potency and efficacy. Morphine, buprenorphine, and pentazocine all showed partial agonist activity with Emax values of 31% ± 1%, 21% ± 1%, and 5% ± 1%, respectively.
We assessed the suitability of this assay for HTS by calculating the Z′ factor, a measure of the assay robustness. An assay with a Z′ factor of between 0.5 and 1 is an excellent assay in terms of signal-to-noise ratio and data reproducibility. 13 The Z′ factor for this assay was calculated in multiple experiments, with Z′ values of 0.6, 0.7, and 0.7, indicating that the assay is suitable for HTS.
A hallmark of opioid signaling is agonist-dependent desensitization, where continuous application of agonist results in a relatively rapid decline in receptor activation. The decrease in fluorescence produced by application of high concentrations of morphine faded in the continued presence of agonist, reaching a plateau after about 30 min ( Fig. 7A ). To assess whether the decline in fluorescence reflected a change in MOR signaling, we incubated cells with a high concentration of morphine (1 µM) and then challenged them with subsequent addition of 10 µM morphine. The response to 10 µM morphine declined significantly over time. When fit with a one-phase exponential association function, the peak response to 10 µM morphine declined with a τ of 490 s (95% confidence interval [CI], 413–603 s) to a maximum inhibition of 72% (95% CI, 67%–76%; Fig. 7B ). To assess whether the decline in morphine effectiveness reflected heterologous desensitization, we repeated the experiments using 1 µM somatostatin as the challenge drug. The response to somatostatin also declined during continuous morphine exposure (τ of 460 s; 95% CI, 331–748 s); the maximum inhibition of the somatostatin response was 30% (95% CI, 27%–34%). Preincubation with naloxone (1 µM) did not affect the hyperpolarization produced by somatostatin (10 nM; control 36% ± 1%, in naloxone 35% ± 1%).
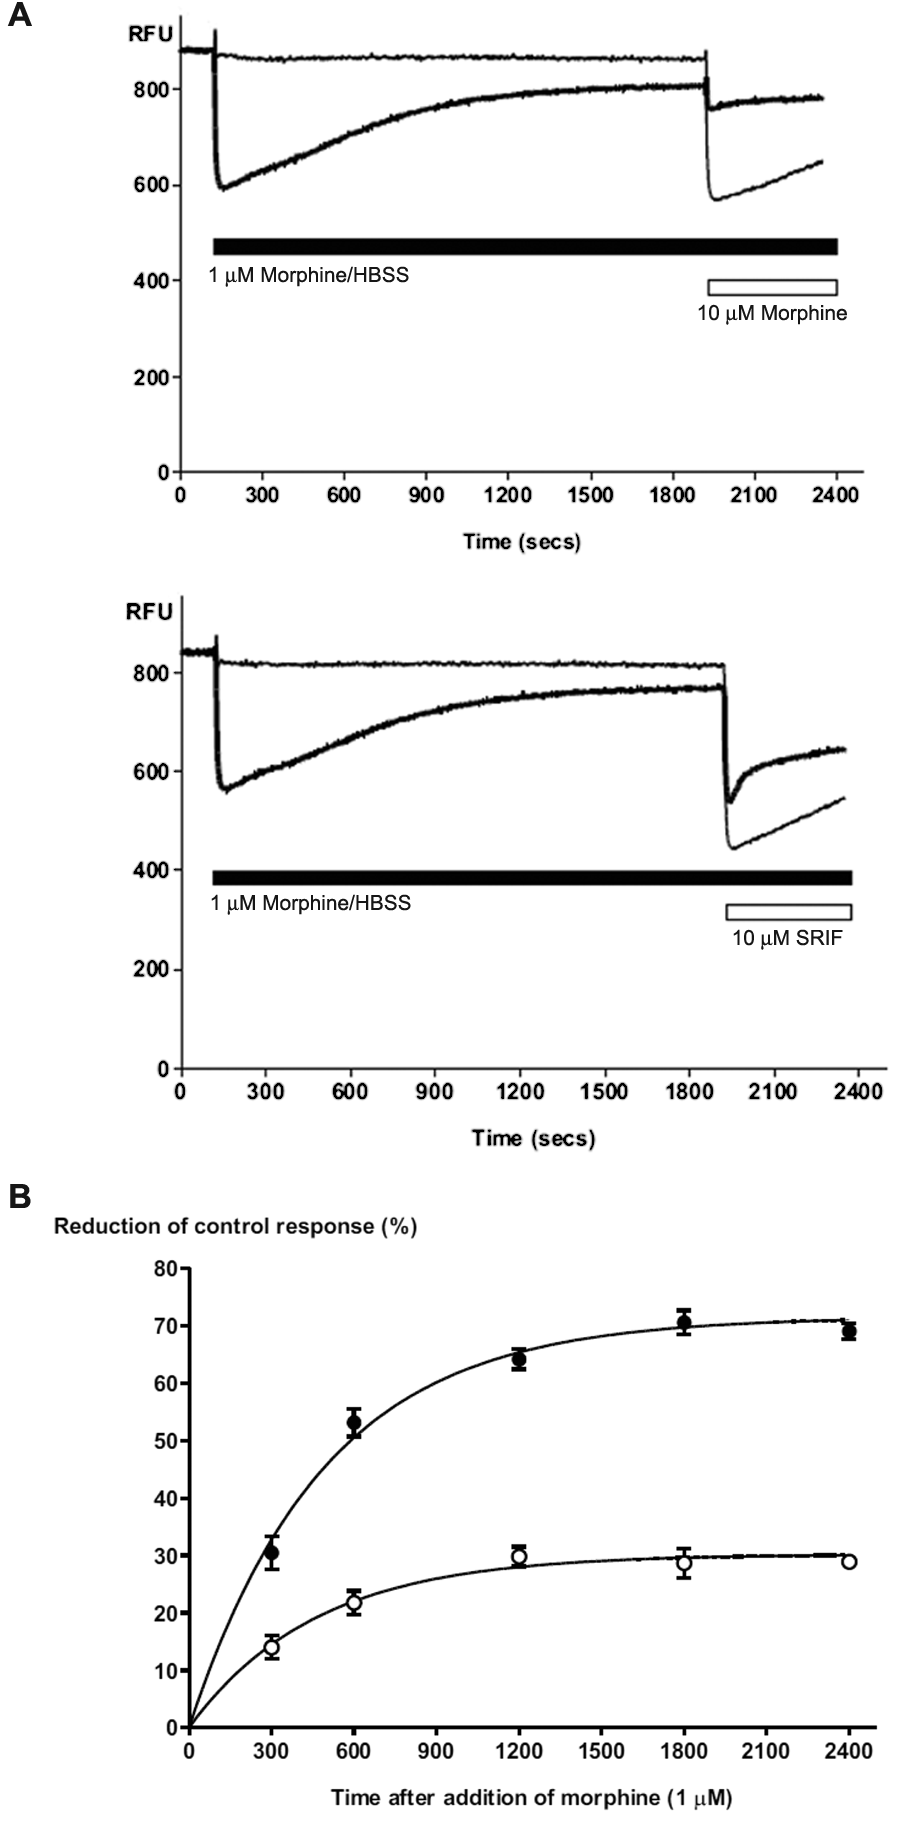
Desensitization of µ–opioid receptor (MOR) signaling in AtT-20 cells. Continuous application of morphine (1 µM) reduces the response to a subsequent addition of a high concentration of morphine or somatostatin (SRIF). Panel
Discussion
In this study, we have developed a real-time, no-wash, fluorescence-based assay for MOR-mediated hyperpolarization of intact AtT-20 cells. We used a proprietary membrane potential sensitive dye from Molecular Devices to measure membrane hyperpolarization following MOR-mediated GIRK channel activation. 12 The fluorescent signal rapidly and reliably decreased after opioid application, and this decrease in signal could be completely reversed by the opioid naloxone applied for up to at least 2 h after agonist, indicating the stability of the dye signal and capacity of the systems to report continued activation of the µ-receptors for prolonged periods, albeit in the face of receptor desensitization. The ability to continuously measure the consequences of opioid receptor activation in cells for such prolonged periods of time has only previously been possible using high-resistance electrode recordings from single neurons in brain slices.7,17 Activation of endogenous sst receptors in AtT-20 cells 15 produced a reduction in fluorescence similar to that seen following MOR activation, and in both cases, this reduction was less than that produced by application of the K-selective ionophore nigericin. 16
The potency and efficacy of the opioid agonists correlate well with previous studies in AtT-20 cells and with studies in native neurons where activation of GIRK channels or inhibition of ICa was used to determine agonist intrinsic activity.11,18–20 The data we obtained with the hyperpolarization assay are similar to what we obtained when we measured MOR inhibition of calcium currents in these cells—the rank order of potency in both studies is DAMGO > methadone = morphine > pentazocine 11 —and in both studies, morphine and pentazocine have reduced efficacy when compared with DAMGO. The only notable inconsistencies are the apparently greater efficacy of endomorphin 1 and 2 compared with methadone in the present study. Many studies have reported the endomorphins as being partial agonists,18,21 whereas methadone has been reported to be an agonist with a similar efficacy to DAMGO.11,22,23 The most likely explanation for the discrepancy in our study is that methadone appeared to have a reduced maximal effect because of its propensity to block K channels, including the GIRK channels likely to contribute to the hyperpolarization measured in the present study.22,24 Conversely, the observation that the maximum effect of the endomorphins was similar to that of well-recognized high-efficacy agonists suggests the presence of some spare receptors in our system, as noted previously with similar cell lines. 11 It is also possible that the efficacy discrepancies reflect subtle bias in ligand signaling to one pathway over another in different tissues, and it is worth noting that endomorphins have recently been reported to show such bias in assays of β-arrestin recruitment.25,26
Continuous application of opioid agonists usually results in desensitization of receptor signaling, a complex process that may involve receptor phosphorylation and sequestration. The apparent stability of the membrane potential assay led us to explore whether it could be used to investigate µ–opioid receptor desensitization. The hyperpolarization produced by high concentrations of morphine or DAMGO appeared to wane over time, and when the cells were challenged with a concentration of agonist that should saturate the cell surface receptors, there was a marked decrease in this response after only a few minutes of exposure to the agonist, consistent with analogous studies performed in locus coeruleus neurons 27 or cell lines transfected with µ–opioid receptors and GIRK channels. 28 We were able to make use of the endogenous sst receptors in the AtT-20 cells to determine whether exposure to desensitizing concentrations of opioid agonist affected signaling through other receptors. The time constant for the desensitization of signaling produced by morphine was slower than that reported in our previous study of opioid signaling, which used inhibition of I Ca in AtT-20 cells, and this may reflect a distinct recruitment of desensitization processes by morphine in intact cells compared with cells dialyzed by patch-clamp recording. 11 A major limitation of using the FlexStation for desensitization assays is the inability to wash off drugs, which makes it impossible to do experiments where receptor function is repeatedly probed with concentrations of drugs that activate only a portion of receptors.11,27 Nevertheless, the potential of this assay to quickly test multiple agonists or putative modulators of receptor desensitization in an intact system makes it an attractive option.
GIRK channel activation has most commonly been assessed using electrophysiological techniques, but assays potentially suitable for HTS have been reported using thallium flux 29 or commercially available membrane potential dyes.30,31 Thallium is toxic and apparently unsuitable for all cell lines, 31 whereas other membrane potential sensitive dyes (Di-Bac, HLB 021-152) give results qualitatively similar to those reported here.30,31 The EC50 value for the somatostatin-induced hyperpolarization of our AtT-20 cells was 2 nM, very similar to that previously reported using another dye (4 nM). 31 However, it should be noted that under our standard conditions, the proprietary dye gives a change in fluorescence of approximately 40% following GPCR activation, which compares with changes of approximately 10% using DiBAC4 in HL-1 or HLB 021-152 in AtT-20 cells.30,31 Removal of media and/or washing the cells is also required during dye loading of commercial dyes used previously, which increases assay time and may promote cell detachment from the microplate wells.31,32
This assay has a number of advantages as a rapid screen for assessing ligand potency and efficacy at µ–opioid receptors. It is rapid and real-time, it only requires the addition of a single reagent, and it is performed in intact cells. When compared with assays of Gα subunit activation—either [35S]GTPγS binding assays or assays that directly measure agonist-stimulated GTPase activity 33 —the GIRK assay is far simpler, requires no handling of radioactivity, and provides a real-time measure of receptor activation rather than a single-point determination. However, the Gα subunit activation assays will provide a more sensitive discriminator of efficacy in cells with a low to moderate expression of receptors because the assay is constrained only by the amount of accessible Gα subunit in the cells, and this is usually not limiting. 33 By contrast, assays of AC regulation via measurement of cAMP accumulation have been adapted for use in whole cells, but these assays usually require incubation steps and either cell lysis followed by addition of several reagents or the use of cells transfected with enzymes, which catalyze the production of a fluorescent substrate or with fluorescently labeled reporter proteins. 10 Assays of AC activity can be very sensitive and also detect cAMP levels over a large range of concentrations, but in general, when assaying the activity of Gi/Go-coupled receptors such as the µ–opioid receptor, it is usually necessary to artificially elevate cAMP levels with forskolin to obtain an appropriate signal window for determining AC inhibition by the Gi/Go-derived Gα subunits. Nevertheless, assays of AC inhibition represent the most flexible and straightforward way of studying Gα (as opposed to Gβγ) signaling in a high-throughput environment.
Although both GTPγS binding and cAMP accumulation assays have been widely used for studying desensitization of opioid receptor signaling, the usual requirement for control cells to be incubated with agonist for at least 10 to 15 min makes interpretation of the data problematic, as receptor desensitization will be occurring during this time (e.g., Fig. 7 ). 7
Other relatively straightforward strategies for real-time measurement of MOR-mediated signaling involve measuring [Ca]i concentration using Ca2+-sensitive fluorescent dyes. This approach provides relatively rapid real-time response, and assays of [Ca]i concentration can be amenable to studying receptor desensitization.34,35 Interestingly, we were unable to activate intracellular Ca release in AtT-20 cells via MOR or any of the Gαq receptors reportedly expressed in this cell line 36 (data not shown).
This assay offers an alternative approach for measuring MOR activation and desensitization by targeting a naturalistic Gβγ-mediated signaling pathway. Our results show the membrane potential assay to be a rapid, reliable, and inexpensive method for identifying ligands that modulate GIRK activity and may be scaled up to enable HTS for novel opioid drugs.
Footnotes
Declaration of Conflicting Interests
The authors declared no potential conflicts of interest with respect to the research, authorship, and/or publication of this article.
Funding
The authors disclosed receipt of the following financial support for the research, authorship, and/or publication of this article: AK and MS were supported by MQRES scholarships, with top-ups from ASAM. PRB was an ASAM Summer Scholar. This work was supported by NHMRC Project Grant APP1011979 to MJC and MC.