
Abstract
Early drug discovery laboratories often call for the precise weighing of 1- to 5-mg solids into 4- to 5-g glass vials. For the balance used in this study (Mettler Toledo XP205), the manufacturer rates its accuracy at ±0.01 mg over the working range of 1 mg to 220 g and its precision or repeatability at 0.015 mg for 10-g weights. The manufacturer ratings were confirmed using standard steel weights, but these calibrators do not well represent the weighing precision of drug compound. For example, when pre-taring a 4- to 5-g vial on the balance and then weighing 1- to 5-mg calibration weights, although no bias was observed, precision dropped appreciably. When measuring solid sample in the range of 1 to 5 mg, deviation of the measured weight from the actual (true) weight was even worse, in the range of ±20% to 50%. Balance settings and environmental factors exert a strong influence on weighing precision. Although most environmental factors, such as air draughts, temperature, vibrations, and levelness, can be optimized to the extent practical in laboratory settings, problems due to static electricity are often overlooked. By controlling static electricity, we demonstrate how we optimized the process to where measurements were within ±10% of actual weight when weighing solid sample in the range of 2 to 5 mg and ±20% when weighing 1 mg into a 4- to 5-g vial. Our weighing process and method to calculate actual weight are given in detail.
Introduction
The key to a good compound management (CM) laboratory is in the quality of the storage and dispensation of compounds. A rigorous quality assurance (QA) program is nowadays the norm for all types of liquid-handling equipment used to prepare and dispense compound solutions. One or more analytical quality control steps may also be in place to measure purity, identity, stability, and concentration of compounds in solution. One quality measurement that is often overlooked in the entire CM process is the precision when weighing the initial solid. The most common process involves weighing between 1 and 5 mg solid sample into a glass vial weighing 4 to 5 g or a plastic tube weighing 0.7 to 1 g. Measurements are made with high-performance balances, usually rated to 0.01 mg accuracy. ISO 9000 procedures recommend calibration of balances with externally certified calibration weights close to normal requirements. 1 In our laboratory, balances are calibrated using standard steel weights of 10 mg to 2 g. These calibration tests do not take into account the scale settings, environmental factors, or the actual process of weighing compounds of various consistencies, nor do the tests include taring a 4- to 5-g glass vial in which compounds are collected. The calibration tests ensure solid internal scale functionality in terms of accuracy of measurement, but they do not give any indication to the precision of the actual CM weighing process.
Our experimental goal was to optimize conditions so that the total deviation (includes both bias and precision) of the measured weight from its actual value is within ±10% when weighing solid sample in the range of 1 to 5 mg into a 4- to 5-g vial.
A majority of GlaxoSmithKline’s (GSK’s) discovery compound stocks for screening are prepared as 500 to 900 µL at 10-mM solutions in 2D-barcoded tubes. For a compound with a molecular weight of 500 Da, this would require 2.5 to 4.5 mg solid to be dissolved in 500 µL solvent. The standard process for preparing the 10-mM solutions involves weighing the solid aliquot into a 4-mL glass vial, mixing (Covaris, Woburn, MA), and then transfer into a plastic 2D-barcoded tube (Abgene, Portsmouth, NH). We rarely weigh directly into the plastic tubes. However, in those seldom cases when we do, even though the plastic tubes are much lighter (~0.7 g) compared with the glass vials (~4 g), compounds cling to the side of the tube, and the balance reading fluctuates much more than when using the glass vials. All studies presented herein focus on our main process, which involved weighing the solid aliquot into a 4-mL glass vial.
A smaller but significant portion of solid weighing requests are for 1 mg, which are sent directly to an assay scientist. These are also processed in 4-mL glass vials. An investigation of all compound weighings in the CM laboratories at GSK over a period of 3 months has shown that more than 80% of solids requested and weighed were within 1 and 5 mg. All the experiments described herein focused on this weight range.
The weighing precision of solid sample may be affected by several environment- and process-related factors, such as air draughts, temperature changes, electrical and electromagnetic interference, magnetism, levelness, vibration, and static electricity.2,3 Some of these factors such as temperature, levelness, and vibration are usually sufficiently controlled through laboratory environmental controls, scale balancing mechanisms, and the use of stable surfaces and/or marble slabs, respectively. Some factors such as air draughts, magnetism, and electromagnetic interference are harder to control due to the confinements of laboratory space and laboratory protocol. For example, for safety reasons, in our laboratory, all samples are collected and weighed within an air hood with a consistent inward flow of air, which is a source of air draughts. Scales might also be placed near machinery that may cause electromagnetic interference or exhibit magnetism. Some steps may be taken to address these specific problems—for example, scales may be placed further from high electromagnetic fields, and problems with air currents may be reduced by using scales with doors. These factors are inherently present in the laboratory weighing environment and may only be reduced but not eliminated.
Static electricity also poses problems when weighing. 4 Empirical observations indicated that for compounds with a tendency to fly off the spatula and cling to the sides of a vial, the scales took much longer to stabilize. Occasionally, the scale displayed a negative value after taring the balance and then adding some of these flocculent compounds. The measurements from samples collected in high-static environments should not likely be trusted.
We took the following stepwise approach to meet our experimental goal by assessing and improving weighing precision in our laboratory, even for flocculent solids.
Minimized the effect of as many environmental factors as possible. Balances were positioned on fixed benches on marble slabs, far from moving machinery. Balance doors were always closed to minimize air draughts when weighing.
Determined the optimal balance settings in our laboratory conditions and process using calibrated weights.
Implemented antistatic devices and vials to reduce the effect of static electricity.
In this article, the total deviation of the sample weight from its actual value, measured for weighing a 1- to 5-mg calibration weight into a 4- to 5-g glass vial, is shown. A description of the method developed to measure this deviation is given. Next, the results of weighing a solid compound prior to controlling for static are presented. Finally, the various approaches to control for static electricity (the most influential factor after controlling for other environmental factors and balance settings) are discussed along with the detailed results obtained after applying antistatic devices in our quest to reach the goal of ±10% deviation of measurement from its actual value for 1- to 5-mg weighings.
Materials and Methods
Materials
Compound Selection
Tartrazine (MP Biomedicals LLC, Solon, OH) was selected for this experiment since it is a standard dye used in liquid-handling QA with limited safety concerns and has a good linear dynamic range in a UV/Vis reader. The solid compound is bright yellow-orange in color, so any gross errors can be easily seen by the operator. It is also relatively difficult to weigh because it is flocculent, exemplified by the fact that it readily flies off a metal spatula and clings to the sides of a glass vial.
Weighing Equipment
Several Mettler Toledo (Columbus, OH) XP205 Analytical Balances were employed in the experiments listed in this article. These are the scales used to weigh all solid samples that progress through GSK’s Sample Management Technologies laboratories. The display resolution of the XP205 balances is d = 0.01 mg. If calibration is well performed, the accuracy of the scale should be within ±1 display resolution. Thus, 1 mg, weighed infinitely often, will show an average weight between 0.99 and 1.01 mg. The manufacturer rating for repeatability of these balances is 0.015 mg for 10-g weights and 0.03 mg for 200-g weights. Repeatability is sometimes referred to as standard deviation of a set of similar weight readings.
The XP205 scales have two sets of programmable settings for value release and environmental factors and were set to “fast and reliable” for value release and “standard” for environmental factors (see “Calibration Weight Test” section). Each scale was placed on a marble slab (which in turn sits on a marble bench) that dampens vibration. Each scale is equipped with a standard air hood to allow weighing of compounds with unknown safety profiles. For safety reasons, all weighing technicians wear nitrile gloves for protection.
Vials
Barcoded Tradewinds vials (TWD Tradewinds, Pleasant Prairie, WI) and non-barcoded Wheaton vials (Wheaton Science Products, Millville, NJ) were used in our studies. They are both 4-mL glass vials, each weighing 4 to 5 g when empty. These are two vial types most frequently used by GSK for weighing solid samples. Empirically, the etched Tradewinds vials seem easier to weigh into than the Wheaton vials, as flocculent compounds appear to cling less readily to the Tradewinds vials than to the Wheaton vials, allowing balances to stabilize faster. This phenomenon could be due to the glass manufacturing process, the etching process, the capping process (Wheaton vials only), or the packing container. Wheaton vials arrive packaged in coarse cardboard and may be purchased precapped or uncapped. Tradewinds vials are packaged in a smooth, wax-finished cardboard, uncapped.
As the process of uncapping a Wheaton vial appears to induce static electricity buildup, experiments were run with both capped and uncapped Wheaton vials. We empirically determined that the uncapped Wheaton vials were easier to weigh into than capped Wheaton vials, as balances seemed to stabilize faster and fluctuate less. Purchasing the vials and caps separately was also slightly more economical. At the time of this writing, there is a significant price differential between the barcoded Tradewinds vials and the less-costly non-barcoded Wheaton vials.
Spatula
A standard metal spatula was used for sample collection and transfer. Empirically, no difference was noticed between various metal spatulas, and so that was not included as a potential source of static in this study.
Antistatic Devices
Several devices were selected for this study from the many options identified through Web searches, consultation with balance manufacturers, members of the control engineering group at GSK, and colleagues from CM groups at other pharmaceutical and biotechnology companies. The devices listed below were the ones we considered most appropriate for testing our process and achieving our goals, but these are certainly not the only options available.
ESD Tabletop Fan Model 5802i (E&S Technologies, Chelmsford, MA)—The ESD tabletop fan blows ionized air to neutralize a charged object placed in the air flow path within less than 20 inches of the fan. In this experiment, the fan blew ionized air onto the vials to neutralize static charge before compound dispensing.
ESD External Fan Model 5810i (E&S Technologies)—This fan is basically a larger version of the ESD tabletop fan. In this experiment, this fan was used to neutralize the static in the general laboratory environment.
Point ionizer (Mettler Toledo, Columbus, OH)—Integrated specifically with the XP205, the point ionizer is programmed to ionize the scale chamber after the doors close for a certain length of time (factory settings are 5 s). In this experiment, the ionizer was used according to its factory settings.
ESD antistatic gloves—These are polypropylene gloves used for handling electronic circuits and microchips. Since they do not meet chemical safety standards, these are to be worn over nitrile gloves.
Faraday Clip (Mettler Toledo)—This is a metal cage used to hold vials that cannot stand on their own. It is not intended to be an antistatic device, but it offers more grounding surface, which decreases the effect of static. In this experiment, the clip was centered on the scale and acted as a basket for the vials.
Experimental Methods
Calibration Weight Test
Standard metal calibration weights (1, 2, 5, and 10 mg) were used to determine optimal balance settings and weighing precision without the influence of static electricity. The experiment included four different balances in two laboratories within the same building. Each balance was tested at the four speed settings (fast, reliable and fast, reliable, very reliable), in both the basic calibration process and a method designed to simulate standard laboratory procedure. The basic process mimics the regular calibration performed on each balance and consists of zeroing the balance, putting the calibration weight directly on the scale, and recording the weight. The simulated standard laboratory procedure includes a 5-g weight (mimics a compound glass vial) put on the scale, zeroing the scale, removing the 5-g weight, and then measuring the calibration weight on top of the vial simulation.
Standard Curve
A tartrazine standard curve was prepared to back-calculate concentrations of solutions made of weighed solid samples. The standard curve was prepared from a 10-mg/mL tartrazine stock solution in DMSO. The stock solution was made by weighing 4000 mg, a highly reliable target, and diluting the solid in 400 mL DMSO. After the solid was solubilized using thorough mixing, 50-mL dilutions of the stock solution were prepared at the following concentrations: 0.2 mg/mL, 0.4 mg/mL, and 0.6 mg/mL. These three standards in the 0.2- to 0.6-mg/mL range were used with every experiment described herein. The nominal final concentrations of the weighed tartrazine samples (see solution preparation for weighed tartrazine samples below) were 0.1 mg/mL for the 1-mg weighings and 0.5 mg/mL for the 5-mg weighings. Although the standards run with every experiment do not fully cover the sample range, the curve was validated multiple times to be linear (R2 > 0.99) in the 0.01- to 1.25-mg/mL range.
Using a Tecan Genesis Freedom liquid handler (Tecan Group Ltd., Männedorf, Switzerland), eight replicates of 50 µL of each standard curve dilution were transferred from vials into a 96-well UV-readable plate (NUNC polystyrene, cat. 269620) using a Tecan liquid handler. The plate was then read using a Tecan Genios Pro reader (Tecan Group Ltd.). A linear regression model was fitted through the standard curve dilution points and used to back-calculate the dye concentrations for all weighing experiments.
At GSK, we routinely perform a series of QA steps to ensure the quality of the liquid-handling equipment in the CM laboratories. Tecan liquid handlers are tested for both accuracy and precision of dispensing 5 µL and 50 µL DMSO, respectively, from vials into 96-well and 384-well plates. The accuracy measurement involves weighing an empty plate prior to dispensing and postdispensing solutions on the liquid handler with a specification limit of <5%. To qualify precision, we compute the %CV (coefficient of variation) of measured signal on the UV reader after dispensing a 5- or 50-µL volume of a dye solution in each well of the 96- or 384-well plate, with a specification of <10% for 5 µL and <5% for 50 µL. These specification limits are similar to previously published data, 5 and all of our Tecan liquid handlers generally perform well within these limits.
A known property of DMSO is its ability to absorb water from the air. Given that we are using DMSO solutions in this study, it is reasonable to ask whether water absorption might influence the results. In our laboratory, we measured water absorption in DMSO using an Echo 550 acoustic dispenser (Labcyte, Sunnyvale, CA). Over a period of up to 8 h, the amount of water absorbed in DMSO was less than 1% of the total volume in each 30-µL well of a lidded 384-well plate (unpublished data from our laboratory), which is much lower than any bias noted in this study.
Solid Weighing
To replicate the standard weighing process used in our laboratories, solid samples of tartrazine were weighed out in a 4- to 5-g vial. A total of 40 samples were weighed for each target weight (1, 2, 3, 4, or 5 mg) within each experiment. All samples were handled using the same generic procedure in which powder was added or removed by spinning a metal spatula inside a 4-mL vial and then gently tapping the vial on the laboratory surface before being placed on the scale.
To eliminate time bias, scale bias, and bias across a target weight, the weighing technician would weigh out one sample of each target weight (1, 2, 3, 4, and 5 mg) on one scale. After the weighing technician finished one set on the first scale, he or she would move on to the next scale and process another increment of five, and so on until all 40 replicates were completed. In the case where the experiment was performed with only one scale, a similar procedure was followed.
Each of the weights recorded by the balance had to be within ±10% of the target weight. For example, for a target weight of 2.00 mg, solid would be added to or removed from the vial until the balance reading stabilized in the range of 1.80 to 2.20 mg. The balance weight was then recorded for each sample.
Each weighed tartrazine sample was diluted in 2 mL DMSO, then sonicated using a Covaris E100. After the solutions were thoroughly mixed, they were transferred from the vials onto a 96-well UV plate using the Tecan Genesis and diluted 5× in DMSO (10 µL solution: 40 µL DMSO). The final nominal concentration of these solutions was between 0.1 mg/mL (1 mg solid weighing) and 0.5 mg/mL (5 mg solid weighing). Finally, the plates were mixed using a plate shaker, spun in a centrifuge to remove any air bubbles, and read using the Tecan GeniosPro UV reader.
All solid weighing tests were performed as described above, with the only difference being either the vial type (barcoded Tradewinds vials or non-barcoded Wheaton vials) or the presence of various combinations of antistatic devices.
Data Analysis
Experiments were designed so that one could estimate the quality of a measuring procedure (e.g., using Tradewinds vials). Given a target mass (Target Mass) between 1 and 5 mg for the tartrazine dye, each weighing provided two outcome variables: the mass reading from the Mettler Toledo scale (Scale Mass) and the mass reading from the standard curve (Actual Mass). The goal of the experiments was to determine a measuring procedure for which the Scale Mass and Actual Mass values were very close, across the range of target mass values. We define Percent Relative Difference between the two mass measurements as 100% [(Actual Mass) – (Scale Mass)] / (Scale Mass) and Absolute Percent Relative Difference as the absolute value of Percent Relative Difference.
To carry out statistical analyses, a linear model was fitted to link Scale Mass to Target Mass. A second linear model was fitted to link Actual Mass to Target Mass. Separate standard deviation values were estimated for each linear model. Because both Scale Mass and Actual Mass were measured on the same weighing sample, the correlation between them was also estimated. A repeated-measures linear model was jointly fit to link (Scale Mass, Actual Mass) to Target Mass assuming that the errors were bivariate normally distributed with zero-mean vector and with an unstructured variance-covariance matrix. The model fitting was performed using the BUGS software via the BRugs library in R 2.12.0.6,7
By sampling from the posterior distribution of the model coefficients, the BUGS-based statistical analysis provided a means to estimate the probability that a particular measuring procedure would result in an Absolute Percent Relative Difference of less than 10%, 20%, and 30%. In addition, the analysis provided 95% credible-interval (the Bayesian equivalent to a confidence interval) bounds for Percent Relative Difference measurements; that is, the intervals contain 95% of future Percent Relative Difference values.
Results and Discussion
As previously described by Burgess and McDowall, 2 the main factors that influence weighing precision are air currents, temperature changes, electrical interference, levelness, vibration, magnetism, and static electricity. The first step in our quest to improve the weighing precision involved setting up the laboratory such that all factors listed above were controlled and their influence was reduced. Although not described in detail here, these are very important steps. Placing the balances on marble slabs and fixed laboratory benches, as far as possible from pieces of automation or any other magnetic- or electric-field generating equipment, and ensuring that air flow is minimized through balance enclosures are both important factors. All experiments in this study describe the fine tuning of the weighing process through the control of balance settings and static electricity, but control of the other factors is crucial.
Initially, it empirically appeared that the goal of the measured weight being less than 10% away from its actual value was not met. Prior to measurements with the photovoltaic meter, it was hypothesized that static electricity had a significant impact on solid weighing. It was the most evident problem in weighing flocculent solids (commonly obtained through freeze-drying of water-based chromatography purification fractions), which would often fly off the weighing spatula and adhere to the sides of the destination vial. This made solid handling difficult and time-consuming (balances would take a lot longer to equilibrate), and it resulted in loss of material. It was noted that getting the solid off the sides of the vial and into the base of the vial seemed to be improving at least the speed at which the balance equilibrated. Tapping the vial gently on the bench or with a spatula helped with some of the solids, but it did not always work with flocculent ones. Using an antistatic gun prior to tapping a vial containing flocculent solids helped the solid clinging to the sides of the vial fall down to the bottom. Most antistatic guns are rated by their manufacturers for only 1000 shots and are relatively costly. Also, there is not an easy way for the weighing technician to know when the 1000 shots have been reached. Because of these considerations, we decided that using these devices was not the preferred way forward.
To confirm that static electricity plays a big role in solid weighing, a photovoltaic meter (a device used to measure electricity in an area) was used to measure the amount of static throughout our laboratory. The test showed that prior to implementing any static-control measure, the most abundant amounts of charge were in the Wheaton vial itself (0.5–2.0 kV) and the glove-to-vial contact (1.0–8.0 kV). Also, capping or uncapping a vial, the static reading rapidly rose from ~0.5 to 2.5–3 kV. It also appeared that multiple weighings led to the increase in static with each addition/subtraction of compound to the vial. This very simple test proved to us that focusing on reducing static was the right approach to increase weighing precision.
Instead of putting emphasis on pinpointing all sources of static and determining effects, our approach was to focus on eliminating static as much as possible in the weighing process. Some static sources were determined to establish the most effective solutions. For example, in the winter when the heat is turned on, the air tends to be drier; low air humidity results in higher static (a good explanation for why that is can be found at www.sciencemadesimple.com/static.html), so if humidity is not properly controlled, weighing precision worsens during those time periods. However, by focusing on static elimination instead of the source, the results would not necessarily be dependent on time and seasonal variations. With these goals in mind, various antistatic solutions used across many industries were researched, and several devices were selected for predicted effectiveness and practicality in the laboratory-specific process.
Calibration Weight Test
The Mettler Toledo XP205 balances have four speed settings: fast, fast and reliable, reliable, and very reliable. In our first experiment, we determined the optimal speed setting that was both practical in terms of balance equilibration time, as well as giving the best weighing precision. Standard calibration weights were used because they are made of metal, which conducts energy, and they are not influenced by the presence of static in the environment or containers.
A 1-mg standard weight was weighed 10 times on five scales at each balance setting. Figure 1 and Table 1 show the results of the speed-setting investigation. All settings yielded results within the reported accuracy for the XP205 balance of ±0.01 mg, but the “fast” setting gave the most imprecise results, so it was rejected immediately. Of the remaining three available settings, “fast and reliable” gave acceptably precise measurements (standard deviation no more than 0.011) and equilibrated faster (8 s) than the “reliable” setting (13 s) and more than twice as fast as the “very reliable” setting (18 s). The “fast-and-reliable” setting was selected for all subsequent experiments on all balances. No significant scale-to-scale differences were noted.
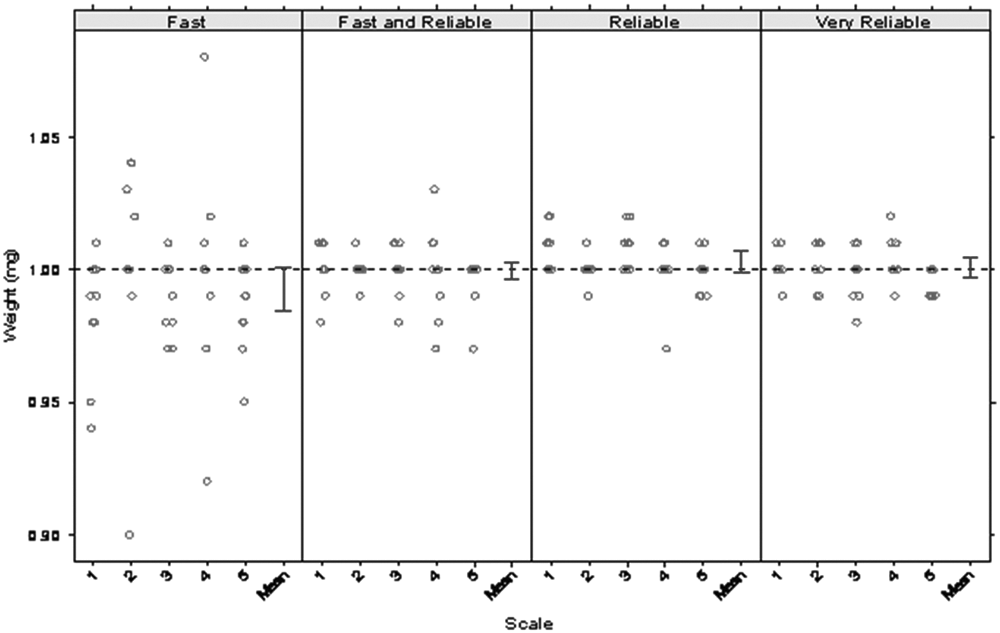
Speed-setting test of 1 mg standard weight on five individual balances in two different laboratories, with independent measurements taken over 12 different time periods.
Mean, Standard Deviation, and Timing Values of 1-mg Weight from Speed-Testing Experiment
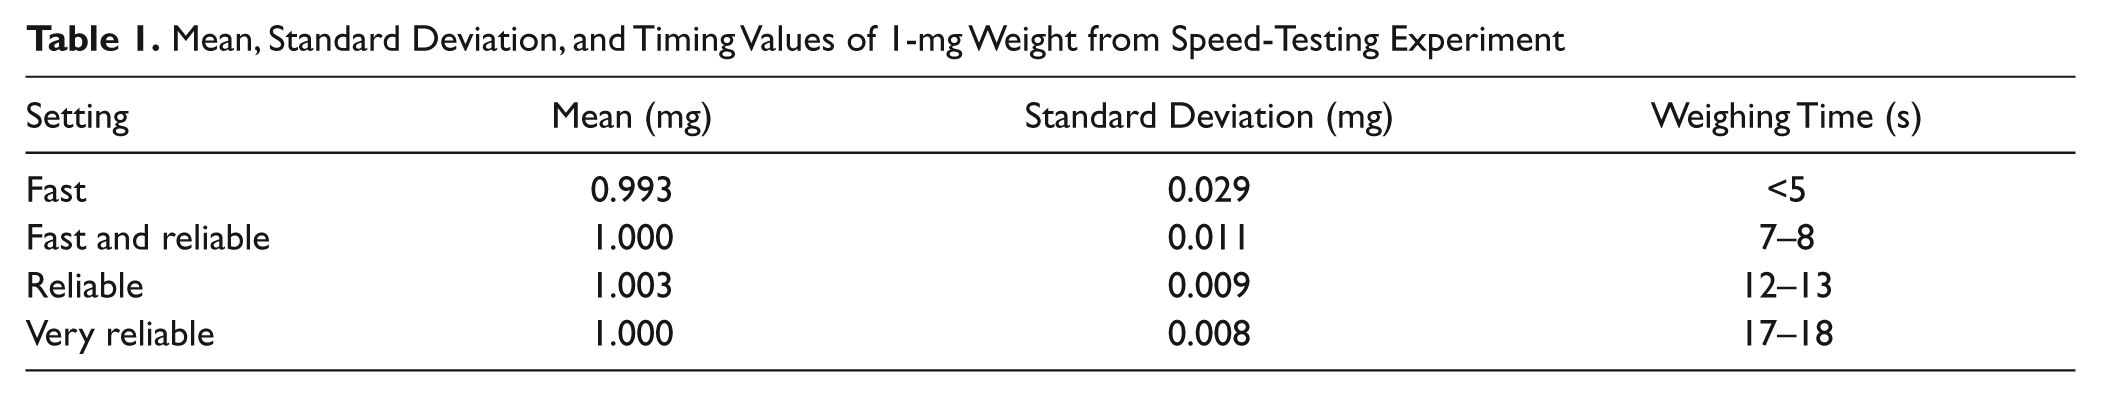
To simulate standard laboratory procedure for weighing solids, the next experiment included adding a 5-g standard weight to mimic the presence of a glass vial. Four standard calibration weights (1, 2, 5, and 10 mg) were each weighed five times on four scales, with and without the 5-g simulated vial. Taring using the simulated vial was performed as described in the experimental section.
The two panels in Figure 2 represent calibration with and without simulated vial taring. The four columns in each panel represent four different scales. The simulated vial taring procedure yielded accurate results and a standard deviation of about 0.045 for each of the weights tested, giving a total deviation of ±0.10 mg (which is 10% of 1 mg) from the known weight of the calibration standard.
Weighing precision of calibration weights with (left) or without (right) a 5-g tare weight across four different scales physically located in two different laboratories.
As before, this experiment demonstrated that there are no significant scale-to-scale differences and that all scales perform within their specification limits. It also confirmed that the environmental factors (apart from static, which is not an influence since metal weights were used) are sufficiently controlled within our laboratory environment to achieve the required 10% or better deviation from a target weight between 1 and 5 mg. All subsequent experiments focused on measuring and controlling the static charge in the process when weighing real compounds.
Noncontrolled Solid Weighing
“Worst-case scenario”
At the beginning of this study, two types of vials were commonly used at GSK: pre-barcoded 4-mL Tradewinds vials (purchased uncapped) and standard 4-mL Wheaton vials (purchased precapped). The weighing technicians noted that solids were more likely to cling to the sides of the Wheaton vials, resulting in longer balance equilibration time. The Wheaton vials, however, were significantly less expensive than the Tradewinds vials, so the precapped Wheaton vials were chosen for the initial precision study.
The weighing of the flocculent compound tartrazine into precapped Wheaton vials with no attempt to control static electricity was called the “worst-case scenario.” Two hundred samples were weighed under this scenario, 40 of each of the 1-, 2-, 3-, 4-, and 5-mg target weight, on four different balances.
Figure 3a shows the estimated probability that the actual mass is within 10%, 20%, or 30% of its scale measurement without any static control devices. For example, if a 5-mg weight is recorded on scale 1, there is a 0.4 probability (i.e., a 4 out of 10 chance) that the actual mass is within 10% of 5 mg (4.5–5.5 mg), a 0.93 probability that it is within 20% of 5 mg, and with near certainty (1.0 probability) to be within 30% of 5 mg. Figure 3b shows the estimated % relative difference with 95% confidence intervals over the range of 1 to 5 mg.
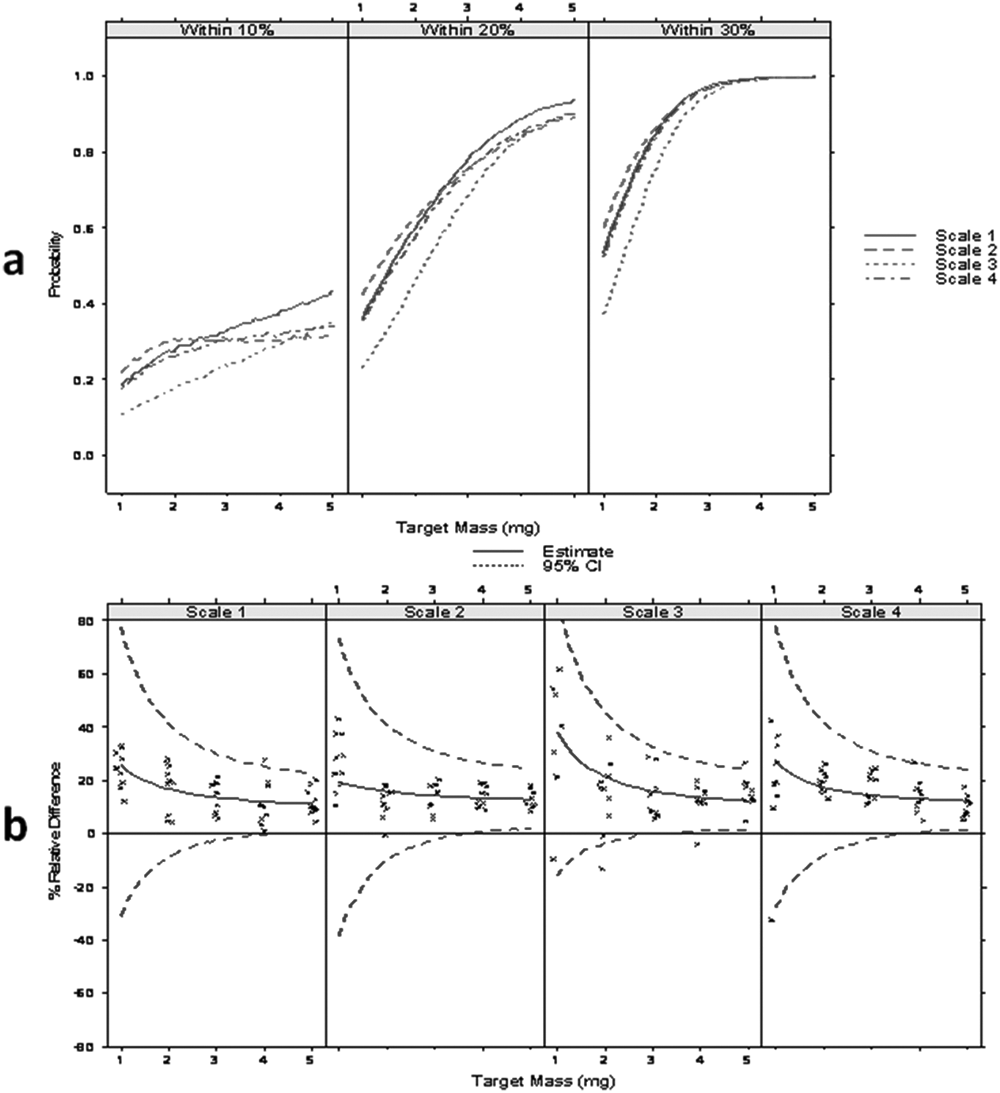
(
Unfortunately, the goal of less than 10% deviation from actual weight of the measurement for any sample in the 1- to 5-mg range was not met. Absolute mass difference does not rise linearly with target mass, which results in improved relative bias and precision of weighing as target mass rises. For example, although scale measurements of the 1-mg target weight came within 30% of actual mass with only a 0.6 probability, scale measurements of the 5-mg target weight typically came within 20% of actual mass. In Figure 3b , percent relative difference diminishes as the mass gets larger.
In Figure 3b , it is seen that more than 95% of the samples were negatively biased, meaning that the actual mass of the sample was consistently lower than the scale measurement showed. In recently published literature on the topic of compound quality in early drug discovery, 8 the same trend was noticed. In that experiment, when concentration measurements were performed on solutions that were supposed to be exactly 10 mM, the distribution of concentrations measured peaked at values lower (8–9 mM) than the 10 mM prepared. Presumably, the negative bias of the weighing precision shown in Figure 3b is at least one of the causes.
Figure 3b also shows that the observed and estimated results and the 95% confidence interval for the % relative mass difference are equivalent for 4 and 5 mg. As previously shown, balance-to-balance differences were considered inconsequential. All further experiments only covered the 1- to 4-mg range and were performed on a single balance.
Tradewinds versus Wheaton vials test
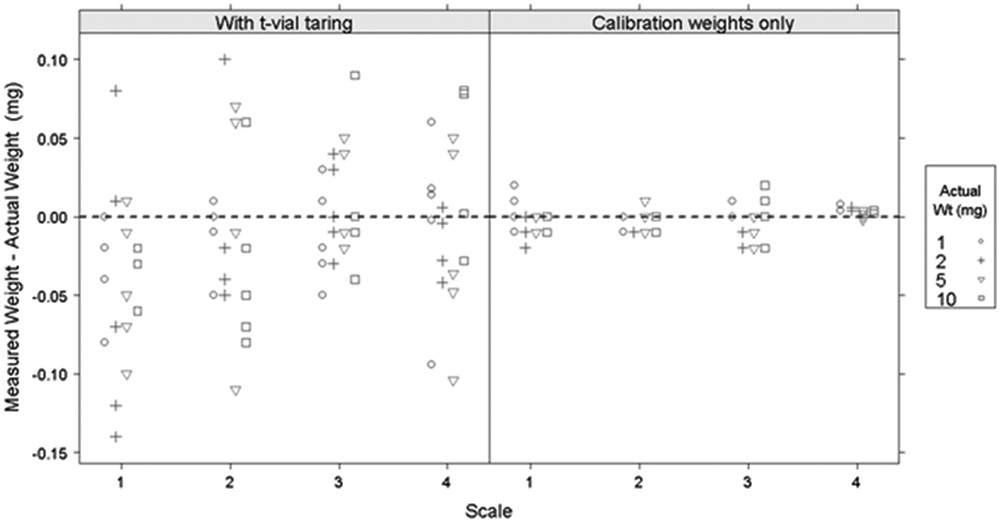
To verify our hypothesis that the Tradewinds barcoded vials had less static charge than the Wheaton non-barcoded vials, we ran a test with the two vial types side by side. One hundred sixty samples were weighed, with 20 measurements for each of the 1-, 2-, 3-, and 4-mg target weights for the two vial types. These experiments were performed on one balance.
Figure 4a , b shows that the deviation of the measured weight from actual weight into Tradewinds vials was, by a large margin, smaller than that from using precapped Wheaton vials. For the Tradewinds vials, with high probability, the scale measurement and the actual measurement fell within 20% of one another. We were unable to pinpoint the difference between those two vial types that could explain the data; however, we do list some possibilities. The barcoded Tradewinds vials go through an etching process step, the two vial types are packaged differently (cardboard boxes for Wheaton vials, shrink-wrapped plastic boxes for Tradewinds vials), and Tradewinds vials arrive uncapped, whereas the Wheaton vials are capped. The glass composition could not be verified with the manufacturer but could be another source for the differences. Rather than focus on efforts on sorting through these differences, we decided to focus on efforts to minimize the existing static in any kind of vial type.
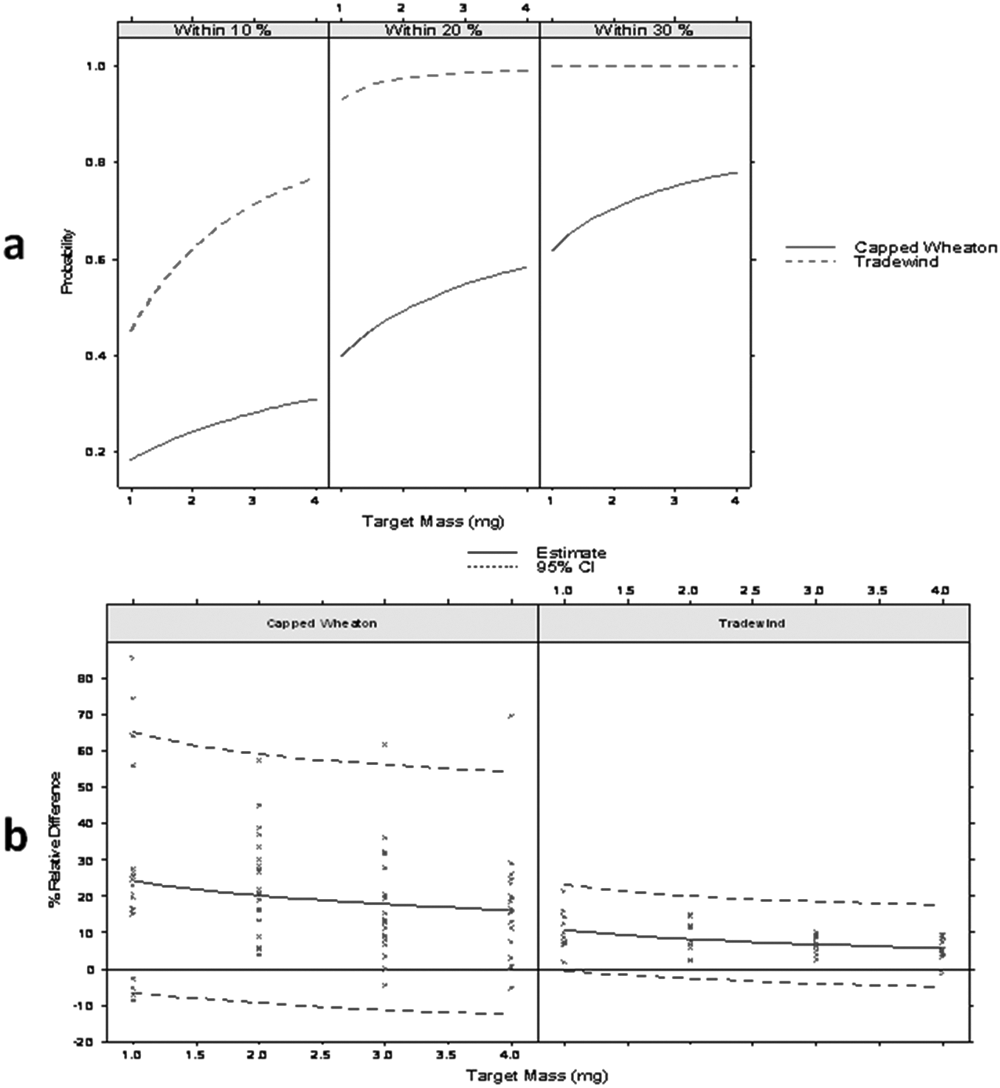
Tradewinds vials versus capped Wheaton vials. (
Controlled Solid Weighing Test
“Gold-standard” test
Research into available devices led to several options to control static. The ones deemed to be most appropriate for our CM laboratory were brought in for evaluation, although once received, some could not be practically integrated into the GSK solid weighing process. The five antistatic devices described in Materials and Methods (“Antistatic Devices”) were considered amenable to in-process integration and were further evaluated. Our goal was to limit the number of devices to use in process while achieving the required 10% weighing precision. Because there are multiple possible combinations for the five devices, we decided to establish a gold-standard baseline, where we applied all five antistatic devices at the same time: Faraday clip, point ionizer, antistatic gloves, tabletop antistatic fan, and external antistatic fan.
One hundred sixty samples were weighed, with 20 measurements for each of the 1-, 2-, 3-, and 4-mg target weights using Tradewinds vials and uncapped Wheaton vials. The results for the gold-standard test are shown along with the results from the “Tradewinds versus Wheaton vials” experiments in Figure 5 . With the combination of all five devices and for either vial type, with respective approximate probabilities of 0.6, 0.8, 0.9, and 0.9, the scale measurements of target weights of 1, 2, 3, and 4 mg are within 10% of the scale reading. For all weights tested (1–4 mg), there is a probability of nearly 1 that the samples dispensed were within 20% of the balance reading. The results also show that uncapped Wheaton vials are equivalent to Tradewinds vials through application of the gold-standard devices. Encouragingly, Tradewinds vials alone (without any antistatic treatment) gave nearly equivalent results to the “gold standards.” The Tradewinds vials, unfortunately, are also significantly more costly than the Wheaton vials.
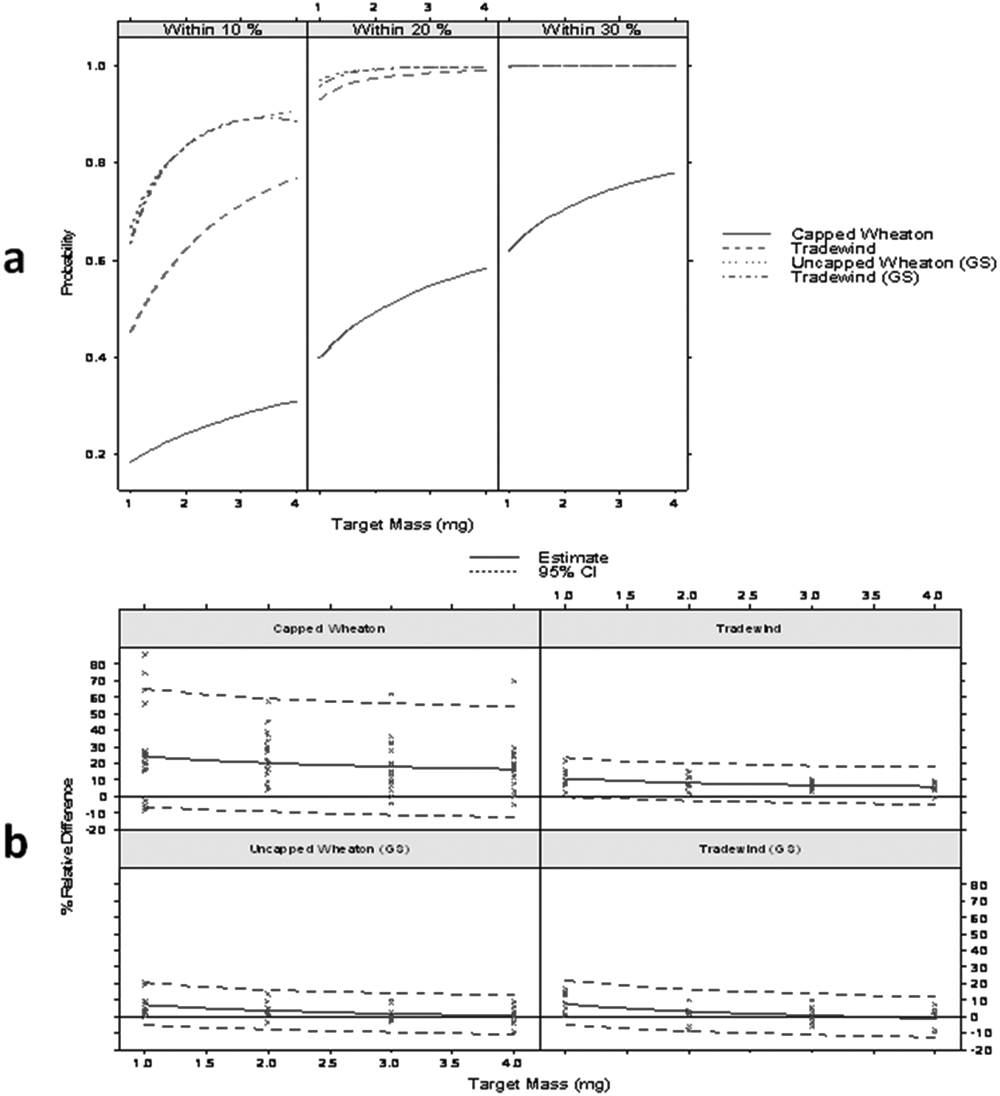
Uncapped Wheaton “gold standard” (GS), Tradewinds vials GS, and Tradewinds vials and Wheaton vials alone. (
Other combinations of antistatic devices
Our final experimental goal was to reduce static in the Wheaton vials to a level low enough to consider it acceptable. Applying all the antistatic devices (the gold-standard approach) was not practical or economical. For example, the antistatic gloves result in a significant loss of dexterity when weighing small amounts of solid into small 4-mL vials and using small spatulas. Similarly, use of the Faraday clip makes it more difficult to get the vial on and off the scale platform. The point bar ionizer and the two antistatic fans (external and tabletop) are the most practical and easy to use within the process. The point bar ionizer and the external fan are also the most expensive options. The benchtop fan is a smaller version of the external fan and is much less costly than either the point ionizer or the external fan.
After removing the most impractical device (the antistatic gloves) and the most costly device (external fan), we then tried two combinations: point bar ionizer and Faraday clip, as well as benchtop fan and Faraday clip, as shown in Figure 6 . One hundred sixty samples were weighed, with 20 measurements for each of the 1-, 2-, 3-, and 4-mg target weights using uncapped Wheaton vials with one of the two antistatic combinations listed above. The results indicated that for uncapped Wheaton vials, neither of these two options was as good as the gold standard, although the combination of a benchtop fan and Faraday clip was relatively close.
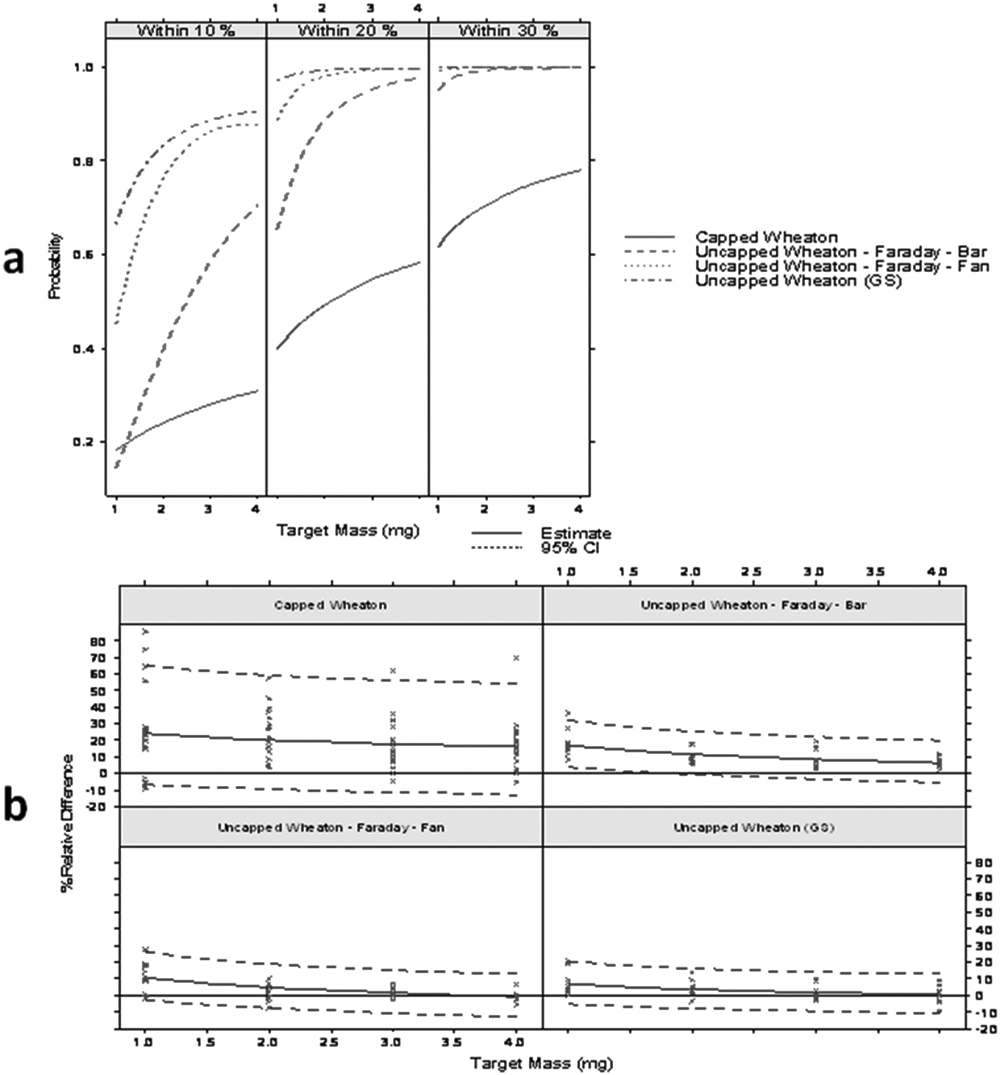
Wheaton vials with or without antistatic devices. From left to right: (1) no antistatic device, (2) Faraday clip + ionizer bar, (3) Faraday clip + benchtop fan, and (4) gold standard (GS). (
Given that performance with Tradewinds vials alone was equivalent to the gold standard for either Wheaton or Tradewinds vials, our decision was to switch all production weighing activities to Tradewinds vials only. Even though the cost of these vials is significantly higher than that of the Wheaton vials, the cost of adding all antistatic devices to all balances in our laboratory was also high. Several of the devices were also very impractical to use in process, reducing operator dexterity and increasing the time to handle a sample for weighing.
We demonstrated three things when weighing solids between 1 and 5 mg. First, the manufacturer accuracy and precision claims appear true when using only calibration weights after choosing the appropriate scale settings. Second, the simple process of taring the balance with a much higher weight (grams) negatively affects the precision of the measured weight. Last, and the main point of this article, even after controlling for the usual laboratory environmental factors such as temperature, air draughts, vibration, and proximity to magnetic/electromagnetic-causing equipment, static electricity negatively affects both accuracy and precision of weighing. Fortunately, static electricity can also be controlled. Static removal devices are available and can make a significant impact on weighing precision. We found that some vials were more statically charged than others. We did not investigate whether the static in vials is due to a manufacturing, packaging, or handling process. In this study, we developed a simple method to measure the deviation of the measured weight from the actual weight either with calibration weights alone or with a flocculent solid dye. We have also evaluated several antistatic devices to remove static and reduce the deviation of measured from actual weight of a solid into a 4- to 5-g destination vial. Although it would be very useful to have a target or threshold value for a direct measurement of static charge, we only have been able to obtain a qualitative reading using a photovoltaic meter. Further studies to address this issue would also help to continuously monitor the static charge for any changes.
Given the focus on compound quality in early drug discovery, it is highly recommended that every laboratory implements a check for weighing precision. Besides regular balance calibrations, one relatively simple approach based on this study would include the following steps: (1) checking environmental factors to ensure constant temperature and humidity, minimize air draughts and vibration, and limit proximity to equipment with moving parts; (2) checking balance programmable settings to ensure a consistent and appropriate setting across all balances; (3) performing a simple measurement (as described in the calibration weights test section) of in-process weighing precision using calibration weights; and (4) control static in the weighing area and weighing consumables to the largest extent possible.
We describe the solution implemented in the CM process at GSK, but this might not be optimal for other laboratories. The decision should be made based on quality, cost, and practicality considerations. The approach presented herein provides a guideline on how to assess weighing precision to allow making this decision.
Footnotes
Acknowledgements
We thank our Sample Management Technologies colleagues John Russell, Jason Nichols, Trevor Casserly, and Stacie Linkletter for their help with the operator-bias experiment and Hamilton Dickson for providing us with a freeze-dried sample of tartrazine. We would also like to acknowledge Michael McCrae (Johnson Controls), Jim Fries (E&S Technologies), and Danielle Mahon (Mettler Toledo) for allowing us to test their devices and their help in setting them up for evaluation. Many thanks to Ricardo Macarron, Brenda Ray, and Gary Smith for their very insightful and timely feedback, as well as their support of this project.
Authors’ Note
Keith McGrath worked on this project as part of GSK’s student co-op program and North Carolina State University’s student industrial placement program.
Declaration of Conflicting Interests
The authors declared no potential conflicts of interest with respect to the research, authorship, and/or publication of this article.
Funding
The authors received no financial support for the research, authorship, and/or publication of this article.