The Aurora kinases are a group of serine/threonine protein kinases that regulate key steps during mitosis, and deregulation of these proteins (e.g., by gene amplification or overexpression) has been linked to a wide variety of tumor types. Thus, Aurora-A and Aurora-B have been intensely studied as targets for anticancer therapy and are now clinically validated targets. Here we report on the development of a novel fluorescence intensity binding assay for Aurora-A kinase inhibitors using a fluorescently labeled probe compound that shows intramolecular quenching when unbound but exhibits a dramatic increase in fluorescence when bound to Aurora-A.
Aurora-A, a 46-kDa mitotic serine/threonine protein kinase with oncogenic characteristics, has drawn intense attention because of its association with the development of human cancers and its relationship with mitotic progression. Human Aurora-A was first identified, along with related kinase Aurora-B, in 1998.1 However, since numerous research groups discovered Aurora-A independently, the kinase has a variety of alternative names, including Aurora 2, AIRK1, ARK1, BTAK, STK6, STK15, AYK1, and IAK1.2 A total of three human Aurora kinases have been identified—A, B, and C—and all members of the Aurora family of protein kinases are required for multiple aspects of mitosis.3
Expression of Aurora-A peaks during metaphase, and the kinase is involved in the regulation of the transition of the G2/M phases of the cell cycle. Aurora-A is activated at the centrosomes, in part by autophosphorylation (Thr288) regulated by binding to the LIM protein AJUBA, and is required for spindle pole formation.4 Aurora-A also recruits Aurora-B to the spindle poles, activating a cascade of phosphorylation and further protein recruitment, which includes partners such as CENP-A, regulating spindle fiber formation and chromosome segregation.5
Aurora-A amplification has been implicated in tumorigenesis, and overexpression of this protein kinase is linked to a wide range of tumor types, including colorectal, ovarian, pancreatic, cervical, breast, and bladder cancers; gastric tumors; and neuroblastoma.6 The treatment of cultured pancreatic cancer cells with small interfering RNAs (siRNA) specific for Aurora-A DNA coding sequence results in the suppression of in vitro growth and in vivo tumorgenicity and also resensitizes tumor cells to existing chemotherapeutic agents targeted toward mitosis, such as the taxanes.7 These studies indicate the value of developing small-molecule inhibitors of Aurora-A activity as effective antitumor agents.
After a considerable amount of interest from the pharmaceutical industry, three Aurora kinase inhibitors—ZM447439, Hesperadin, and VX-6808—were among the first inhibitor compounds to be described. Whereas many existing chemotherapeutic agents act by blocking tumor cell proliferation, these Aurora kinase inhibitors prevent cell division but do not inhibit cell cycle progression. Instead, drug-treated cells are driven catastrophically forward and out of aberrant mitosis, resulting in either growth arrest or massive polyploidy and eventual apoptosis. These end points appear to be determined by the p53 status of the cell.8 The current status of Aurora inhibitors has been summarized in two recent reviews.9,10
To date, the search for small-molecule inhibitors of Aurora kinases have been based on the identification of compounds that selectively target the enzymatic activity of the kinases by occupying the catalytic adenosine triphosphate (ATP) binding site. These programs have employed a combination of standard techniques, such as the radiometric measurement of kinase activity and enzyme-coupled determination of ATP depletion, for example, using a pyruvate kinase and lactate dehydrogenase system.11 Sun et al.11 have reported a FlashPlate-based radiometric assay that measures the incorporation of 33P-labeled ATP into a myelin basic protein-coated plate. The assay was shown to be robust and amenable to high-throughput screening (HTS) using automation, despite having a wash step, and was used to screen a 70 000–compound library at 40 µM. We describe here a novel method of searching for selective small-molecule Aurora-A kinase binding compounds. The development, optimization, and validation of a rapid, inexpensive, and homogeneous Aurora-A fluorescence intensity assay, suitable for high-throughput drug screening, is presented.
Materials and Methods
Aurora-A was purchased from Upstate (cat. No. 14-511, now Millipore, Billerica, MA). The assay buffer, made fresh on each day, contained 25 mM HEPES (pH 7), 0.5 mM Chaps, 10 mM MgCl2, and 1 mM dithiothreitol (DTT). Unless stated otherwise, DMSO concentration was 1% (v/v) final. Ligand 2 was synthesized (
Fig. 1A
) by displacement of the chloropyrimidine, 1, with 4-(Boc-aminomethyl)piperidine, deprotection, and coupling with the commercially available 6-(fluorescein-5-carboxamido)hexanoic acid, succinimidyl ester (5-SFX), to yield ligand 2. The molecule was purified via reverse-phase chromatography and dissolved and kept in DMSO stocks at 4 °C.
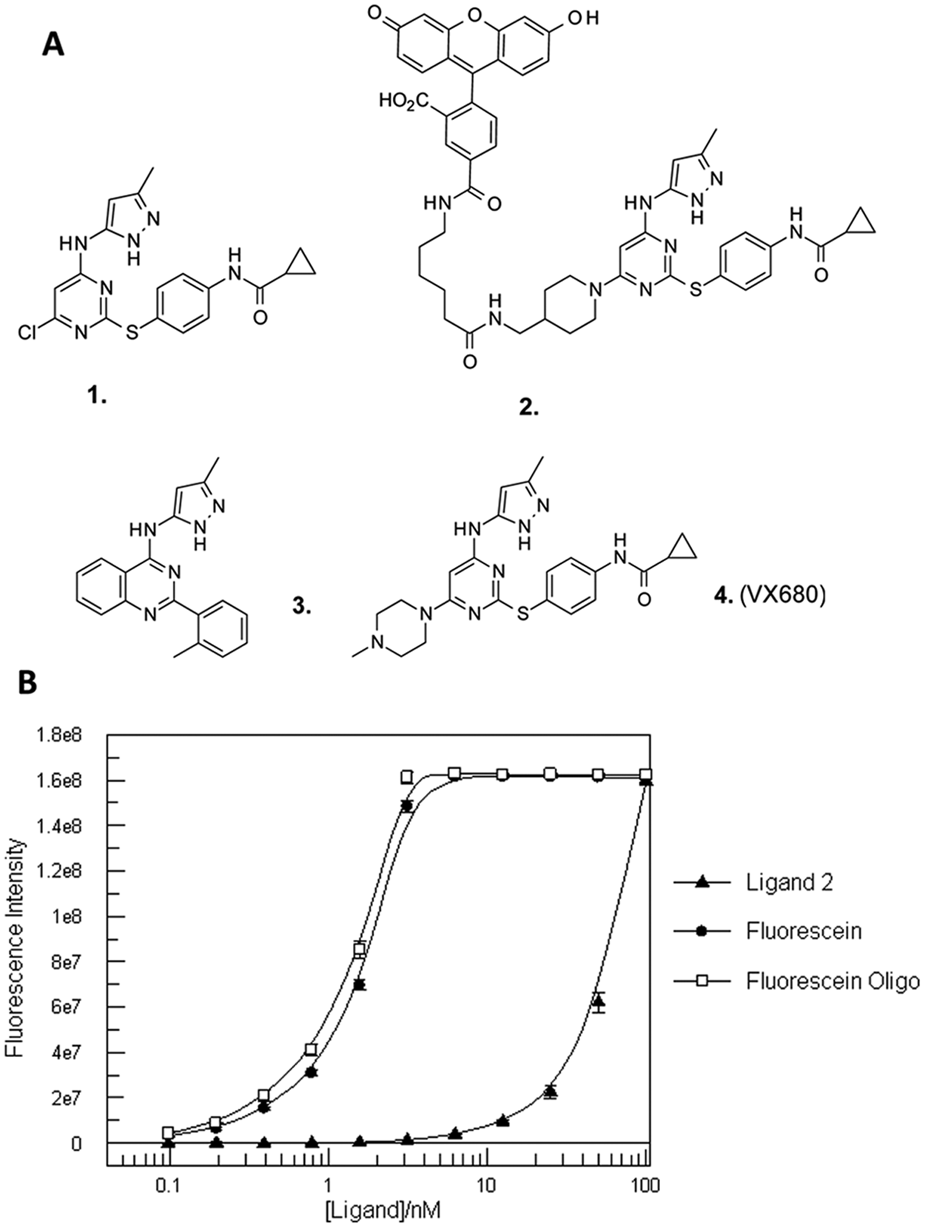
(A) Structures of key synthetic intermediate (1), the fluorescently labeled ligand (2), and control inhibitors (3,4) used in this study. (B) Fluorescence intensity data for ligand 2, fluorescein, and a 5′-fluorescein-labeled DNA oligonucleotide. Ligands were serially diluted in buffer and plates were read and fluorescence intensity calculated for each concentration. Fluorescence intensity is plotted as a function of ligand concentration. Error bars represent standard deviation of three replicates.
Fluorescence Intensity Measurements
Fluorescence intensity was measured using an EnVision plate reader (PerkinElmer, Boston, MA). Measurements were taken using black 96-well plates (Sterilin, Newport, UK; cat no. 611F96BK) and 100 µL total volume. Fluorescence polarization filters were used to excite at 480 nm and capture emission at 535 nm. Large signal changes in fluorescence intensity became saturating at 100% excitation energy, so excitation was set at 10% for binding experiments. Duel detectors were used to capture parallel and perpendicular emissions simultaneously, using fluorescein fluorescence polarization filters. Fluorescence intensity, measured in FI units, is calculated using the formula FI = S + 2(P), where S is the parallel emission intensity and P is the perpendicular emission intensity.
Binding Optimization for Ligand 2
Fluorescence intensity of free ligand was measured over a large concentration range (0.09–100 nM) using standard fluorescence intensity measurements, with altered excitation energy of 100%. Binding experiments for Aurora-A to ligand 2 were performed using 10 nM ligand 2 and increasing concentrations (0–400 nM) of Aurora-A. The plate was mixed and read immediately with 10% excitation energy. Fluorescence intensity measurements were fitted and analyzed using GraFit 4.0 (Erithacus Software, Horley, UK).
DMSO Tolerance
Binding of 10 nM ligand 2 to 2 nM Aurora-A was examined with DMSO at 1%, 2.5%, 5%, 7.5%, and 10% DMSO (v/v) in the presence or absence of 1 µM ligand 4 (at this concentration, the fluorescent ligand 2 would be almost completely unbound to Aurora-A).
Competition Assays
Each well contained 10 nM ligand 2 and 2 nM Aurora-A, with various concentrations of competitor ligands. Free ligand controls (unbound ligand 2) and bound ligand 2 controls (in the presence of 2 nM Aurora-A) were present on each plate. Plates were mixed and read immediately after preparation, and fluorescence intensity values were used to calculate a percentage of control. IC50 values were calculated using XL-fit (IDBS Software, Guildford, UK). ATP was purchased from Sigma (St. Louis, MO), and competitor ligands were synthesized in-house.
Ligand Specificity
Kinase selectivity assays were performed with 10 nM ligand 2 and 10 nM of each particular kinase. Each plate contained free ligand 2 controls and bound ligand 2 controls (in the presence of 10 nM Aurora-A). Kinases were purchased from Upstate (now Millipore, Billerica, MA): AbI active; cat no. 14-529, Flt3 (564-end) active; cat no. 14-500, CaM Kinase I, active; cat no. 14-663MG, GSK-3β, active; cat. no. 14-306MG, Lck, active; cat. no. 14-442, c-Kit, active; cat. no. 14-559, Aurora-B, active; cat. no.14-489, p38α/SAPK2a (6His-tag), active; cat. no. 14-587, GST Aurora-C active; not in catalogue, Aurora-B 6His-tag; not in catalogue, ZAP-70, active; cat. no. 14-404, FGFR3, active; cat. no. 14-464, EGFR, active; cat. no. 14-531, Tie2, active; cat. no. 14-540, cdk2/cyclinA, active; cat. no. 14-407.
High-Throughput Analyses
Each 96-well plate contained 6 wells with DMSO only (as a bound ligand maximum signal control), 6 wells with 1 µM ligand 4 (ensured that fluorescent ligand was completely free—a minimum signal control), and 4 wells with 130 nM ligand 3 (ligand 3 displaces ~50% of ligand 2 at this concentration). Ligands were made up at 10× concentration, and 10 µL was transferred to three replicate black 96-well plates. Test compounds were made up at 250 µM in 10% (v/v) DMSO, and 10 µL was added to the three replicate plates. Buffer was added to one of the three plates (to measure for test compound fluorescence). A premixed solution of ligand 2–Aurora-A complex was added to all wells on the other two replicate plates to give 10 nM ligand 2 and 2 nM Aurora-A. Plates were incubated at room temperature for 20 min to ensure equilibrium had been reached. Time to equilibrium was determined by measuring the fluorescence of the controls at 0, 5, 10, 20, 30, and 150 min. Fluorescence intensity data were used to calculate percentage inhibition for test compounds from control wells on each plate using the following formula: %positive = (((x – xΔ) – (µf – µfΔ))/((µb – µbΔ) – (µf – µfΔ)))*100, where x and xΔ are fluorescence intensity values for test compounds and test compound background fluorescence, respectively; µf and µfΔ are fluorescence intensity values for free ligand controls and background DMSO fluorescence intensity values, respectively; and µb and µbΔ are fluorescence intensity values for bound ligand controls and background DMSO fluorescence intensity values, respectively. Z′ values were calculated for each plate using the following formula: Z′ = 1 – (3SDb + 3SDf)/(µb – µf), where µb and µf are the fluorescence intensity of the bound ligand (with 2 nM Aurora-A) and free ligand, respectively, and SDb and SDf are the standard deviations of bound and free ligand, respectively.12
Results and Discussion
Development of Binding Assay
The principle of this fluorescence intensity assay is based on the observation that a fluorescently tagged ligand (in this case, ligand 2,
Fig. 1A
) may emit different fluorescence intensities between its free and protein-bound states. Ligand 2 has quenched fluorescence intensity when free in solution. Upon binding to the protein (Aurora-A), the quenching is reduced, and the fluorescence intensity increases. The fluorescence intensity of the ligand-protein complex can therefore be used to measure how much of the ligand is bound to the protein and thus forms the basic principles of a competitive binding assay.13 Fluorescence polarization binding assays are of similar principle to the fluorescence intensity assay described in this article—the difference being that fluorescence polarization measures the change in polarization of a labeled ligand between bound and free states. Higher polarization values are observed when the labeled ligand is bound and compared with lower polarization values when the ligand is free, thus giving the assay window.14 Although the fluorescence intensity assay works on very similar principles as the fluorescence polarization assay, polarization is ignored and the intensity is used to measure binding.
Ligand 2 was developed by fluorescently tagging an analogue of the Aurora kinase inhibitor VX-68010 with fluorescein. In the absence of protein, this ligand demonstrates a large reduction in fluorescence intensity compared with free fluorescein and a fluorescein-labeled oligonucleotide control, presumably due to intramolecular quenching (
Fig. 1B
). At 3.125 nM, ligand 2 emits low fluorescence of 1.2e6, whereas fluorescein demonstrates fluorescence intensity near saturation of the reader of 1.5e8, a difference of ~130-fold. These results demonstrate that the labeled ligand 2 has a significantly quenched signal when free in solution.
Binding experiments were performed to determine the effect Aurora-A has on the fluorescence intensity of ligand 2 (
Fig. 2A
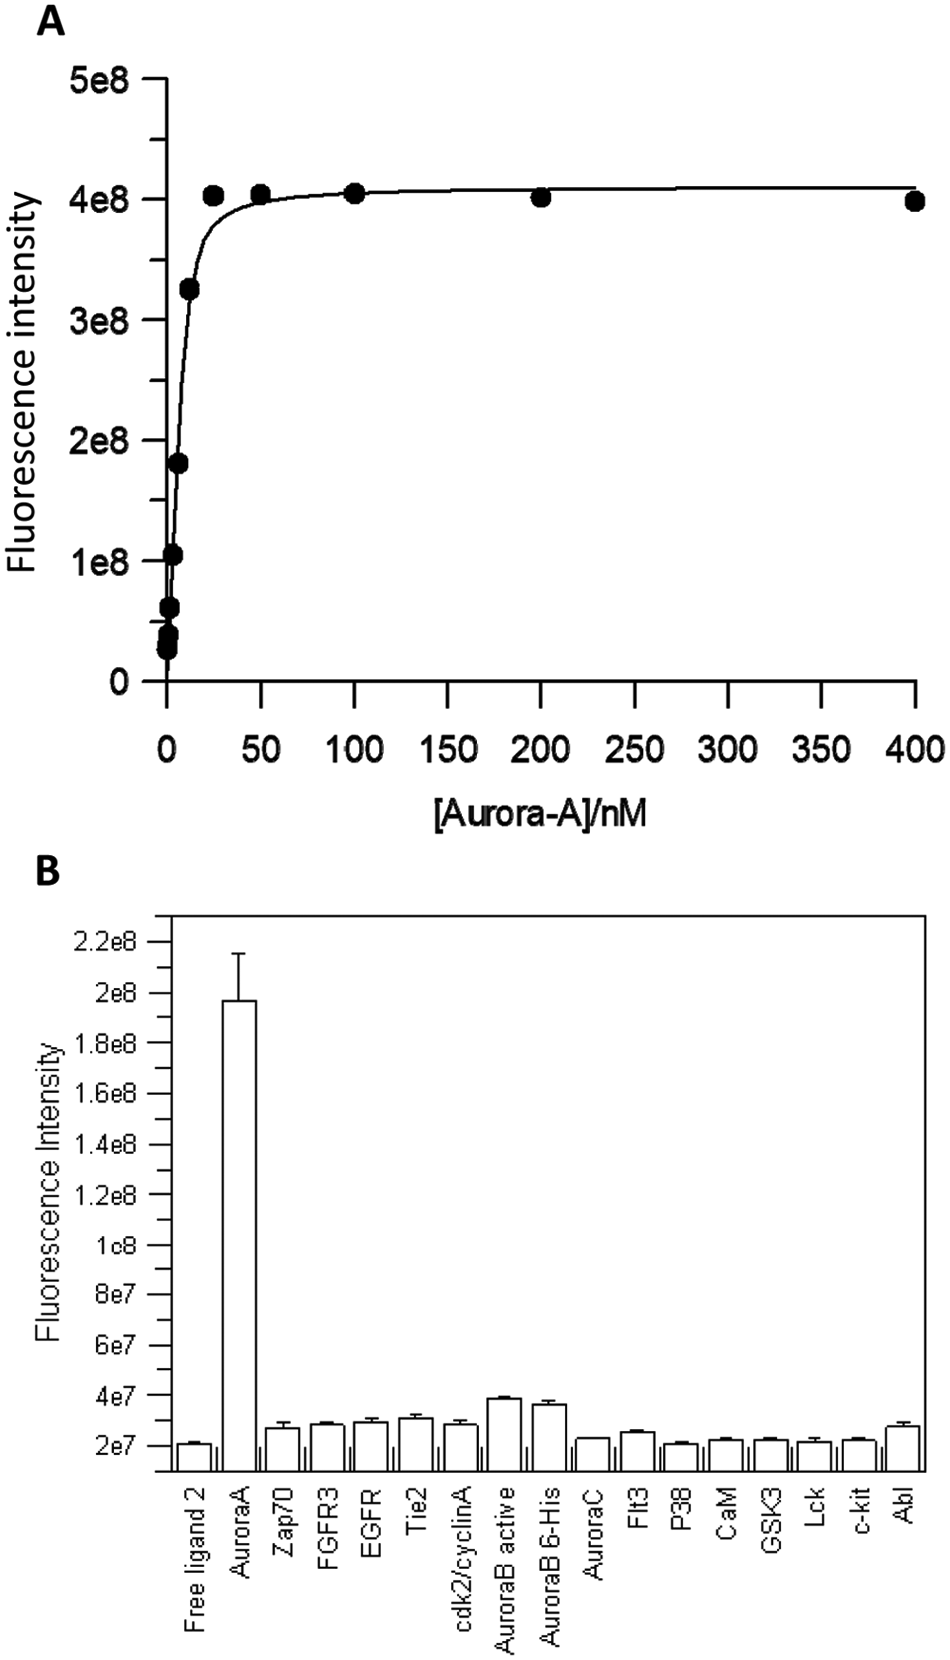
). At lower concentrations of Aurora-A, fluorescence intensity was low at 3e7. As the concentration of Aurora-A increased, a greater fraction of ligand 2 was bound to Aurora-A, and fluorescence intensity progressively increased to reach a maximum at 4e8 in the presence of 25 nM Aurora-A. The fluorescence intensity of the ligand increases by ~17-fold when bound to Aurora-A. The dramatic signal change produced by ligand interacting with Aurora-A shows great sensitivity, compared with fluorescence polarization assays where a maximum signal change of 2- to 3-fold is commonly seen. Interestingly, the fully bound fluorescence intensity is still considerably lower than for free fluorescein, suggesting partial intramolecular quenching remains at a lower relative level, or further intermolecular protein interactions cause additional fluorescence quenching. Data from this experiment were used to determine the Kd for the interaction, giving a value of 1.4 ± 0.4 nM (calculated error from fit). A similar experiment where fluorescence polarization was measured gave a similar binding profile and Kd for the interaction (data not shown).
(A) Equilibrium binding analyses of ligand 2 and Aurora-A. Increasing amounts of Aurora-A (0–400 nM) were added to 10 nM ligand 2 and read immediately. Fluorescence intensities were calculated for each concentration of Aurora-A. Data collected were transformed and analyzed using nonlinear regression using GraFit 4.0 software and an equation for tight binding. (B) Fluorescence intensity data for various human protein kinases. Of ligand 2, 10 nM was incubated with 10 nM of each kinase before being read in a 96-well plate with an EnVision plate reader. Fluorescence intensity was calculated for each kinase and plotted. Error bars represent the standard deviation of two replicates.
DMSO Tolerance
The effect of DMSO on the ligand 2–Aurora-A interaction was examined, up to a maximum of 10% (v/v), using 10 nM ligand 2 and 2 nM Aurora-A in the presence or absence of 1 µM ligand 4 (VX-680) to generate the minimum (ligand 4 bound, ligand 2 displaced) and maximum (ligand 2 bound only) assay signal, respectively. At DMSO concentration above 1%, the assay window was significantly reduced, and at 10% DMSO, the window was nonexistent (data not shown). Hence, 1% DMSO was selected for further screening.
Competitive Binding Analyses
Competitive binding experiments were carried out to determine whether the increase in fluorescence intensity of ligand 2 was due to site-specific binding to Aurora-A. Specific binding between labeled ligand 2 and Aurora-A will form the basic properties of a competition assay to be used for compound screening. Using 2 nM Aurora-A and 10 nM ligand 2 produces a signal of ~7.2e7 resulting from the binding of ~20% of the ligand to Aurora-A. This represents the maximum signal (100% positive) for the competitive assay. Free ligand alone produces a signal of ~3.1e7, which represents the minimum signal (0% positive) for the competitive assay. The large fluorescence intensity change between free and bound ligand states permits this assay window of ~2-fold while still remaining sensitive to competition at only 20% binding of the fluorescent ligand to Aurora-A. These assay conditions were used to test three inhibitors (
Fig. 3
). Unlabeled ligand (VX680, ligand 4,
Fig. 1A
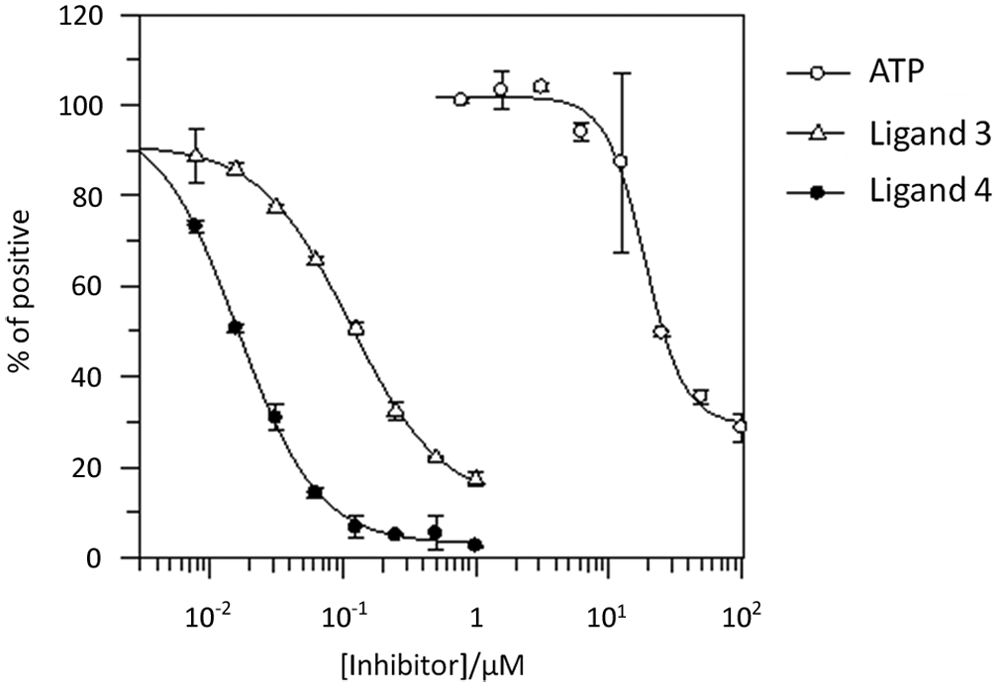
) was included to show that the labeled ligand 2 was binding at the same site as the original novel compound and that the fluorescein tagging has not caused any additional nonspecific binding. Concentration-response curves for this ligand show that at high concentrations, it is able to displace nearly 100% of the labeled ligand 2, resulting in a low fluorescence intensity value. The IC50 value for ligand 4 was determined to be 16 nM (it should be noted that IC50s obtained under the experimental conditions cannot be directly converted into Ki values). ATP was also used to demonstrate that ligand 2 was binding in the catalytic ATP binding site of Aurora-A. At higher concentrations, ATP was shown to reduce fluorescence intensity of ligand 2, indicating that the ligand had been displaced by ATP. The IC50 value for ATP was determined to be 25.7 µM. Ligand 3 (2-(2-methylphenyl)-N-(5-methyl-1H-pyrazol-3-yl)-4-quinazolinamine;
Fig. 1A
) was used to further validate the competition assay and to demonstrate that potential novel inhibitors can be identified. High concentrations of ligand 3 resulted in a loss of fluorescence intensity, giving a concentration-response and calculated IC50 of 121 nM. The ability of these competitors to displace ligand 2 from the Aurora-A catalytic site validates this technique for a competitive ligand displacement assay.
Inhibitory activity of known Aurora-A inhibitors against the ligand 2–Aurora-A interaction. Adenosine triphosphate (ATP), ligand 3, and unlabeled ligand, VX680 (compound 4), were serially diluted from DMSO stocks. Of ligand 2, 10 nM was added, followed by 2 nM Aurora-A. Specific binding was calculated and plotted as a percent of maximum signal against the log10 inhibitor concentrations. IC50 values were calculated using GraFit software. Error bars represent standard deviation of two replicates.
To develop and use the assay in a higher throughput format, the assay was adapted so that the negative control wells of the assay plate contained a high concentration (1 µM) of unlabeled ligand 4. This meant that plates of test compounds could be prepared easily with DMSO-only samples for positive controls (maximum signal) and high concentrations of unlabeled ligand 4 for the negative controls. This enabled every well on a plate to have a premixed solution of ligand 2 and Aurora-A added to all wells by uninterrupted automation. Prior experiments involved adding Aurora-A alone to competitors and ligand 2 in a single step, giving an instant assay window indicating that ligand 2, competitors, and Aurora-A formed a rapid equilibrium. To determine how long it takes the ligand 2 and Aurora-A premixed solution to reach equilibrium with control inhibitors after simultaneous automated addition, a plate was read over time from 0 min to 150 min and showed that approximately 20 min was required.
Ligand Specificity
A panel of a further 15 human protein kinases were selected (see Materials and Methods), in part due to their structural similarity to Aurora-A, for testing their binding to ligand 2. Of each kinase, 10 nM was added to 10 nM ligand 2 and the fluorescence intensity was measured. Aurora-A showed a ~10-fold increase in fluorescence intensity with ligand 2, as expected. The majority of the other kinases tested showed no increase in fluorescence intensity compared with free ligand 2 (
Fig. 2B
); however, Aurora-B and Aurora-B 6xHis showed a small increase of ~1.8-fold and ~1.7-fold, respectively. These results suggest that the protein-ligand interaction that reduces the likely fluorescence quenching is largely specific only to Aurora-A under the single-point conditions tested. It may be the case that the other kinases are binding to ligand 2, but binding does not cause the increase in fluorescence intensity that provides the large assay window presented here.
High-Throughput Format Development
The homogeneous assay format described in this article is suitable for HTS because of the minimum amount of steps. Test compound plates can easily be prepared containing control inhibitors. Automation enables simple distribution of compounds to duplicate test plates and a blank plate, followed by addition of blank buffer and premixed ligand 2–Aurora-A complex to blank and test plates, respectively. Blank plates provide a separate measurement of any intrinsic fluorescence that any test compound may exhibit. This provides a quick and easy way of preparing many plates for reading on a stacked plate reader. For higher throughput plate-based screening, a 20-min incubation was used after automated plate preparation to ensure that equilibrium had been reached. Automation of the assay enabled plates to be prepared quickly and data to be generated for easy analyses. Sixteen plates were used to analyze the robustness of the assay from data collected on different days (
Fig. 4
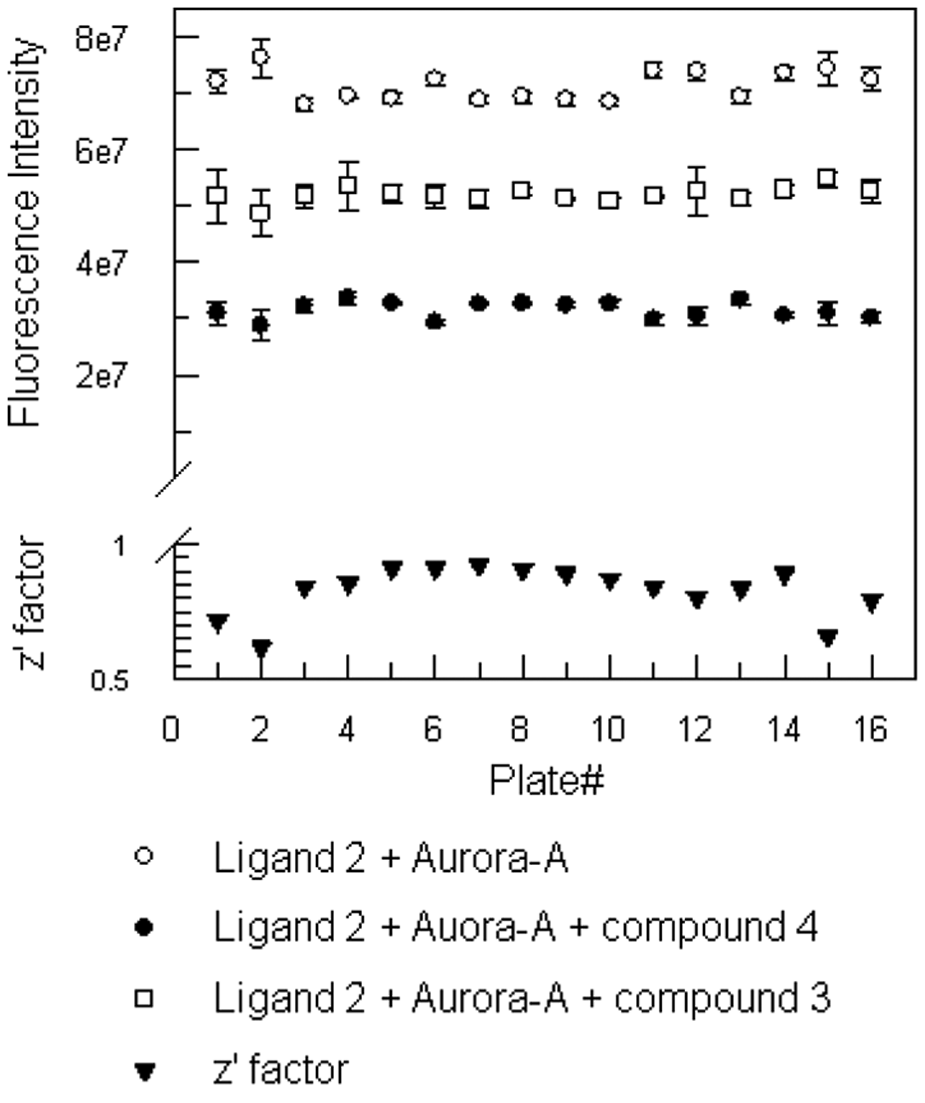
). The average signal for the DMSO-only positive controls was 7.1e7, and the average signal for the 1-µM unlabeled ligand 4 negative controls was 3.1e7. Z′ factor calculations from controls on each plate show that the poorest plate (plate 2,
Fig. 4
) had a Z′ value of 0.62, which is still greater than the commonly used threshold of 0.5.13 By adding control inhibitor ligand 3 at approximately its IC50 value (130 nM), an analysis of the performance of the assay can be obtained from these wells. Compound 3 had an average signal of 5.2e7 and 48.3% ± 3.1% inhibition, in strong agreement with the previously determined IC50. Using this format, we were able to screen a focused set of 1100 compounds containing a combination of bespoke synthesized and commercially available compounds, all selected using protein kinase pharmacophoric models. Testing at 25 µM confirmed the assay was able to detect inhibitors of moderate potency in this format. The hit rate for this set of compounds was 5%, an acceptable hit rate given the focused nature of the compound set. Subsequent testing of inhibitors in a functional radiometric 33P-incorporation assay, using a heptapeptide substrate, confirmed the identified compounds to be inhibiting the kinase activity of the enzyme and to possess IC50s in the range 1 µM to 30 nM.
High-throughput format assay analyses. Sixteen 96-well plates contained 6 maximum signal wells with 10 nM ligand 2 and 2 nM Aurora-A, 6 minimum signal wells with 10 nM ligand 2 and 2 nM Aurora-A and 1 µM unlabeled ligand 4, and 4 control wells with 10 nM ligand 2 and 2 nM Aurora-A and 130 nM ligand 3. The average fluorescence intensity for these wells was calculated and plotted. Error bars represent standard deviation of six or four replicates. The data collected were used to calculate Z′ factor and plotted for each plate.
In summary, the data presented in this article demonstrate a novel assay technology for Aurora-A. The fluorescently labeled ligand 2 binds to Aurora-A with a calculated Kd of 1.4 nM. We have demonstrated a validated, homogeneous, and powerful HTS screening tool for active site inhibitors of Aurora-A. This strategy may be exploited for the creation of other high-throughput fluorescence-based competition assays.
Footnotes
Acknowledgements
The authors would like to thank Dr David Andrews, Dr Huw Jones and Dr Richard Shute for help with data analysis.
Declaration of Conflicting Interests
The authors declared no potential conflicts of interest with respect to the research, authorship, and/or publication of this article.
Funding
The authors received no financial support for the research, authorship, and/or publication of this article.
Supplementary material for this article is available on the Journal of Biomolecular Screening Web site at .
References
1.
BischoffJ. R.AndersonL.ZhuY.MossieK.NgL.SouzaB.SchryverB.FlanaganP.ClairvoyantF.GintherC.. A Homologue of Drosophila Aurora Kinase Is Oncogenic and Amplified in Human Colorectal Cancers. EMBO J. 1998, 17, 30532–3065.
2.
GietR.PrigentC.Aurora/lpl1p-Related Kinases, a New Oncogenic Family of Mitotic Serine-Threonine Kinases. J. Cell. Sci. 1999, 112, 3591–3601.
3.
AdamsR. R.CarmenaM.EarnshawW. C.Chromosonal Passengers and the (Aurora) ABCs of Mitosis. Trends Cell. Biol. 2001, 11, 49–54.
4.
HirotaT.KunitokuN.SasayamaT.MarumotoT.ZhangD.NittaM.HatakeyamaK.SayaH.Aurora-A and an Interacting Activator, the LIM Protein AJUBA, Are Required of Mitotic Commitment in Human Cells. Cell2003, 114(5), 585–98.
5.
MarumotoT.ZhangD.SayaH.Aurora-A—A Guardian of Poles. Nat. Rev. Cancer2005, 5(1), 42–50.
6.
WarnerS. L.BearssD. J.HanH.Von HoffD. D.Targeting Aurora-2 Kinase in Cancer. Mol. Cancer Ther. 2003, 2, 589–595.
7.
HataT.FurukawaT.SunamuraM.EgawaS.MotoiF.OhmuraN.MaramutoT.SayaH.HoriiA.RNA Interference Targeting Aurora Kinase A Suppresses Tumor Growth and Enhances the Taxane Chemosensitivity in Human Pancreatic Cancer Cells. Cancer Res. 2005, 65(7), 2899–2905.
8.
KeenN.TaylorS.Aurora-Kinase Inhibitors as Anticancer Agents. Nat. Rev. Cancer2004, 4, 927–936.
MahadevanD.BeeckS.Aurora Kinase Targeted Therapeutics in Oncology: Past, Present and Future. Exp. Opin. Drug Discov. 2007, 2(7), 1011–1026.
11.
SunC.NewbattY.DouglasL.WorkmanP.AherneW.LinardopoulosS.High-Throughput Screening Assay for Identification of Small Molecule Inhibitors of Aurora2/STK15 Kinase. J. Biomol. Screen. 2004, 9, 391–397.
12.
ZhangJ.-H.ChungT. D. Y.OldenburgK. R.A Statistical Parameter for Use in Evaluation and Validation of High Throughput Screening Assays. J. Biomol. Screen. 1999, 4, 67–63.
13.
van HoldeK. E.JohnsonW. C.HoP. S.Principles of Physical Biochemistry; Prentice Hall: Englewood Cliffs, NJ, 1998; pp 452–483.
14.
LakowitzJ. R.Fluorescence Anisotropy. In Principles of Fluorescence Spectroscopy; LakowitzJ. R., Ed.; Plenum: New York, 1999; 2nd ed., pp 291–319.