
Abstract
Gliomas are the most devastating of primary adult malignant brain tumors. These tumors are highly infiltrative and can arise from cells with extensive self-renewal capability and chemoresistance, frequently termed glioma-propagating cells (GPCs). GPCs are thus the plausible culprits of tumor recurrence. Treatment strategies that eradicate GPCs will greatly improve disease outcome. Such findings support the use of GPCs as in vitro cellular systems for small-molecule screening. However, the nuances in using GPCs as a cellular screening platform are not trivial. These slow-growing cells are typically cultured as suspension, spheroid structures in serum-free condition supplemented with growth factors. Consequently, replenishment of growth factors throughout the screening period must occur to maintain cells in their undifferentiated state, as the more lineage-committed, differentiated cells are less tumorigenic. We present a case study of a small-molecule screen conducted with GPCs and explain how unique sphere activity assays were implemented to distinguish drug efficacies against the long-term, self-renewing fraction, as opposed to transient-amplifying progenitors, the latter of which are detected in conventional viability assays. We identified Polo-like kinase 1 as a regulator of GPC survival. Finally, we leveraged on public glioma databases to illustrate GPC contribution to disease progression and patient survival outcome.
Keywords
Introduction
Brain tumors such as glioblastoma multiforme (GBM) are among the most devastating of cancers, often with a mean survival period of 15 months following diagnosis. The current choice of drug is temozolomide, with annual sales of U.S.$1 billion in United States, at best prolonging survival by a few months. Consequently, new therapeutic strategies that will provide an effective cure are likely to significantly improve patient outcome. GBM tumors are highly aggressive and recurrent, and these traits have been attributed to cellular fractions with long-term, self-renewal capability. Such cells are frequently termed glioma-propagating cells (GPCs), defined based on their capacity to form serially transplantable tumors in immune-compromised mice. GPCs have frequently been associated with several marker profiles; however, such marker expression has generated conflicting data. For instance, tumor-initiating ability can arise from both CD133(+) and CD133(−) cells. 1 Furthermore, marker expression and tumor-initiating potential can be altered by experimental conditions. 2 These findings underscore the need to reevaluate GPCs: (1) They must demonstrate long-term self-renewal, and (2) they re-form serially transplantable tumors that recapitulate the patient’s original histopathology. Such essential self-renewing, tumor-propagating cells have been shown to contribute to disease progression and patient survival outcome in several cancers.3,4 Importantly, GPCs phenocopy the biological, karyotypic, and molecular fingerprint of their primary tumors. 5 These findings emphasize the relevance of using GPCs as an in vitro cellular screening platform to uncover therapeutic targets at the root of the tumor.
In our study, we sought to determine signaling pathways that regulate GPC survival since they would be the most likely culprits of tumor recurrence. Specifically, we looked for compounds that could inhibit these GPCs, cultured in vitro as spherical structures. Conventional tumor cell screening typically involves short-term viability readouts of adherent monolayer cells upon drug treatment. In dealing with GPCs, we recognized that bona fide self-renewal in slow-growing cells cannot be accurately detected in short-term viability assays as the latter also measure other transient-amplifying progenitors in the heterogeneous spheres. 6 Consequently, parameters such as sphere number over serial passages, which reflects GPC frequency, and sphere size, which indicates GPC-specific proliferation, are measured. Sphere activity, which is the measure of sphere-forming ability, often correlates with in vivo tumor-initiating and sustaining capacity and thus is a reliable in vitro factor to monitor, especially in the subset of GPCs that confer self-renewal with concomitant tumor-propagating ability. 7 The extended period of such screens often complicates the experimental procedure since regular replenishment of growth factors must take place to sustain the relatively undifferentiated state of GPCs 8 because otherwise, induction of differentiation leads to loss of tumorigenic potential. 9 In addition, we adapted the sphere assay to measure residual self-renewing activity upon drug removal from the medium over an extended period. This step would indicate if GPC frequency has been altered for a long-lasting inhibition.
Finally, our case study identified Polo-like kinase 1 (Plk1) as a regulator of GPC survival. Recently, several studies have demonstrated that gliomas can be molecularly subtyped, with each class distinguished by unique gene expression, genomic aberrations, and clinical outcome. 10 Such findings highlight that gene expression drives glioma disease progression and survival outcome. A key question in cancer stem cell biology is whether such controversial cells do indeed play a role in primary tumor behavior, consequently affecting survival outcome and treatment decisions. Here, we tapped into two large, independent glioma databases—REMBRANDT and Gravendeel—to analyze PLK1-associated genes and subsequent patient survival stratification.11,12 We found that high PLK1 is an independent, negative prognostic factor in glioma and associates with the mesenchymal and proliferative molecular subclasses that characterize highly aggressive and recurrent tumors. Strikingly, high PLK1 expression is enriched in stem cell–related gene networks, thereby reinforcing the contribution of GPCs to patient outcome. We provide evidence that our screening platform is built upon assays that reflect clinical relevance and that inhibiting Plk1 likely leads to a significantly improved outcome by targeting the relevant, self-renewing GPCs.
Materials and Methods
Tissue Collection and Primary GPC Culture
Graded brain tumor specimens were obtained with informed consent, as part of a study protocol approved by the SingHealth Centralised Institutional Review Board A. Briefly, primary tumor samples were diced with a sterile scapel in a six-well plate. Then, 3 mL of warm Accutase (eBioscience, Inc., San Diego, CA) incubated at 37 °C was added to the diced tumor and the cell suspension mixture subsequently incubated for a further 40 min at 37 °C. A 1-mL pipette was used to agitate the mixture every 20 min to dislodge cell aggregations. Next, the cell suspension mixture was passed through a sterile 100-µm filter, followed by a 30-µm filter. The resulting cell mix was then centrifuged at 400 g for 20 min. Only the upper white layer containing the cells was carefully removed using a fine tip pipette, without dislodging the red blood cell pellet at the bottom of the tube. The retrieved cell mix was then washed once with cold phosphate-buffered saline before subjecting to another round of centrifugation at 400 g for 20 min. Finally, the cell pellet was treated as described: Cells were seeded as free-floating spheres at a density of 2500 cells per cm2 in chemically defined serum-free growth medium containing basic fibroblast growth factor (bFGF; 20 ng/mL; PeproTech, Rocky Hill, NJ), epidermal growth factor (EGF; 20 ng/mL; PeproTech), heparin (5 µg/mL; Sigma-Aldrich, St. Louis, MO), and serum-free supplement (B27; 1×; Gibco, Grand Island, NY) in a 3:1 mix of Dulbecco’s modified Eagle’s medium (DMEM; Sigma-Aldrich) and Ham’s F-12 Nutrient Mixture (F-12; Gibco). Neurospheres were mechanically triturated with a flame-drawn glass Pasteur pipette twice weekly and reseeded in fresh culture medium.
The mouse astrocyte line (C8-D1A, postnatal mouse cells) was purchased from American Type Culture Collection (ATCC, Manassas, VA). Cells were maintained as an adherent monolayer in DMEM supplemented with 10% fetal bovine serum (FBS; Gibco), together with penicillin-streptomycin, nonessential amino acids (NEAAs), and sodium pyruvate.
Both normal human astrocytes (NHAs, fetal origin) and normal human neural progenitor cells (NHNPs, fetal origin) were purchased from Lonza (Lonza, Inc., Allendale, NJ). NHA cells were maintained as monolayers with the Clonetics astrocyte cell system (Lonza), a serum-based culture condition, according to the manufacturer’s instruction. NHNP cells were maintained in suspension in the Poietics neural progenital cell system (Lonza), which is a serum-free culture condition, according to the manufacturer’s instruction.
Stereotaxic Intracranial Implantation of NOD-SCID Gamma Mouse
Animal experimentation was performed according to protocols approved by the Institutional Animal Care and Use Committee. Implantations were carried out as previously described. 13 NOD.Cg-Prkdc scid Il2rg tm1Wjl /SzJ (NOD-SCID gamma) mice were implanted with 500 000 cells each (The Jackson Laboratory, Bar Harbor, ME). Coordinates were as follows: anteroposterior = +1.0 mm, mediolateral = +2 mm, and dorsoventral = −2.5 mm. Mice were euthanized by means of transcardiac perfusion with 4% paraformaldehyde upon presentation of neurological deficits with ataxia, cachexia, lethargy, or seizure. Hematoxylin-eosin staining and immunohistochemistry were performed on 5-µm-thick paraffin sections.
Karyotypic Analysis of Tumor Neurospheres
Two million cells from dissociated neurospheres were cultured in a T-25 flask (BD Biosciences, Franklin Lakes, NJ). The cells were then treated within 3 to 5 days with 0.1 µg/mL colcemid (Invitrogen, Carlsbad, CA) for 24 h. Metaphase-arrested cells were pelleted (180 g for 10 min) and hypotonic treated with 0.075 M potassium chloride. Chromosomes were fixed in methanol:acetic acid (3:1), recentrifuged, and resuspended in fixative. Then, 12 µL of the fixed cell suspension was dropped on a clean, moistened glass slide and placed on a hot plate at 48 °C to obtain chromosome spreads. Spectral karyotyping (SkyPaint; Applied Spectral Imaging, Migdal HaEmek, Israel) was performed on metaphases according to the manufacturer’s instruction.
Small-Molecule Screen
Tumor neurospheres were dissociated with Accutase (eBioscience) and seeded into 96-well plates, at a density of 10 000 cells per well, with DMEM/F12 medium supplemented with growth factors to maintain them as relatively undifferentiated spheroid structures with time. Cells were allowed to recover for 3 to 4 days prior to treatment, at 10 µM in Compound Screen I or 0.1 µM in Compound Screen II. Fresh media supplemented with appropriate growth factor concentrations and compounds were added 3 days postrecovery. Cell viabilities were assessed using alamarBlue (Serotec, Oxford, UK) 5 days posttreatment. Viability-based selectivity ratio was defined as % viability of mouse astrocyte (C8-D1A)/% viability of GPC.
Kinase Selectivity Profile Generation—BI2536
Expression and Purification of Plk1
Human PLK1 cDNA was linked to FLAG-His6 tag via the C-terminus, inserted into the pFastBac expression vector (Invitrogen), and transfected into baculovirus as reported by Qian et al. 14 The baculovirus bearing a PLK1-Flag-His6 tag polynucleotide construct was infected into Sf9 cells. At approximately 46 h after infection, the culture was treated with okadaic acid (0.1 µM) for 3 h (e.g., to arrest cells in mitosis where Plk1 is expressed and active). The PLK1-Flag-His6 tag fusion was purified from cell pellets using a metal affinity resin, TALON (Clontech, Mountain View, CA). Purified PLK1-Flag-His6 tag fusion was stored in 10 mM HEPES, 150 mM NaCl, 0.01% Triton X-100, 1 mM dithiothreitol (DTT), and 10% glycerol, pH 7.5, at −80 °C in small aliquots until use. The identity of the purified PLK1-Flag-His6 tag fusion protein was confirmed by MALDI (matrix-assisted laser desorption/ionization).
Expression and Purification of Plk3
A FLAG tag was added to the C-terminus of human PLK3 cDNA inserted into the pFastBac vector (Invitrogen) and transfected into baculovirus as reported by Qian et al. 14 The baculovirus bearing the PLK3-Flag-tagged polynucleotide construct was infected into Sf9 cells. At approximately 46 h after infection, the PLK3-Flag tag fusion was purified from cell pellets using a flag affinity resin, Anti-Flag M2 Affinity Resin (Sigma). Purified PLK3-Flag tag fusion was stored in 10 mM HEPES, 150 mM NaCl, 0.01% Triton X-100, 1 mM DTT, and 10% glycerol, pH 7.5, at −80 °C in small aliquots until use. The identity of the purified PLK3-Flag tag fusion protein was confirmed by MALDI.
Plk1 and Plk3 Inhibition Assays
The specific activity of full-length PLK1 using GST-Cdc25C(1-206) substrate is 218 nmol/min/mg (kcat = 0.25 s−1) at room temperature, which is significantly higher than that reported for the unactivated catalytic domain or the activated T210D mutant. 15 Our Km using the GST-Cdc25C(1-206) construct is 1.4 µM, similar to the 0.66 µM reported for full-length Cdc25C. The only protein kinase present was PLK1 based on mass spectrometry analysis at the Indiana Centers for Applied Protein Sciences (INCAPS). The okadaic acid arrest of insect cells prior to harvest increases the extent of phosphorylation of T210, which is required for catalytic activity. (Note: The specific activity of full-length PLK3 using GST-Cdc25C(1-206) substrate is 2.1 nmol/min/mg at room temperature.)
Plk1 or Plk3 kinase reactions contained either 3 nM PLK1-Flag-His6 or 20 nM PLK3-Flag tag fusion enzyme in a buffer containing 50 mM HEPES (pH 7.3), 1.0 mM DTT, 5.0 µM adenosine triphosphate (ATP), 10 mM MgCl2, 0.01% Triton X-100, 0.4 µCi 33P-ATP, and 0.06 µg/µL GST-Cdc25c(1-206) peptide. Compounds were provided as 10-mM stocks in DMSO. Compounds were serially diluted 1:3 in 20% DMSO to create a 10-point concentration-response curve (20 to 0.001 µM final in 4% final DMSO concentration). The reaction was carried out at room temperature for 60 min and then quenched by adding 60 µL of 10% H3PO4. The reaction mixture (85 µL) was transferred to a 96-well Millipore Multiscreen-PH Plate (MAPHNOB10; Millipore, Billerica, MA) prewashed with 30 µL of 10% H3PO4, incubated at room temperature for 20 to 30 min, and then washed 3× with 0.5% H3PO4. Wells were dried before addition of 40 µL MicroScintTM20 (PerkinElmer, Waltham, MA) and then counted on a PerkinElmer MICROBETA. The percentage inhibition values from the 10-point concentration response data were subsequently analyzed using ACTIVITY BASE software (IDBS, Guildford, UK), using a four-parameter logistic equation (nonlinear regression). Absolute IC50 values were calculated from the resulting curve fit.
Plk2 Inhibition Assay
Plk2 (cat. PV4204, lot 36643C; Invitrogen) kinase reaction contained 2 nM PLK2 tag fusion enzyme in a buffer containing 50 mM HEPES (pH 7.3), 1.0 mM DTT, 5.0 µM ATP, 10 mM MgCl2, 0.01% Triton X-100, 1.5 µCi 33P-ATP, and 0.049 µg/µL α-Casein (cat. C8032 [100 mg], lot 116K7405; Sigma). Compounds were provided as 10-mM stocks in DMSO. Compounds were serially diluted 1:2 in 20% DMSO to create a 9-point concentration-response curve (0.32 to 0.001 µM final in 5% final DMSO concentration). The reaction was carried out at room temperature for 60 min and then quenched by adding 60 µL of 25% trichloroacetic acid (TCA). The reaction mixture (85 µL) was transferred to a 96-well Millipore Multiscreen FC Plate (MAFCNOB10) prewashed with 30 µL of 10% TCA, incubated at room temperature for 20 to 30 min, and then washed 3× with 10% TCA. Wells were dried before addition of 40 µL MicroScintTM20 (Packard; PerkinElmer) and then counted on a Topcount NXT (Packard; PerkinElmer). The percentage inhibition values from the 10-point concentration response data were subsequently analyzed, for example, using GraphPad Prism software (GraphPad Software, La Jolla, CA), using a four-parameter logistic equation. Absolute IC50 values were calculated from the resulting curve fit.
Kinase Selectivity Profiling: EMD Millipore’s KinaseProfiler Service
Kinase assays were conducted using EMD Millipore’s KinaseProfiler service according to the protocols detailed at http://www.millipore.com/techpublications/tech1/pf3036. 16
IC50 Determination of BI2536 in GPCs
IC50 was determined by titration with 12 compound concentrations ranging from log concentrations of 10−4 to 102 µM. The treatment regimen and determination of viability were as above. Dose-dependent response curves for each GPC line were generated using GraphPad Prism (GraphPad Software) and IC50 values were computed. IC50-based selectivity ratio was defined as the IC50 of NHA or NHNP/IC50 of GPC.
Tumor Neurosphere Assay
For each GPC line, 30 cells were flow-sorted into each well of 96-well plates using the BD FACSAria (BD Biosciences). Each well contained DMEM/F12 culture medium supplemented with growth factors. After a recovery period of 3 to 4 days, cells were treated at the IC50 values of BI2536 (ChemieTek, Indianapolis, IN). The number of neurospheres and their sizes were then scored 7 days posttreatment using Imaging Software NIS–Elements (Nikon, Tokyo, Japan). At point of measurement, a bona fide tumor neurosphere was defined as a single sphere with a diameter exceeding 20 µm. For the long-term BI2536 inhibition assay, BI2536 was removed by fresh media replacement 14 days posttreatment. Fresh media and growth factors were replenished twice a week. The number of tumor neurospheres and their sizes were then scored after 7 days of recovery.
Lentiviral Transduction
PLK1 knockdown was achieved through pLKO.1-based vectors purchased from Open Biosystems (Huntsville, AL; shPLK1 1: TRCN0000006247; 2: TRCN0000121074). Viral particles were packaged using the Lenti-X HTX Packaging System according to the manufacturer’s instruction (Clontech).
Statistical Analysis
Data are expressed as means ± standard error of the mean (SEM) of at least three independent experiments. Student t or the Mann-Whitney U test was used where appropriate. p ≤ 0.05 was accepted as statistically significant.
Microarray Data Acquisition of Tumor Neurospheres
For each sample, total RNA was isolated from tumor neurospheres using TRI Reagent (Molecular Research Center, Cincinnati, OH). Thereafter, RNA samples were hybridized to the Affymetrix GeneChip Human Genome U133 Plus 2.0 Array using the 3′ IVT express kit (Affymetrix, Santa Clara, CA). Samples were analyzed in duplicate chips, labeled as a and b (GEO accession number: GSE36782).
Bioinformatics Analysis of Public Data Sets
Since brain tumors are driven by gene expression, 10 we sought to determine PLK1-associated pathway networks by tapping into two public glioma data sets, REMBRANDT 12 and Gravendeel. 11 Raw data (CEL files) were downloaded from REMBRANDT application and gene expression omnibus (GEO) databases (GSE16011). The probe signals were processed using the mas5 algorithm, and nonexonic probes were removed. The probe set signals were consolidated to derive a unique gene-wise matrix as described in the gene filter package from R/bioconductor. 17 Briefly, the preprocessing approach restricted for probe sets having an Entrez gene identifier and assigned the highest signaling probe set for the genes with multiple probe sets. Pairwise interaction for the genes was measured using a rank-based correlation method. The PLK1 coexpressed genes were selected based on a cutoff coefficient (r s) of ±0.5. The same strategy was applied to both glioma data sets, and the PLK1 coexpressed genes with consensus were selected as the PLK1 coexpressed gene module. The PLK1 coexpressed gene module was allowed to self-cluster among the glioma patients, and the stratification pattern was dissected using the cutree option in R. The self-clustered patient groups based on the PLK1 gene module were correlated for the survival pattern using the log-rank test. A Cox regression model accounting for critical clinical covariates (age and histology) was built to assess the independent association of PLK1-based subgroups and survival. All statistical analysis was performed using R/bioconductor packages.
Pathway Analysis
The biological relevance of the PLK1 coexpressed module was investigated by two different approaches. Metacore from GeneGo (Carlsbad, CA) was explored to identify the significantly enriched biological pathways. Pathways with significant enrichment p-values of less than 0.05 were reported as significantly enriched networks. In addition, we used Gene Set Enrichment Analysis (GSEA) to test the gene module with the molecular signature database using the GSEA tool downloaded from the Broad Institute portal. 18 We preselected 181 gene sets related to stemness behavior from the molecular signatures database (MSigDB). 19 The PLK1 coexpressed gene module was tested for the enrichment with stemness signature gene sets. The significantly enriched associations were summarized as enrichment and the statistical scores were reported.
Results
GPCs Phenocopy the Primary Tumor
GPCs are typically cultured as spheroid structures in serum-free condition supplemented with bFGF and EGF. 5 In some studies, the cells are grown as adherent monolayers on laminin, with the latter shown to regulate GPC survival via integrin α6 recently. 20 Conceivably, these varying culture methods provide flexibility in the types of downstream analyses; for instance, adherent cells would facilitate high-content screens. 7 These growth conditions highlight the intricate balance between intracellular and cell surface signaling. Our study here defines key experimental designs to detect GPC activity and evaluates the clinical significance of GPCs in patient databases ( Fig. 1 ).
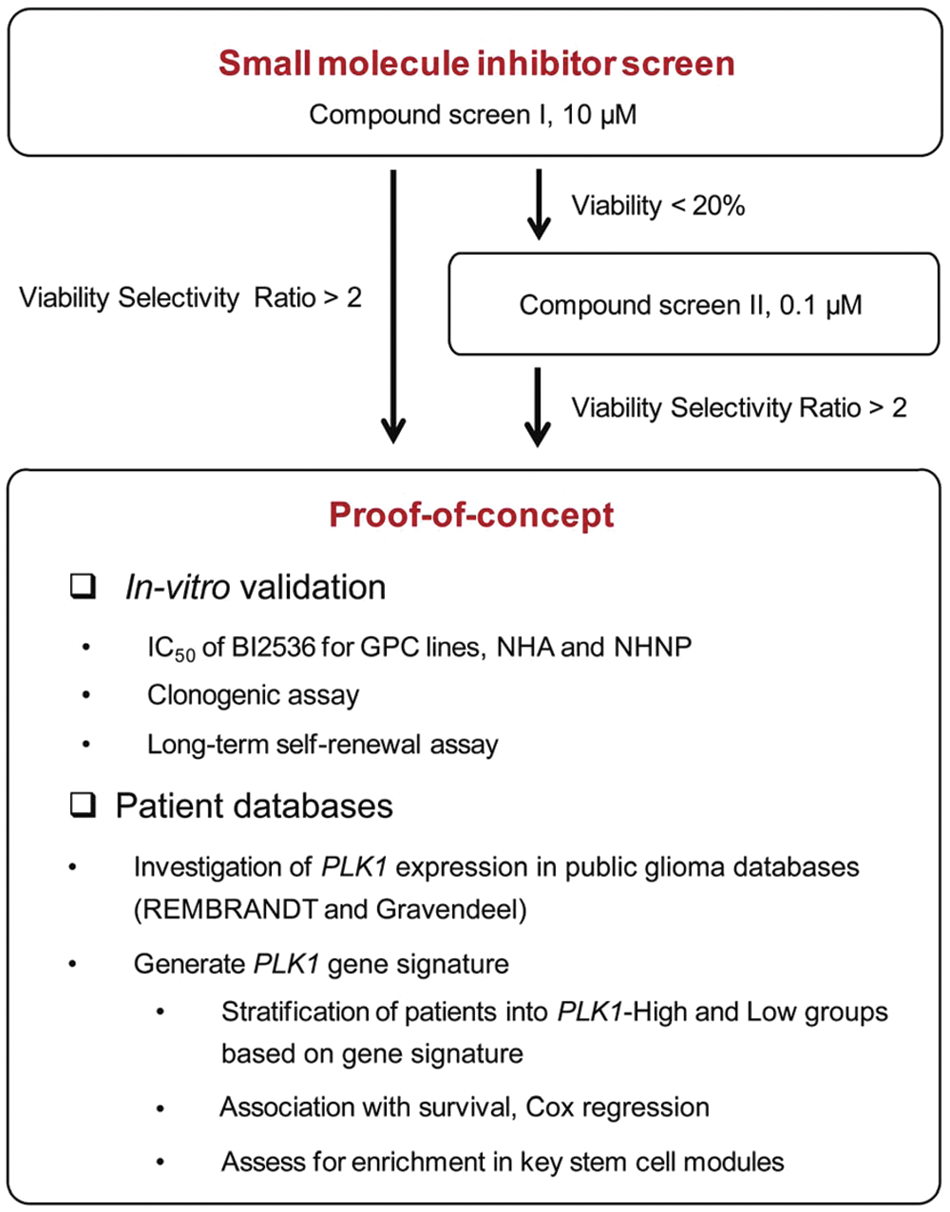
Flowchart of study. Glioma-propagating cells (GPCs) were characterized by serial transplantation in NOD-SCID gamma mice, cytogenetic analysis, and molecular classification. Subsequently, a small-molecule screen identified Plk1 among several known regulators of GPCs. We then evaluated the effects of the Plk1 inhibitor, BI2536, through serial sphere formation. The clinical relevance of PLK1 high and low expression-associated genes was interrogated in two large, independent patient glioma databases, REMBRANDT and Gravendeel. NHA, normal human astrocytes; NHNP, normal human neural progenitor cells.
In pursuing the use of GPCs as in vitro cellular screening systems, we sought to verify that our cell collections phenocopy the original primary tumors both at the cellular and molecular levels. Our GPCs formed serially transplantable tumors in NOD-SCID gamma mice, reflecting the property of long-term, self-renewing tumorigenicity. 13 Importantly, pathological analyses revealed infiltrative primary tumor-like features of pseudopalisading cells and large areas of necrosis interspersed with vascularization ( Fig. 2Ai – iii ). Cytogenetic analysis confirmed the presence of karyotypic hallmarks typically found in the primary tumor—notably, amplification of chromosome 7 (where EGFR lies) and deletion of chromosome 10 (where PTEN lies) ( Fig. 2B ). As gene expression drives glioma disease progression and survival outcome, 10 we further analyzed the molecular patterns of our GPCs, based on a gene signature previously shown to stratify GPC subtypes according to the existing primary tumor molecular subclasses. 21 By leveraging on additional publicly available GPC gene expression data (GSE8049, GSE15209, GSE7181), we defined two subclasses in our own collection: proneural (NNI-1 to 5, 8) and mesenchymal (NNI-9 to 11) ( Fig. 2C ). Proneural GPCs (majority group) are typified by upregulation of SOX11 and ASCL1, whereas mesenchymal GPCs demonstrate upregulated transforming growth factor β (TGFβ) response genes, TGFBI and COL1A2. The ability to molecularly subtype our GPCs is important as it identifies signaling pathways potentially important in the therapeutic targeting of self-renewing cells within the heterogeneous tumor mass.
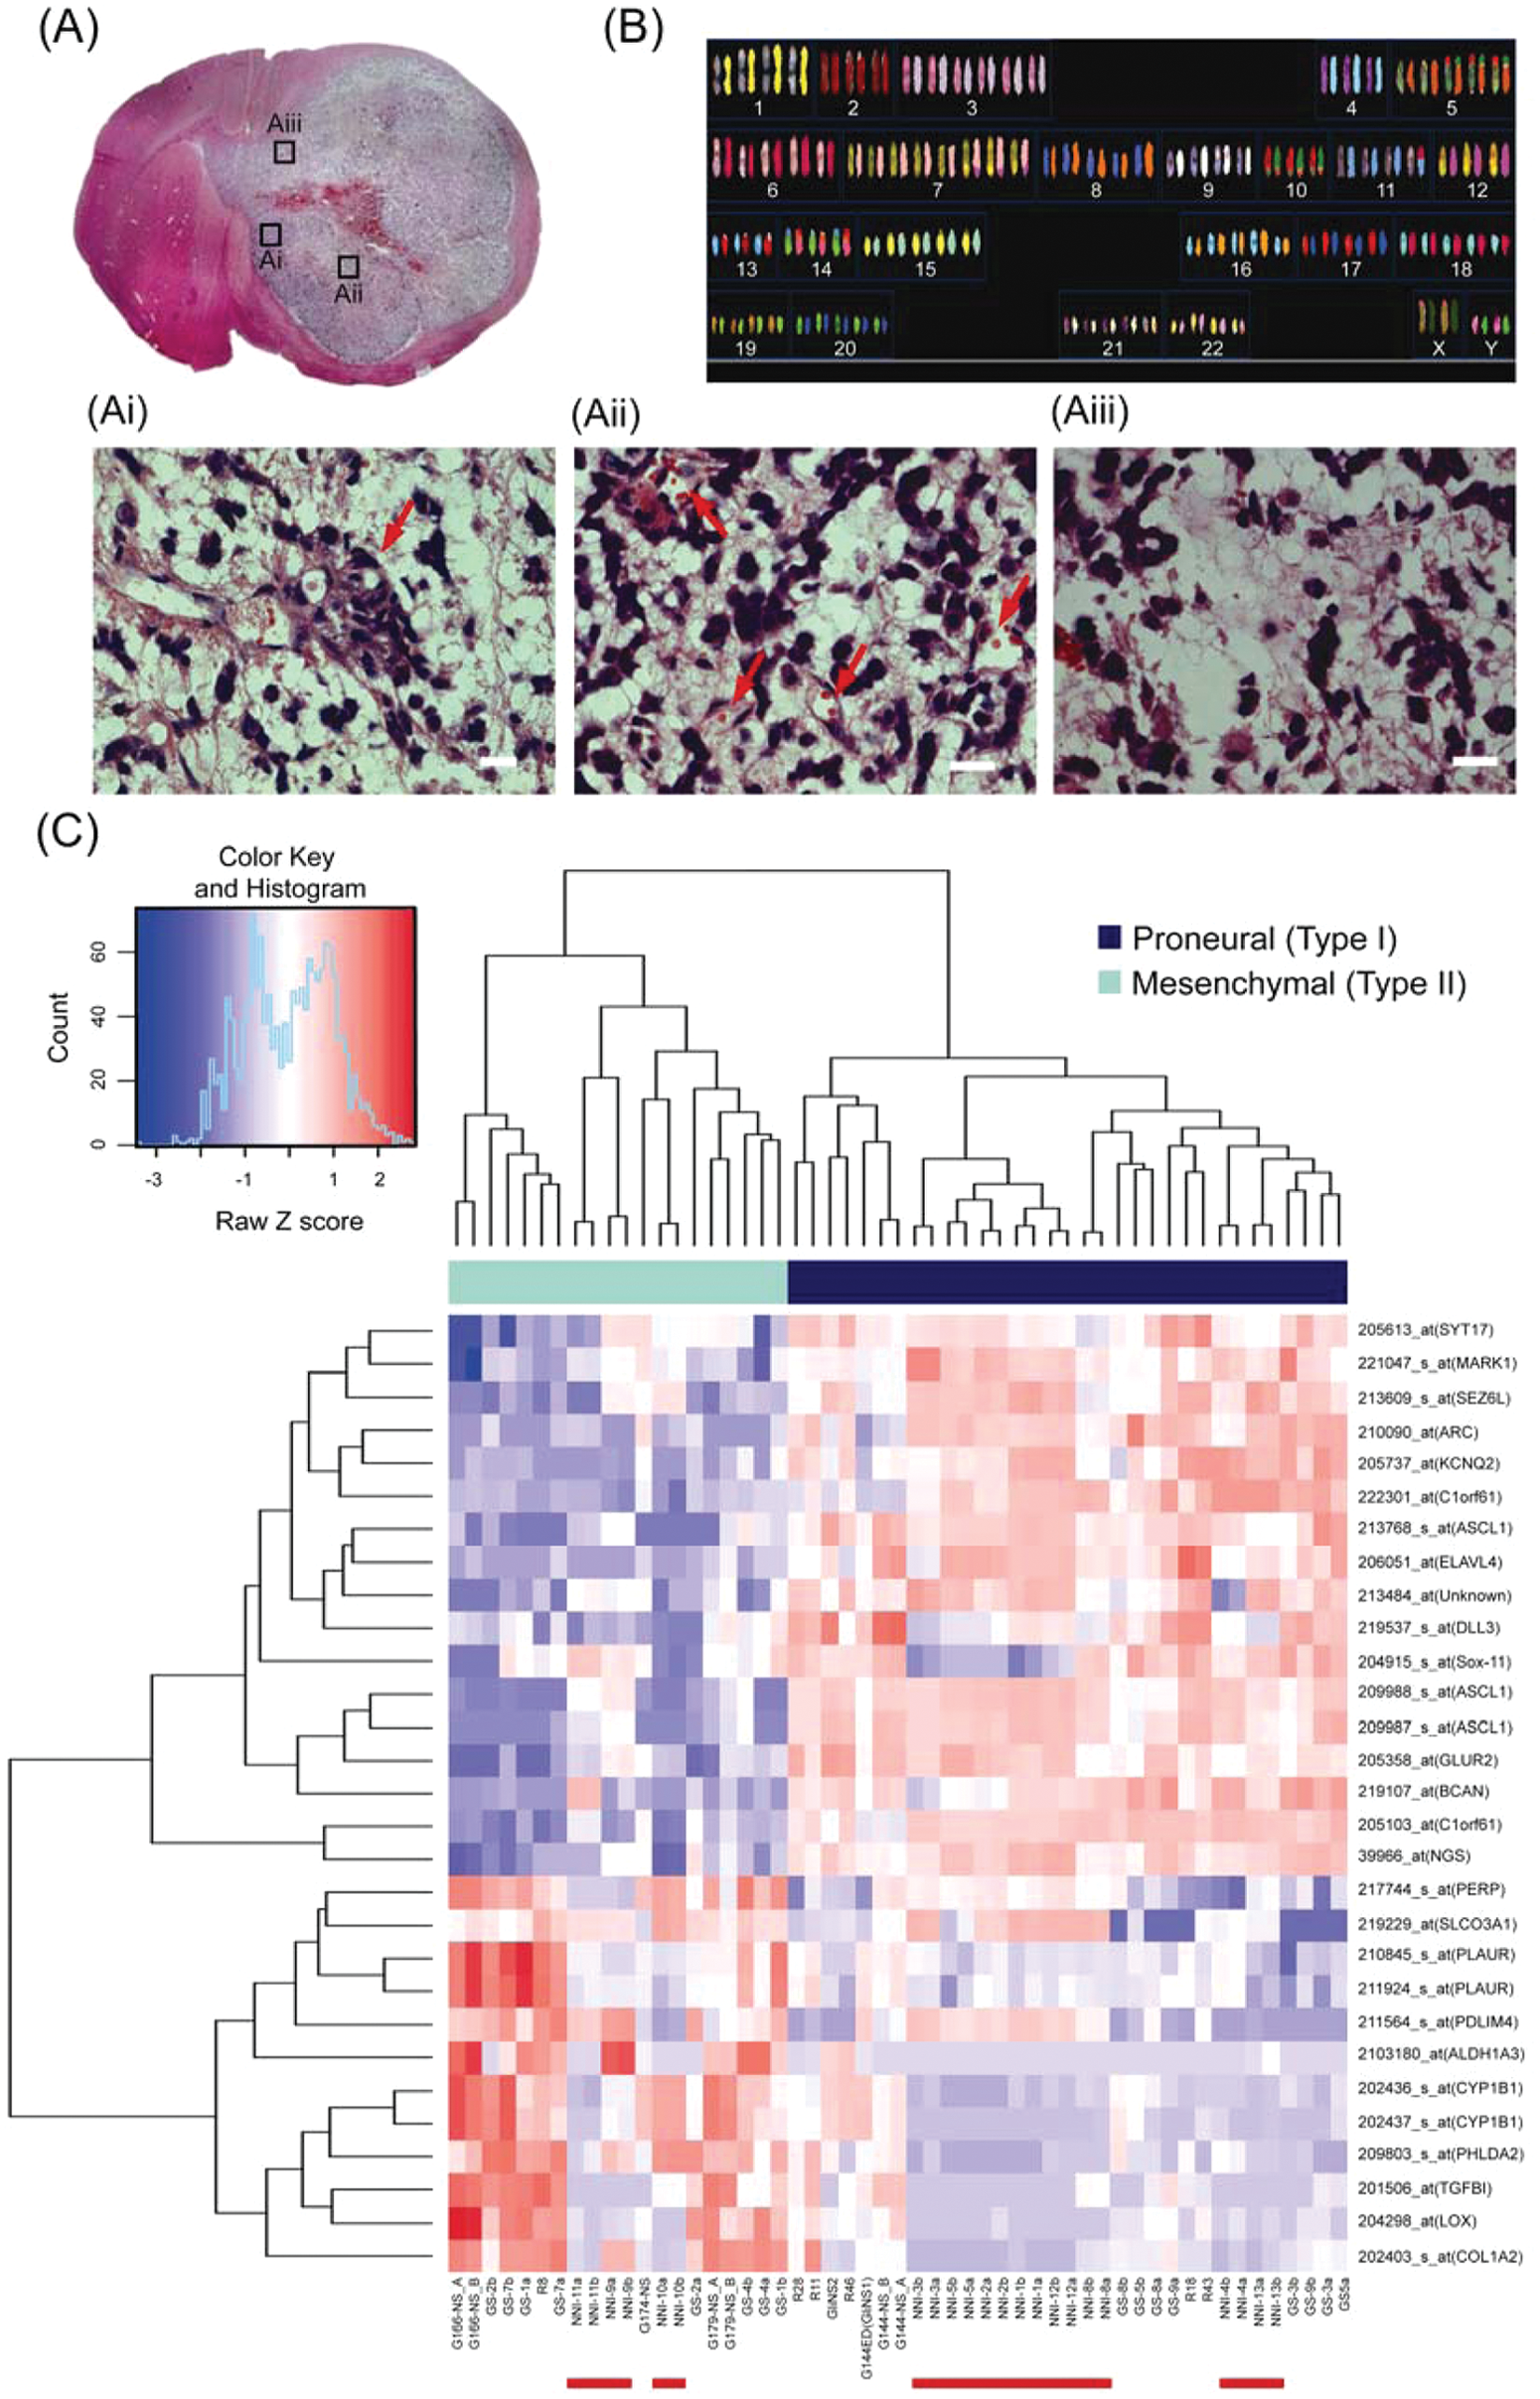
Glioma-propagating cells (GPCs) cultured in serum-free condition retain primary tumor phenotype. (
To identify regulators of GPC survival, we adapted the screen design of Diamandis et al. 7 Briefly, to facilitate an initial, higher throughput screen of 50 small molecules targeting various oncologic pathways, we carried out two steps: (1) We assayed for viability after 5 days of treatment with compounds at 10 µM using four GPC lines ( Fig. 3A ). Compounds that reduced viability by more than 80% were subjected to (2) a second screen conducted at 0.1 µM compound ( Fig. 3B ). We then prioritized candidates that showed selectivity ratios >2 in at least one GPC line ( Fig. 3C ). The selectivity ratio represents % viability in normal mouse astrocytes (C8-D1A)/% viability in GPC; consequently, a higher ratio reflects selectivity of GPC over normal astrocytic cells, the latter of which characterize the predominant cell type in glioma. Notably, three compound classes were identified that have already been implicated in GPC survival, thus validating our screening method—PI3K/Akt, GSK3β, Cdk1 and 9, and Tak1 inhibitors.22,23 Interestingly, a compound targeting Plk1 emerged (LSN00035), potentially identifying Plk1 as a regulator of GPC survival.
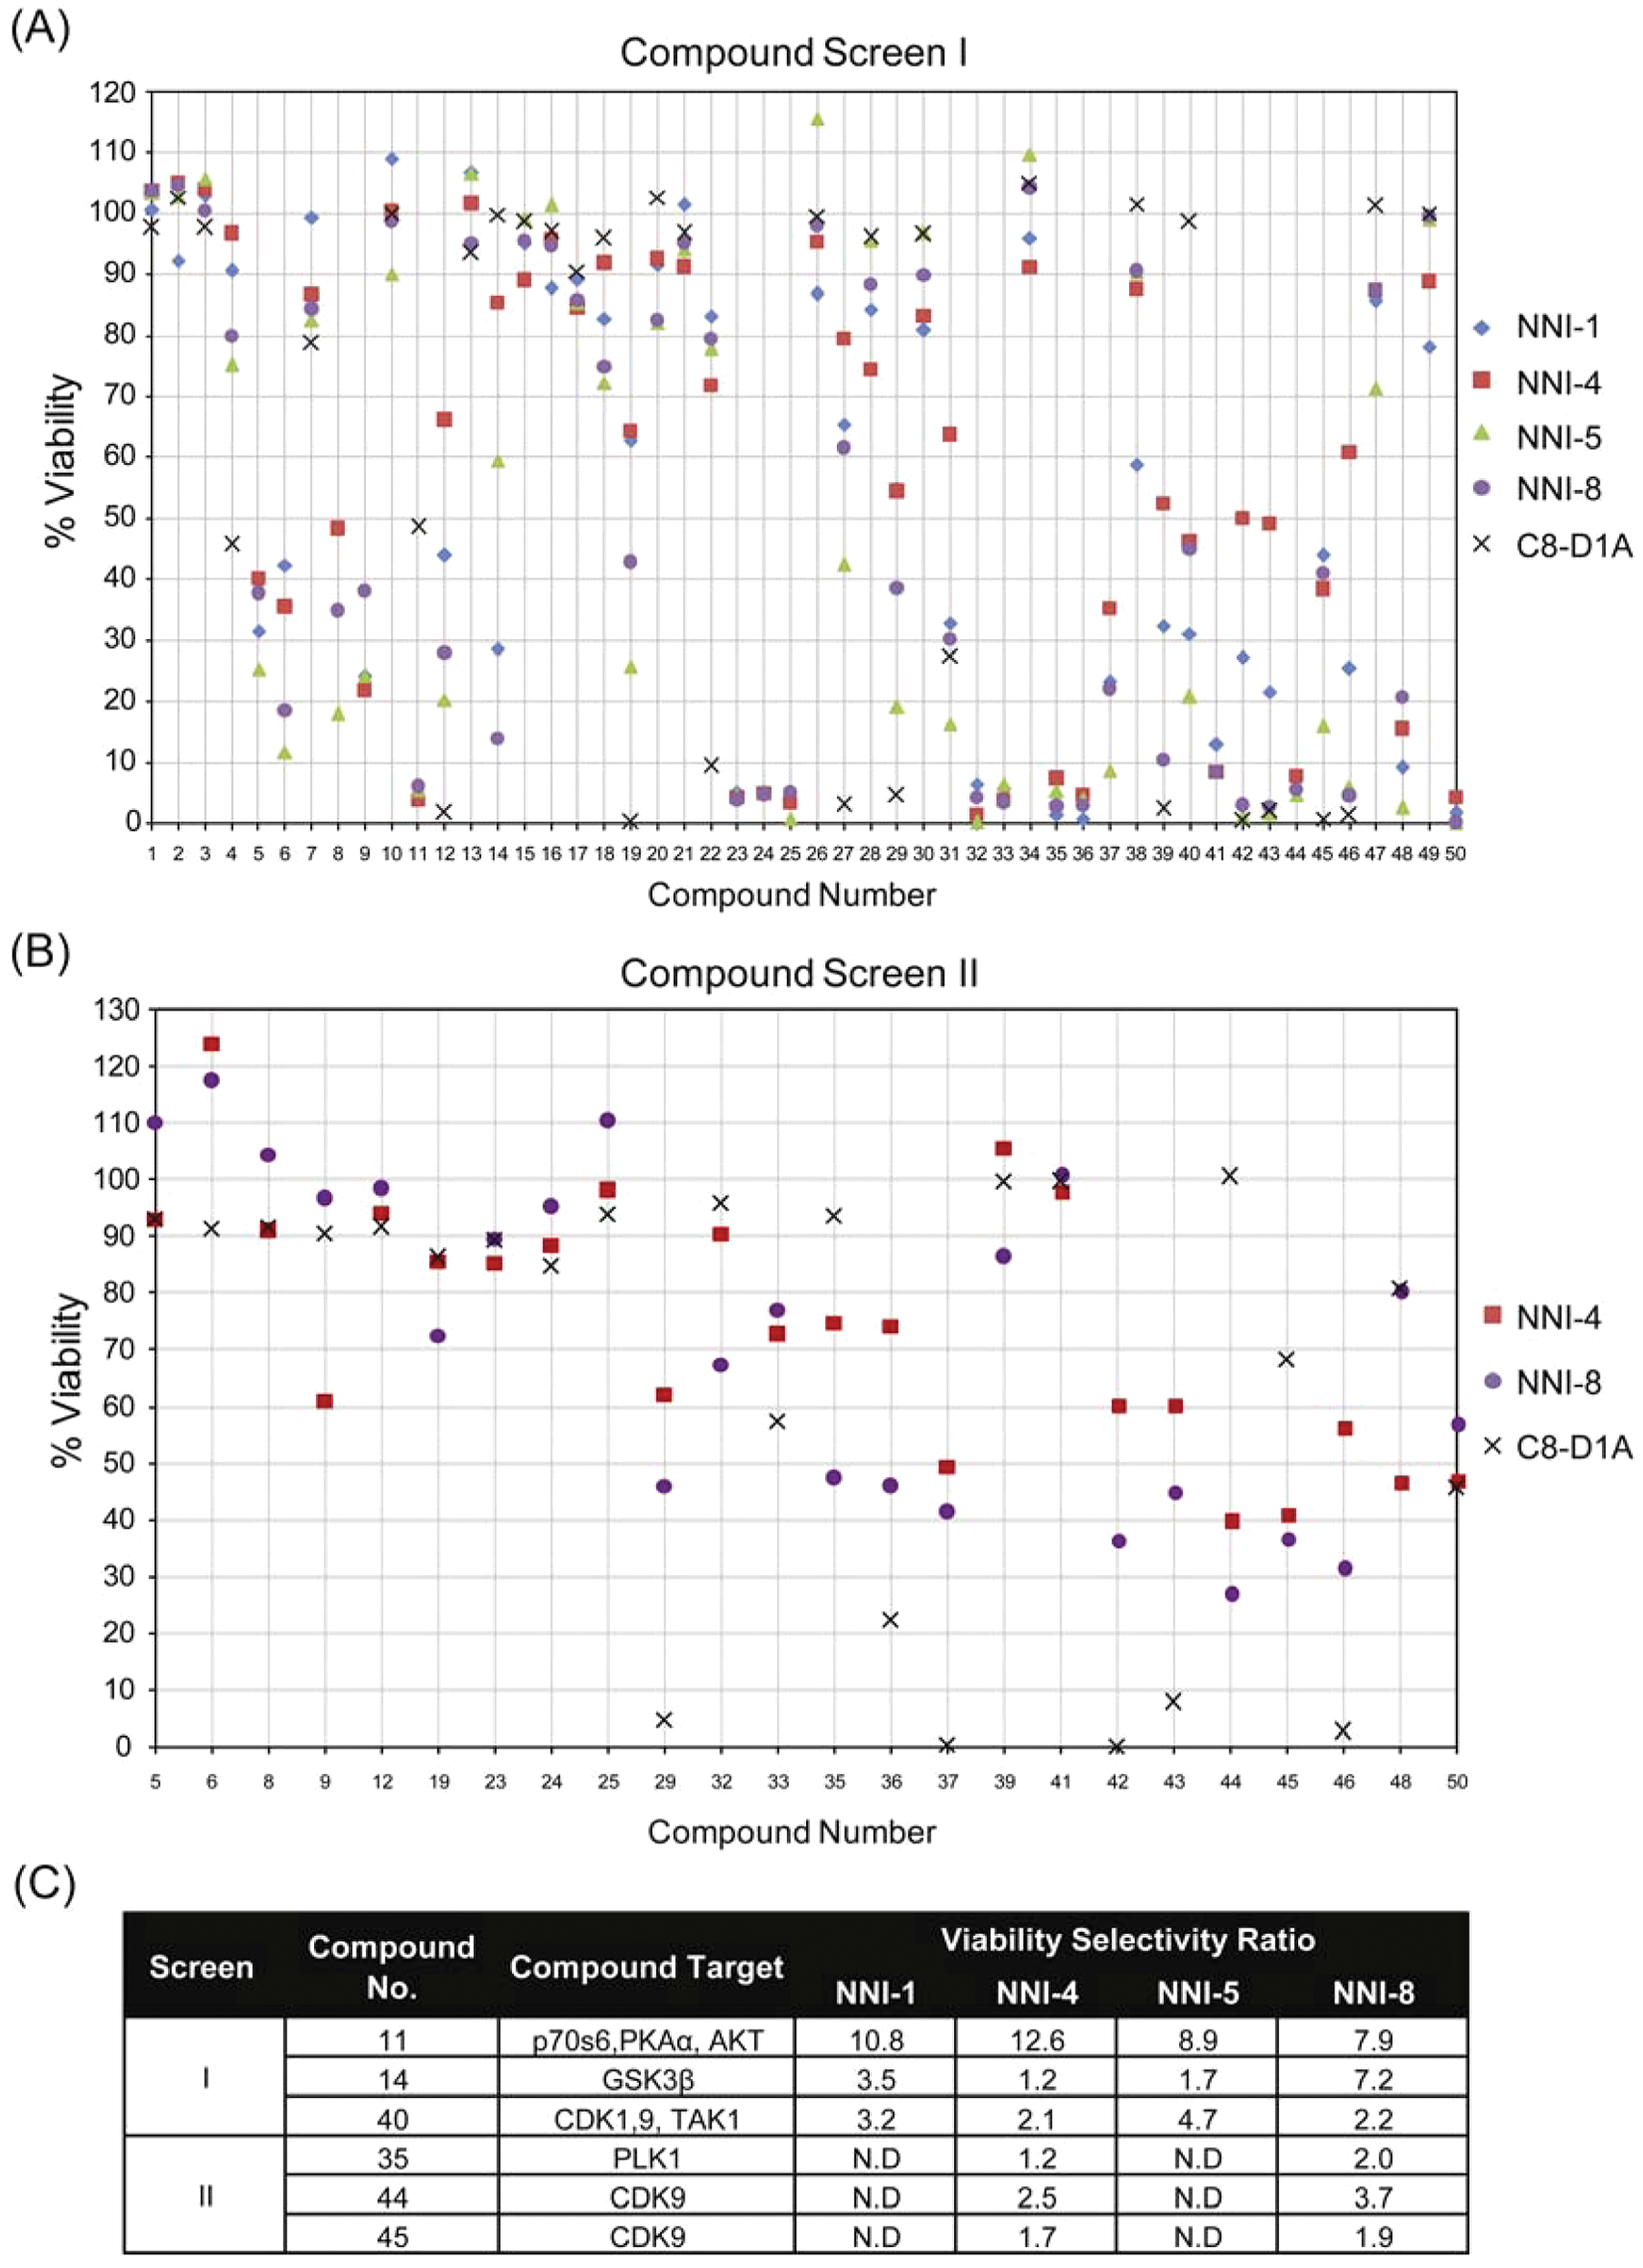
Small-molecule screen identifies glioma-propagating cell (GPC) inhibitory compounds. GPCs (NNI-1, 4, 5, and 8) and normal mouse astrocytes (C8-D1A) were subjected to drug treatment at (
BI2536, a Polo-like Kinase 1 Inhibitor, Regulates GPC Self-renewal and Proliferation
As an initial approach to verify that Plk1 constitutes a regulatory pathway for GPCs, we chose a well-published Plk1 inhibitor, BI2536 ( Table 1 , kinase selectivity profile; Fig. 4Ai ). BI2536 is currently in clinical trials for other cancers but not in glioma. 24 Similarly, BI2536 demonstrated at least more than a 24.6-fold increase in the selectivity ratio when NHNPs were used as the comparator cell line and at least more than 1.4-fold when NHA cells were used ( Fig. 4Aii ). Unlike NHA cells, NHNP cells are grown under identical conditions to GPCs (i.e., serum free, supplemented with growth factors) and may reflect a more equivalent condition for comparison. Notably, this inhibitory effect was observed in both proneural (NNI-1, 4, 5, 8, 12) and mesenchymal (NNI-10, 11) GPC subtypes, with reasons being apparent in subsequent bioinformatical analyses.
BI2536 Kinase Selectivity Profile
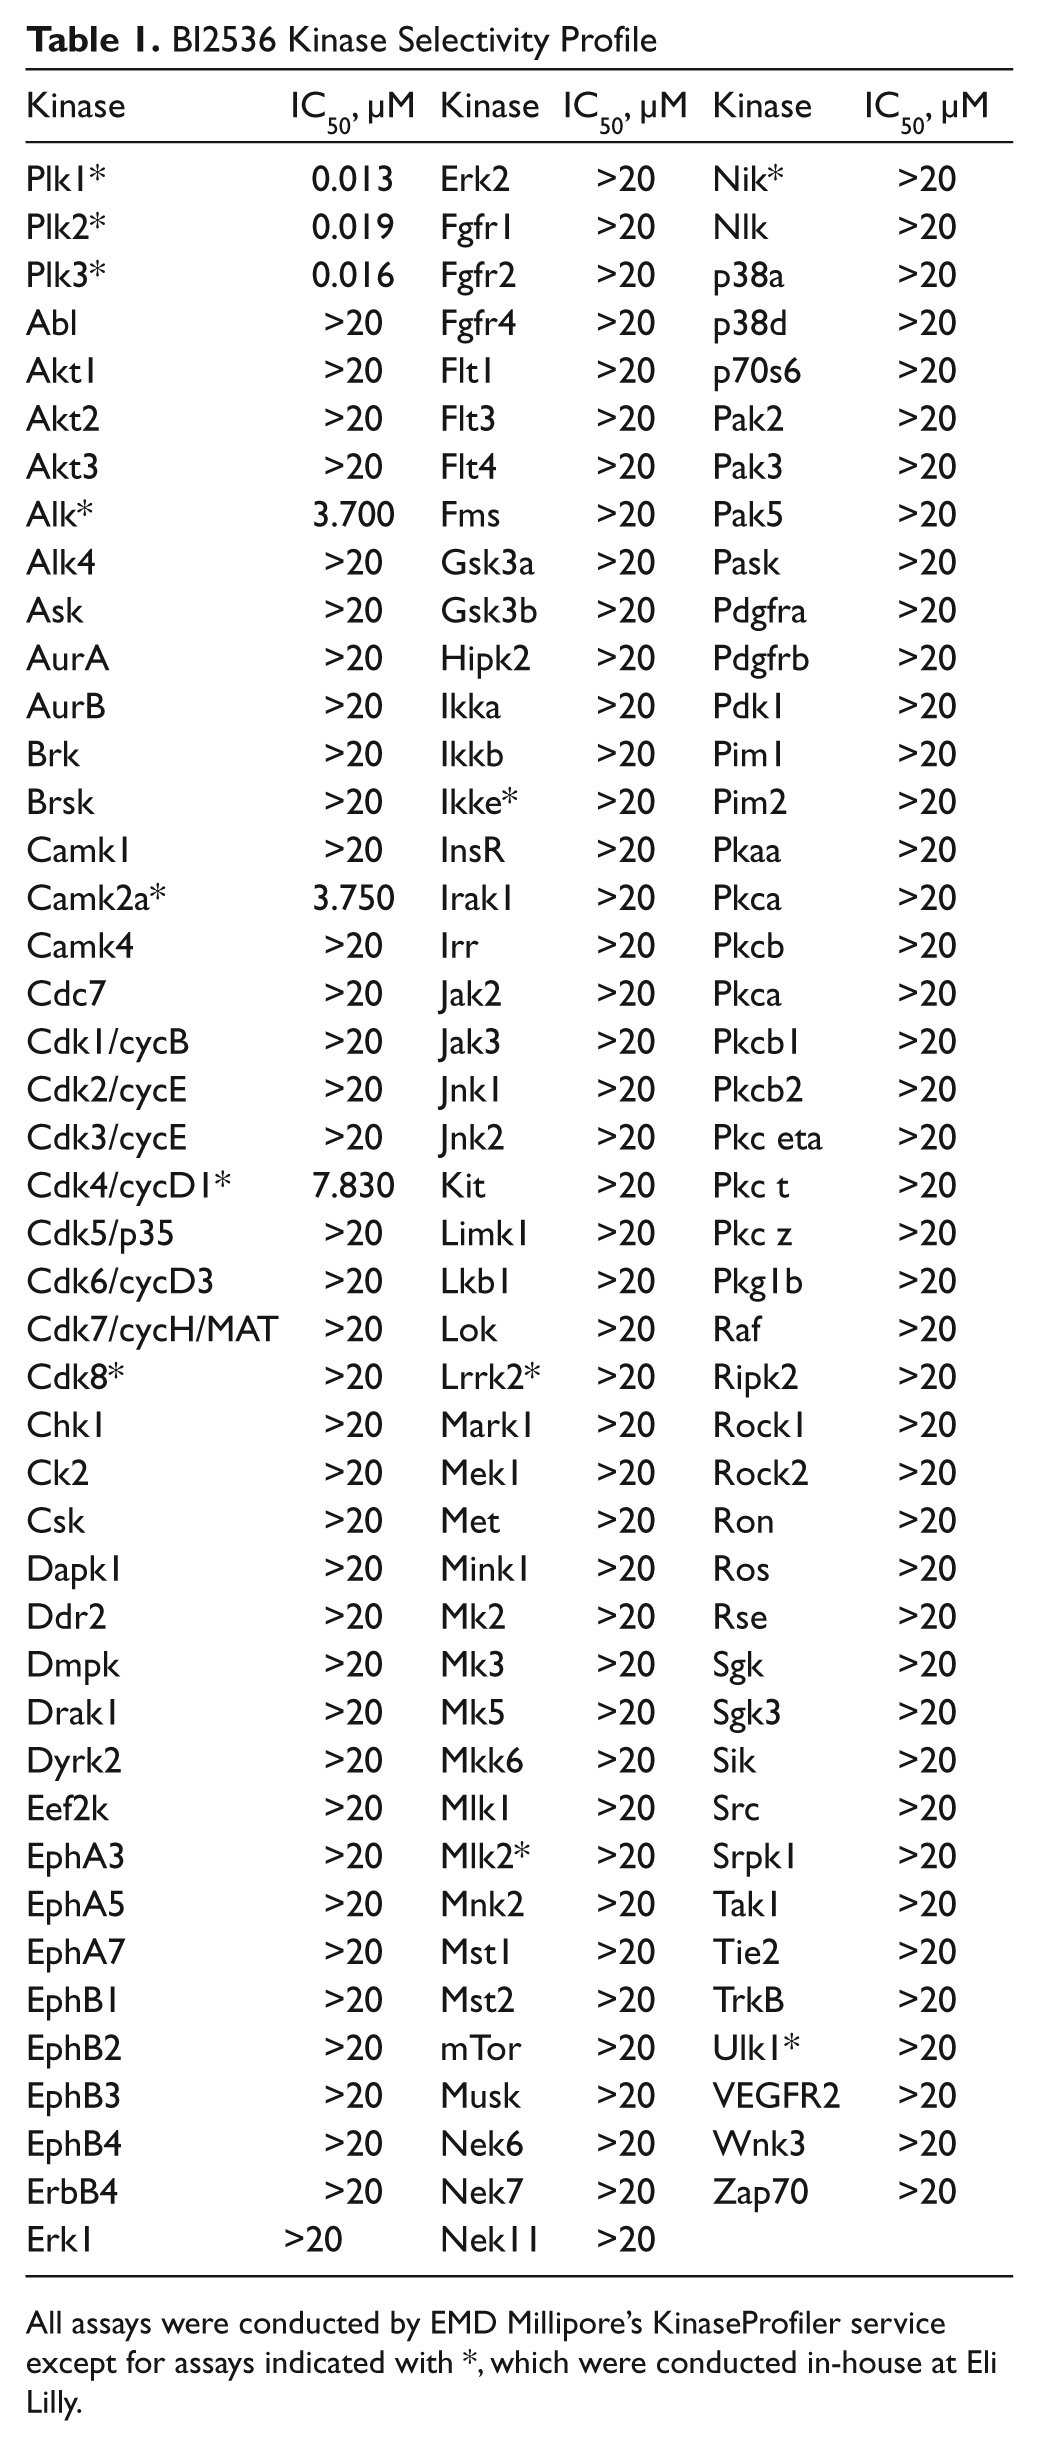
All assays were conducted by EMD Millipore’s KinaseProfiler service except for assays indicated with *, which were conducted in-house at Eli Lilly.
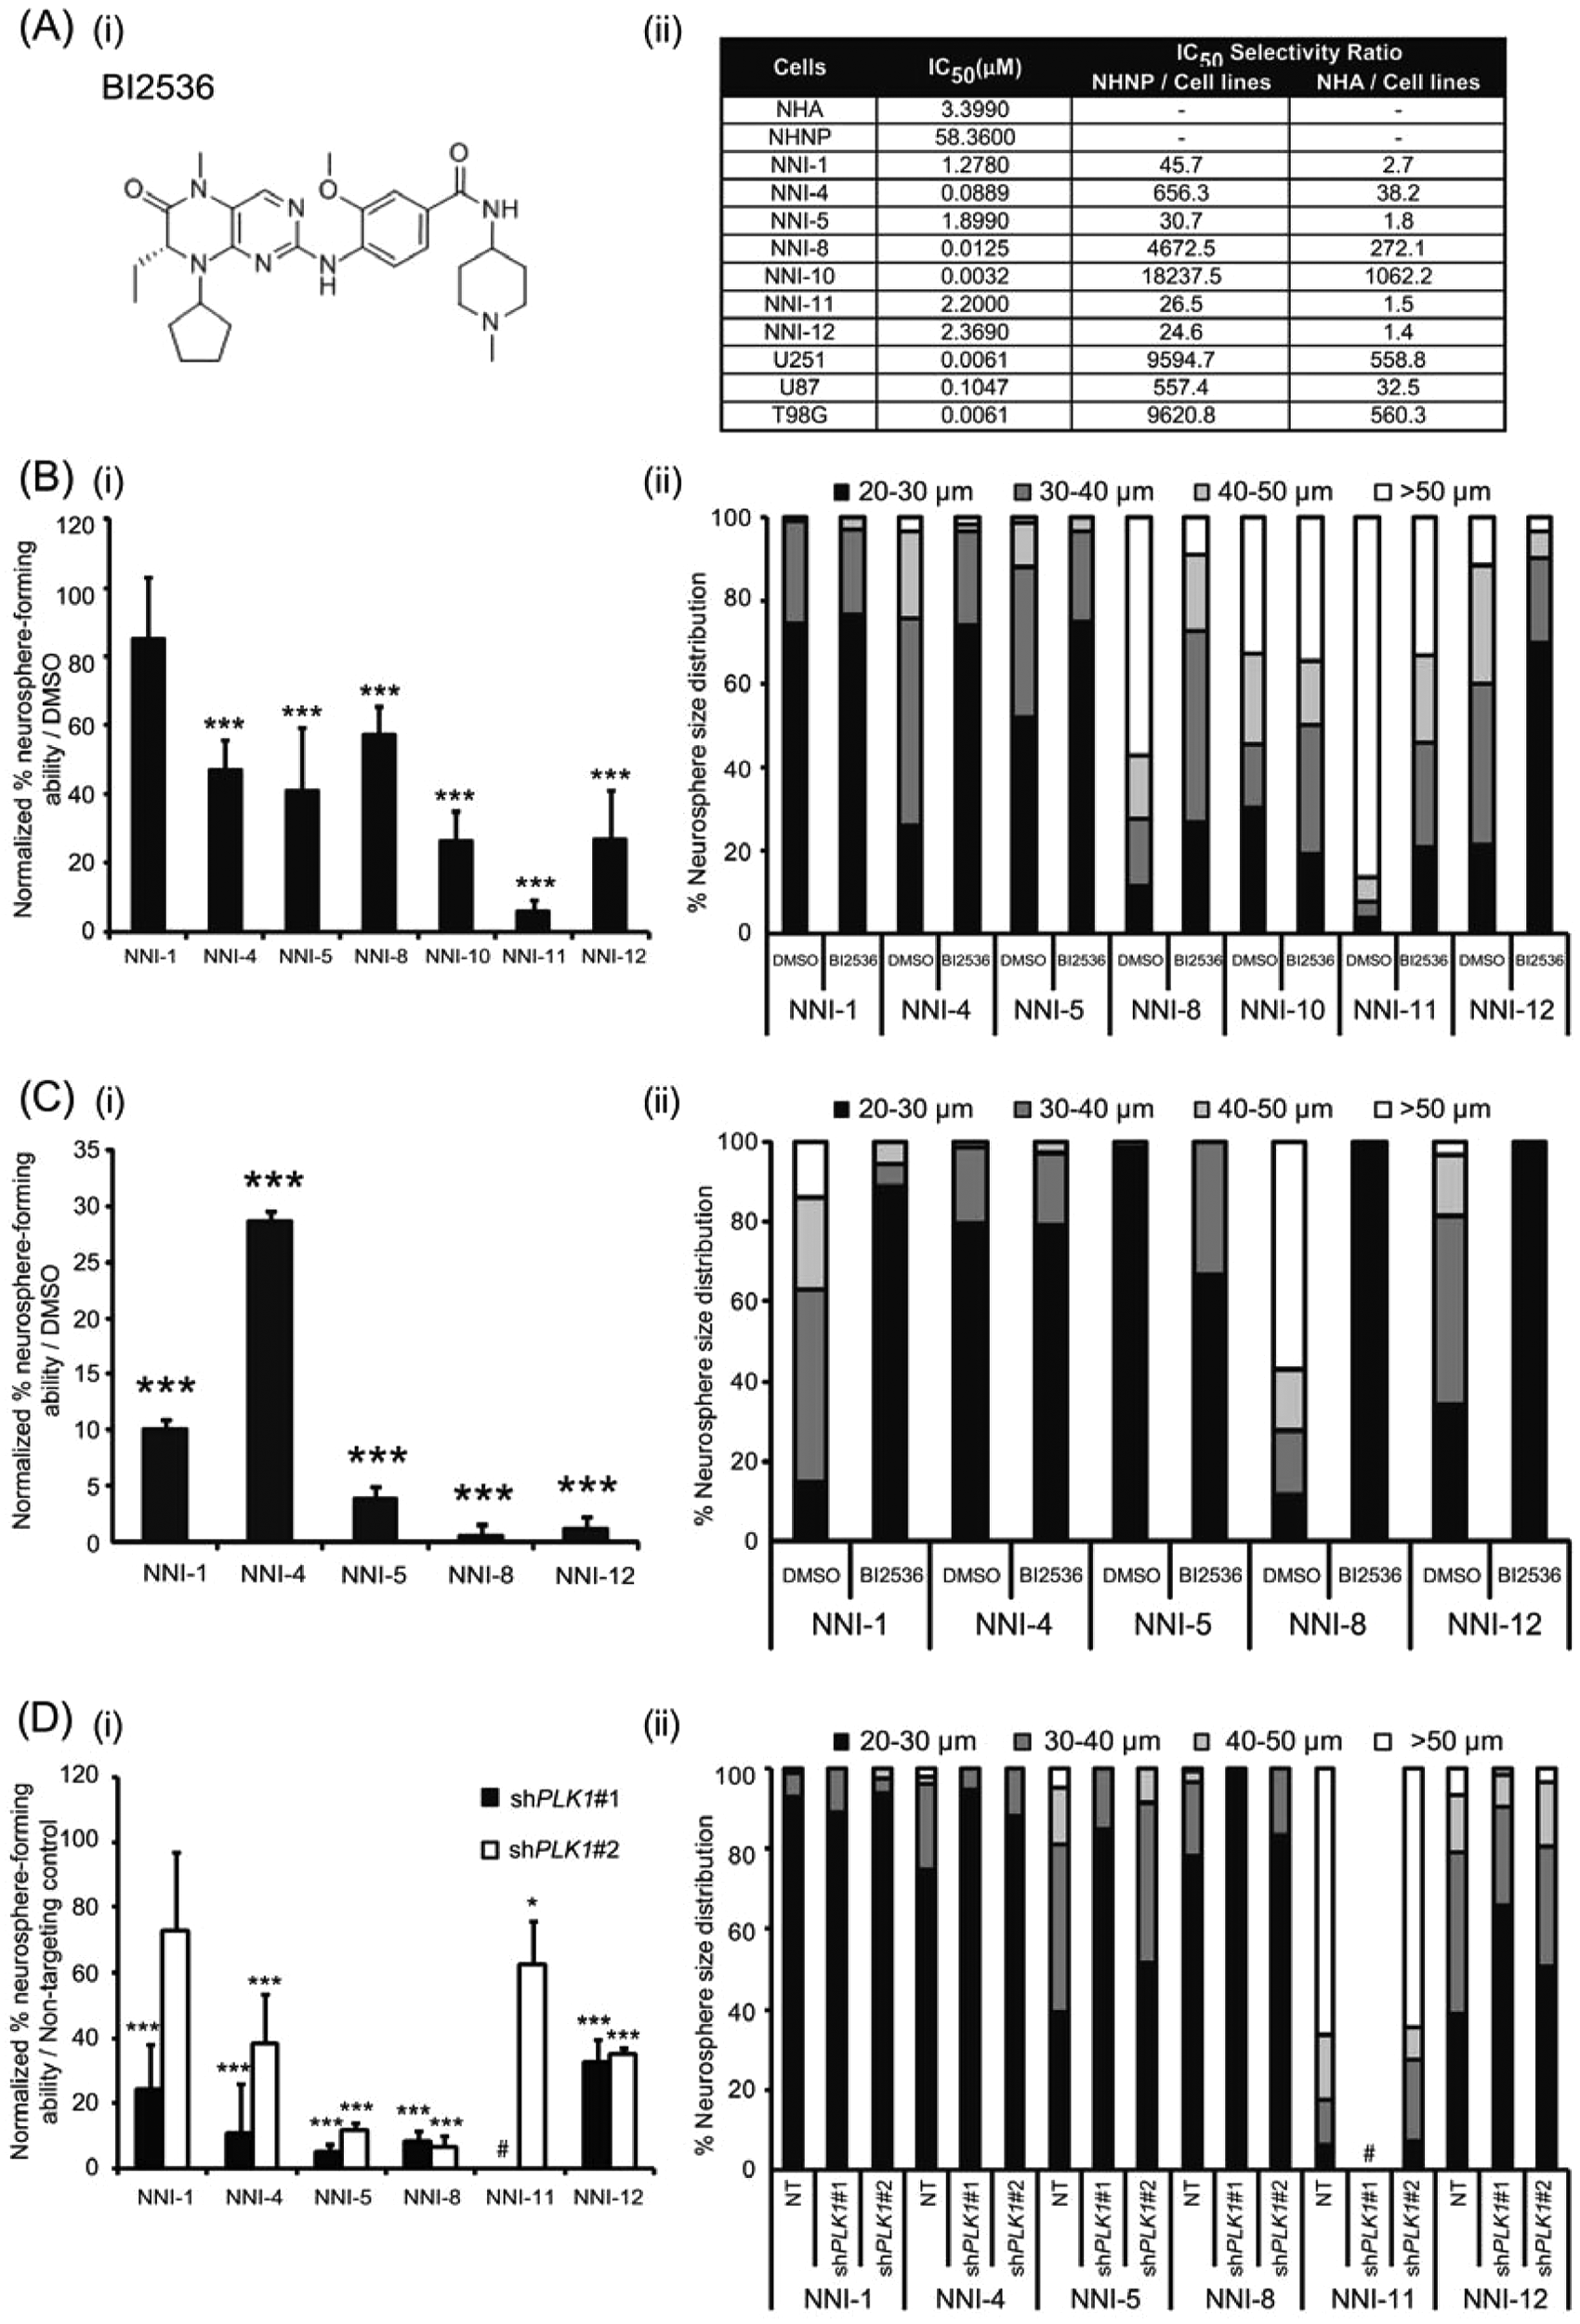
BI2536 abrogates glioma-propagating cell (GPC) self-renewal and proliferation. (
Next, we determined sphere-forming activity upon BI2536 treatment at IC50 values over 7 days. Sphere-forming assays when carried out over an extended period reflect the approximate frequency of bona fide slow-growing GPCs, as opposed to transient-amplifying progenitors that are detected in short-term viability assays. 6 Such assays discern the self-renewing population in heterogeneous spheres. We observed that BI2536 treatment reduced sphere number by at least 2-fold ( Fig. 4Bi ) with concomitant reduction in sphere size ( Fig. 4Bii ), the latter being an indicator of GPC proliferation.
Finally, to ascertain if BI2536 treatment sustains long-term inhibition against GPCs, we adapted the sphere assay where, after 14 days of treatment, we changed to fresh medium without the drug and determined viability after another 7 days. We rationalized that this would detect the ability of self-renewing cells to recover over an extended period of 21 days and would reflect BI2536’s ability to target bona fide GPCs as opposed to transient-amplifying progenitors. Replenishment of growth factors was carried out twice weekly to maintain GPCs in their undifferentiated state, as differentiated cells have been associated with reduced tumorigenic potential.
9
Strikingly, we observed a greater than 10-fold reduction in sphere number at 21 days for four of five GPC lines (
Fig. 4Ci
). Reduced GPC proliferation was similarly observed in all GPCs (
Fig. 4Cii
). In conclusion, Plk1 inhibition effectively mitigates GPC self-renewal frequency and proliferation. We have also confirmed this mechanism through lentiviral-mediated PLK1 knockdown experiments and observed that sphere-forming ability and proliferation in both proneural and mesenchymal GPCs were severely abrogated and correlated with the level of Plk1 protein depletion (
Fig. 4D
and
PLK1 Expression Stratifies Glioma Patient Survival and Associates with Tumor Grade and Molecular Classification
Although GPCs have been shown to recapitulate the biological phenotypes, karyotypic patterns, and molecular fingerprint of their primary tumors,
5
little is known if they are clinically relevant. A key question is whether pathways identified in GPCs contribute to disease progression and patient survival outcome. We approached this issue by first assessing PLK1 mRNA expression in glioma tissue compared with normal adjacent tissue in two large, independent, public clinical databases, REMBRANDT and Gravendeel.11,12 Our data show that PLK1 is upregulated in tumor tissue, consistent with the basis of our earlier selectivity ratios to prioritize candidate compounds (
Fig. 5A
). Second, we determined genes associated with high and low PLK1 expression (
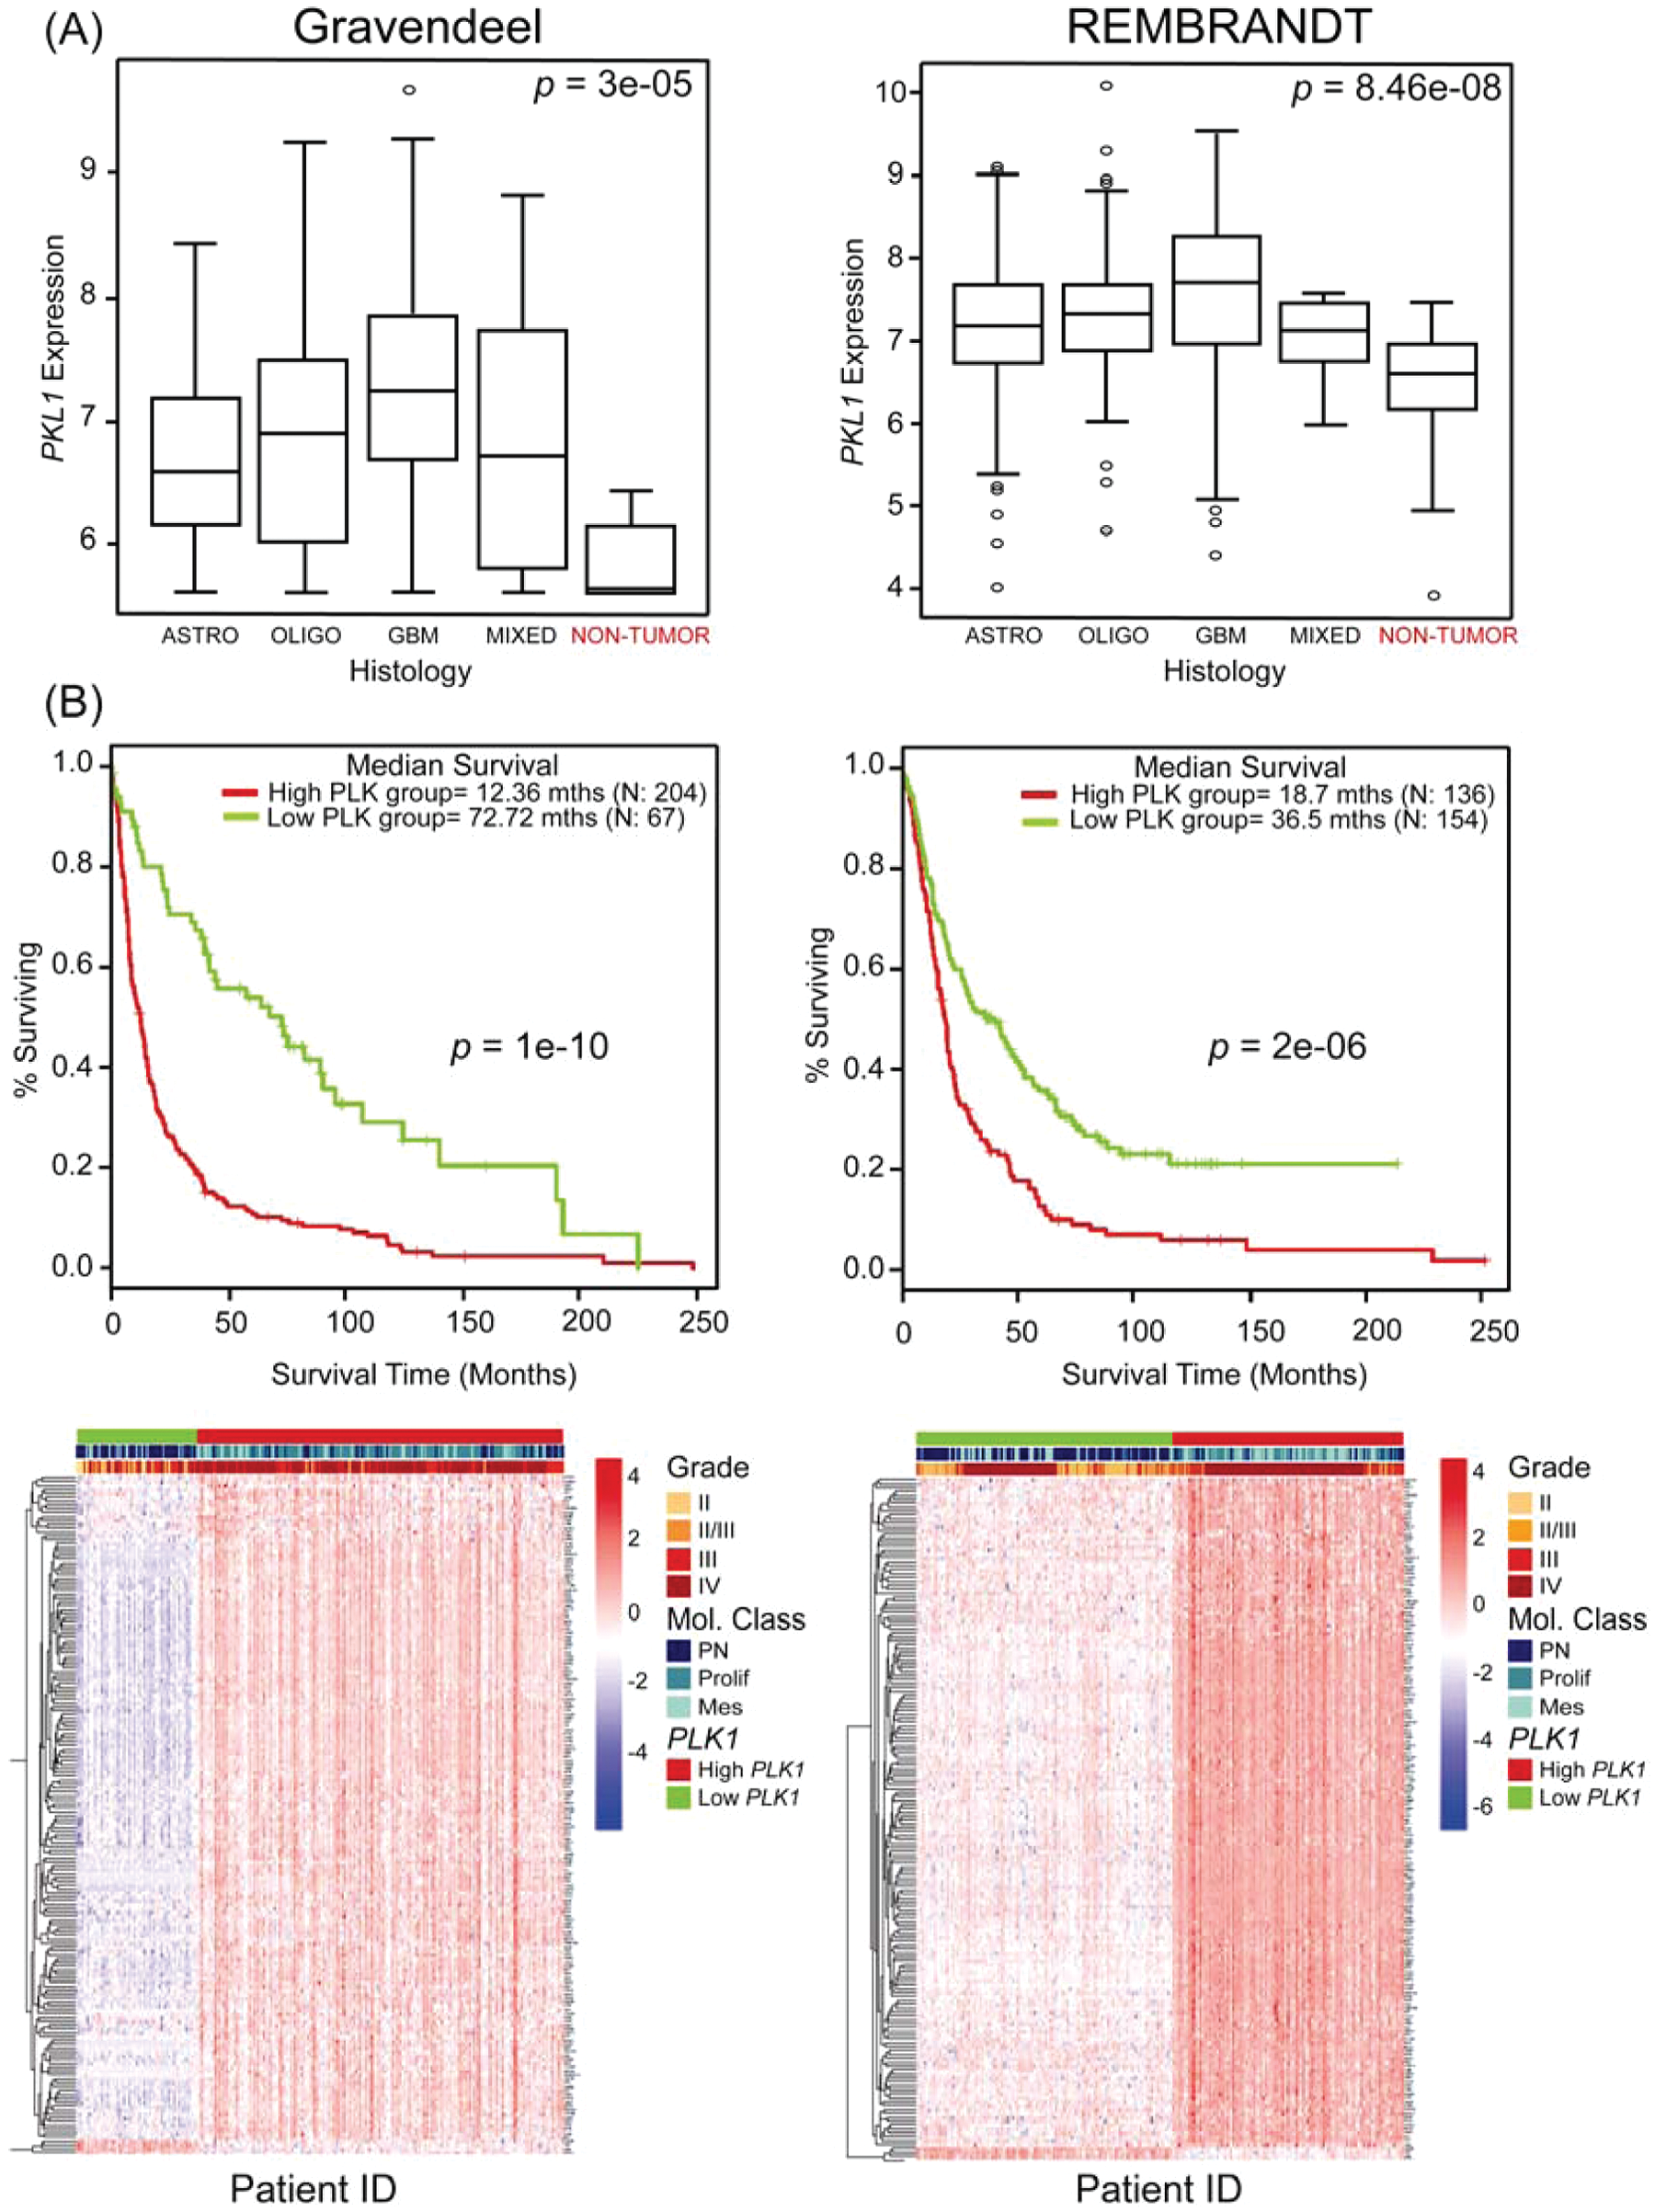
PLK1-associated gene expression is a negative prognostic factor in glioma patients. (
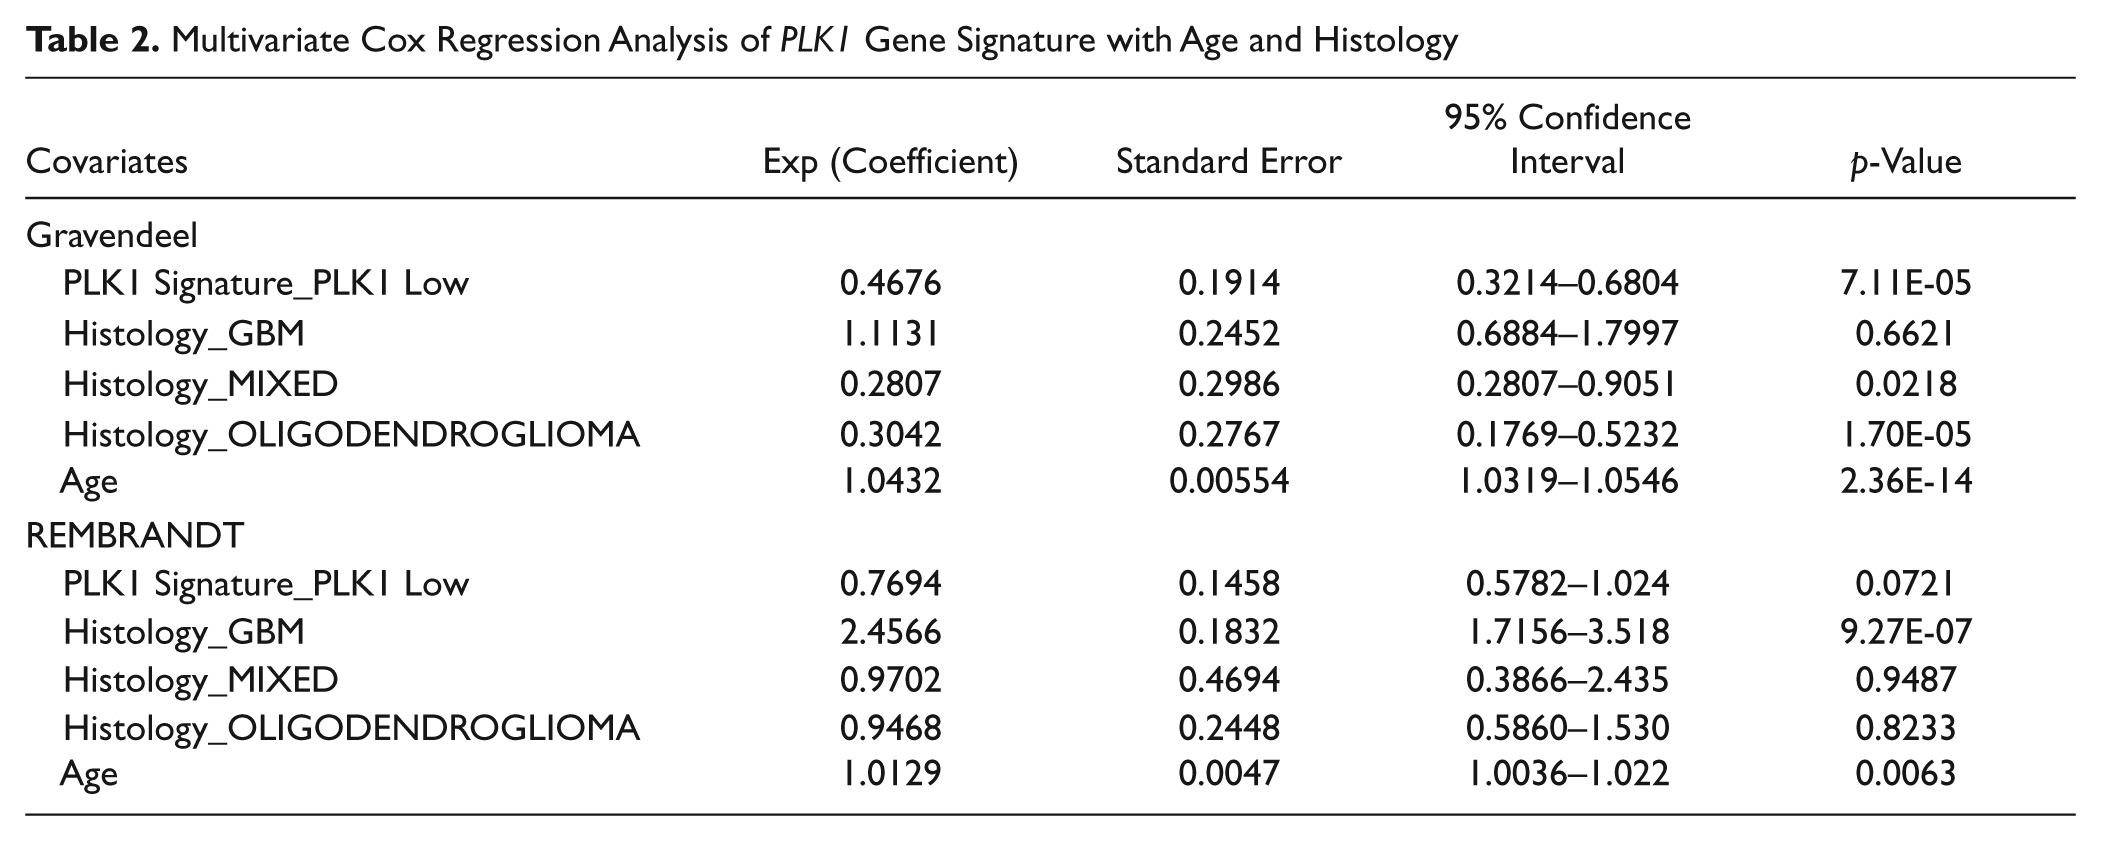
Multivariate Cox Regression Analysis of PLK1 Gene Signature with Age and Histology
Summary of Gene Set Enrichment Analysis (GSEA) Results
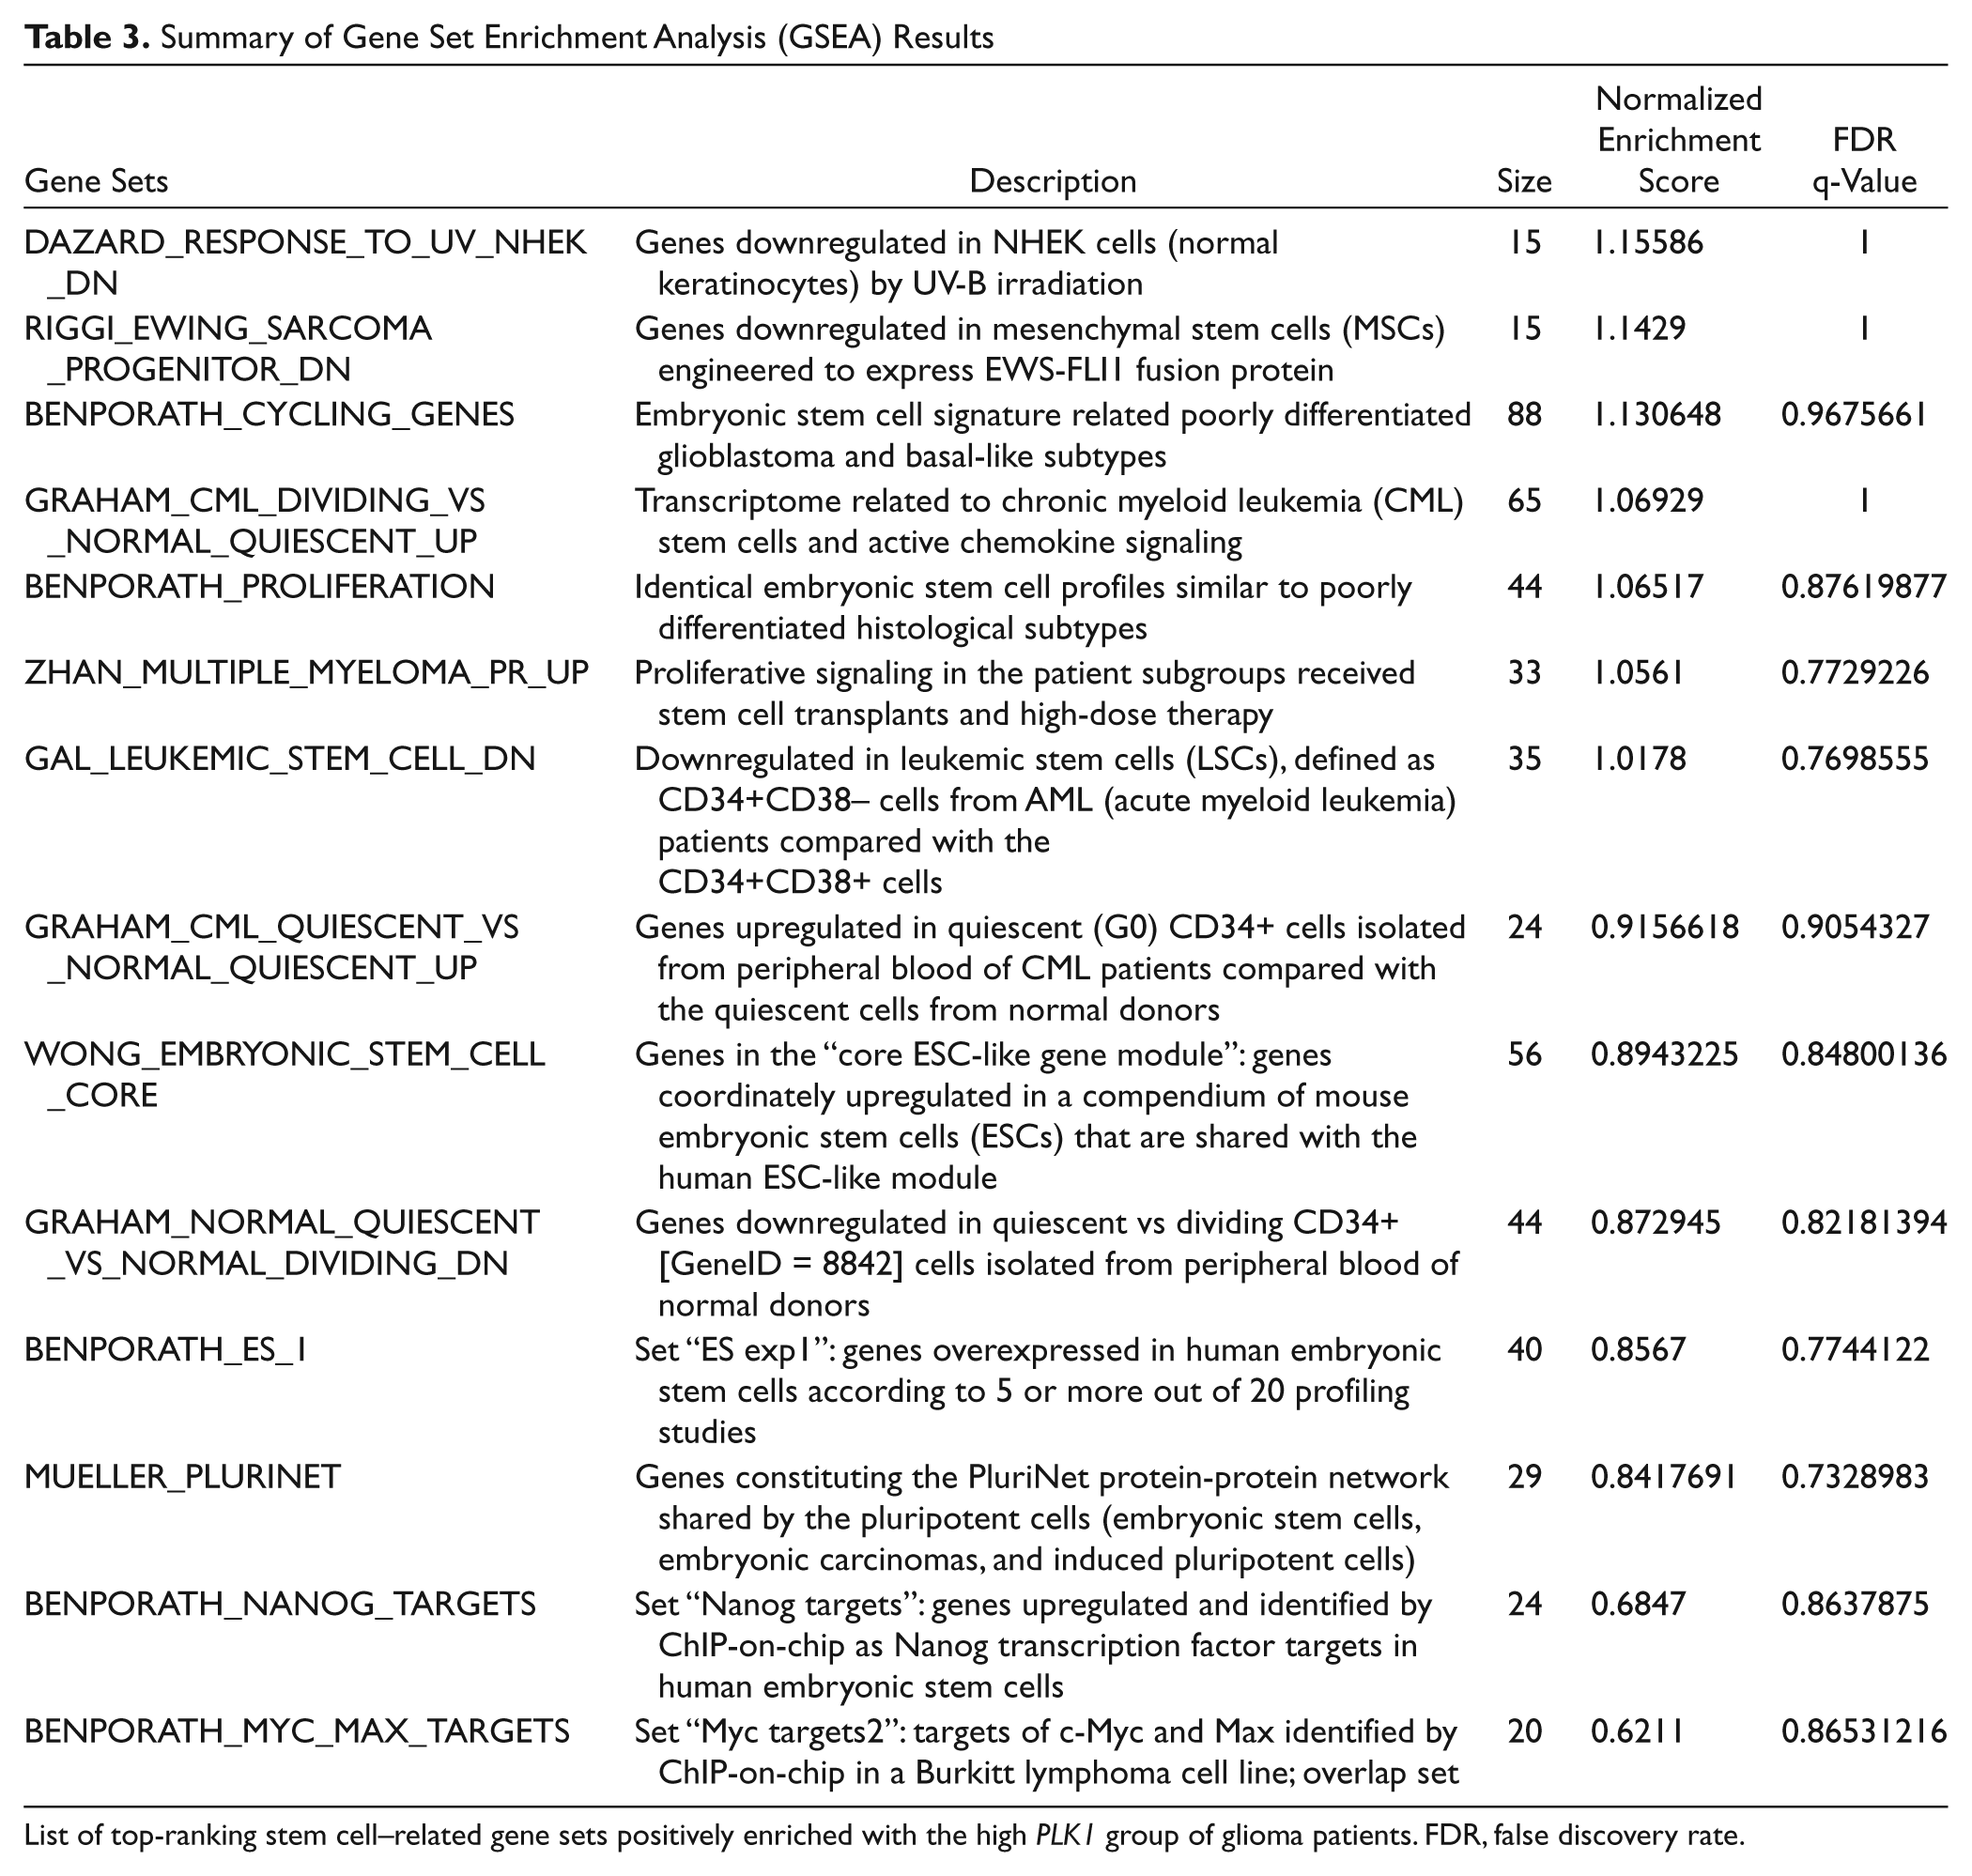
List of top-ranking stem cell–related gene sets positively enriched with the high PLK1 group of glioma patients. FDR, false discovery rate.
Discussion
One of the central tenets in cancer stem cell biology is understanding the cellular heterogeneity of tumors and consequently what impact it has on experimental designs. Traditional short-term viability assays are fast methods in high-throughput screens; however, they often do not reflect effects on bona fide self-renewing cells in a surrounding of transient-amplifying progenitors. Thus, small-molecule screens based on cancer stem cells must take into account the need to incorporate assays that measure long-term self-renewal in slow-growing cells. This is an important concept as small-molecule candidates may, through viability assay prioritization, eradicate bulk tumors without inhibiting the most essential, tumor-initiating, and sustaining fraction. Consequently, tumor recurrence is inevitable. To design better therapeutic strategies against these highly infiltrative and recurrent gliomas, the targeting of GPCs is essential. Here, we show that the well-developed neurosphere assay in neural stem cell biology provides a reliable method to assay for self-renewal 27 ; in addition, when combined with serial transplantation in mice, tumor-initiating and sustaining activity is measured. The prioritization of small-molecule candidates based on the selectivity ratio enables GPC-specific targeting to be delineated from toxicity to normal cells. We have seen that bioinformatics analyses revealed higher PLK1 expression in GBM tissue compared with normal brain, thus validating our initial screen design on selectivity ratios to prioritize compounds. While preparing this manuscript, an article was published on the novel role of Plk1 in regulating survival of GBM GPCs, thus validating our approach and conclusions. 28 In addition, a PLK1 inhibitor with an improved pharmacokinetic profile, BI6727, 29 also similarly reduced colon cancer stem cells grown in vitro as spheroid structures, as well as mitigated their in vivo tumorigenic potential. 30 Our work extends upon their findings by querying the contribution of GPCs to patient survival outcome, thus providing a direct relationship between these cells and the primary tumor phenotype and consequently validating their use as an in vitro cellular screening system tailored toward stem cell–specific parameters. Admittedly, such extended and in-depth sphere assays would not be amenable to high-throughput screening in the traditional sense (i.e., thousands of compounds), but we wish to emphasize a reevaluation of screening criteria to detect long-term self-renewing GPCs.
Cancer stem cells are controversial cells mainly because they have been shown to initiate tumors in mice at varying frequencies depending on tumor subtype and experimental conditions, indicating that the tumor-initiating capacity, a central theme in cancer stem cells, may actually be an artifactual consequence of experimental parameters.1,2 This forces a redefinition of cancer stem cells to focus on the most important criteria: long-term self-renewal and the ability to recapitulate the primary tumor pathophysiology. Still, the question remains as to whether such cells are clinically meaningful if they constitute an often small fraction of the tumor mass. Here, we have tapped into large, public glioma databases to evaluate the prognostic value of PLK1 gene expression. Although our conclusions are not entirely novel in that previous works have indeed implicated high Plk1 in GBM specimens and cell lines 31 and, moreover, PLK1 is synthetically lethal with TP53 mutation in GBM, 32 we show that genes associated with the PLK1 high patient cohort encompass several stem cell–like candidates, several of which contribute to clinical outcome in other cancers.3,4,33 What is noteworthy is that our PLK1 high expression is enriched for the proliferative and mesenchymal molecular subclasses in glioma databases comprising various tumor grades and histologies. Such findings imply that the choice of patient databases/histologies and conceivably molecular heterogeneity of primary tumors affect the assignment of PLK1 high and low groups. Furthermore, it shows that although the PLK1 gene signature has a prognostic role, its true predictive value would have to be determined using a prospectively collected patient cohort subjected to Plk1 inhibition therapy.
These data collectively highlight the value of GPCs in determining disease progression and patient outcome and that, by inference, their targeting should present a long-lasting, effective cure. The additional understanding that Plk1 targeting occurs at the level of GPCs should therefore prioritize the development of this class of compounds in glioma therapy. Our findings also suggest that PLK1 expression predicts molecular heterogeneity that cannot be accounted for by histology alone. This highlights the limitation of morphology-based approaches in patient diagnosis and consequently affecting treatment decisions. Our work further supports that patients with elevated PLK1 signaling pathway may thus be amenable to Plk1 inhibition therapies. In summary, we show the relevance of GPCs as a valuable in vitro screening platform and further validate their prognostic significance in disease progression and patient survival outcome.
Footnotes
Acknowledgements
The authors acknowledge Siew Hong Leong for spectral karyotyping analysis.
Declaration of Conflicting Interests
The authors declared no potential conflicts of interest with respect to the research, authorship, and/or publication of this article.
Funding
The authors disclosed receipt of the following financial support for the research, authorship, and/or publication of this article: This work was funded through competitive grants awarded to C. Tang from the Biomedical Research Council, A*STAR, and institutional grant funding to B. T. Ang at the Singapore Institute for Clinical Sciences, A*STAR.
References
Supplementary Material
Please find the following supplemental material available below.
For Open Access articles published under a Creative Commons License, all supplemental material carries the same license as the article it is associated with.
For non-Open Access articles published, all supplemental material carries a non-exclusive license, and permission requests for re-use of supplemental material or any part of supplemental material shall be sent directly to the copyright owner as specified in the copyright notice associated with the article.