
Abstract
Stem cells hold great potential in drug discovery and development. However, challenges remain to quantitatively measure the functions of stem cells and their differentiated products. Here, we applied fluorescent imaging, quantitative real-time PCR, and label-free dynamic mass redistribution (DMR) assays to characterize the differentiation process of the ReNcell VM human neural progenitor stem cell. Immunofluorescence imaging showed that after growth factor withdrawal, the neuroprogenitor stem cell was differentiated into dopaminergic neurons, astrocytes, and oligodendrocytes, thus creating a neuronal cell system. High-performance liquid chromatography analysis showed that the differentiated cell system released dopamine upon depolarization with KCl. In conjunction with quantitative real-time PCR, DMR assays using a G-protein-coupled receptor agonist library revealed that a subset of receptors, including dopamine D1 and D4 receptors, underwent marked alterations in both receptor expression and signaling pathway during the differentiation process. These findings suggest that DMR assays can decode the differentiation process of stem cells at the cell system level.
Keywords
Introduction
With the identification of normal and cancerous stem cells and advances in stem cell biology have come widespread interest in the regulated differentiation of stem cells into tissue-specific cells for tissue repair 1 and to produce disease-relevant cells for drug discovery. 2 Essential to comprehend the potential of stem cells for regenerative medicine and drug discovery is determining the precise types and quality of differentiated cells derived from a specific stem cell or progenitor cell.3,4 To meet this need, a variety of molecular profiling assays have been used to determine the in vitro differentiation process of stem cells. These assays measure specific cellular molecule(s) to infer the differences between a stem cell and its differentiated end product.5,6 These assays have greatly advanced our understanding of stem cell biology. However, these assays only offer an end-point snapshot of stem cell differentiation and require destruction of stem cells for measurements. Furthermore, these assays often lack specificity due to redundancy of cellular markers in different types of cells. To overcome the limitations of molecular profiling assays, phenotypic assays have been applied to monitor stem cell differentiation in recent years. These phenotypic assays mostly use electric biosensors to minimal-invasively measure impedance of cultured stem cells on electrode surfaces.7,8 However, none of these phenotypic studies has focused on characterizing stem cellular differentiation at the molecular or cellular pathway level. Innovative assays that bridge the gap between molecular and phenotypic assays would be desired for determining the precise types and quality of differentiated cells.
Here we describe a strategy to generate a global representation of stem cell differentiation at the receptome level using a label-free, whole-cell dynamic mass redistribution (DMR) assay. This strategy begins with DMR profiling of endogenous receptors at the receptome level using a library of G-protein-coupled receptor (GPCR) agonists, followed by similarity analysis to determine the differential patterns of functional receptor signaling between a stem cell and its differentiated products. Consequently, a small panel of receptor agonists can be downselected and used as functional markers to monitor the differentiation process of the stem cell. DMR assays use a label-free optical biosensor to noninvasively record a ligand-induced dynamic redistribution of cellular matter within ~150 nm of the sensor surface. 9 The DMR is a highly textured phenotypic measurement of receptor signaling at the whole cell level.10–13 GPCRs represent the largest and most successful drug target class in the human genome. 14 Tissue-specific expression and preferential signaling are common to many GPCRs.15–17 Thus, it is possible to use whole-cell functional readouts of receptors at the receptome level to determine the types and quality of differentiated products of stem cells. We demonstrate that this strategy provides a global view of the signaling pattern at the receptome level in a neuronal progenitor stem cell and its differentiated neuronal cells.
Materials and Methods
Materials
ACEA, adenosine, adenosine diphosphate (ADP), adenosine triphosphate (ATP), clonidine, dopamine, histamine, nicotinic acid, UDP, UTP, and lysophosphatidic acid (LPA) were obtained from Sigma Chemical Co. (St. Louis, MO). (–)-Epinephrine, acetylcholine, anandamide, γ-aminobutyric acid (GABA), ghrelin, prostaglandin E2 (PGE2), prostaglandin D2 (PGD2), serotonin, and sphingosine-1-phospate (S1P) were obtained from Tocris Biosciences Co. (St. Louis, MO). (Arg 8 )-vasopressin, angiotensin, α-melanocortin (α-MSH), apelin, bombesin, bradykinin, calcitonin, calcitonin gene-related peptide (CGRP), dynorphin A, endothelin-1, galanin, glucagon-like peptide (GLP), glucagon, melanin-concentrating hormone (MCH), melatonin, neurokinin A, neuromedin U, human neuropeptide B-23 (NPB-23), neuropeptide Y, neurotensin, nociceptin, SFLLR-amide, SLIGKV-amide, somatostatin, substance P, urotensin II, and vasoactive intestinal peptide (VIP) were obtained from Bachem Americas, Inc. (Torrance, CA).
Epic 384-well biosensor microplates were obtained from Corning, Inc. (Corning, NY). Laminin-coated microplates were carried out by incubating the plates with 20 µL freshly prepared solution containing 20 µg/mL laminin (Sigma) for 2 h at room temperature, followed by aspirating the solution and washing twice. The freshly prepared laminin plates were used directly for cell culture.
The GPCR agonist library was prepared by dissolving small organic molecules and peptides in DMSO into 10 mM storage concentration, except for nucleotides including ATP, ADP, UDP, and UTP, which were dissolved in water, and lipid ligands including LPA, S1P, anandamide, PGE2, and PGD2, which were dissolved in 0.1% bovine serum albumin (BSA) solution. Both mother and daughter plates were sealed and stored at −80 °C. Compound source plates were prepared freshly by diluting compounds in a daughter plate into 4× 10-µM solutions using 1× Hank’s balanced salt solution containing 10 mM HEPES-KOH, pH 7.1 (HBSS).
Neural Progenitor Cell Culture and Differentiation
ReNcell VM (ReN), an immortalized human neural progenitor cell line derived from the ventral mesencephalon from 10-week fetal neural tissue, 18 was obtained from Millipore (Temecula, CA). The ReN cells were passaged using the protocol recommended by the supplier. Briefly, the cells were routinely expanded on laminin-coated T75 tissue culture flasks (Corning) in ReNcell NSC maintenance medium (Millipore) containing 20 ng/mL fibroblast growth factor–2 (FGF-2) and 20 ng/mL epidermal growth factor (EGF) (Millipore). The ReN cells in culture were maintained at 37 °C in a humidified atmosphere of 95% air/5% CO2 with a daily medium exchange. The cells were passaged once a week using Accutase (Millipore).
Differentiation of the cells was achieved by plating the cells at about 60% confluency on a freshly laminin-coated flask and growing overnight in the presence of growth factors, followed by withdrawal of growth factors. Afterward, the media were replaced on alternate days up to 10 days during the differentiation culture.
Immunocytochemistry
For staining, both undifferentiated and differentiated ReNcell VM cells were fixed for 15 min in 4% paraformaldehyde/phosphate buffered saline (PBS) and washed twice with PBS. The cells were then permeabilized and blocked with 5% normal goat serum (NGS) (Vector Laboratories, Burlingame, CA), 0.3% Triton X-100 in PBS for 2 h at room temperature. The cells were stained using a mouse monoclonal anti-β-III tubulin antibody (MAB1637; Millipore) at 1:1000, a rabbit monoclonal anti–tyrosine hydroxylase (TH) antibody at 1:250 (AB152; Millipore), a mouse monoclonal antinestin at 1:500 (clone 10C2; Millipore), a rabbit polyclonal anti–glial fibrillary acidic protein (GFAP) at 1:500 (AB5804; Millipore), or a mouse monoclonal anti-O1 antibody at 1:500 (catalog #2003601; Millipore). After overnight incubation at 4 °C, the cells were then washed twice with PBS and processed with filtered Cy3 dye–conjugated goat antimouse secondary antibody (1:250; Molecular Probes, Eugene, OR) or FITC dye–conjugated goat antirabbit antibody (1:250; Molecular Probes) dissolved in 1% NGS in PBS for 1.5 h at room temperature. The cells were then washed twice with PBS and counterstained with 10 mM Hoechst 33342 (Sigma) for 4 min, followed by an additional PBS wash. For staining the surface marker O1 of oligodendrocytes, nonpermeabilized cells were also used to stain with the anti-O1 antibody at 1:500, followed by a nonpermeable blocking solution containing NGS in PBS. A Zeiss Axioplan fluorescence microscope (Carl Zeiss, Oberkochen, Germany) was used to collect all fluorescence and light images.
Quantitative Real-Time PCR
Total RNA was extracted from both undifferentiated and differentiated ReN cells using an RNeasy mini kit (cat. 74104; Qiagen, Valencia, CA). To eliminate genomic DNA contamination, on-column DNase digestion was performed using the RNase-free DNase set (cat. 79254; Qiagen). The concentration and quality of total RNA were determined using a Nanodrop 8000 (Thermo Scientific, Waltham, MA). Customized PCR array plates for 352 GPCR genes and reagents were ordered from SA Biosciences (a Qiagen company, Valencia, CA). About 1 µg total RNA was used for each 96-well PCR array. The PCR array was performed on an ABI 7300 Real-Time PCR System (Applied Biosystems, Foster City, CA) following the manufacturer’s instructions.
Dopamine Release Assays with High-Performance Liquid Chromatography
The differentiated ReN cells were treated with potassium chloride at various concentrations for 20 min in the growth factors–free maintenance media at room temperature. After KCl treatment, the media were collected and the dopamine concentration was assessed using a high-performance liquid chromatography (HPLC)/electrochemical detection (ECD) method. 19 The flow rate was 1 mL/min between 1 and 32 min with a gradient flow of methanol and phosphate buffer (20 mM sodium phosphate and 1.5 mg 1-pentanesulfonic acid, pH 3.0). The gradient started at 95/05 buffer/methanol and progressed to 5/95 buffer/methanol over 45 min. The column temperature was maintained at 35 °C. The electrochemical detector was Water’s 2645 ECD (Waters Corp., Milford, MA). The injection volume was 10 µL. Flow cell consisted of a 2-mm glassy carbon working electrode and an ISAAC (in situ Ag/AgCl) reference electrode (Wa60201; Waters Corp.). A freshly prepared dopamine solution was used as a positive control to validate the protocol.
Dynamic Mass Redistribution Assays
The ReN cells were seeded in a freshly prepared laminin-coated biosensor microplate at 3000 cells per well at passages 2 to 10 suspended in 50 µL of growth factors containing medium and were cultured at 37 °C under 5% CO2 for 2 days to reach ~90% confluency. The undifferentiated cells were then washed twice with 1× HBSS and maintained in 30 µL HBSS for 1 h before commencing DMR assays. For differentiated cells, the undifferentiated cells at 80% confluency were subject to differentiation by replacing the growth factors containing medium with the growth factors–free maintenance medium for another 7 days. The differentiated cells obtained were then washed twice with 1× HBSS and maintained in 30 µL HBSS for 1 h before commencing DMR assays. To obtain DMR responses, an Epic wavelength interrogation system (Corning) was used for whole-cell sensing. This system consists of a temperature control unit (28 °C), an optical detection unit, and an on-board liquid-handling unit with robotics. The detection unit is based on integrated fiber-optics and enables kinetic measures of cellular responses with a time interval of ~15 s. Solutions of small molecules were made by diluting the stored concentrated solutions with HBSS and transferring into a 384-well polypropylene compound storage plate to prepare a compound source plate. Both cell plates and compound source plates were incubated within the biosensor reader system to reach thermal equilibrium (~1 h). After a 2-min baseline was recorded, compounds were transferred using the on-board liquid handler, and cellular responses induced by the compounds were then monitored in real time. At least two independent sets of experiments, each with at least duplicates, were performed. The assay coefficient of variation was found to be mostly <10%. All DMR signals were background corrected.
Results
Immunofluorescence Imaging of Differentiated ReN Cells
The ReNcell VM neural progenitor cell line has been shown to be capable of differentiating into astrocytic glial cells and neurons, about 10% of which have a dopaminergic phenotype after withdrawal of growth factors from the growth media. 18 Light microscopic imaging showed that undifferentiated cells had a flat neuroepithelial morphology ( Fig. 1a ). Two days after withdrawal of growth factors, the cells started to differentiate ( Fig. 1b ). At days 5 and 7 of differentiation, most of the cells exhibited an elongated neural morphology ( Fig. 1c , d ). Immunostaining showed that 100% of the undifferentiated cells stained positively for the neural stem cell marker nestin ( Fig. 1e ); conversely, the differentiated cells had much weaker stain for nestin ( Fig. 1f ). There were few or no spontaneously differentiated cells within the control cells that were positive for GFAP (astrocytic) or β-III tubulin (neuronal) ( Fig. 1g ) or O1 (oligodendrocyte) (not shown). The differentiated cells gave rise to strong immunocytochemical staining for β-III tubulin ( Fig. 1h , i ). A relatively small percentage of the differentiated cells were also positive for GFAP ( Fig. 1h ), the catecholaminergic neuron marker TH ( Fig. 1j , k ), and the oligodendrocyte surface marker O1 ( Fig. 1l ). Together, these results suggest that the differentiated cells consist of mostly neurons and also contain other central nervous system cells, including astrocytes, dopaminergic neurons, and oligodendrocytes.
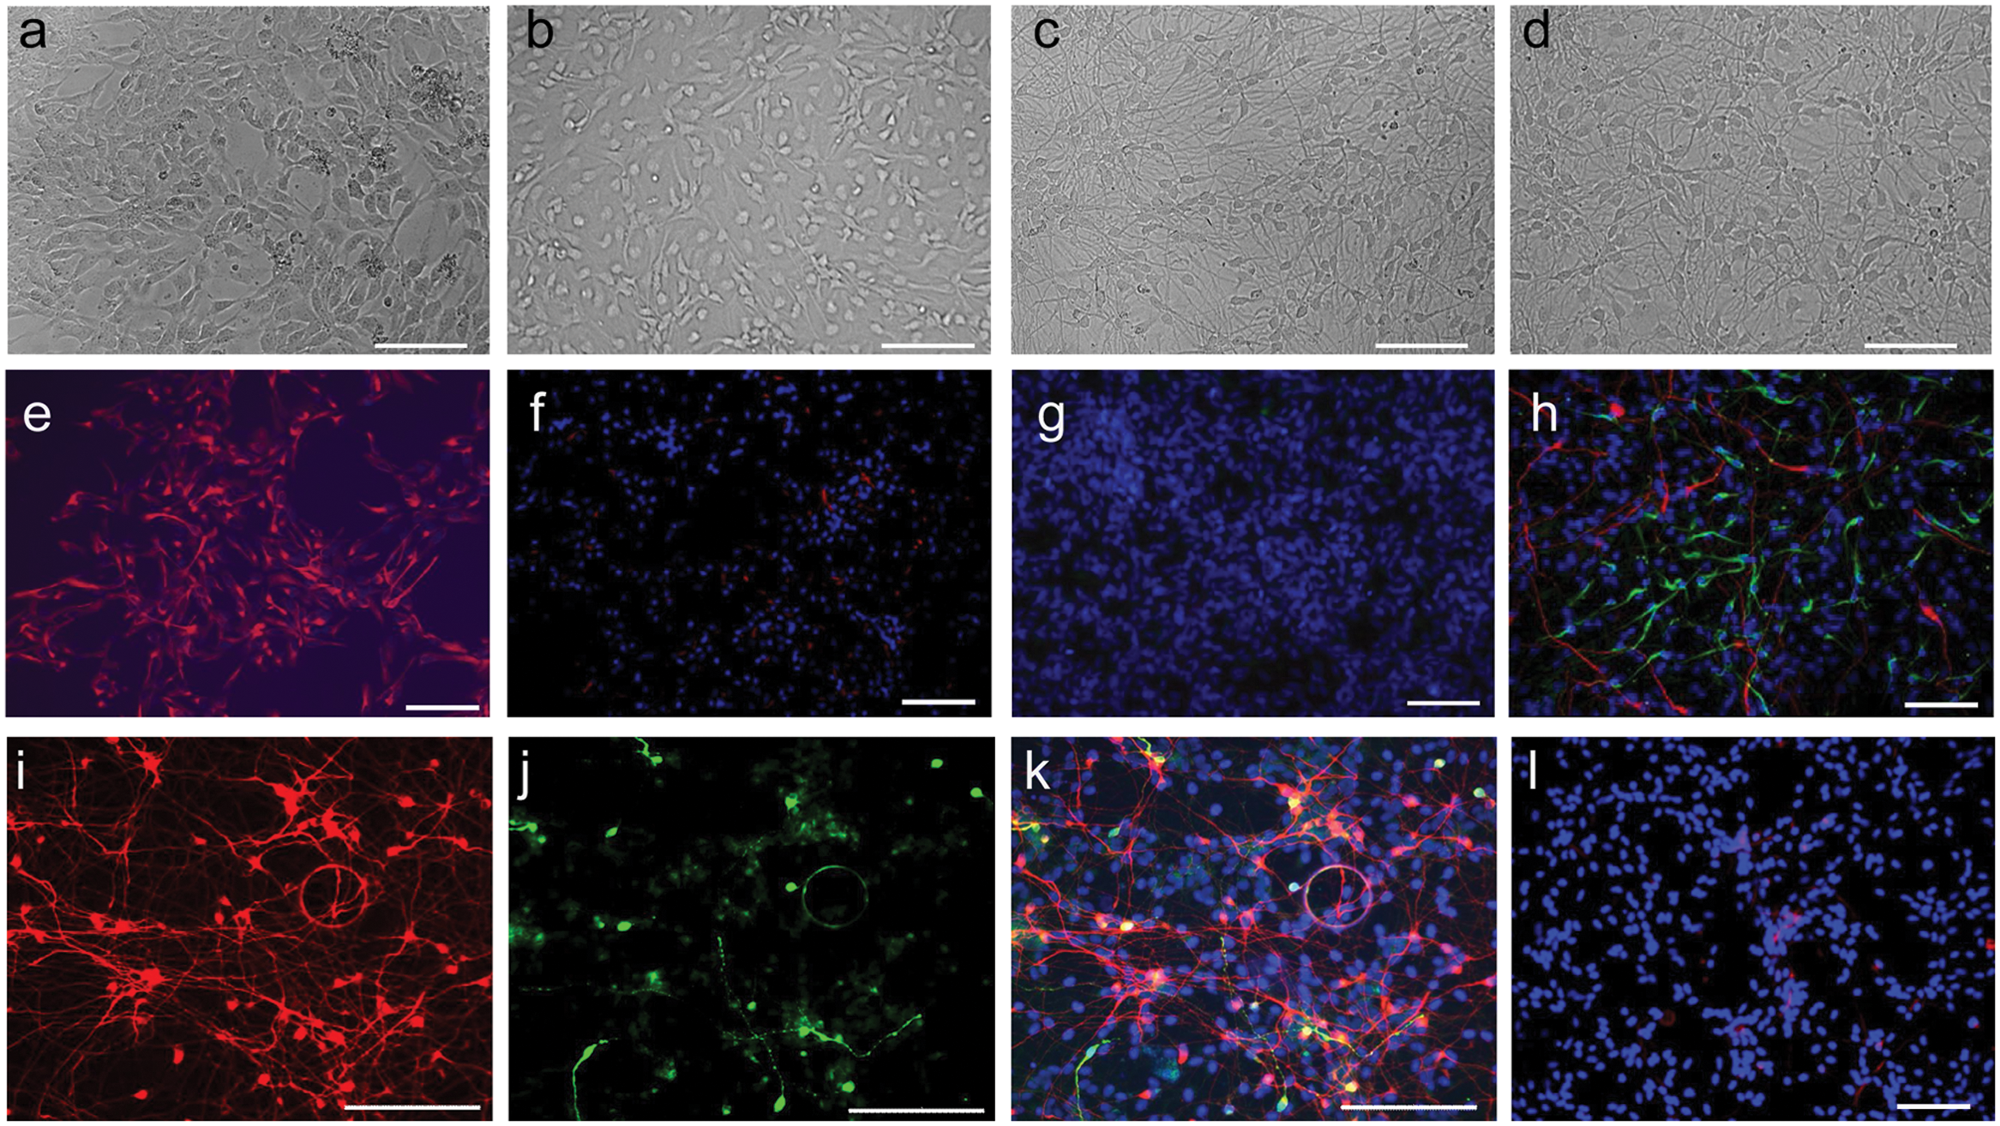
Characteristics of neuronal cell systems derived from the differentiation of the ReNcell VM human progenitor cell line. (
Dopamine Release from the Differentiated ReN Cells
On the basis of the immunostaining results, we focused on the functional characterization of differentiated ReN cells obtained using the 7-day differentiation culture protocol. We estimated that about 13% of differentiated cells are TH+ ( Fig. 1j ). The positive staining of these cells with both anti-TH and anti-β-III tubulin ( Fig. 1k ) suggests that these cells may represent functional dopaminergic neurons. Thus, we first examined the release of the neurotransmitter dopamine from the differentiated cells upon depolarization by potassium chloride (KCl).19,20 To do so, the cells were differentiated for 7 days in the growth factors–free media. After a 20-min treatment with KCl at different doses, the supernatants were then collected and subjected to analysis using the HPLC/ECD method. Using solutions of dopamine at known concentrations as controls, we found that the HPLC/ECD method gave rise to a detection limit about 400 pM, similar to previous reports. 19 The differentiated cells exhibited a clear KCl dose-dependent release of dopamine, and dopamine was detected in the supernatants of these differentiated cells after being treated with 60 and 80 mM KCl ( Fig. 2 ), suggesting that the differentiated cells contain functional dopaminergic neurons.
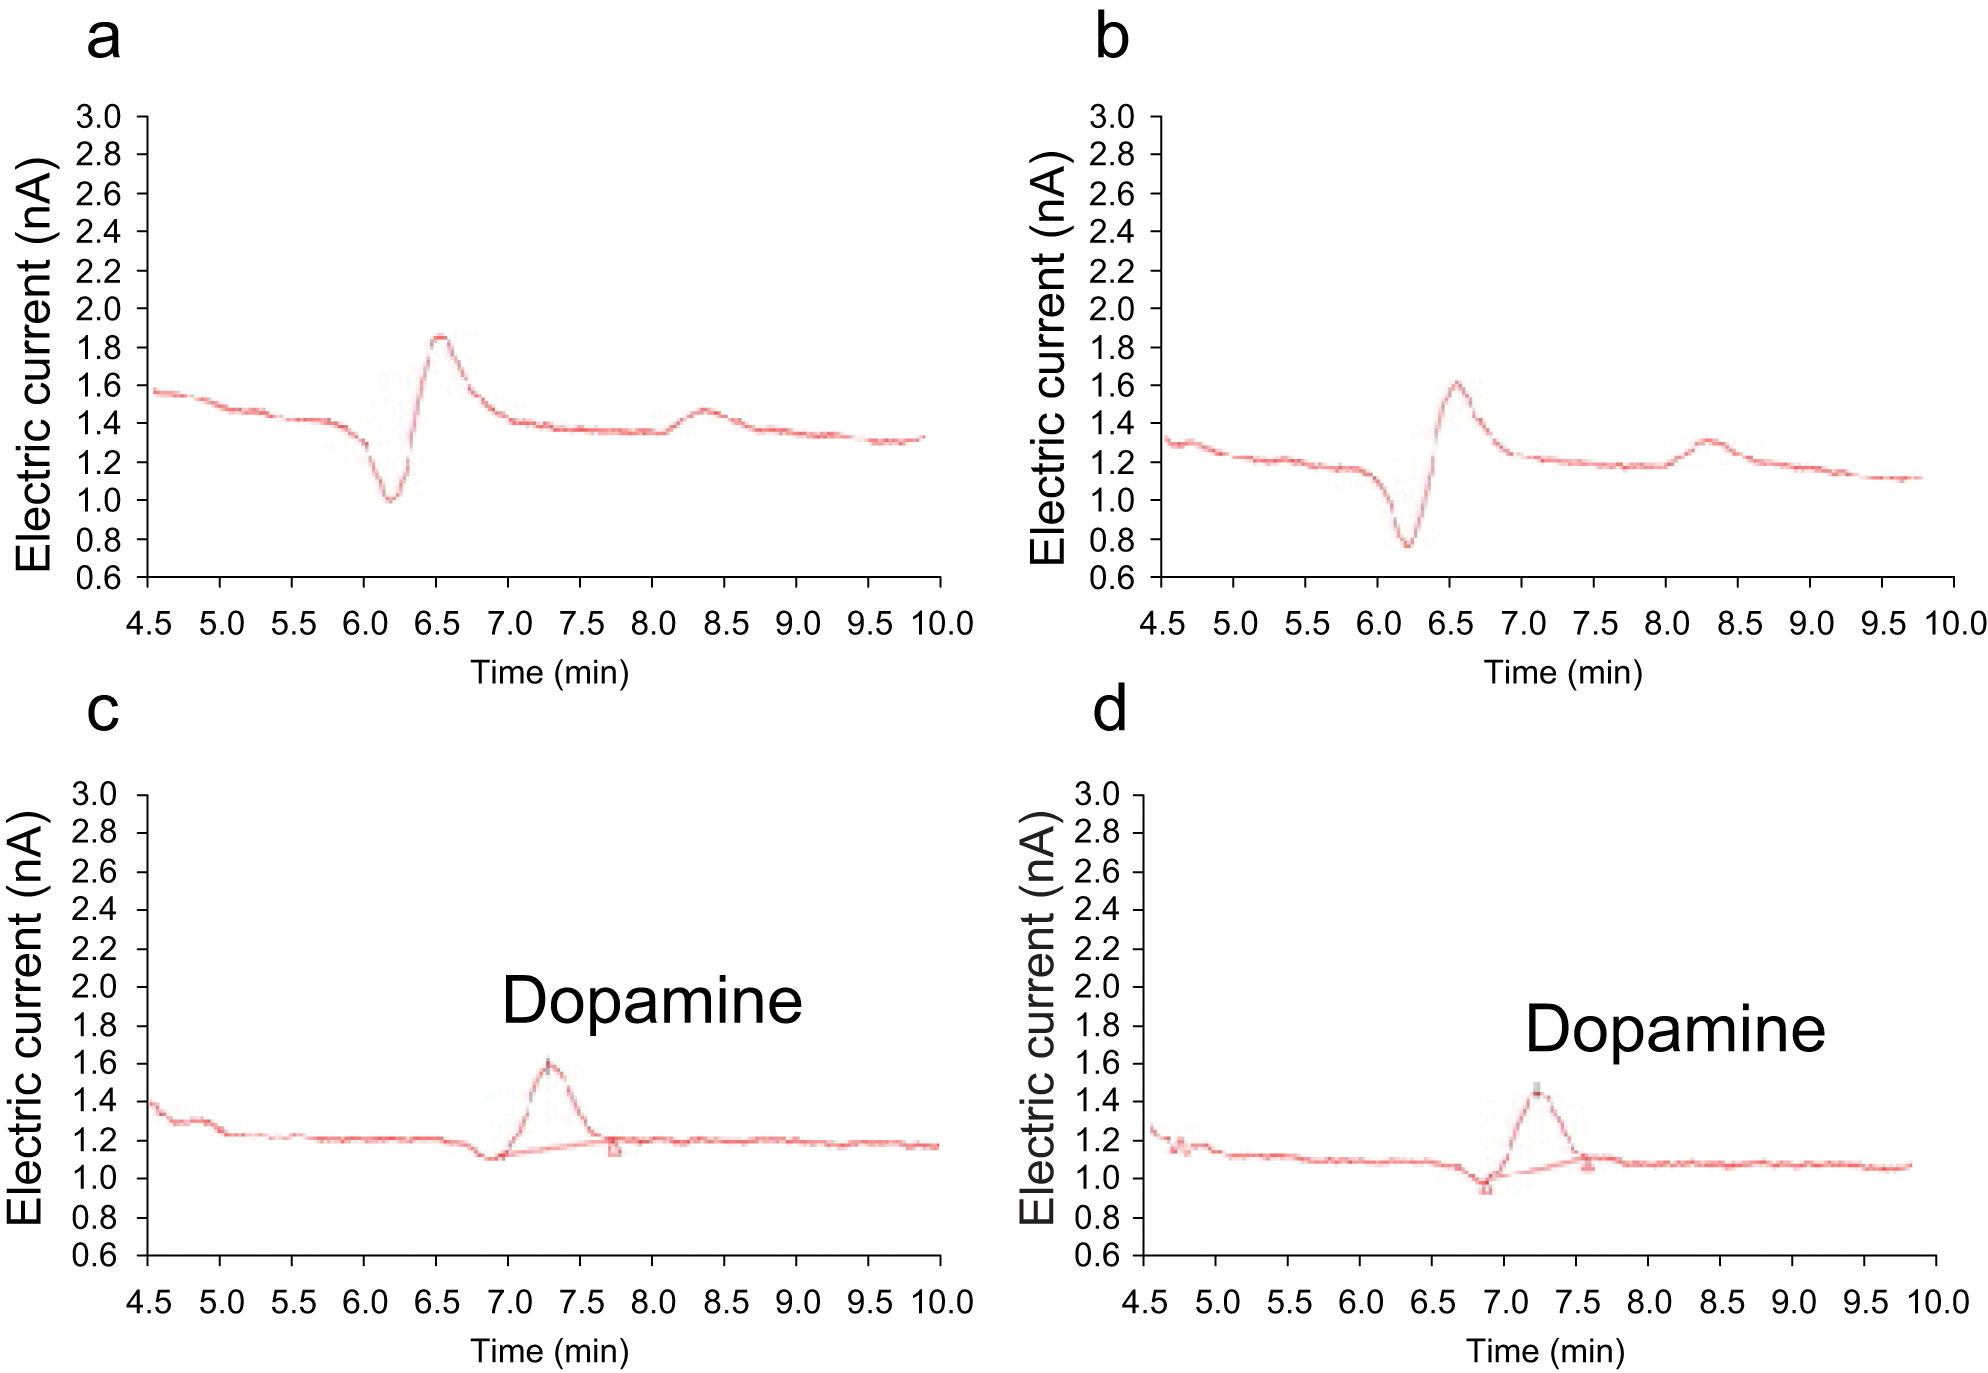
Dopamine release from the differentiated neural progenitor cells upon challenge with KCl at different doses: 0 mM (
Expression Analysis of GPCRs at the Receptome Level
We next performed quantitative real-time PCR (RT-PCR) analysis of GPCRs at the receptome level using a customized RT-PCR plate containing 352 GPCRs and related genes from SA Biosciences. The undifferentiated ReN cells were compared with the differentiated ReN cells obtained from the 7-day differentiation culture. We first examined the expression of three control genes—glyceraldehyde-3-phosphate dehydrogenase (GAPDH), β-actin (ACTB), and hypoxanthine phosphoribosyltransferase 1 (HPRT1)—at the mRNA level. Results showed that for the undifferentiated cells, the cycle threshold Ct values were 17.5 ± 0.4, 18.8 ± 0.5, and 24.0 ± 0.2 (n = 4) for GAPDH, ACTB, and HPRT1, respectively. A similar expression pattern was observed for the differentiated cells, which gave rise to Ct values of 18.3 ± 0.1, 17.5 ± 0.2, and 25.6 ± 0.3 (n = 4) for GAPDH, ACTB, and HPRT1, respectively.
We next examined the expression of 352 GPCRs at the mRNA level. Results showed that there were 104 GPCR genes whose Ct values were <30 for both undifferentiated and differentiated cells ( Table 1 ). Furthermore, there was a set of 13 GPCR genes, including ADRA2B, LPAR3, NTSR1, and P2RY12, with a Ct value of <30 in the undifferentiated cells but >30 in the differentiated cells. Conversely, a distinct set of 13 GPCR genes, including GRM7, DRD1, and GPR141, was specific to the differentiated cells. Therefore, 117 GPCR genes in total are expressed at a high or moderately high level in both undifferentiated and differentiated ReN cells. Of the 117 GPCR genes, only mRNAs for GPR141 were not detectable in the undifferentiated cells but at a moderately high level in the differentiated cells.
mRNA Expression of Endogenous G-Protein-Coupled Receptors in Undifferentiated (ReN) and Differentiated (dReN) ReNcell VM Neural Progenitor Cells
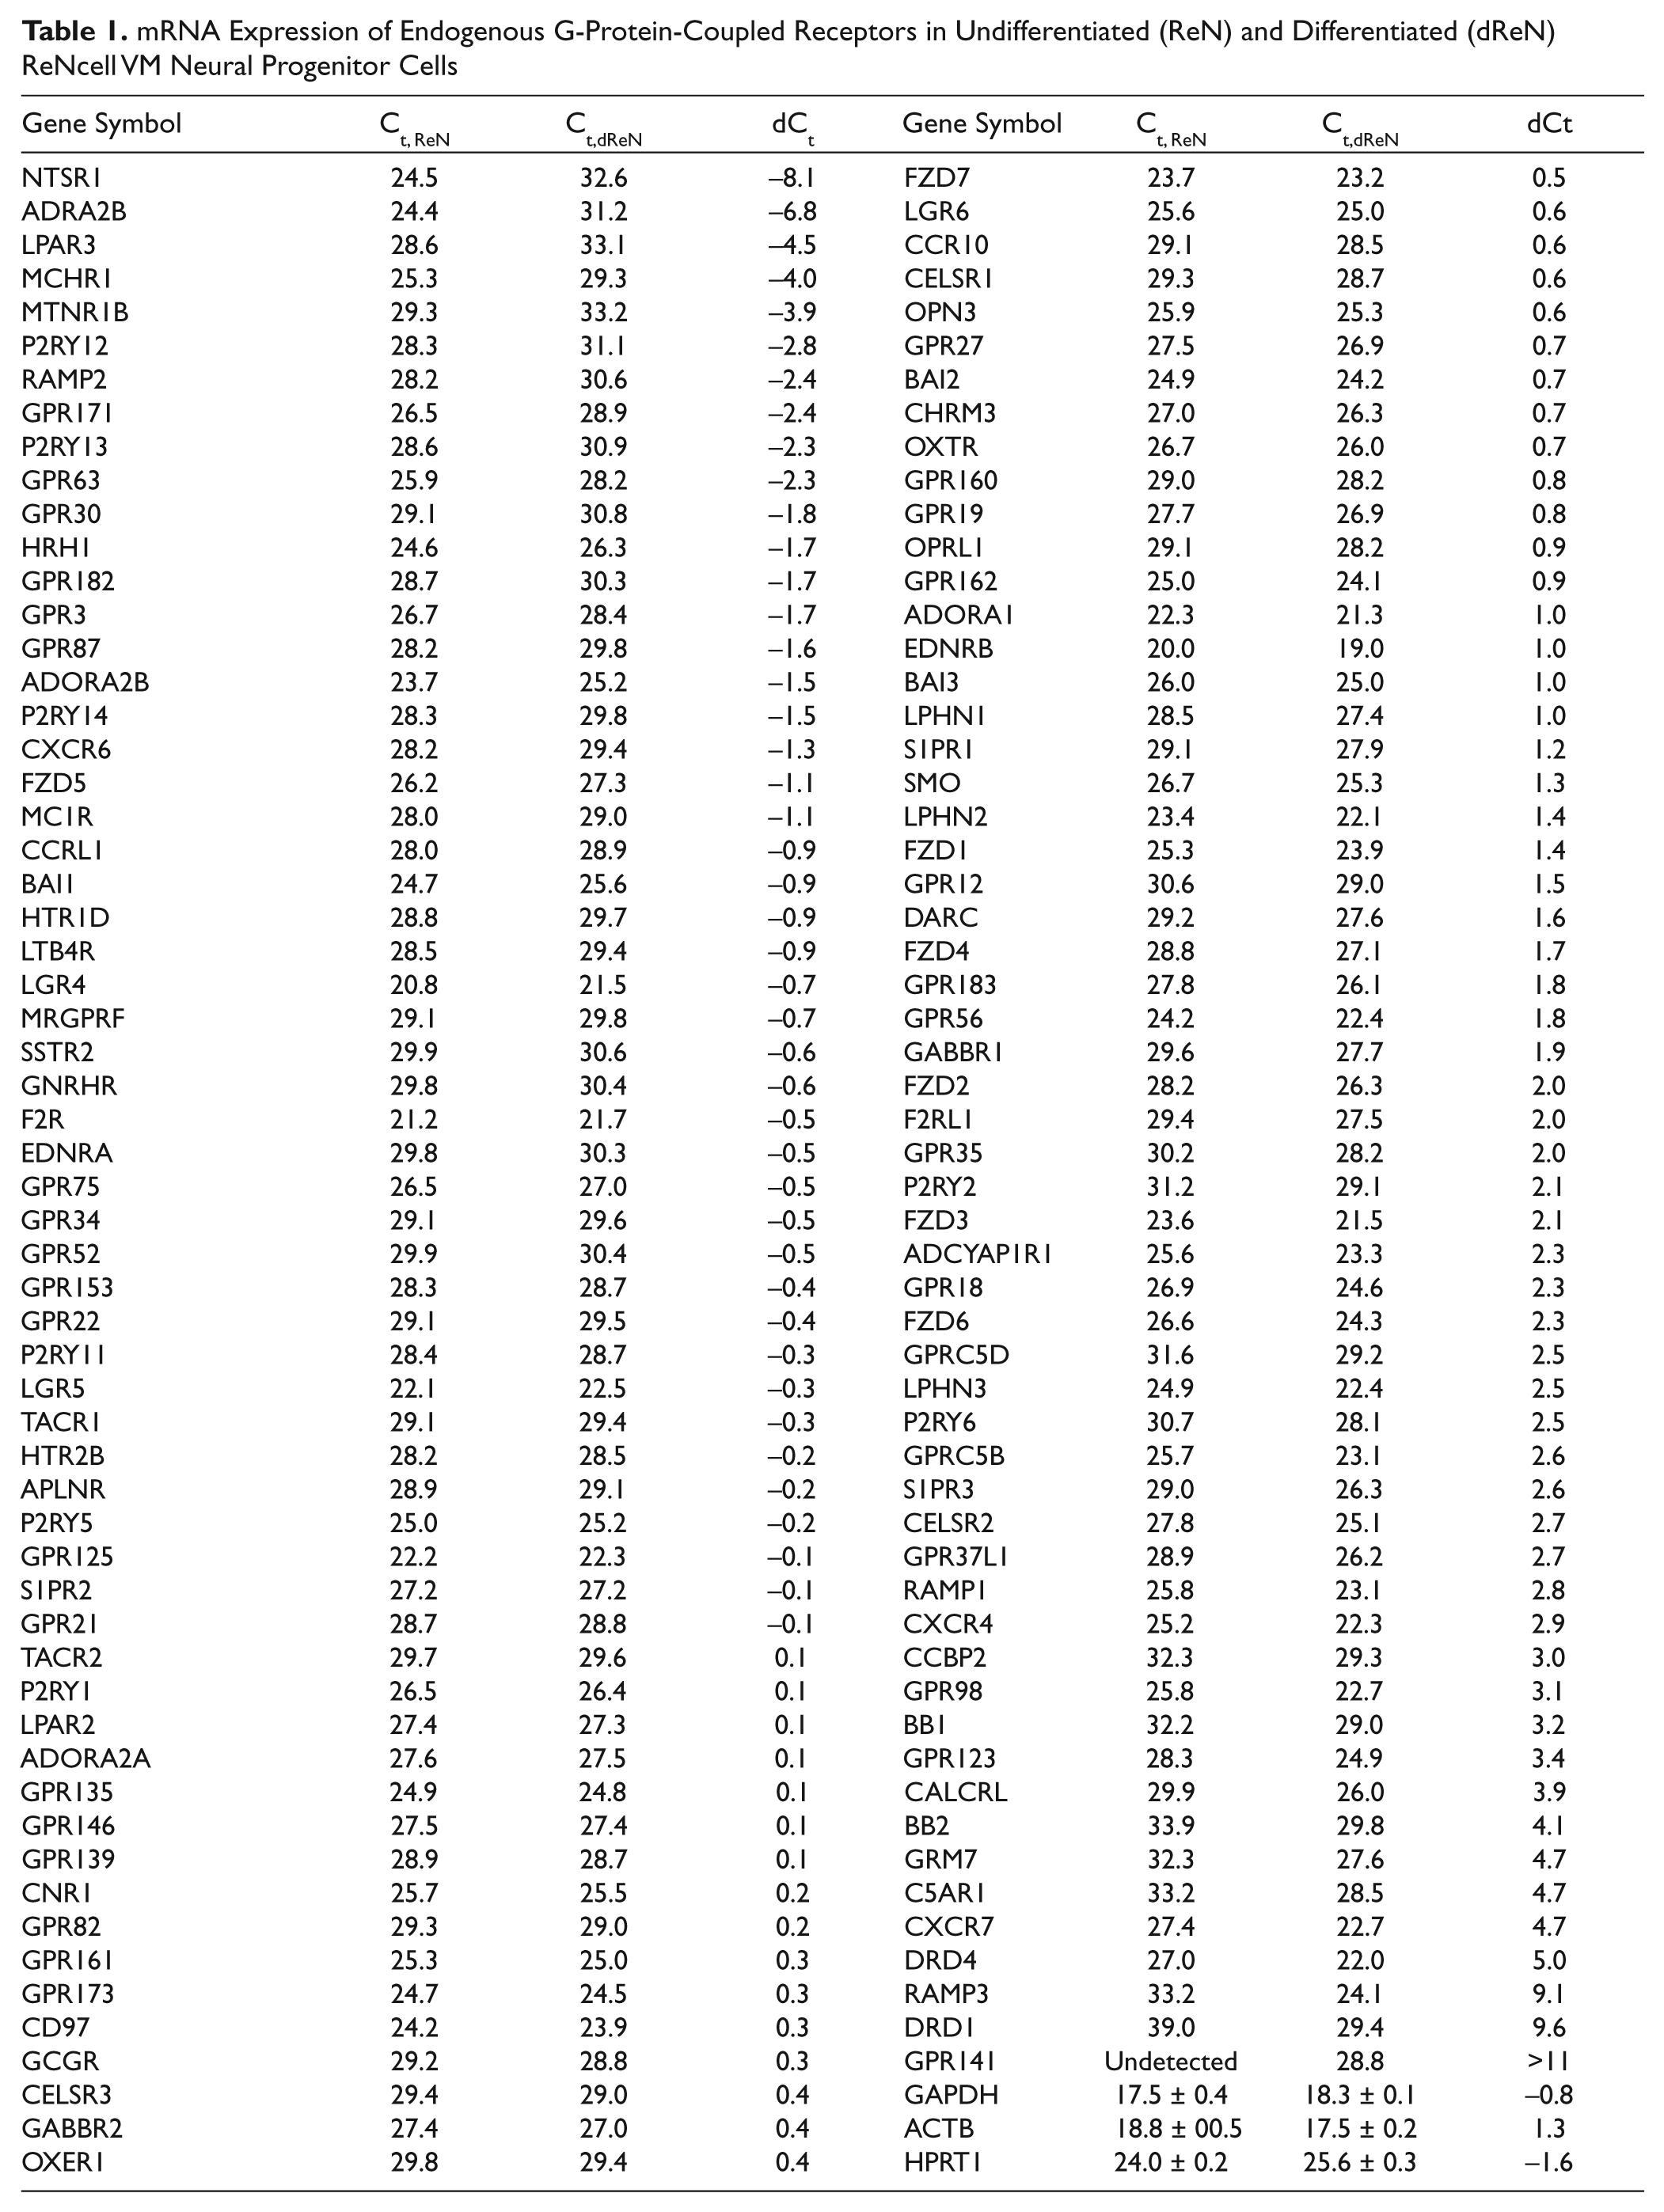
Considering the comparable expression pattern of the three control genes in both undifferentiated and differentiated cells, we used the net difference in Ct value between the two cells for each GPCR gene to determine the changes of all 352 GPCR genes induced by differentiation. Comparative analysis showed that a subset of genes had undergone significant alterations in expression level during differentiation ( Fig. 3a ). Upon differentiation, noticeable upregulated genes were DRD1, DRD4, CRM7, C5AR1, BB1, BB2, CALCRL, RAMP1, RAMP3, CXCR4, P2RY6, GPR98, CCBP2, CXCR7, and GPR123; noticeable downregulated genes were ADRA2B, MTNR1B, MCHR1, NTSR1, and LPAR3. These results suggest that the ReN cell expresses quite a large set of GPCRs at the mRNA level, and a subset of GPCR genes undergoes significant up- and downregulation during the differentiation process.
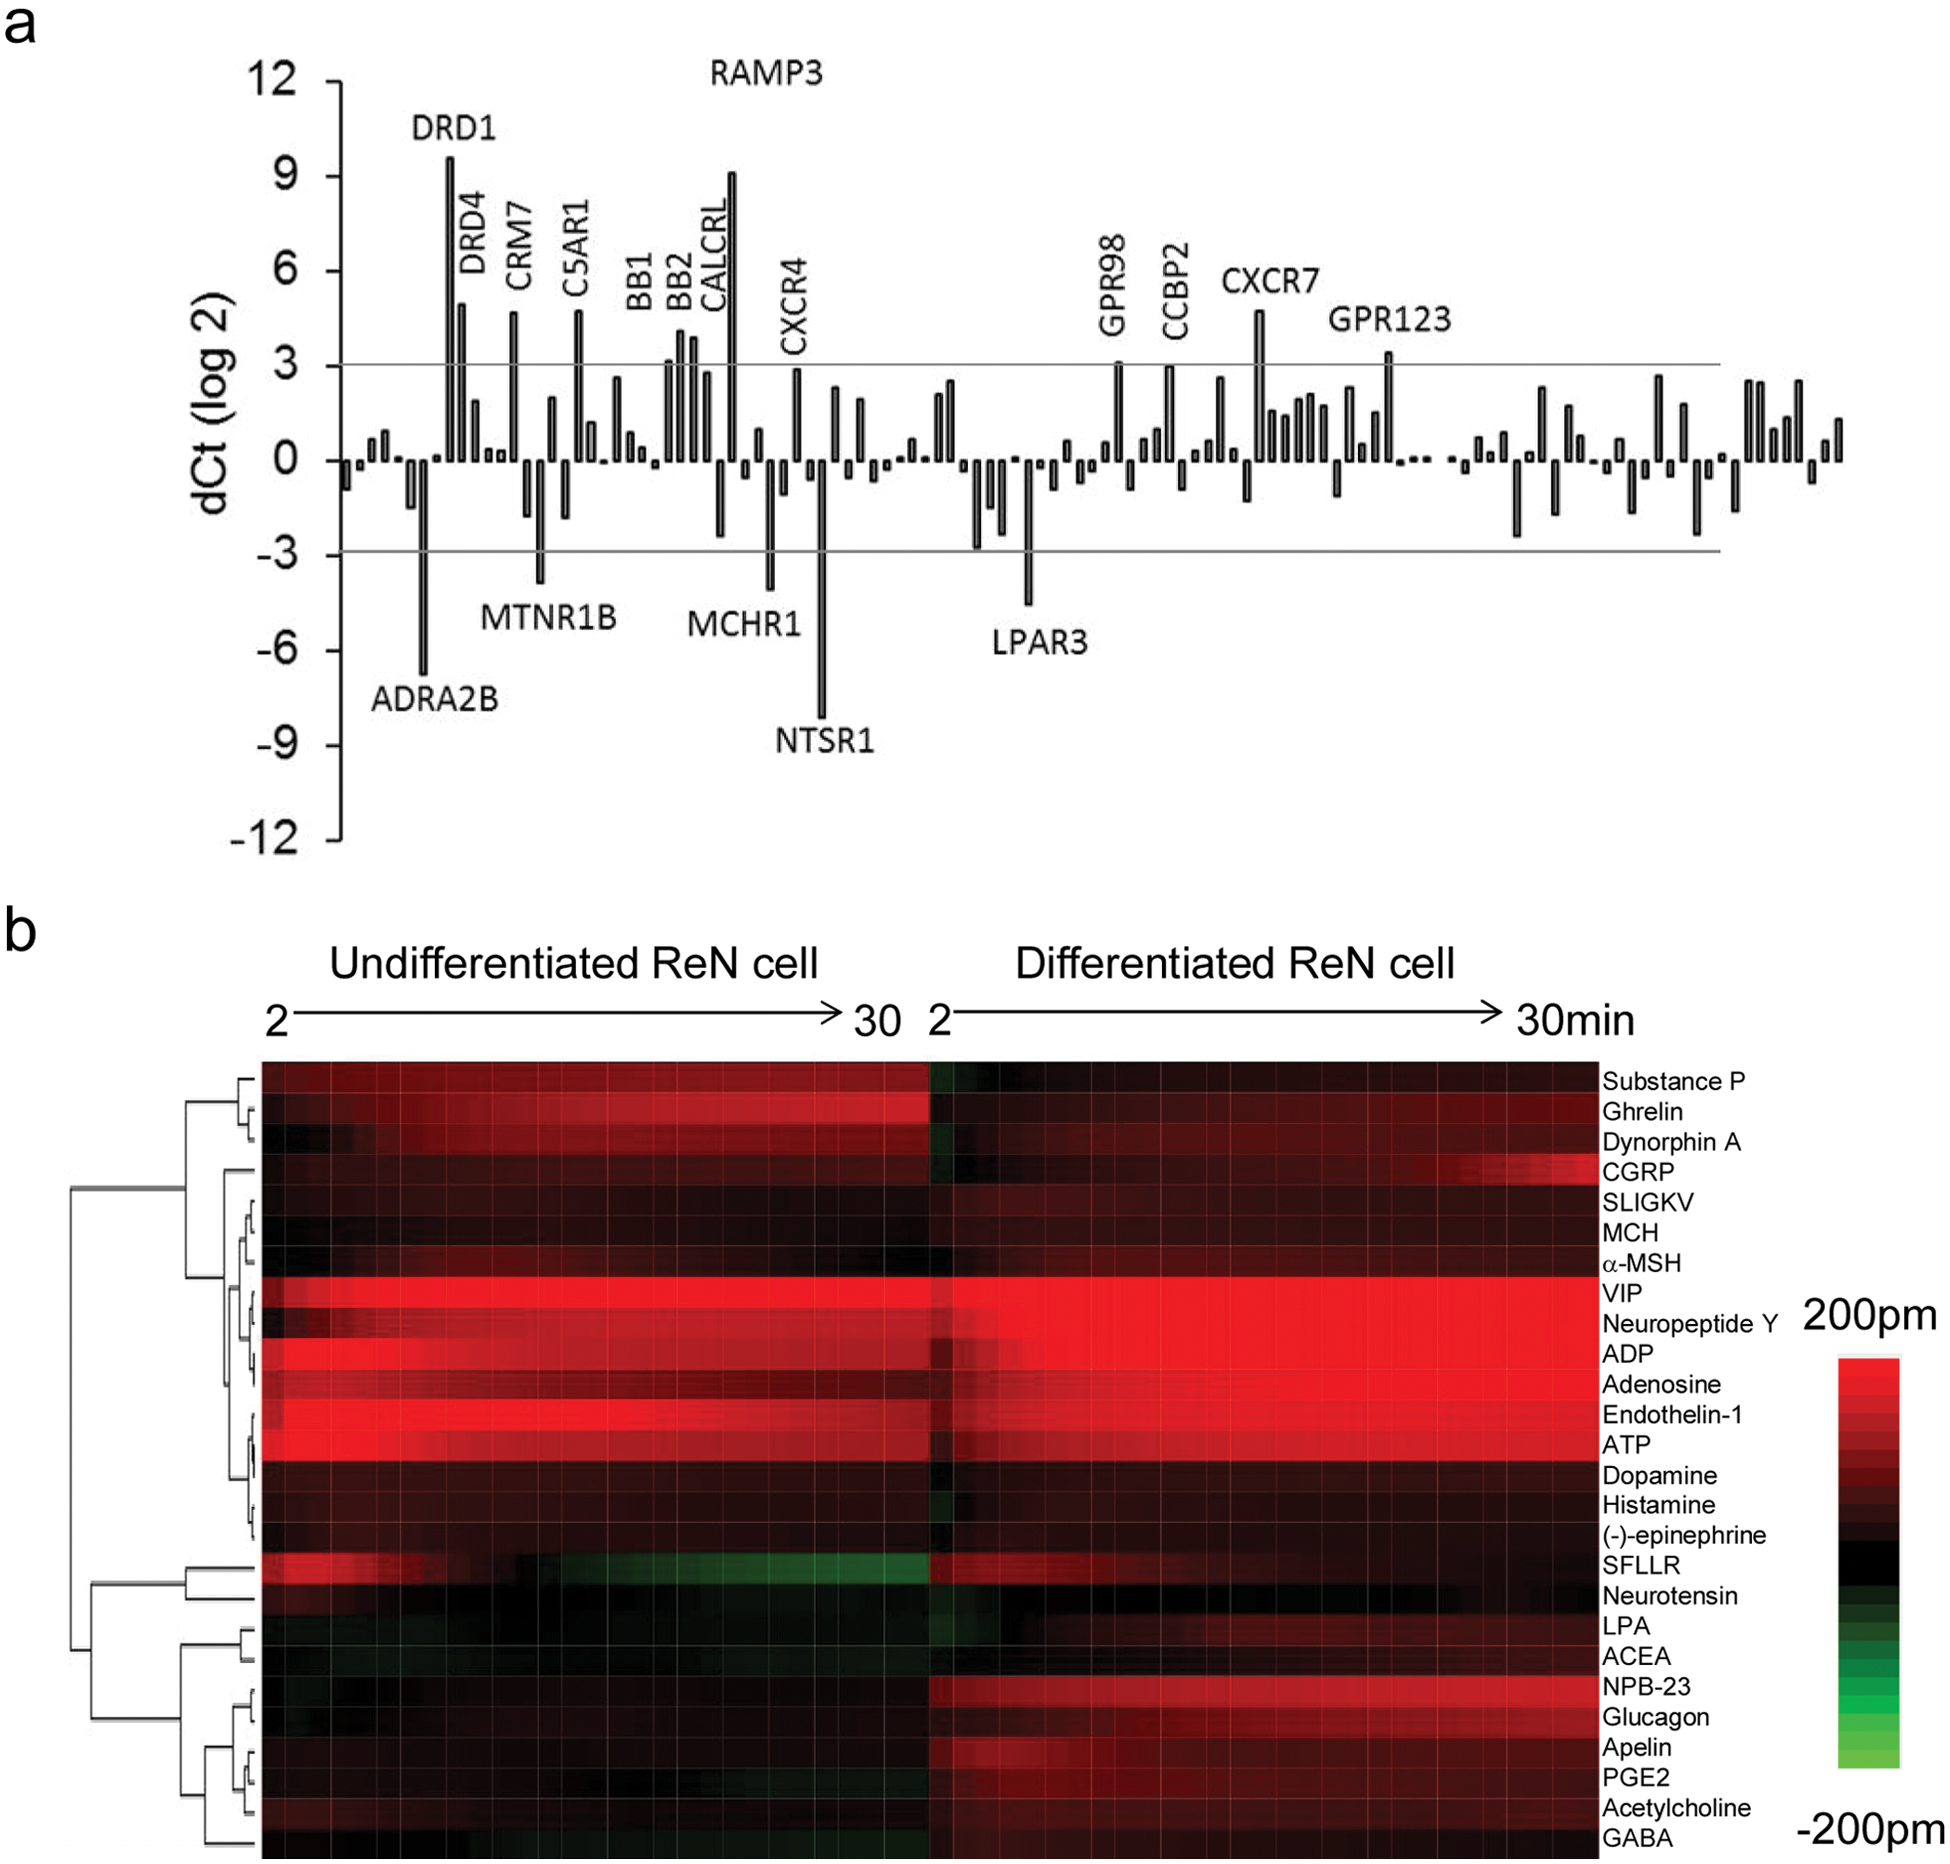
Receptor expression and dynamic mass redistribution (DMR) patterns. (
DMR Profiling of Endogenous GPCRs
Since the DMR assay offers a pathway-unbiased yet pathway-sensitive measurement of receptor signaling at the whole cell level and has high sensitivity,10,21 we profiled endogenous GPCRs using the DMR agonist assay in conjunction with a library of GPCR agonists. The DMR agonist assay directly measures the DMR signal arising from a GPCR agonist in real time without any manipulation of cells. The GPCR agonist library used was prepared in house and consists of 47 GPCR agonists that can theoretically activate over 110 known GPCRs (Supplementary Materials). All agonists were profiled at 10 µM. To visualize the patterns of DMR signals arising from GPCR agonists under different conditions, we used our recently developed similarity analysis approach.22–24 This approach converts a ligand-induced DMR into a multidimensional coordinate such that all ligands tested can be compared using similarity analysis. Similarity analysis is a powerful means to determine the relationships (i.e., similarity or distances) among different biological responses, particularly for large sets of biological data. 25
DMR profiling of undifferentiated ReN cells using the GPCR agonist library showed that of the 47 agonists, 17 triggered detectable DMR signals whose amplitudes were greater than 45 pm, three times the standard deviation of the negative control (i.e., the DMR of the assay buffer only). These agonists include acetylcholine, adenosine, ADP, ATP, CGRP, dopamine, dynorphin A, endothelin-1, epinephrine, ghrelin, histamine, α-MSH, neuropeptide Y, neurotensin, substance P, SFLLR, and VIP. On the other hand, DMR profiling of differentiated cells showed that of the 47 agonists, 22 resulted in detectable DMR whose amplitudes were greater than 45 pm. These agonists include ACEA, acetylcholine, adenosine, ADP, ATP, apelin, CGRP, dopamine, dynorphin A, endothelin-1, GABA, glucagon, ghrelin, LPA, α-MSH, MCH, neuropeptide Y, NPB-23, PGE2, SLIGKV, SFLLR, and VIP. Similarity analysis showed that the DMR signatures arising from the same set of GPCR agonists were markedly distinct between the undifferentiated and differentiated cells ( Fig. 3b ).
Close examination of GPCR expression and DMR signals revealed the following interesting findings. First, for a group of GPCRs whose mRNA levels had barely changed during differentiation, we observed quite distinct DMR profiles from their cognate agonists. Specific examples include acetylcholine, adenosine, glucagon, and endothelin-1 ( Fig. 4 ). RT-PCR showed that for the muscarinic receptor family, both undifferentiated and differentiated cells expressed mRNAs only for CHRM3 with a comparable Ct value (27.0 vs. 26.3), whereas both cells expressed dominantly the mNRAs at the highest level for ADORA1 among the adenosine receptor family. Comparable expression level in both cells was found for glucagon receptor GCGR and endothelin receptor EDNRB. Considering that a ligand-induced DMR is a systems cell biology and pharmacology readout of receptor signaling,9–13 the difference in DMR characteristics for these agonists suggests that the differentiation of ReN cells results in alteration in preferential signaling of certain endogenous GPCRs.
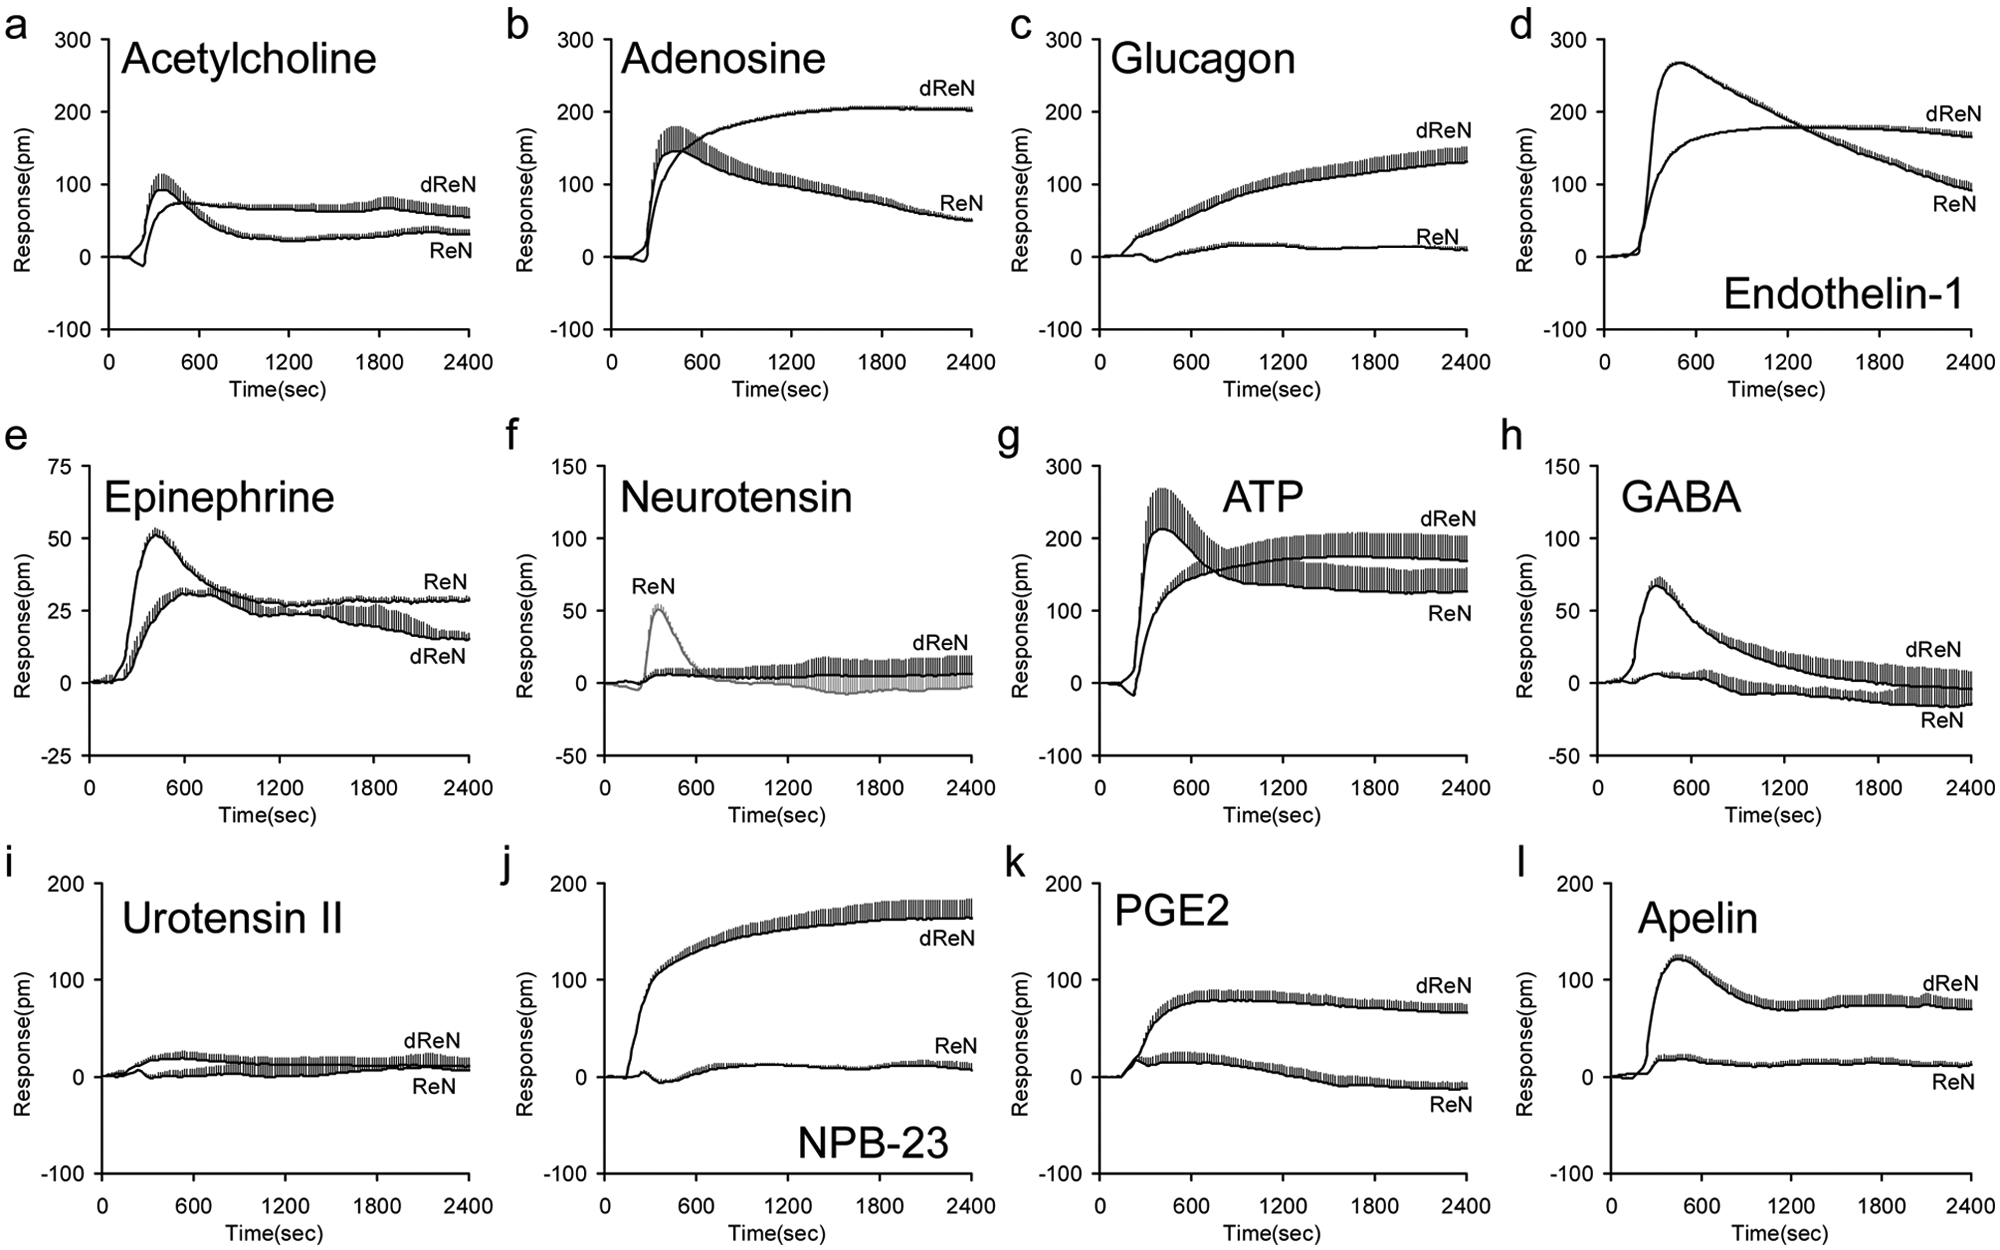
The differential dynamic mass redistribution (DMR) signals of representative G-protein-coupled receptor (GPCR) agonists in both undifferentiated (ReN) and differentiated (dReN) cells. (
Second, for a group of GPCRs whose mRNA levels were markedly altered during differentiation, we had also observed quite distinct DMR profiles from their cognate agonists. Specific examples include epinephrine, neurotensin, ATP, and GABA. For the adrenergic receptor family, only mRNAs for ADRA2B were detected in both cells, and its Ct value was increased from 24.4 to 31.2 after differentiation. Consistent with mRNA expression was the decreased DMR signal induced by epinephrine in the differentiated cells. mRNAs for NTSR1 were also markedly downregulated after differentiation, resulting in the disappearance of neurotensin-induced DMR in the differentiated cells. For the P2Y receptor family, mRNAs for P2RY1 and P2RY11 remained the same during the differentiation, whereas P2RY2 and P2RY6 were upregulated, and P2RY12, P2RY13, and P2RY14 were downregulated, collectively resulting in a distinct ATP DMR signal in the differentiated cells. Furthermore, consistent with the upregulation of GABBR1 and GABBR2 during differentiation was that GABA resulted in a robust DMR only in the differentiated cells.
Third, there was a small group of agonists whose DMR characteristics after differentiation cannot be explained by the expression of their known cognate receptors. These agonists include NPB-23, PGE2, and apelin. As a control, urotensin II expectedly did not trigger any obvious DMR in both cells since they do not express urotensin receptor. Neuropeptide B-23 was recently identified to be the natural agonist for both GPR7 (NPBW1) and GPR8 (NPBW2) receptors, 26 both of which were absent in the undifferentiated and differentiated cells. However, NPB-23 still triggered a robust DMR in the differentiated cells, suggesting that NPB-23 may activate another endogenous receptor, probably an unknown orphan GPCR. Similarly, none of known cognate receptors, including PTGFR, PTGER1, PTGER2, PTGER3, and PTGER4 for PGE2, was expressed at a high or moderate level in both cells, but PGE2 still resulted in a marked DMR in the differentiated cells. Conversely, apelin only resulted in a robust DMR in the differentiated cells, but its cognate receptor APLNR was expressed at an almost identical level in both undifferentiated and differentiated cells. Nonetheless, these results collectively suggest that the DMR assay indeed has high sensitivity to detect endogenous receptors, and the differentiation of the neural progenitor cells results in marked changes in the expression patterns and preferential signaling of endogenous receptors.
Pharmacological Characterization of ATP and Dopamine during Differentiation
Last, we performed pharmacological characterization of both ATP and dopamine during differentiation. ATP is a natural agonist for P2RY2, which is known to be expressed in astrocytes and to complex with both integrins and growth factor receptors to activate multiple signaling pathways, thus controlling reactive astrogliosis. 27 DMR agonist assays showed that ATP triggered a dose-dependent and saturable DMR response in both undifferentiated and differentiated cells but with distinct characteristics ( Fig. 5 ). First, ATP displayed higher potency in the undifferentiated cells than that in the differentiated cells. Based on the DMR amplitude at 10 min poststimulation, the EC50 of ATP to trigger DMR in differentiated and undifferentiated cells was 39.9 ± 2.7 nM and 8.3 ± 0.6 nM (n = 4), respectively. Similarly, based on the DMR amplitude at 50 min poststimulation, its EC50 was 193.0 ± 18.2 nM and 102.8 ± 10.5 nM (n = 4) for differentiated and undifferentiated cells, respectively. Second, the DMR characteristics at saturating doses were different between the two cells. In the undifferentiated cells, the ATP DMR consists of three phases: an early increased signal, followed by a small decaying signal and a subsequently small increased signal. However, the ATP DMR in the differentiated cells only consists of two phases. These differences suggest that P2Y receptor(s) exhibit different signaling pathway(s) during the differentiation process. Further studies are warranted to elucidate the difference in the signaling pathways and biological functions of P2Y receptors in this neural progenitor cell line.
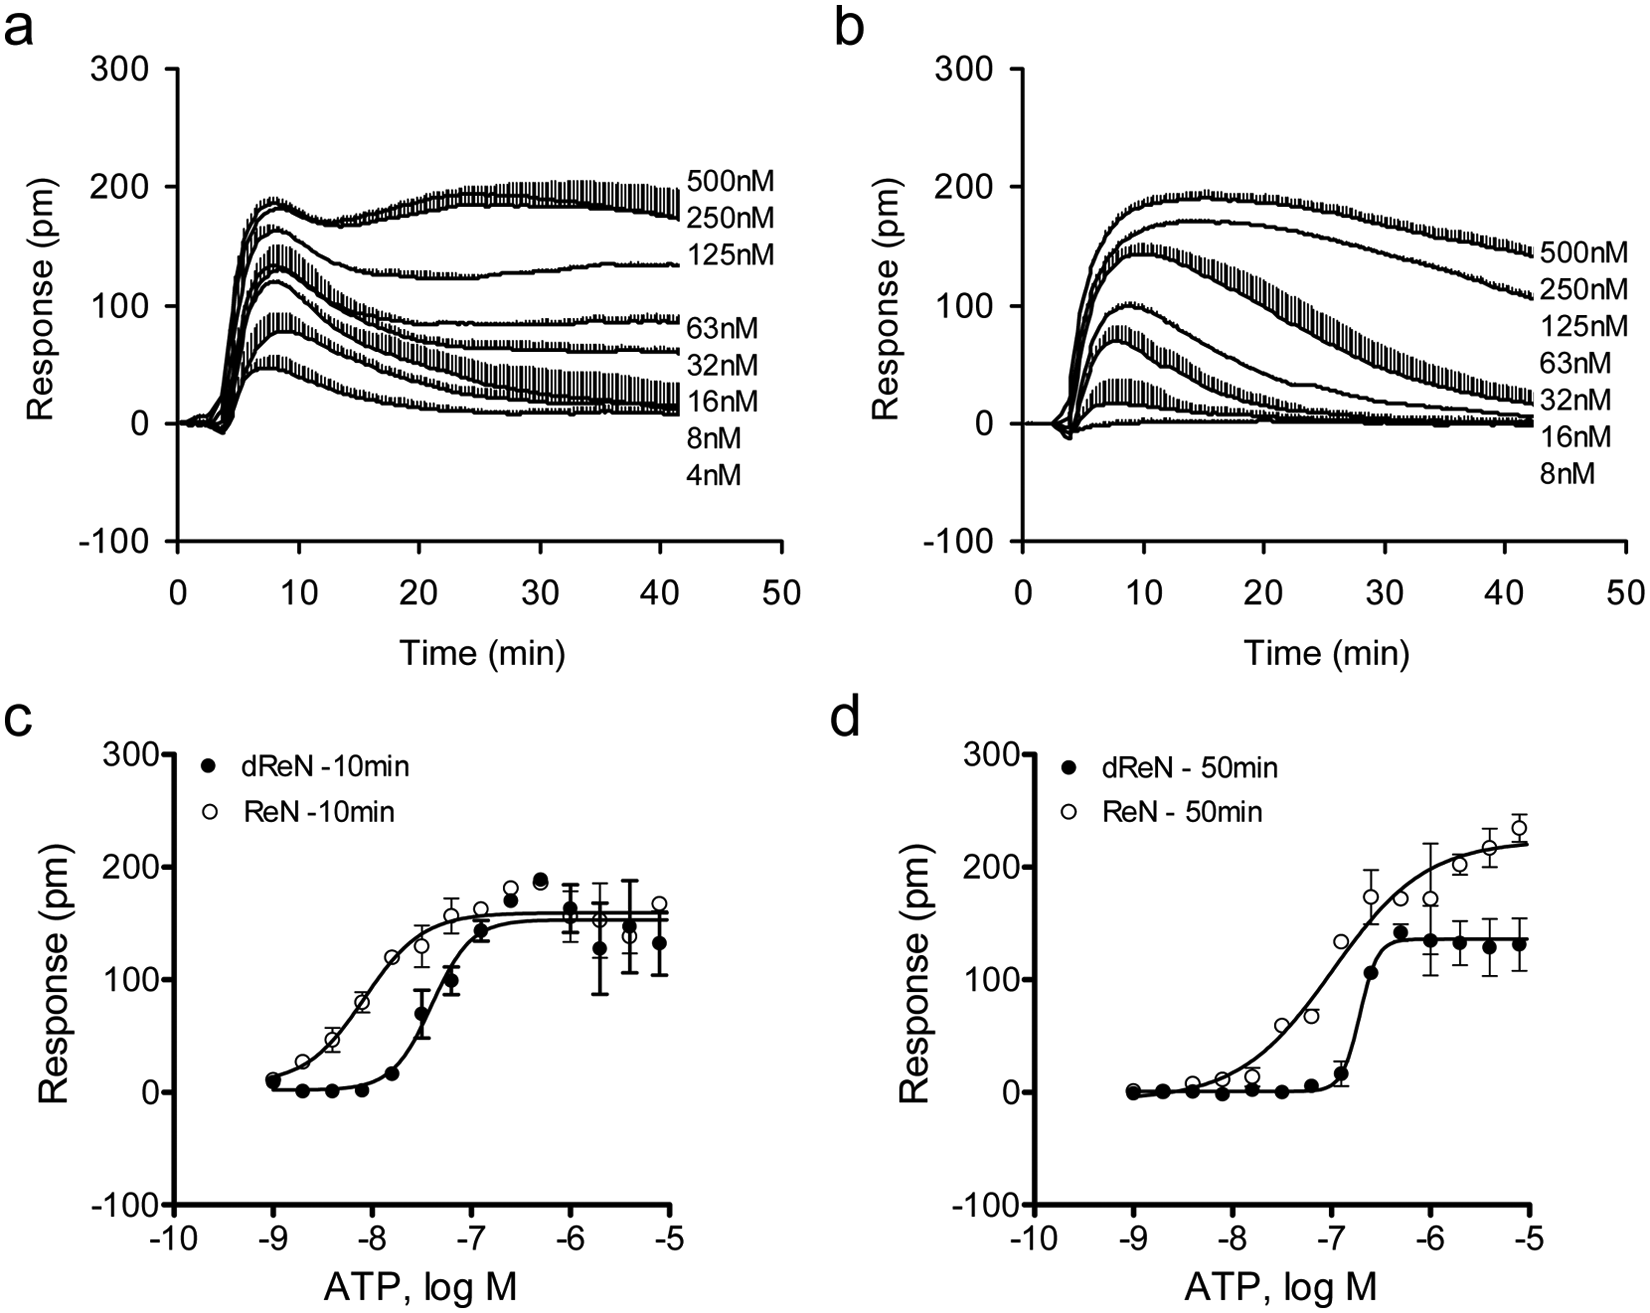
Dose responses of adenosine triphosphate (ATP). (
The undifferentiated ReN cells only express mRNAs for DRD4 at a moderately high level (Ct, 27.0) among the dopamine receptor family. Upon differentiation, both DRD1 and DRD4 were found to be significantly upregulated ( Table 1 and Fig. 3a ). DRD1 is known to couple to the Gαs signaling pathway, and DRD4 is coupled to the Gαi signaling pathway. Increasing evidence suggests that the DMR assay offers an integrated response consisting of contributions with the two pathways via the activation of the two distinct receptors.21,28,29 Results showed that dopamine triggered a detectable DMR in both cells with similar potency, but with distinct maximal amplitudes and characteristics ( Fig. 6 ). In the differentiated cells, its DMR amplitude was greater, and the kinetics for its initial increased signal was faster, compared with that in the undifferentiated cells. Further characterization of dopamine and other receptors was important to define signaling pathways that govern the differentiation process of ReNcell VM cells.
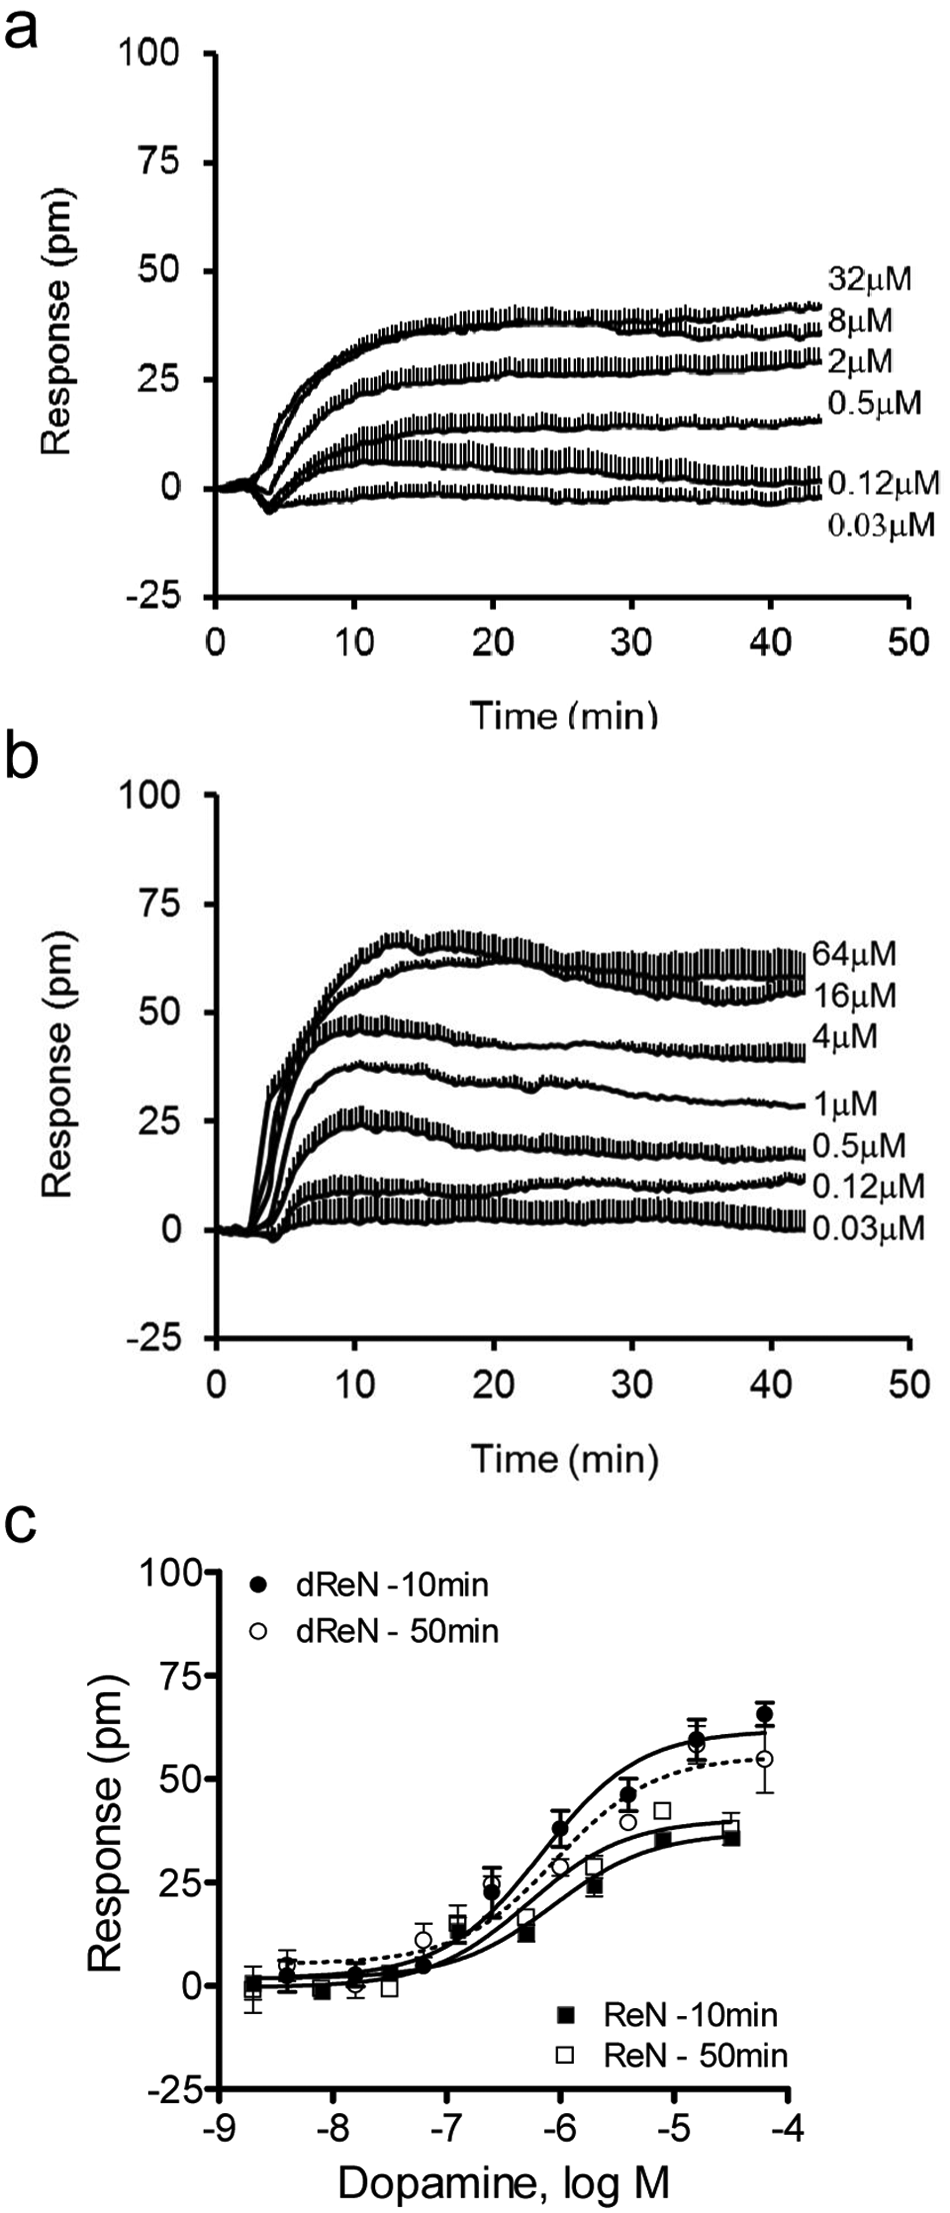
Dose responses of dopamine. (
Discussion
Human neuroprogenitor cells may represent a promising source for regenerative medicine 30 and a better cell model for identifying neurotoxic chemicals compared with conventional transformed cell lines and tissues. 31 ReNcell VM is an immortalized human neuroprogenitor cell line and can be differentiated into astrocytic glial cells and neuronal cells.18,32 Consistent with these studies, we had found that after withdrawal of growth factors from the growth media, the ReN cells were differentiated into a neuronal cell system consisting of astrocytes, neurons, and oligodendrocytes ( Fig. 1 ). Furthermore, the matured differentiation resulted in functional dopaminergic neurons, leading to release of dopamine after challenge with KCl ( Fig. 2 ). Quantitative RT-PCR showed that both undifferentiated and differentiated cells express mRNAs at a high and moderately high level for a large set of GPCRs ( Table 1 ), many of which are orphan GPCRs, suggesting that this neural progenitor cell line represents a good system for investigating orphan GPCRs. Orphan GPCRs whose expression levels are relatively high include GPR12, GPR19, GPR34, GPR123, GPR125, GPR135, GPR139, GPR141, GPR153, GPR173, and GPR182. Notably, both GPR123 and GPR141 were markedly upregulated during differentiation, suggesting the potential roles of both receptors in regulating the functions of the progenitor cells.
DMR profiling using a library of known GPCR agonists has led to novel findings. The DMR signals arising from these agonists were largely consistent with the expression patterns of their cognate GPCRs. However, the level of expression does not necessarily predict agonistic effects observed in DMR. Certain agonists, including adenosine and acetylcholine, triggered a DMR with altered characteristics in the differentiated cells, although their cognate receptor(s) remained largely unchanged after differentiation. Furthermore, a small group of agonists, including NPB-23, PGE2, and apelin, triggered a DMR in differentiated cells that is distinct from the control cells, and their DMR observed cannot be explained by the expression of their known cognate receptors. These results suggest that the differentiation of the neuroprogenitor cells results in marked changes in preferential signaling of these receptors, and there is another layer of regulatory activity in addition to the protein expression. This is consistent with recent findings that several signaling pathways are important to regulate the neural stem cell differentiation.33–35 Furthermore, a subset of GPCRs, including neurotensin, glucagon, GABA, NPB-23, PGE2, and apelin, exhibited specificity to the differentiation process. Thus, these agonists can be used as functional markers to monitor the differentiation processes of ReNcell VM cells. It is worth noting that the differentiated ReN cells were obtained using the relatively short differentiation protocol (i.e., 7-day differentiation) and may not have reached full maturation. Thus, it is possible that certain GPCRs may not have reached functional states. Examining long-term differentiation and/or different differentiation protocols may reveal additional insights in the differentiation process of ReN cells. Nonetheless, we combined DMR assays with conventional technologies, including RT-PCR, immunofluorescence, and HPLC, to characterize the differentiation of the ReNcell VM human neural progenitor cell line. The present study identified a panel of GPCRs that are divergent in their expression and signaling between the undifferentiated and differentiation cells, some of which can serve as surface markers to monitor the differentiation and quality control of neural progenitor cells.
Footnotes
Declaration of Conflicting Interests
The authors declared no potential conflicts of interest with respect to the research, authorship, and/or publication of this article.
Funding
The authors received no financial support for the research, authorship, and/or publication of this article.
References
Supplementary Material
Please find the following supplemental material available below.
For Open Access articles published under a Creative Commons License, all supplemental material carries the same license as the article it is associated with.
For non-Open Access articles published, all supplemental material carries a non-exclusive license, and permission requests for re-use of supplemental material or any part of supplemental material shall be sent directly to the copyright owner as specified in the copyright notice associated with the article.