
Abstract
Glutamate carboxypeptidase II (GCPII) is an important target for therapeutic and diagnostic interventions aimed at prostate cancer and neurologic disorders. Here we describe the development and optimization of a high-throughput screening (HTS) assay based on fluorescence polarization (FP) that facilitates the identification of novel scaffolds inhibiting GCPII. First, we designed and synthesized a fluorescence probe based on a urea-based inhibitory scaffold covalently linked to a Bodipy TMR fluorophore (TMRGlu). Next, we established and optimized conditions suitable for HTS and evaluated the assay robustness by testing the influence of a variety of physicochemical parameters (e.g., pH, temperature, time) and additives. Using known GCPII inhibitors, the FP assay was shown to be comparable to benchmark assays established in the field. Finally, we evaluated the FP assay by HTS of a 20 000–compound library. The novel assay presented here is robust, highly reproducible (Z′ = 0.82), inexpensive, and suitable for automation, thus providing an excellent platform for HTS of small-molecule libraries targeting GCPII.
Keywords
Introduction
Current studies focused on glutamate carboxypeptidase II (GCPII) prove that this zinc-dependent membrane-bound metalloprotease can serve as a target for the imaging and treatment of prostate cancer and neurologic disorders.1–3 GCPII expression pattern is mainly restricted to prostatic tissue and both the central and peripheral nervous systems, but is also present at lower levels in kidneys, small intestine, and neovasculature of solid tumors.4–7
Since GCPII expression is highly elevated in metastatic prostate carcinoma, the enzyme is exploited as a membrane-bound marker for prostate cancer imaging and experimental therapy. In addition, animal models of various neuropathologies (e.g., ischemia, traumatic brain injury, neuropathic pain, amyotrophic lateral sclerosis, diabetic polyneuropathy, schizophrenia) suggest that GCPII inhibition is neuroprotective by increasing the concentration of its cognate substrate N-acetylaspartylglutamate (NAAG) while countering the buildup of excitotoxic glutamate.1,3,8–11
Given the therapeutic and diagnostic potential of GCPII, it is not surprising that broad interest from both academic and industrial laboratories has surfaced regarding the design and development of GCPII-specific ligands/inhibitors. Presently, the two major categories of GCPII-specific inhibitors that exist are either analogs of NAAG (the GCPII substrate) or derivatives of glutamic acid (the reaction product).12,13 Consequently, both the chemical space tapped by such compounds and the diversity of GCPII-specific compounds are limited. For example, NAAG- or glutamate-based inhibitors are highly polar substances, with mitigated penetration into the neuronal compartment. Hence, structure-activity relationship (SAR) studies aimed at modifying physicochemical characteristics of current inhibitor scaffolds have so far failed to produce any real improvements. Therefore, the high-throughput identification of GCPII-specific scaffolds that could facilitate movement across the blood-brain barrier (BBB) would prove to be an invaluable tool for future basic studies and GCPII-based therapeutics.
The availability of a highly efficient, low-cost, and robust assay is a prerequisite for successful high-throughput screening (HTS), yet no such an assay has been described for GCPII. Currently, the available in vitro assays used for GCPII activity and inhibitory studies can be divided into three categories; their principles, together with their advantages and disadvantages, are summarized in Table 1 . The radioenzymatic assay, based on quantifying the hydrolysis of radiolabeled 3 H-NAAG, was the first in vitro assay employed successfully for both monitoring GCPII activity and inhibition studies. Due to its high sensitivity and low false-positive rates, it is regarded as a mainstay assay in GCPII studies. On the other hand, the assay is time- consuming, generates hazardous waste, and is expensive with low- to medium-throughput capability.14,15 An enzyme- coupled GCPII assay is based on the quantification of free glutamate using a commercially available Amplex Red glutamic acid kit (Molecular Probes, Eugene, OR). The assay exploits a chain of coupled enzymatic reactions to deliver a fluorescent signal that is directly proportional to the amount of free glutamate released via NAAG hydrolysis by GCPII.16,17 With the detection limit of 10 nM and scalability to a nanoliter format, the assay is in principle suitable for an HTS. However, in addition to high costs, the major disadvantage is a high false-positive rate that is associated with (1) the presence of three additional enzymes in the reaction mixture, (2) fluorescence quenching, and (3) oxidation of tested compounds by hydrogen peroxide formed during the generation of fluorescence, which can lead to decreased H2O2 concentration and the fluorescence intensity. The third approach relies on the hydrolysis of a suitable (nonnatural) GCPII substrate with the subsequent detection of reaction products by high-performance liquid chromatography (HPLC).17–20 Although this approach offers several advantageous features (nonhazardous, sensitive, low false-positive rate), it is more suitable to low-throughput applications dealing with a limited number of samples.
An Overview of Current Assays Used for Glutamate Carboxypeptidase II (GCPII)
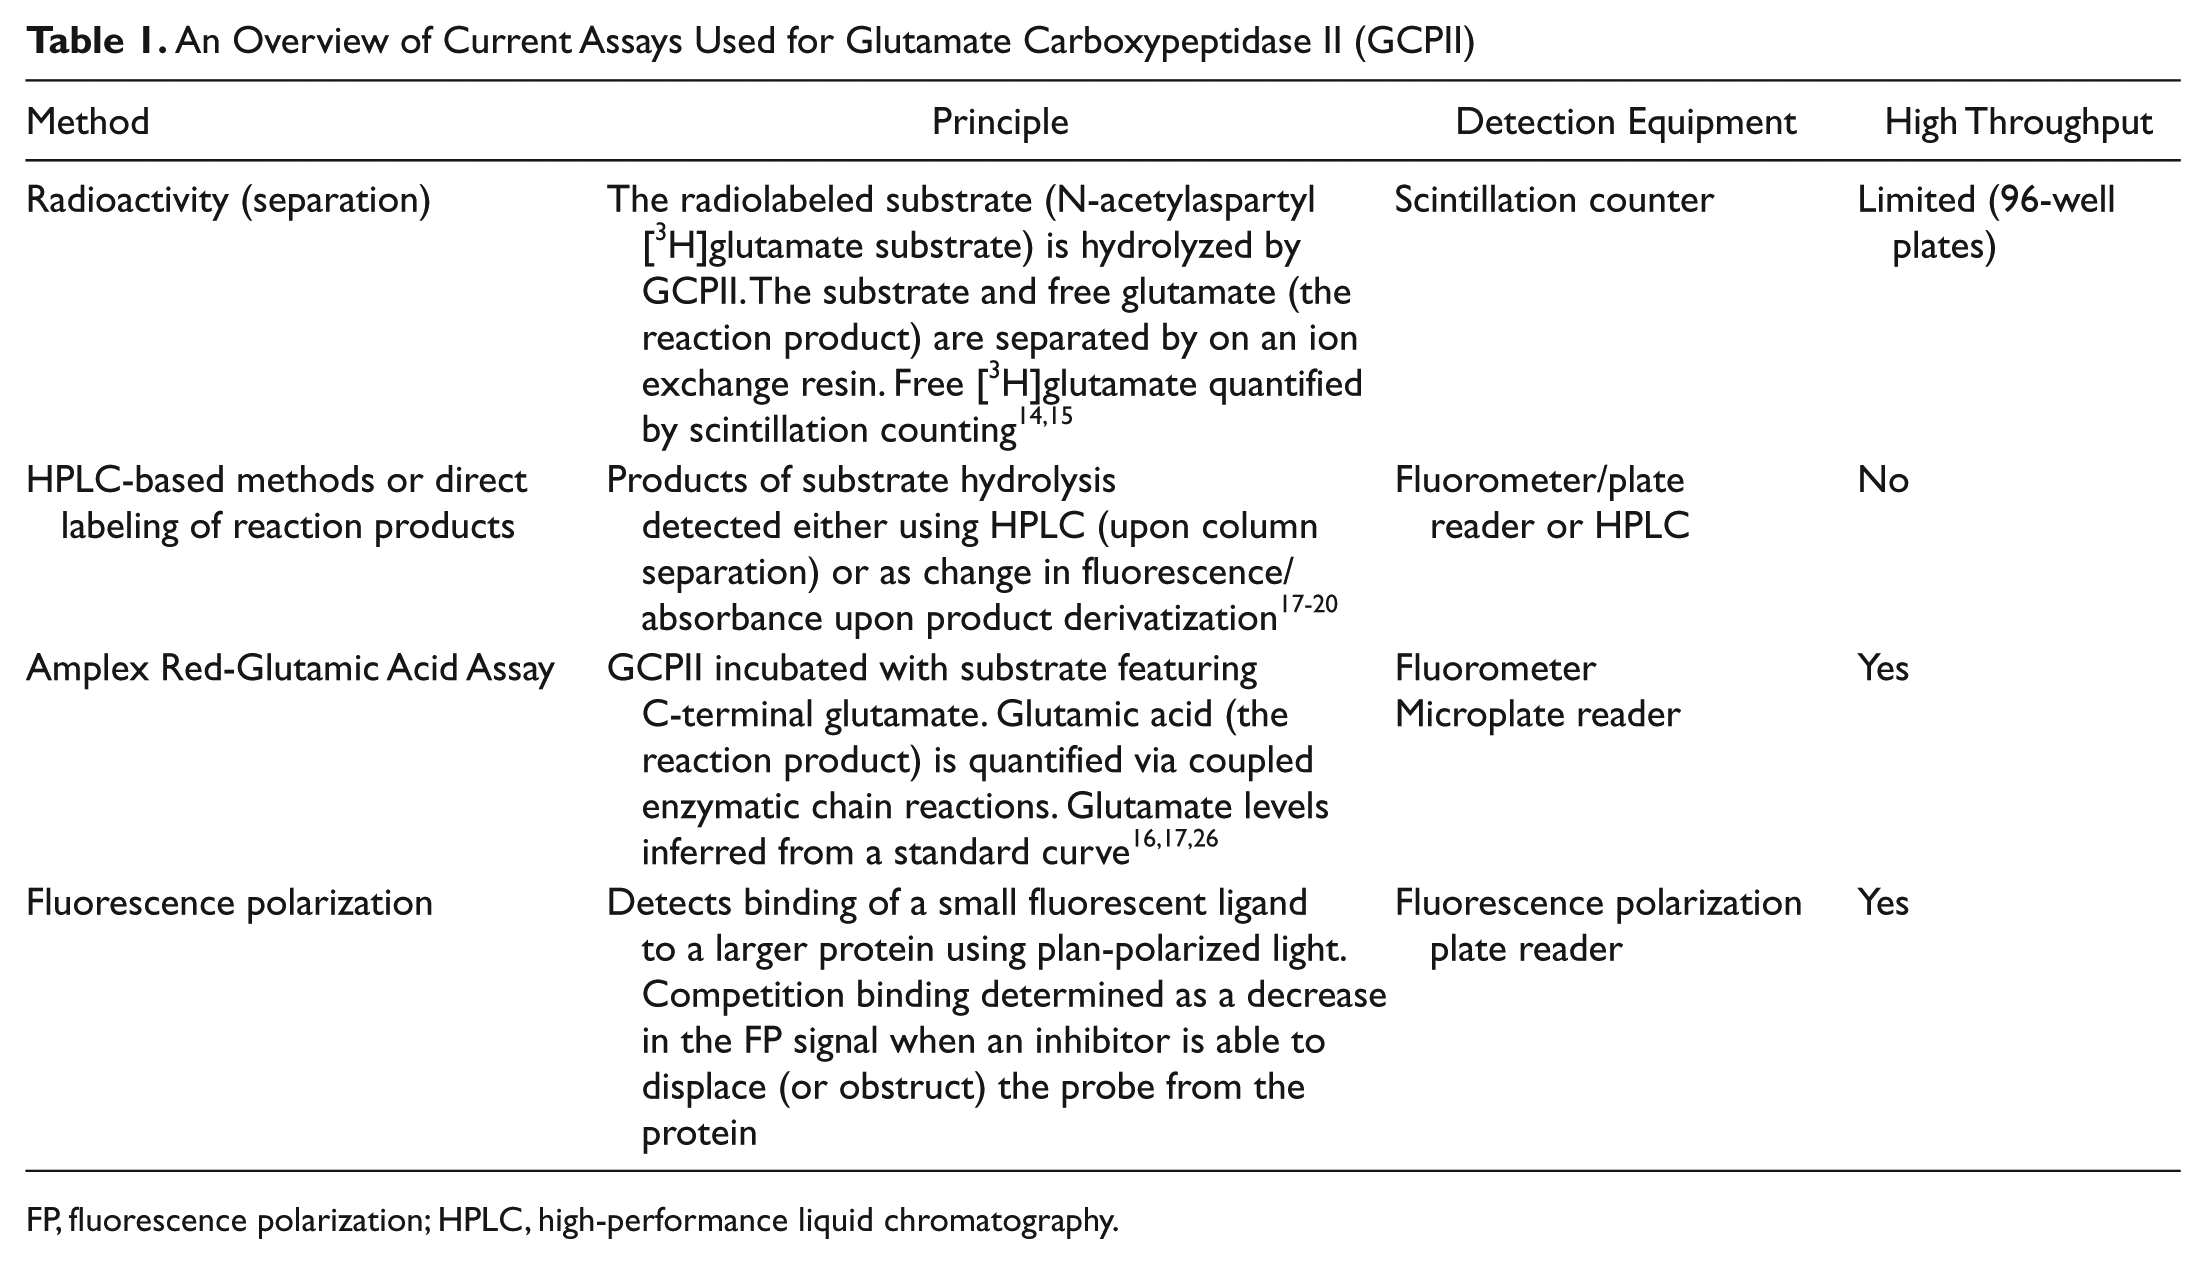
FP, fluorescence polarization; HPLC, high-performance liquid chromatography.
Here we present the design, development, and validation of a fluorescence polarization (FP) assay that complements and expands the portfolio of in vitro assays for GCPII. In contrast to the aforementioned assays, the key advantages FP offers include homogeneity, affordability, safety, robustness of signal, adaptability to low volumes, and suitability for automation. 21 These combined characteristics render the FP assay an excellent platform for HTS of small-molecule libraries targeting GCPII.
Materials and Methods
Unless stated otherwise, all chemicals were purchased from Sigma-Aldrich (Steinheim, Germany).
Protein Expression and Purification
Cloning, expression, and purification of the extracellular part of human GCPII (rhGCPII; amino acids 44–750) were executed as previously described. 22 The protein was overexpressed in S2 cells and purified using the following steps: concentration by tangential flow filtration (TFF; Millipore, Molsheim, France), ion-exchange chromatography (Q and SP Sepharose FF), affinity chromatography on Lentil-Lectin Sepharose, and size exclusion chromatography on a Superdex 200 column (all resins/columns from GE Healthcare Bio-Sciences, Upsala, Sweden). Purified rhGCPII (in final buffer 20 mM Tris-HCl, 150 mM NaCl, pH 8.4) was concentrated to 9 mg/mL and kept at −80 °C until further use.
Synthesis of the Fluorescent Tracer: TMR-X-Lys-urea-Glu (TMRGlu)
To a solution of Lys-Urea-Glu (
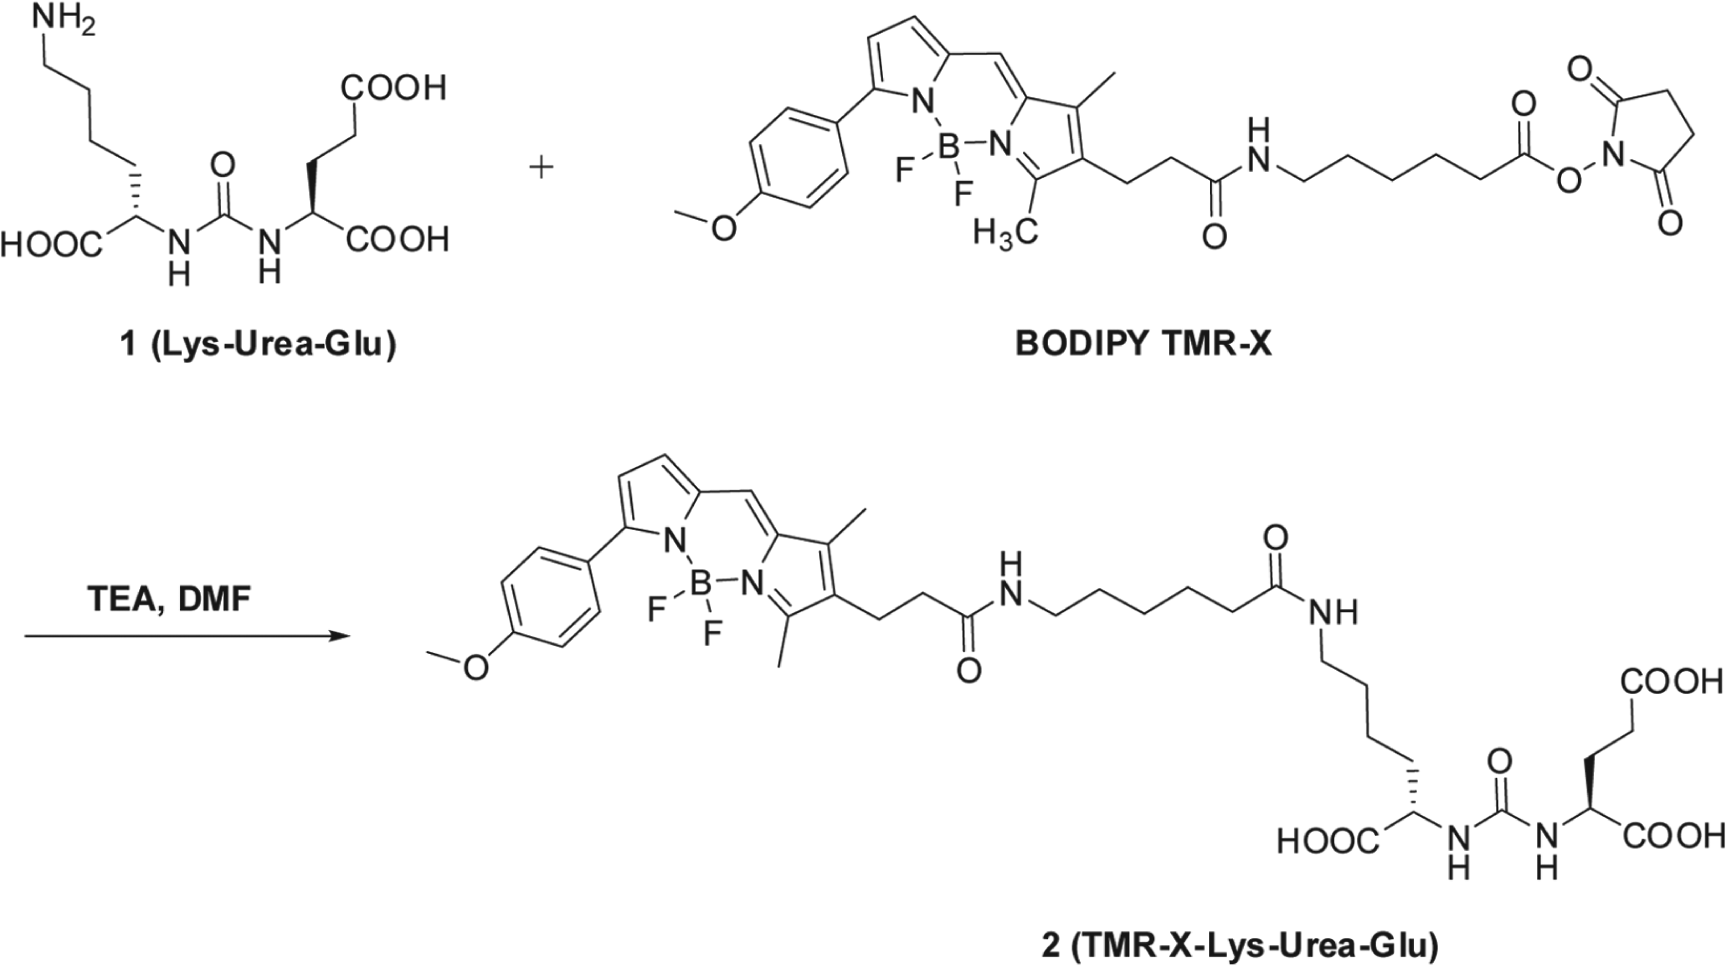
The synthesis of the fluorescent probe TMR-X-Lys-urea-Glu (TMRGlu) by covalently binding a Bodipy TMR fluorophore to a urea-based glutamate carboxypeptidase II (GCPII) inhibitor. DMF, dimethylformamide; TEA, triethylamine.
1H NMR (400 MHz, CD3CN/D2O) δ 7.83 (d, J = 5.2 Hz, 2H), 7.43 (s, 1H), 7.08 (d, J = 2.8 Hz, 1H), 7.01 (d, J = 5.2 Hz, 2H), 6.60 (d, J = 2.8 Hz, 1H), 4.08–4.15 (m, 2H), 3.85 (s, 3H), 3.03–3.08 (m, 4H), 2.64–2.72 (m, 2H), 2.45 (s, 3H), 2.20–2.31 (m, 3H), 2.20 (s, 3H), 2.11-2.15 (m, 1H), 1.88–1.94 (m, 2H), 1.68–1.73 (m, 2H), 1.56–1.61 (m, 2H), 1.23–1.39 (m, 8H), 1.12–1.18 (m, 2H). Electrospray ionization mass spectrometry (ESI-MS) calculated for C39H51BF2N6O10; positive mode: [M+H]+ 813.38, found 813.00; negative mode: [M–H]− 811.36, found 810.80.
FP Binding Experiments
All FP experiments were carried out in 30 µL of the assay buffer (100 mM Tris-HCl, 20 mM NaCl, pH 7.5) in black, flat-bottom, polystyrene 384-well microplates (Corning, Inc., New York, NY). The FP was determined using the multilabel reader EnVision (PerkinElmer, Waltham, MA) equipped with a Bodipy TMR optimized filter set (excitation polarization filter 531 nm and emission filter 595 nm). The FP values were calculated as mP units using the equation
Binding experiments using a constant concentration of 20 nM TMRGlu and decreasing concentrations of GCPII (starting at 500 µM, twofold dilutions) were performed in triplicates to determine the concentration necessary to reach saturation binding and optimize the assay window. The FP signal was measured following a 30-min incubation of the GCPII/TMRGlu mixture. All experiments were carried out at room temperature. The concentration resulting in 50% response (EC50) was calculated in GraphPad Prism 5 (GraphPad Software, La Jolla, CA) using the sigmoidal dose-response regression function.
pH Profile
The influence of pH on the assay performance was evaluated by using the optimized assay conditions and the following selection of 100 mM buffers: sodium citrate (pH 4–5), 2-(N-morpholino) ethanesulfonic acid (MES; pH 5.5–6.5), 3-(N-Morpholino)propanesulfonic acid (MOPS; pH 6.5–7.5), tris(hydroxymethyl)aminomethane (Tris; pH 7–9), and 2-(cyclohexylamino) ethanesulfonic acid (CHES; pH 8.6–10). TMRGlu was diluted to 20 nM (final concentration) in a solution containing 100 mM buffer (of required pH) and 50 mM NaCl. The probe solution was then titrated by increasing concentrations of GCPII. Both probe and GCPII working solutions were prepared in 100 mM buffer (+ 50 mM NaCl) suitable for a given pH range. Following the 30-min incubation of the GCPII/TMRGlu mixture, the FP was measured to identify the saturating GCPII:TMRGlu ratio for a given pH.
Inhibition Constants of Known Inhibitors
The performance of the FP assay was compared to established GCPII activity assays by determining inhibition constants of known GCPII inhibitors. To cover a wide range of inhibition potency, we selected the following inhibitors: glutamic acid (IC50 = 0.5 mM), quisqualate (IC50 = 10 µM), JHU-242 (IC50 = 20 nM), 2-(phosphonomethyl) pentanedioic acid (2-PMPA; IC50 = 0.3 nM), ARMP4 (IC50 = 60 pM), and DCIBzL (IC50 = 10 pM). Increasing concentrations of tested inhibitors were incubated with 60 nM GCPII (in 20 µL) for 25 min at room temperature. Next, 10 µL TMRGlu (60 nM in assay buffer) was added to the GCPII/inhibitor mixture and incubated for 30 more min. The experiments were carried out four independent times in triplicates. FP was measured and the data analyzed using a sigmoidal dose-response regression function in the GraphPad Prism 5.
Effects of Additives
To evaluate their effects on the assay performance, we assayed common additives in quadruplicates. These included DMSO (25% v/v), acetonitrile (20% v/v), Triton X-100 (2% v/v), Tween-20 (2% v/v), and NaCl (2M). Various concentrations of individual additives (twofold dilutions) were mixed with a fixed GCPII concentration (120 nM) in a total volume of 20 µL. Following a 20-min incubation, 10 µL TMRGlu (60 nM) was added and FP measured 30 min later. Data were analyzed by one-way analysis of variance (ANOVA) using the GraphPad Prism 5.
HTS of a Chemical Library
Screening of a chemical library consisting of 20 000 compounds was carried out in black, flat-bottom 384-well microplates (Corning, Inc.). Protein and TMRGlu stock solutions were kept at 4 °C and protected from light before they were used in the screening. First, 20 µL of 60 nM GCPII in the assay buffer was dispensed by the Multidrop Combi (Thermo Scientific, Billerica, MA) liquid dispenser to the assay plates prior to compound addition. Library compounds stored in 384-polypropylene compound plates at 1 mM in 100% DMSO were transferred by the JANUS Automated Workstation (PerkinElmer) equipped with a 96-pin tool (V&P Scientific, Inc., San Diego, CA). The compound transfer by the robot was optimized such that 30 nL of the DMSO solution was transferred each time, resulting in the 1000× compound dilution in the assay plate and 1 µM final concentration. Following a 25-min incubation on the bench, 10 µL of 60 nM TMRGlu in the assay buffer was dispensed by a Multidrop and FP was determined 30 min later.
To achieve higher final concentrations of the library compounds, we subsequently carried out a second screen by pipetting 1.5 µL of compound stock solutions to reach the final concentration of 60 µM.
To check the quality of the assay between plates throughout the screening, we used two established competitive GCPII inhibitors—2-PMPA and JHU-242 with IC50 = 300 pM and 20 nM, respectively—as positive controls in duplicates on each of the screened plates. The autofluorescence of the compounds was assessed with a 535-nm excitation filter and a 590-nm emission filter by measuring the fluorescence intensity of each compound of the chemical library. The data from the FP measurement were stored in the database and normalized by the b-score method 23 after the completion of the screen.
Radioenzymatic Counterscreen
Inhibitory activity of tested compounds yielding FP readouts below 70% of uninhibited (control) reactions was validated using the radioactivity-based assay adapted to a microplate format. 15 The counterscreen incorporated the testing of duplicates at two inhibitor concentrations: 100 µM and 10 µM. To 5 µL of each tested compound (final 100 µM and 10 µM), 10 µL GCPII (40 pM final concentration) and 30 µL Tris-HCl buffer (pH 7.4, 40 mM and CoCl2 1 mM) were added. The mixture was incubated for 15 min and then exposed to NAA[3H]G (30 nM in a total volume of 50 µL) for 15 min at 37 °C. 2-PMPA (10 µM; final) was selected as the positive control and 2% DMSO as the negative control. The reaction was stopped with 50 µL ice-cold sodium phosphate buffer (pH 7.5, 0.1 M). An aliquot of the reaction mixture (90 µL) was transferred to a 96-well spin column (Harvard Bioscience Massachusetts, Holliston, MA) containing AG1X8 ion-exchange resin; the plate was centrifuged at 900 rpm for 3 to 5 min using a Beckman GS-6R centrifuge (Beckman Coulter, Brea, CA) equipped with a PTS-2000 rotor. After washing with 1 M formic acid (2 × 90 µL to each column), an aliquot (200 µL) from each well was transferred to a solid scintillator-coated 96-well plate (Packard, Meriden, CT) and dried to completion. The radioactivity corresponding to [3H]G was determined with a scintillation counter (counting efficiency 40%, Topcount NXT; Packard). The percentage of inhibition was calculated and compared with the percentage calculated from the FP assay.
Results and Discussion
TMRGlu Design and Synthesis
The synthesis of the fluorescence probe, designated TMRGlu, was accomplished by covalently attaching a Bodipy TMR fluorophore (Invitrogen, Carlsbad, CA) to a urea-based GCPII inhibitory scaffold described previously.24,25 The synthetic scheme is shown in Figure 1 .
The design of TMRGlu has been guided by our prior structural and SAR studies. The GCPII-docking portion TMRGlu is based on a lys-urea-glu moiety that serves as a building block for a variety of GCPII inhibitors and imaging agents.22,26 The fluorophore moiety (Bodipy TMR) is connected to the urea functionality via a 19-Å-long linker. It has shown that the appropriate (minimal) linker length is an important characteristic for the probe design and is preferably longer than 20 Å for the distal fluorophore moiety to be placed outside the entrance funnel so that it does not hinder probe binding.26–28 The Bodipy TMR fluorophore was selected because of (1) a high extinction coefficient and high fluorescence quantum yield and (2) a relatively long excited-state lifetime.
GCPII/TMRGlu Saturation Binding
Preliminary experiments with the free TMRGlu established the optimal concentration of the probe at 20 nM. This is the minimal probe concentration that can be reliably measured without significant interference from background fluorescence (data not shown).
The saturation binding kinetics was determined by titrating a fixed 20-nM concentration of TMRGlu with increasing concentrations of GCPII, with the equilibrium saturation curve shown in Figure 2 . The data were fitted using a sigmoidal regression function and the binding constant calculated at 13 nM with the saturation reached at approximately twofold excess of GCPII over TMRGlu. It can be noted from Figure 2 that the 2:1 GCPII:TMRGlu ratio offers an excellent assay window with ΔmP = 330 (the differential between free TMRGlu [50 mP] and the GCPII/TMRGlu complex [380 mP]). Since the saturation conditions of the assay require GCPII concentration at approximately 40 nM, the lower limit of the assay (i.e., the lowest inhibition constant that can be determined by this assay) is restricted to this concentration range (see Competitive Inhibitors—Dose Response).
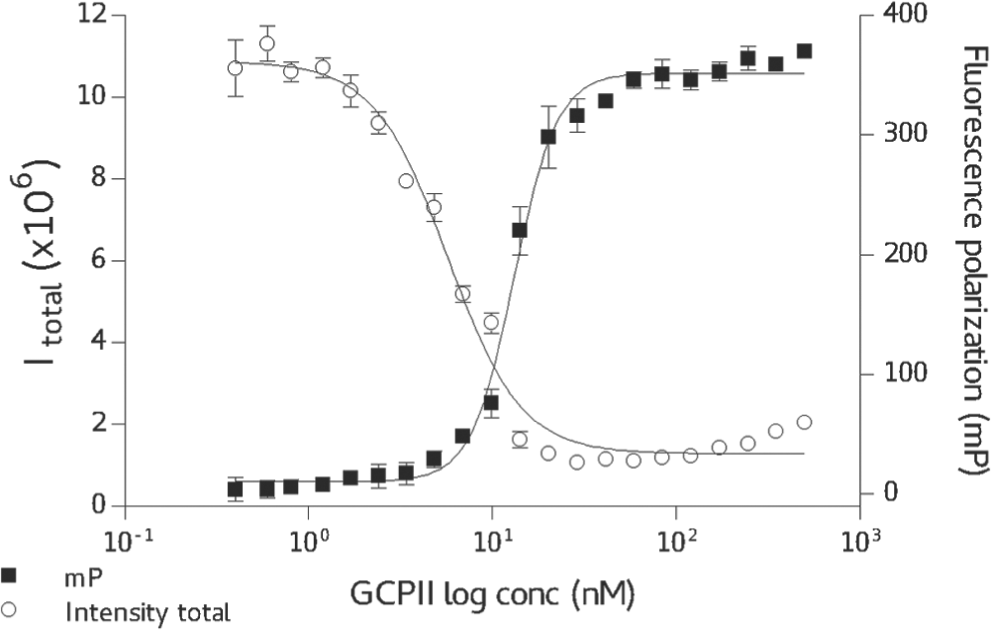
Saturation binding curve for glutamate carboxypeptidase II (GCPII)/TMR-X-Lys-urea-Glu (TMRGlu). In total, 20 nM TMRGlu has been titrated by increasing concentrations of GCPII and corresponding fluorescence polarization (FP) and fluorescence intensity (P channel) measured. The data were fitted using a dose-response inhibition model; EC50 = 13 nM.
In addition to an increase in the mP value, the formation of the GCPII/TMRGlu complex is accompanied by the substantial decrease in the fluorescence yield of the TMRGlu in both P and S planes ( Fig. 2 ). Apparently, upon binding to GCPII, TMRGlu fluorescence is quenched by interactions with the enzyme, although the mechanistic details are not known at present. The observed changes in the fluorescence intensity could be thus used as a complementary parameter during the screening process, where both fluorescence polarization and intensity can be monitored. However, we did not systematically use this effect in the analysis of the screening data, and the hit identification was carried out entirely using the data from fluorescence polarization. In addition, the intrinsic autofluorescence of the compound was identified as the main source of false-positive hits.
Assay Optimization—Temperature Stability, pH Dependence, and the Effect of Additives
To evaluate the robustness of the assay, we used the saturation conditions described above to assess the influence of time, temperature, pH, and several common additives on the assay performance. Upon the addition of the TMRGlu to twofold molar excess of GCPII, the mixture reached equilibrium (i.e., no change in mP or fluorescence intensity) after approximately 10 min, and the solution was stable for at least 24 h at both 4 °C and 20 °C (room temperature). These results are in concordance with our unpublished data suggesting that GCPII is stable in buffered solutions for over 1 day. On the basis of these results, we took an advantage of the observed GCPII stability and typically used a 1- to 5-h assay window for our HTS (see below).
The influence of pH was evaluated for pH values ranging from 4 to 10, with the choice of an appropriate 100-mM buffer for each of the defined pH intervals. The “optimal” saturation curves (i.e. with lower Kd values and saturation reached at lower concentrations of GCPII) were observed using the Tris-HCl buffer at pH range 7.0 to 9.0. For pH intervals 5.5 to 7.0 and 9.0 to 10.0, a higher GCPII/TMRGlu ratio (250 nM/20 nM and 500 nM/20 nM GCPII/TMRGlu for pH 5.5 and 10.0, respectively) was needed, but the saturation could be reached eventually. Finally, at pH values below 5.5, saturation could not be reached for any GCPII concentration included in the test (up to 500 nM). These results reflect previous studies determining the pH dependence on NAAG-hydrolyzing activity by GCPII, where the enzyme was shown to retain activity, with a sharp decrease in the rate of substrate hydrolysis at pH <5.5 and >9.0. It is likely that extreme pH values are associated with lower affinity of GCPII toward substrates/inhibitors as well as leading to the (partial) denaturation of the protein.20,29
DMSO is often used as a solvent for small-molecule compounds in chemical libraries, especially in circumstances when a library is mainly composed of more lipophilic molecules with limited water solubility. In addition, nonionic detergents, various salts, and volatile organic solvents can be added to stabilize reaction mixtures of tested compounds. Several of such compounds were tested for their influence on the assay performance, and the data are summarized in
Competitive Inhibitors—Dose Response
To benchmark our novel FP assay to established GCPII activity assays (mainly the radioactive assay that is the “standard assay” in the field; Table 1 ), we determined inhibition constants for several known competitive GCPII inhibitors and compared data to values available in the literature. Inhibitors were chosen to cover a wide range of inhibition constants from millimolar (e.g., L-glutamate) to subnanomolar (e.g., 2-PMPA). Inhibition curves of several representative inhibitors together with calculated IC50 values are shown in Figure 3 . Overall, when using inhibitors that are around IC50 values of 10 to 20 nM or above, the data obtained by the FP assay are nearly identical to IC50 values that were earlier determined by the radioenzymatic or HPLC assays. The following values are the calculated IC50s by our assay (numbers in parentheses are for published inhibition constants determined by radioenzymatic or HPLC assays): 0.87 mM (0.50 mM) for glutamic acid, 16.7 µM (10 µM) for quisqualate, and 19.2 nM (20 nM) for JHU242. In the case of competitive inhibitors with subnanomolar inhibition constants, IC50 values fell to the limit of the assay, which can be roughly defined as 50% of GCPII concentration used for the screening. For example, using 20 nM TMRGlu together with 40 nM GCPII, one can expect IC50 values at around 20 nM for all subnanomolar inhibitors. We confirmed these theoretical predictions testing several potent GCPII inhibitors, including DCIBzL (IC50 = 0.01 nM; radioactive assay), 2-PMPA (IC50 = 0.3 nM), and ARMP-4 (IC50 = 0.06 nM). The IC50 values determined by FP were 12.6 nM, 14.2 nM, and 28.8 nM, for DCIBzL, ARMP-4, and 2-PMPA, respectively. In summary, in the case of competitive GCPII inhibitors, the assay window fits into the range spanning low nanomolar (limit 20 nM) to millimolar affinities, which is adequate for an HTS of chemical libraries that typically yield hits with micromolar affinities. Once a medicinal chemistry program is established and more potent compounds are generated, one could then switch back to lower throughput yet more sensitive assays for accurately measuring IC50 values of less than 20 nM.
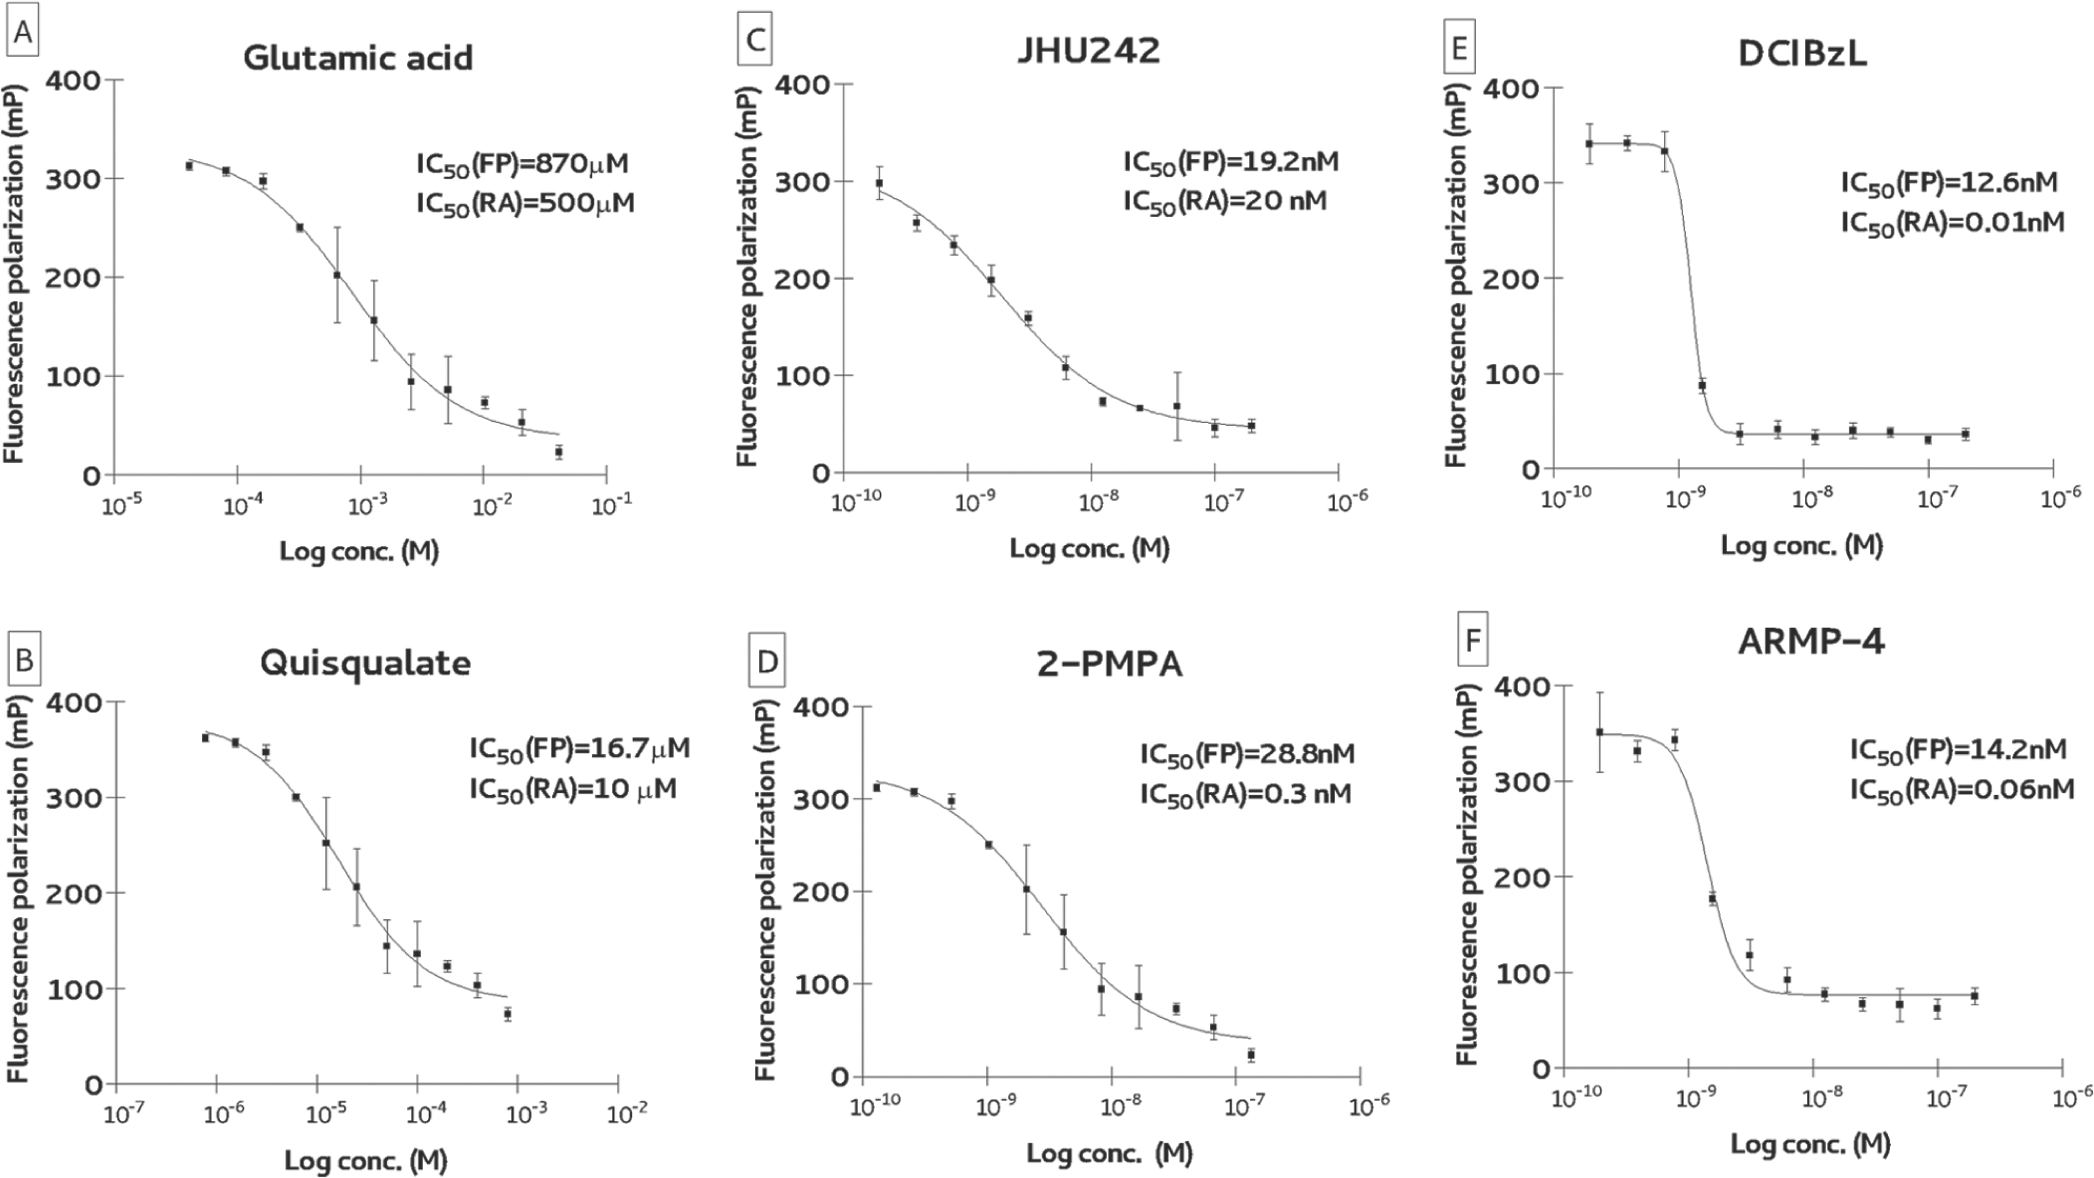
Inhibition constant for competitive glutamate carboxypeptidase II (GCPII) inhibitors: (
Noncompetitive Inhibitors
In the case of competitive inhibitors, both molecules (probe and tested compound) bind to spatially overlapping sites of the enzyme in an exclusive manner. Consequently, the tested compound can either displace GCPII-bound probe (probe added first, tested compound later) or directly block probe binding (tested compound added first, probe subsequently). The latter setup was used in our HTS (see below).
In the case of noncompetitive (allosteric) inhibitors, an inhibitor, typically interacting with residues outside the specificity pocket of the enzyme, should be able to block formation of the GCPII/TMRGlu complex when added to the enzyme prior to the probe. On the other hand, the inhibitor addition to the preformed GCPII/TMRGlu complex should not have any effect on measured FP. In theory thus, one can distinguish between competitive and noncompetitive inhibitor binding by simply reversing the additions of inhibitor and probe to the assay mixture.
To test these predictions experimentally, we used IBT-100, a noncompetitive GCPII inhibitor with an unknown mode of action that binds at the surface of GCPII at a distance approximately 20 Å from the active site (data not shown). The addition of IBT-100 to the preformed GCPII/TMRGlu complex did not elicit any changes (probe displacement) throughout the whole range of concentrations tested. On the other hand, preincubation of the inhibitor with GCPII prior to probe addition resulted in the “typical” inhibition profile with IC50 = 22.2 µM ( Fig. 4A ). To the contrary, analogous experiments using quisqualate, a competitive GCPII inhibitor with similar potency (IC50 = 10 µM), produced nearly identical inhibition curves in both experimental setups ( Fig. 4B ). Consequently, this single set of experiments (there are no other noncompetitive GCPII inhibitors known) suggests that the FP assay is suitable for the identification of both competitive and noncompetitive (allosteric) inhibitors of GCPII as well as offers an easy way to distinguish between the two classes of inhibitors.
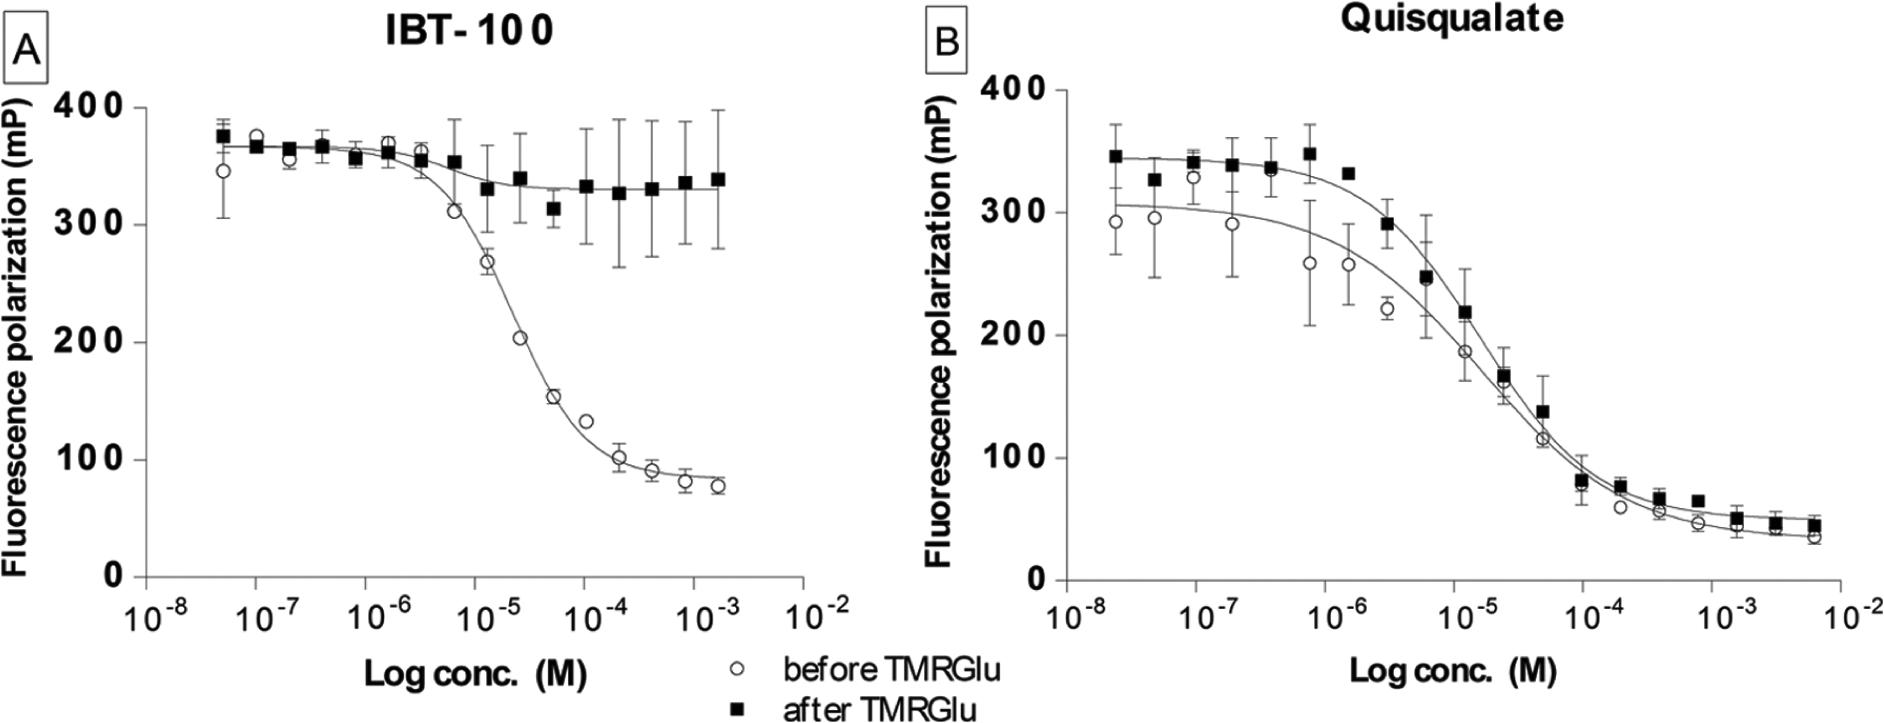
Fluorescence polarization (FP) assay allows distinguishing between the noncompetitive/allosteric (
High-Throughput Screening
To determine relevant qualitative/quantitative assay statistics, we carried out five independent experiments using optimized assay conditions together with several known GCPII inhibitors as standards (data not shown). Considering both intra- and interplate variations, the calculated Z′ factor is 0.82, validating the applicability of the assay for HTS applications.30,31
We next used the validated assay for an HTS using several distinct small-molecule libraries comprising approximately 20 000 compounds. Libraries were screened at two final concentrations, 1 µM and 60 µM, respectively, as described earlier. The second (higher concentration) screen was required because using 1-µM concentrations of tested compounds (the first screen) yielded only a limited number of positive hits. 2-PMPA and JHU-242, two established competitive GCPII inhibitors with IC50 values of 300 pM and 20 nM, respectively, were used as internal positive standards throughout screening. A typical layout from a plate is shown in
During our HTS, we noticed that many false-positive readings were associated with intensely colored compounds often yielding high background fluorescence. Such false-positive readings are, however, intrinsically linked with these types of assays and are difficult to fully eliminate. 31 To minimize the impact of the inherent fluorescence of compounds on the fluorescence polarization readout, we have determined the autofluorescence of compounds in the library at similar excitation/emission wavelengths that were used for the fluorescence polarization (535/595 nm). Of the 10 strongest autofluorescent compounds, 9 were active in the HTS at both 1-µM and 60-µM concentrations, suggesting that beside dynamic/static quenching, the compound autofluorescence is one of the factors contributing to the false-positive determinations. Therefore, a careful choice of the cutoff for autofluorescent compound exclusion is needed to achieve good balance for specific hit identification and false-positive hit exclusion. We have eliminated all compounds with autofluorescence exceeding five times the background level from the hit list as autofluorescent, as shown in Table 2 .
Hit Rates in the Primary High-Throughput Screen (HTS)
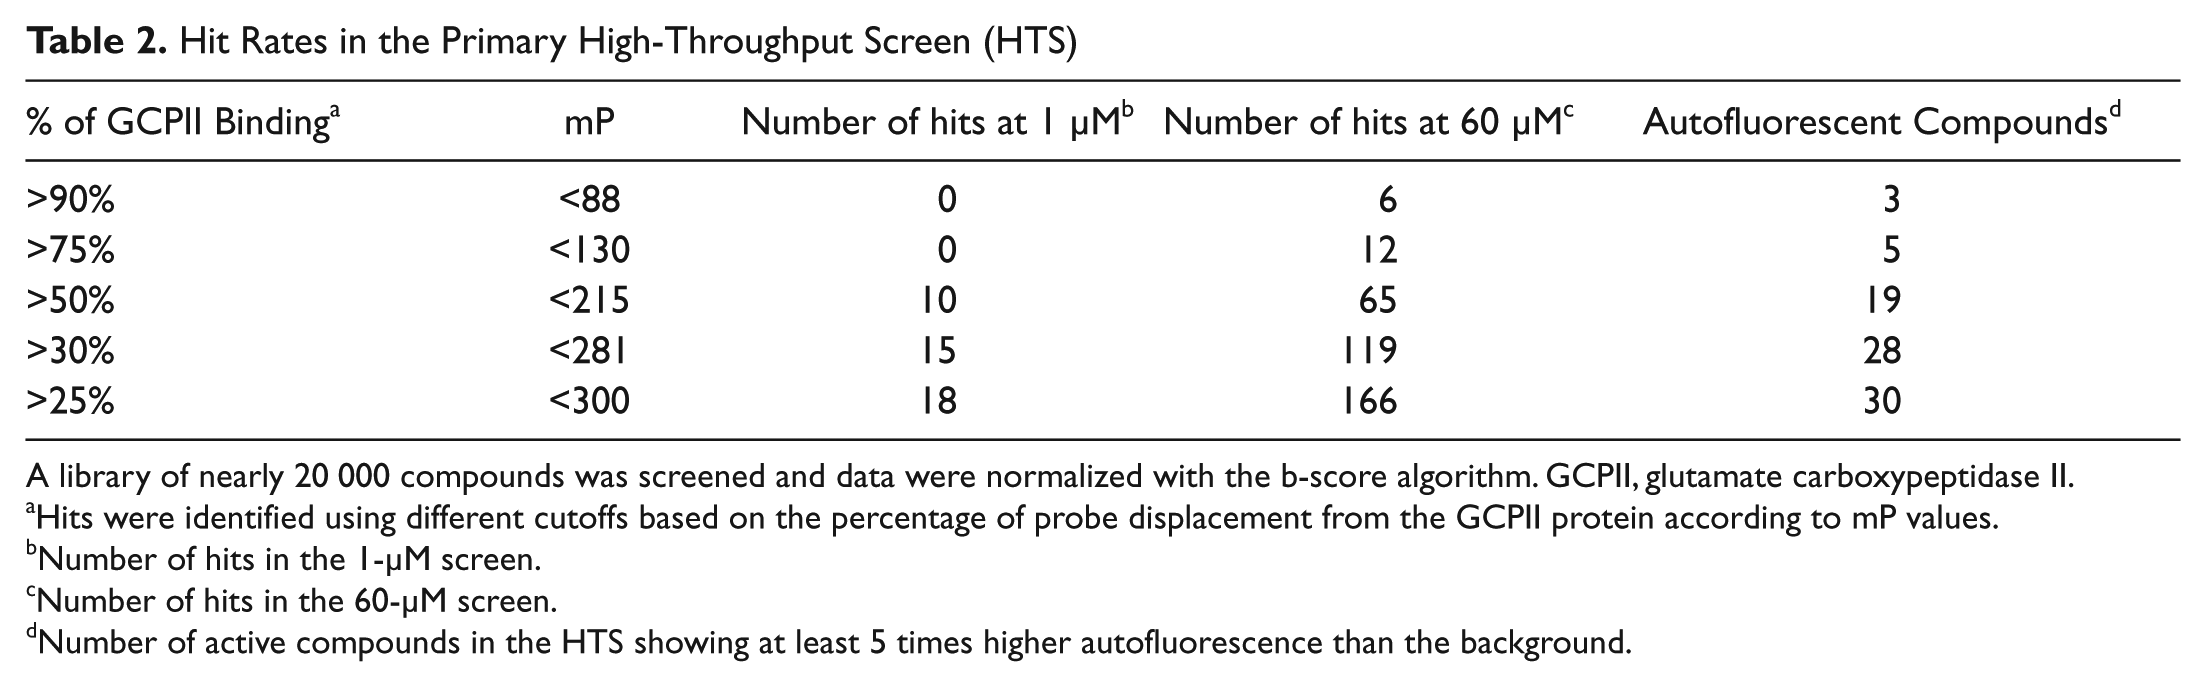
A library of nearly 20 000 compounds was screened and data were normalized with the b-score algorithm. GCPII, glutamate carboxypeptidase II.
Hits were identified using different cutoffs based on the percentage of probe displacement from the GCPII protein according to mP values.
Number of hits in the 1-µM screen.
Number of hits in the 60-µM screen.
Number of active compounds in the HTS showing at least 5 times higher autofluorescence than the background.
For hit identification, we have tested different conditions based on the percentage of probe displacement from the GCPII protein ( Fig. 5 ). When using stringent conditions (percentage of displacement >75 %, mP <130), no hit was identified in a 1-µM screen. Almost half of the hits identified in the 60-µM screen were autofluorescent. When releasing the conditions below 50%, the hit rate in the nonfluorescent compounds increased considerably, as shown in Table 2 .
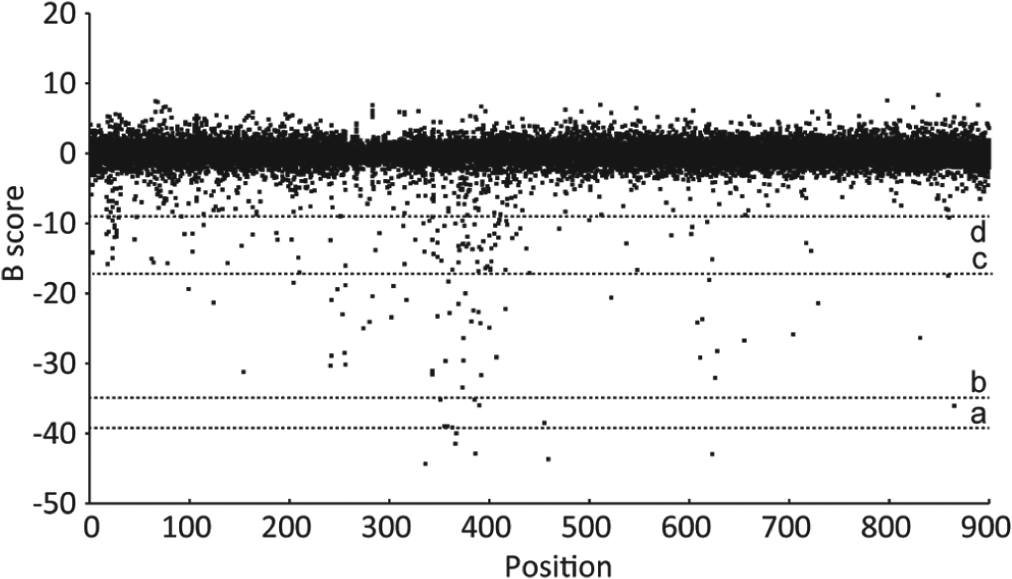
Overview of the primary high-throughput screening (HTS) carried out at 60 µM. Data were stored in the database and normalized with the b-score algorithm. Different cutoffs represented by dotted lines were applied to identify hits. a: b-score = −39 (>90% of GCPII binding), b: b-score = −35 (>75% of GCPII binding), c: b-score = −17 (>50% of GCPII binding), d: b-score = −9 (>25% of GCPII binding). GCPII, glutamate carboxypeptidase II.
Overall, out of approximately 20 000 compounds tested, we selected 98 compounds and validated the prospective hits using a radioenzymatic assay in a 96-well plate format. 15 The radioenzymatic counterscreen was performed at concentrations of 100 µM and 10 µM in duplicates. Only compounds that inhibited GCPII enzymatic activity at least from 30% at 100 µM were considered validated hits. As expected, the false-positive rate increases with the relaxation of cutoffs used in the hit selection in the primary screen, as shown in Table 3 . For example, all three nonfluorescent compounds that exhibited mP <88 in the primary screen were validated in the secondary screen. On the other hand, only 26 of 39 hits that showed mP <215 in the primary screen were subsequently validated. Generally, relaxation of the cutoffs for hit selection allows for discovery of new scaffolds with relatively lower affinity to GCPII at the cost of a higher false-positive rate.
Validation of the Primary Hits in the Radiometric Counterscreen
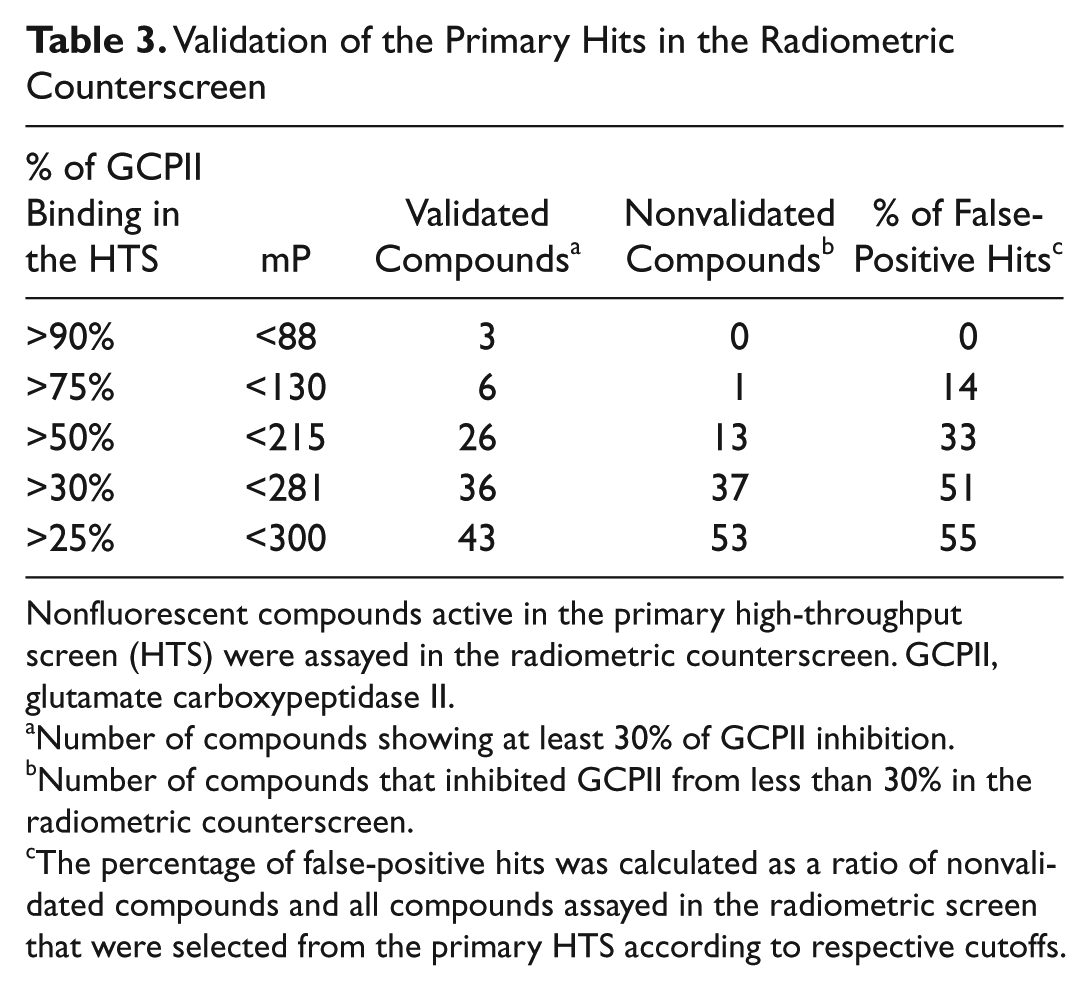
Nonfluorescent compounds active in the primary high-throughput screen (HTS) were assayed in the radiometric counterscreen. GCPII, glutamate carboxypeptidase II.
Number of compounds showing at least 30% of GCPII inhibition.
Number of compounds that inhibited GCPII from less than 30% in the radiometric counterscreen.
The percentage of false-positive hits was calculated as a ratio of nonvalidated compounds and all compounds assayed in the radiometric screen that were selected from the primary HTS according to respective cutoffs.
In conclusion, the FP-based assay presented here is an excellent alternative to established GCPII assays and offers many advantageous features that include it being nonhazardous, homogeneous, adaptable to low volumes, and time/cost-effective. The robustness of the assay is supported by solid statistics (Z′ = 0.82), compatibility with common solvents, and a wide assay range that spans from low nanomolar to millimolar concentrations of tested compounds. Thus, for the drug developmental purpose of identifying novel inhibitory scaffold leads, the FP assay is ideally suited for HTS of small-compound libraries.
Footnotes
Declaration of Conflicting Interests
The authors declared no potential conflicts of interest with respect to the research, authorship, and/or publication of this article.
Funding
The authors disclosed receipt of the following financial support for the research, authorship, and/or publication of this article: Ministry of Education, Youth and Sports of the Czech Republic (ME10031, LC06077); IRG (project number 249220); EMBO (installation grant #1978); and the IBT (AV0Z50520701) provided institutional support. Funding was also provided by National Institutes of Health (NIH) CA151838, MH080580, CA161056 and CA134675.
References
Supplementary Material
Please find the following supplemental material available below.
For Open Access articles published under a Creative Commons License, all supplemental material carries the same license as the article it is associated with.
For non-Open Access articles published, all supplemental material carries a non-exclusive license, and permission requests for re-use of supplemental material or any part of supplemental material shall be sent directly to the copyright owner as specified in the copyright notice associated with the article.