
Abstract
An anticough medicine, noscapine [(S)-3-((R)4-methoxy-6-methyl-5,6,7,8-tetrahydro-[1,3]dioxolo[4,5-g]isoquinolin-5-yl)-6,7-dimethoxyiso-benzofuran-1(3H)-one], was discovered in the authors’ laboratory as a novel type of tubulin-binding agent that mitigates polymerization dynamics of microtubule polymers without changing overall subunit-polymer equilibrium. To obtain systematic insight into the relationship between the structural framework of noscapine scaffold and its antitumor activity, the authors synthesized strategic derivatives (including two new ones in this article). The IC50 values of these analogs vary from 1.2 to 56.0 µM in human acute lymphoblastic leukemia cells (CEM). Geometrical optimization was performed using semiempirical quantum chemical calculations at the 3-21G* level. Structures were in agreement with nuclear magnetic resonance analysis of molecular flexibility in solution and crystal structures. A genetic function approximation algorithm of variable selection was used to generate the quantitative structure activity relationship (QSAR) model. The robustness of the QSAR model (R2 = 0.942) was analyzed by values of the internal cross-validated regression coefficient (R2LOO = 0.815) for the training set and determination coefficient (R2test = 0.817) for the test set. Validation was achieved by rational design of further novel and potent antitumor noscapinoid, 9-azido-noscapine, and reduced 9-azido-noscapine. The experimentally determined value of pIC50 for both the compounds (5.585 M) turned out to be very close to predicted pIC50 (5.731 and 5.710 M).
Introduction
N
Although noscapine is cytotoxic in a variety of different cancer cell lines in the public library of the U.S. National Cancer Institute (60-cell screen), the IC50 values remain in the high micromolar ranges (˜21.1 to 100 µM). Opportunities must now be explored to acquire better and more effective derivatives. Indeed, our initial efforts have been quite encouraging in that we have some more effective derivatives of the lead compound noscapine.6–9 This led us to build a reasonable quantitative structure activity relationship (QSAR) model. The QSAR model guided us in rationally designing the azido derivatives of noscapine with superior activity. We synthesized 9-azido-noscapine and reduced 9-azido-noscapine and tested their biological activity against human lymphoblastoid cells (CEM) that corroborate with the QSAR evaluation. Thus, results show that our QSAR model is robust and demonstrates successful predictive ability for further drug development.
Materials And Methods
Data set
The data set in this study consists of 32 noscapine derivatives, collectively called noscapinoids ( Table 1 ), with different substitutions on the isoquinoline and dimethoxy benzyl furanone ring systems of noscapine scaffold. All of these compounds were synthesized from noscapine as a starting material. Compound 1 was purchased from Sigma-Aldrich (St. Louis, MO). The halogenated derivatives of noscapine ( Table 1 , compounds 2–5) were synthesized by substituting halogen groups (Br, Cl, F, and I) at C-9 of the scaffold structure as previously described. 6 The cyclic ether halogenated analogs of noscapine ( Table 1 , compounds 6–10) were synthesized by reducing an oxygen atom from the benzyl furanone ring, also described previously. 7 The nitro derivatives of noscapine ( Table 1 , compounds 11 and 12) were synthesized by substituting a nitro group at C-9. 8 One group of compounds ( Table 1 , compounds 13–21) contains aryl-substituted N-carbamoyl/N-thiocarba-moyl noscapine analogs. 9 The other analogs ( Table 1 , compounds 22–32) harbor changes in the two methoxy groups, the lactone ring of the isobenzofuranone system (the dioxolo ring and the methoxy group), as well as the methyl group in the isoquinoline ring system. 9 All test compounds used in this study were dissolved in DMSO as 10 mM stock.
Chemical Structures of Noscapine and Its Congeners Used in the Present Study along with Their Observed Inhibitory Activity of CEM (Human Lymphoblastoid) Cancer Cell Line Proliferation
In vitro cell proliferation assays
Each of these compounds had associated in vitro antitumor activities in variety of cancer types including a few in CEM (human lymphoblastoid) cancer cell lines. Therefore, we had determined the biological activities of all compounds in one specific cell line and at similar experimental conditions (to minimize any bias). We have used CEM cell lines as our assay system, which were provided by Dr. William T. Beck (Cancer Center, University of Illinois at Chicago, Chicago, IL). Cell culture reagents were obtained from Mediatech (Cellgro; Manassas, VA). Cells were grown in RPMI-1640 medium supplemented with 10% fetal bovine serum, 1% penicillin/streptomycin, 2 mM l-glutamine at 37 °C in a humidified atmosphere with 5% CO2. Suspension cells were plated into 96-well plates at a density of 5 × 10³ cells per well and were treated with gradient concentrations of noscapinoids for 72 h. Measurement of cell proliferation was performed with a colorimeter by 3-(4,5-dimethylthiazol-2-yl)-5-(3-carboxymethoxyphenyl)-2-(4-sulphophenyl)-2H-tetrazolium, inner salt (MTS) assay, using the CellTiter96 AQueous One Solution Reagent (Promega, Madison, WI). Cells were exposed to MTS for 3 h, and absorbance (optical density) was measured using a microplate reader (Molecular Devices, Sunnyvale, CA) at a wavelength of 490 nm. The percentage of cell survival as a function of drug concentration was then plotted to determine the IC50 value. The negative logarithm of IC50 value in molar concentrations (pIC50 = − (log10 IC50)) of these compounds was used as response for QSAR model building.
Molecular modeling and calculations of molecular descriptors
Molecular models of noscapine and its analogs were built using the builder feature in Maestro (Schrödinger package, version 8.5). Each structure was assigned an appropriate bond order using ligprep (Schrödinger package, version 2.4), and a unique low-energy ring conformation with correct chirality was generated. All structures were subjected to molecular mechanics energy minimizations using Macromodel (Schrödinger package, version 9.8) with default settings. Partial atomic charges were assigned to the molecular structures using the OPLS 2005 force field. To ensure that the geometry of the structure was fairly reasonable, we performed complete geometric optimization of these structures using Jaguar (Schrödinger package, version 7.7). We have used hybrid density functional theory with Becke’s three-parameter exchange potential and the Lee-Yang-Parr correlation functional (B3LYP) and basis set 3-21G* for geometrical optimization. We have also recently determined the crystal structure of noscapine (
Elucidation of dynamic structure of noscapine. (
Different classes of molecular descriptors were calculated. Briefly, quantum chemical descriptors including heat of formation, dipole moment, highest occupied molecular orbital (HOMO), lowest unoccupied molecular orbital (LUMO) energies, and local charges were calculated by the molecular operating environment (MOE; version 2009–2010) software. Different topological, shape-based, physical, constitutional, and inductive descriptors were also calculated for each molecule by MOE software. MOE provides a number of calculation functions for descriptors and has unique universal descriptors that enable a variety of properties to be modeled.
Data processing and QSAR modeling
The total number of molecular descriptors calculated initially was 422. All of these molecular descriptors were categorized into different classes such as topological, shape, physical, sterimol, and quantum. A systematic search in the order of missing value test, zero test, correlation coefficient, and genetic function approximation (GFA) was performed to determine significant descriptors from each class of descriptor for QSAR model building. The calculated descriptors were collected in a data matrix (D), whose number of rows and columns were the number of molecules and descriptors, respectively. The descriptors were centered to zero mean and scaled to unit variance (auto scaling). Any parameter that is not calculated (missing value) for any number of the compounds in the data set was rejected in the first step. Some of the descriptors were rejected because they contained a value of zero for all compounds and have been removed (zero tests). To minimize the effect of colinearity and to avoid redundancy, the correlation of descriptors with each other was investigated, and those pairs with high colinear relationships were determined. Among the colinear descriptors, one with the lowest correlation with drug activity was removed from the data matrix. Among the remaining descriptors, the set of descriptors that gave statistically best QSAR models was selected using GFA 10 within the QSAR-evolution module (ga.svl) of the MOE program. This evolutionary genetic tool enables automated QSAR modeling on the fly and is available through the SVL exchange. The GFA algorithm starts with the creation of a population of randomly generated parameter sets. The algorithm was set up to discover descriptor-activity relationships consisting of linear polynomial terms. One hundred random initial equations with four variables were used (adding constants where necessary) to search for equations of unlimited length but with acceptable lack-of-fit (LOF) scores. 10 New “child” equations were generated using the multiple linear regression method. Child equations were mutated (i.e., changed at “birth”) 50% of the time after their generation by addition of randomly selected new terms. The number of generations of equation evolution required in the data set was gauged by the attainment of adjusted R2 values and minimal LOF scores. Creation of a consecutive generation involves crossovers between set contents, as well as mutations. The total number of crossovers was set to 50 msp14;000 with the autotermination factor of 1000 (meaning that the calculation was stopped when the fitness function value does not change during 1000 crossovers). The equations were evaluated for statistical soundness by the Friedman LOF score, R2, adjusted R2, least-squares error, and correlation coefficient after cross-validation statistics. The Friedman LOF score is expressed by the following equation:

where LSE is the least-square error, c is the number of basis functions in the model, d is smoothing parameters, p is the number of descriptors, and m is the number of observations in the training set. The smoothing parameter, which controls the scoring bias between equations of different sizes, was set at default value of 1.0.
Validation of QSAR models
The predictive capability of the developed QSAR model was validated based on several statistical tests such as leave-one-out, leave-10%-out, and leave-20%-out cross-validation and a Y-randomization test using an svl script (Qsarwizard.svl). The cross-validation regression coefficient (R2LOO) was calculated based on the prediction error sum of squares (PRESS) and sum of squares of deviation of the experimental values, Y, from their mean (SSY) using the following equation:

where Yexp, Ypred, and Ȳ are the experimental, predicted, and mean values of experimental activity of the training set compounds, respectively. The Y-randomization test was done by repeatedly shuffling the activity values of the data set and developing new QSAR models and then comparing the resulting score with the score of the original QSAR model generated from nonrandomized activity values. This process was repeated 100 times. If the original QSAR model is statistically significant, its score should be significantly better than those from permuted data. We have used a parameter, Rp2, which penalizes the model for the difference between the squared mean correlation coefficient of randomized models (Rr2) and the squared correlation coefficient of the nonrandomized model (R2). The Rp2 parameter was calculated by the following equation:

The parameter Rp2 ensures that our QSAR models thus developed are not obtained by chance. We have assumed the value of Rp2 should be greater than 0.5 for an acceptable model.
The determination coefficient in prediction using the test set (R2test) was calculated using the following equation11,12:

where Ypred test and Yexp test are the predicted values based on the QSAR equation (model response) and experimental activity of the test set compounds. Ȳexp train is the mean activity value of the training set compounds. Further evaluation of the predictive ability of the QSAR model for the test set compounds was done by determining the value of rm2 by the following equation11,12:

where Rtest2 is the squared Pearson correlation coefficient for regression calculated using Y = a + bx; a is referred to as the y-intercept, b is the slope value of regression line, and Rtest02 is the squared correlation coefficient for regression without using the y-intercept, and the regression equation was Y = bx.
To further check the intercorrelation between molecular descriptors used in the final QSAR model, we performed variance inflation factor (VIF) analysis. The VIF value was calculated from 1/(1 – R2), where R2 is the multiple correlation coefficient of one descriptor’s effect regressed onto the remaining molecular descriptors. If the VIF value is larger than 10 for a descriptor, its information could be hidden by other descriptors.11,12
Results
Antitumor activity of noscapinoids
We determined the antitumor activities (IC50) of 32 noscapinoids in the human lymphoblastoid cancer cell line (CEM) to complete a reasonable data set that possesses a variety of substituents with different hydrophobic and electronic properties while preserving the primary skeleton of noscapine ( Table 1 ). This series of noscapinoids have a reasonably wide spectrum of antitumor activities (1.2 µM to 56.0 µM; statistically significant; F = 182.6, p < 0.001), as determined by MTS assay. The reasonable structural diversity as well as the resulting biological activity (IC50 in CEM) could produce QSAR models for accurate activity predictions. We used 22 structures as a training set for the development of our QSAR models to compute the biological activity for a test set of the remaining 10 structures.
Optimization of the structure of noscapinoids
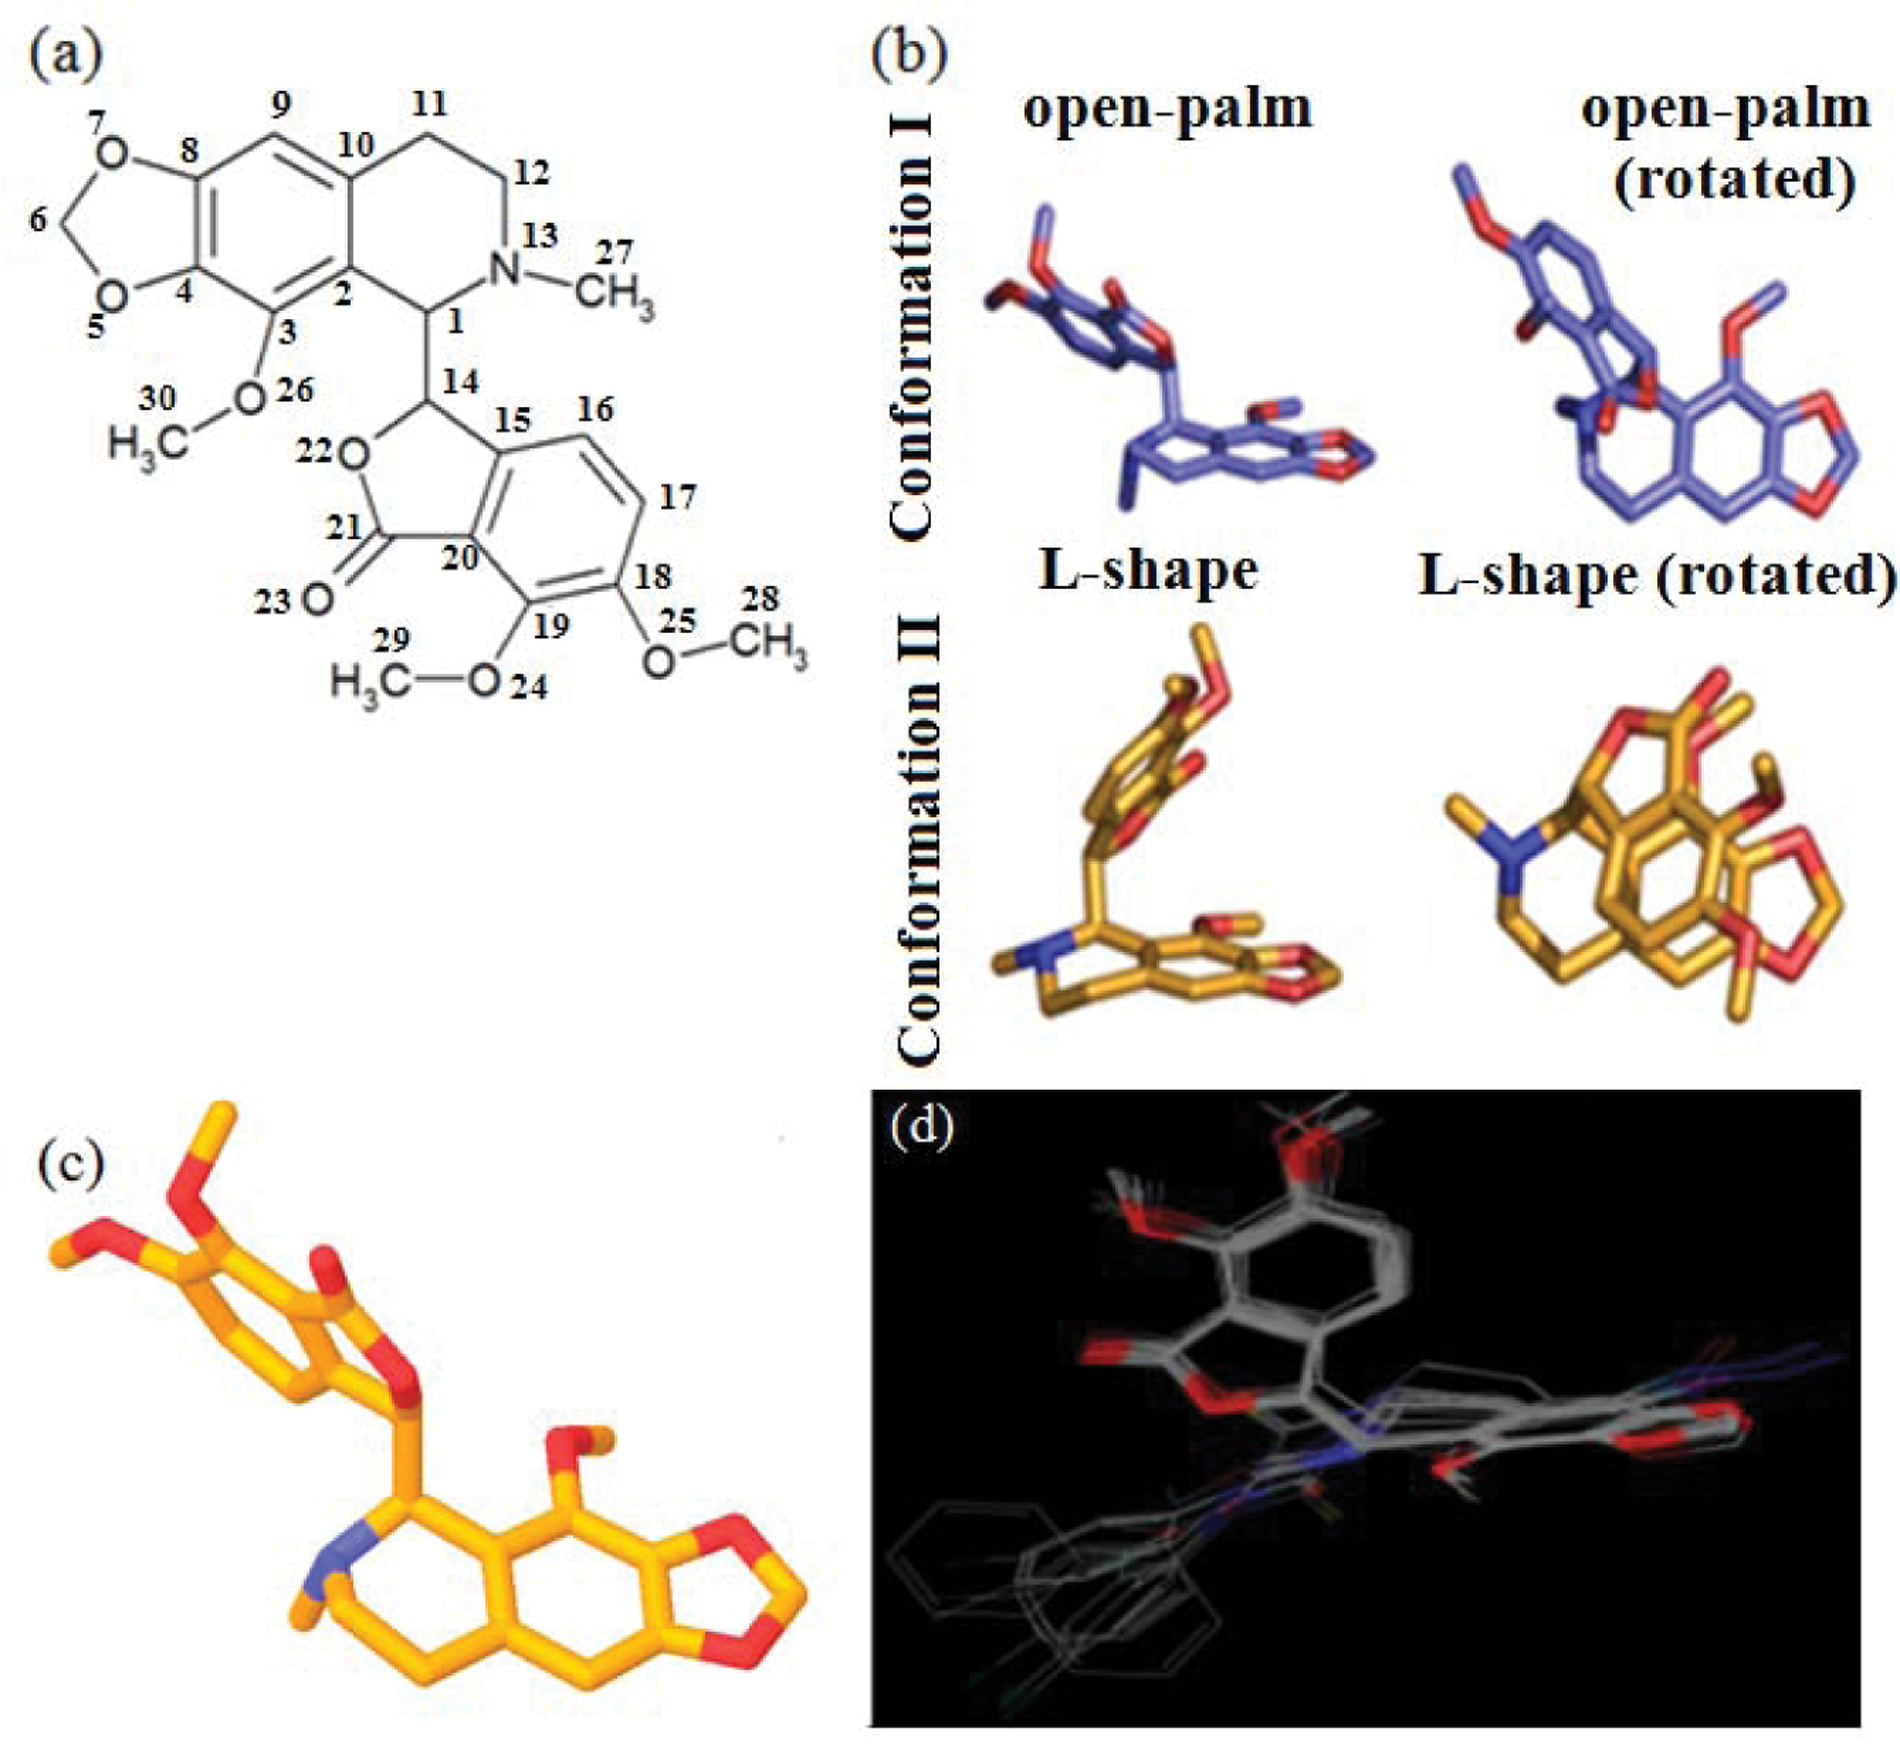
The structure of noscapine can be viewed as two flat planar plates of its two-ring systems (isoquinoline and isobenzofuranone) joined by a rotatable single C-C bond between two chiral centers of the molecule. This is much akin to two palms of the hand put together at an angle of approximately 36° but rotating freely in space against each other, producing a range of structures between two extremes of an L-shaped closed palm (two planar rings at approximately 36°) and a completely extended outstretched open palm (two-ring planes at approximately 108°). Noscapine might thus experience a diverse range of conformer states in solution. To get an insight into this, we used high-resolution two-dimensional NMR spectroscopy to determine the range of the dynamic structure of noscapine in solution and then calculated the percentage of time spent in each conformer state. This was done using nuclear overhauser and exchange spectroscopy spectra that calculate the distances between various protons of the noscapine (
Fig. 1a
). Distances obtained for different conformations were then integrated with a methodology called NAMFIS.
13
NAMFIS integrates NMR observables and force-field structures to specify individual conformers and their relative percentages. In addition, this algorithm is capable of identifying multiple conformers consistent with the experimental NMR data. Out of many conformations generated, noscapine spends most of its time (86%) in open-palm conformations (
Fig. 1b
). Ab initio quantum chemical calculations using B3LYP and basis set 3-21G* level were used to find the optimum three-dimensional (3D) geometry of the molecules. To prevent the structures located at local minima, geometry optimization was iterated many times with different starting points for each molecule. The optimization was preceded by the Polak-Rebiere algorithm to reach to 0.01 root mean square gradient. To check the reliability of the geometry obtained, we compared the structural parameters of noscapine (
Fig. 1c
) with the conformation obtained from NAMFIS (
Fig. 1b
) and crystal structure (
QSAR modeling
The geometrically optimized structures of the molecules were used, and a set of 422 molecular descriptors was calculated. It includes a set of shape and topological descriptors, described by means of the surface area, volume, topological indices, and dihedral angle between the isoquinoline and isobenzofuranone rings. The electronic descriptors such as EHOMO, ELUMO, local charges, and dipole moments were derived from AM1 calculations. Indices of electronegativity (χ = –0.5(EHOMO − ELUMO)), hardness (η = 0.5(EHOMO – ELUMO)), softness (S = 1/η), and electrophilicity (ω = χ2/2η) were calculated from HOMO and LUMO energies. 14 Constitutional molecular descriptors were used to define the effect of different fragments of the molecules. From each class of molecular descriptors, significant descriptors were filtered out systematically, as mentioned in the Materials and Methods section, pertaining to QSAR model development.
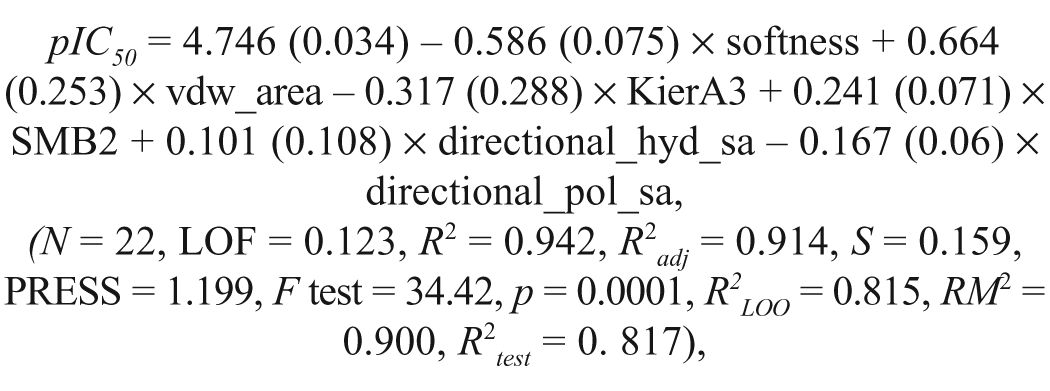
Multiple linear regression analyses were employed for QSAR model development (summarized in
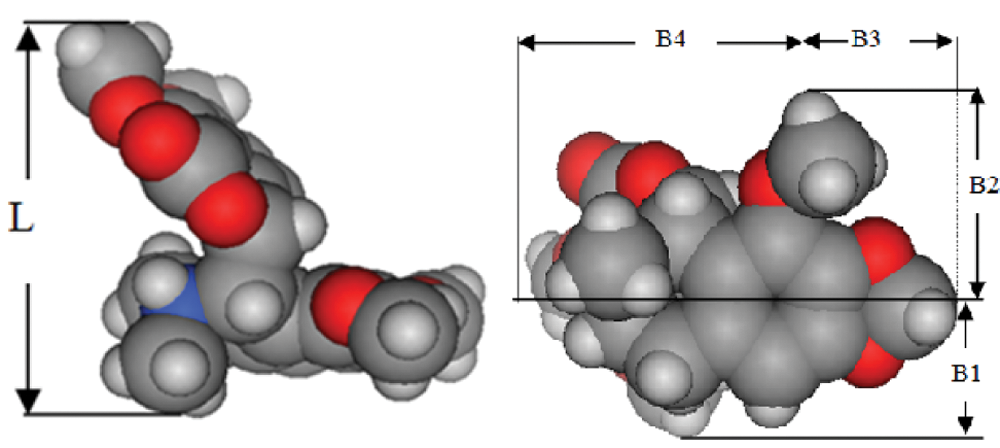
Schematic representations of different steriomolecular parameters used in the study.
where N is the number of compounds in the training set, R2 is the squared correlation coefficient, S is the estimated standard deviation about the regression line, R2adj is the square of the adjusted correlation coefficient for degrees of freedom, F test is the measure of variance that compares two models differing by one or more variables to determine if the complexity of the model correlates positively with its reliability (the model is supposed to be good if the F test is above a threshold value), and R2LOO is the square of the correlation coefficient of the cross-validation using the leave-one-out (LOO) cross-validation technique.
The QSAR model developed in this study is statistically best fitted (R2 = 0.942, R2LOO = 0.815, F test = 34.42) and consequently used for the prediction of antitumor activities (pIC50) of training and test sets of molecules, as reported in
Tables 2
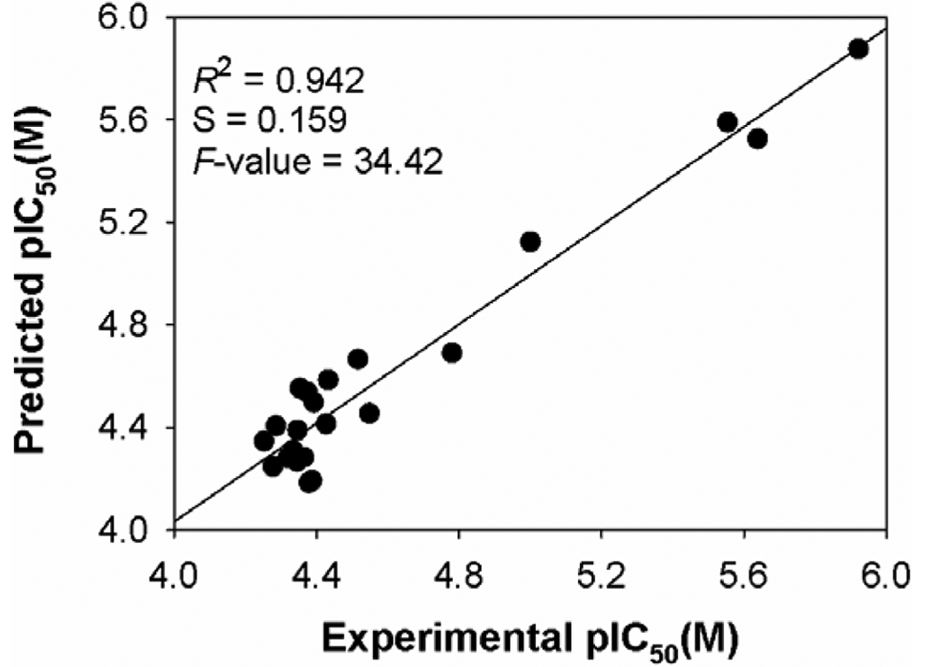
Relationship between predicted and experimental biological activities of training set compounds as per Quantitative Structure Activity Relationship equation (equation 6). Biological activities are pIC50 = –log (IC50) in molar concentrations.
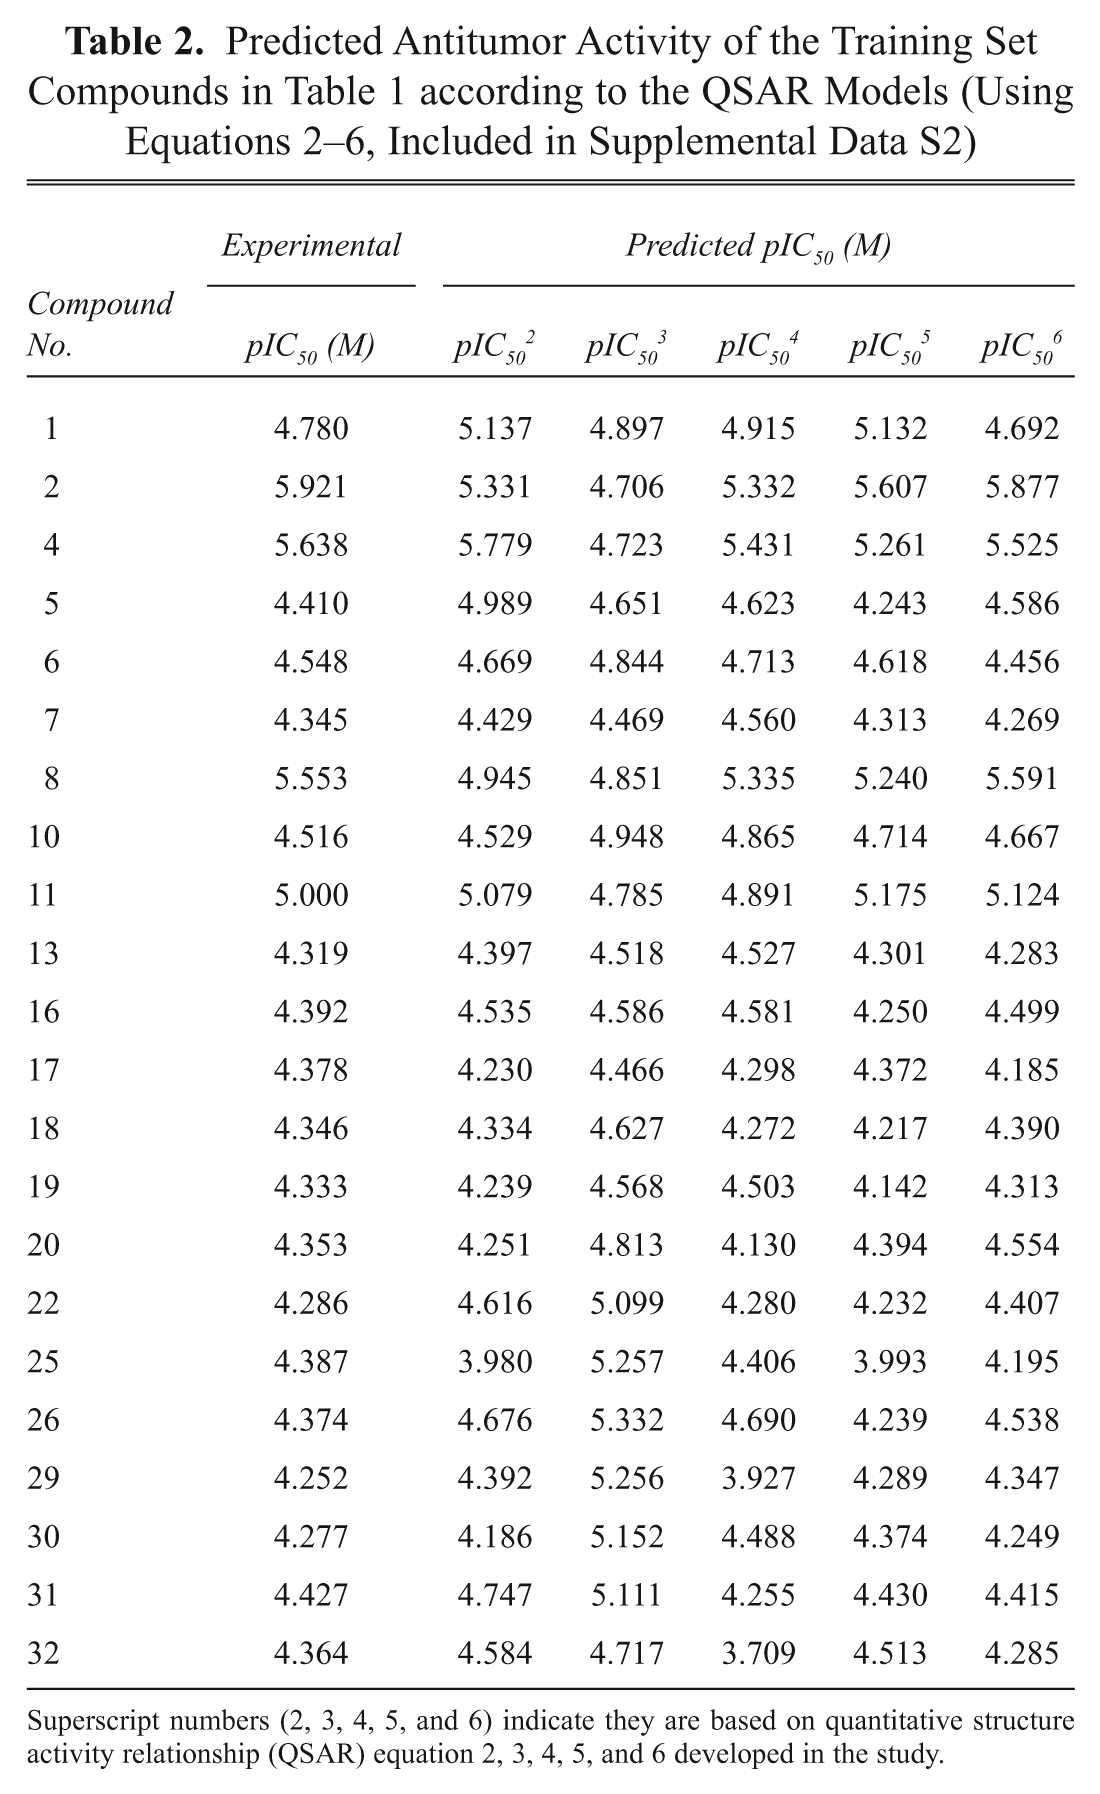
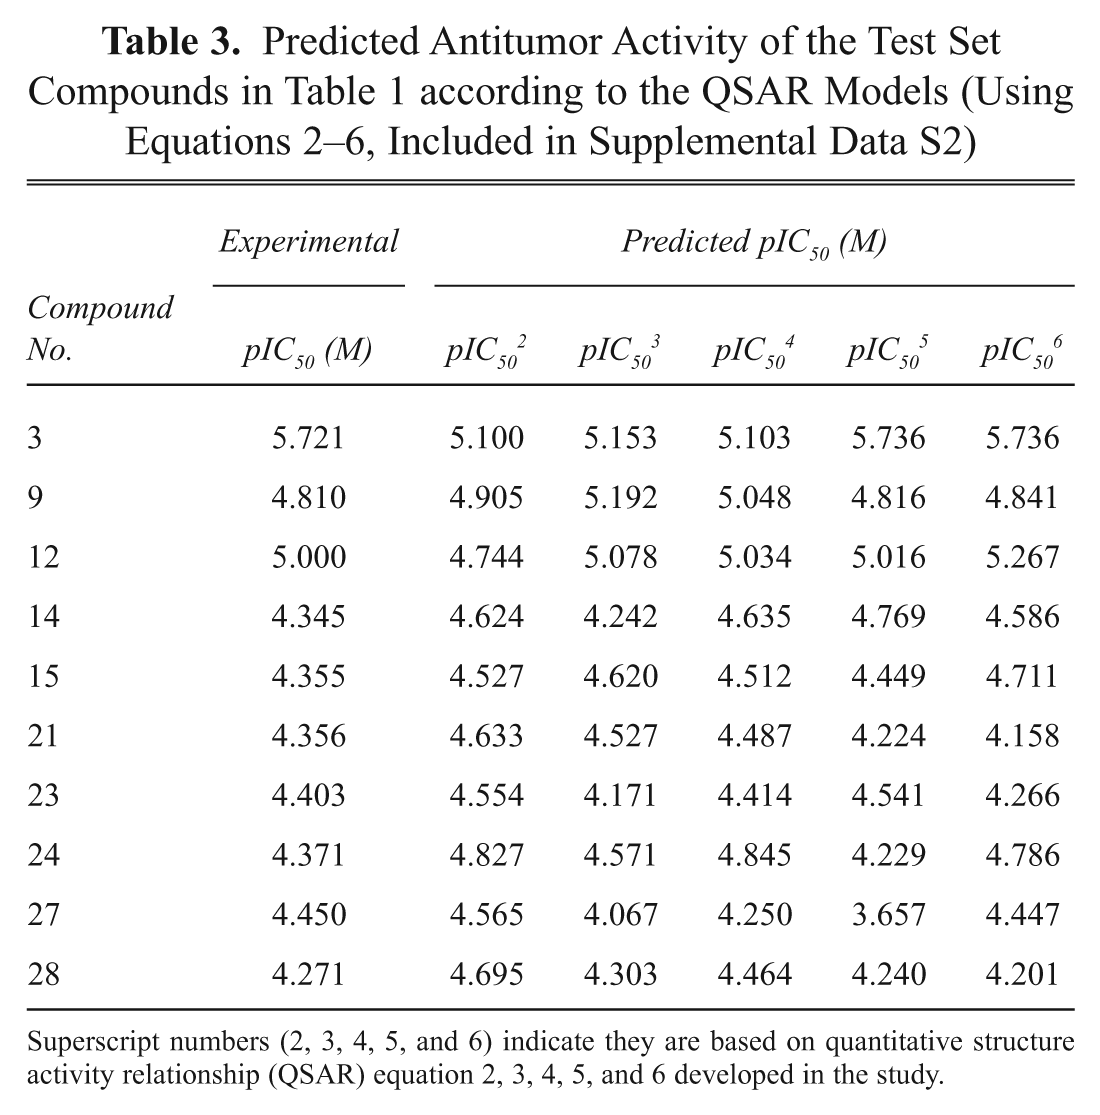
The intercorrelation of the descriptors used in the final model was very low (less than 0.6), and thus the model is statistically significant. It is necessary that the descriptors involved in the equation should not be intercorrelated with each other. To further check the intercorrelation of descriptors, VIF analysis was performed. VIF values of these descriptors are 3.268 (softness), 4.525 (vdw_area), 4.651 (KierA3), 4.608 (SMB2), 2.849 (directional_hyd_sa), and 2.740 (directional_pol_sa). Based on the VIF analysis, it was found that the descriptors used in the final model have very low intercorrelation.11,12 Satisfied with the robustness of the QSAR model developed using the training set, we next applied the QSAR model to an external data set of noscapine analogs comprising the test set. Table 3 presents the predicted pIC50 values of the test set based on the QSAR model. The overall root mean square error between the experimental and the predicted pIC50 value was 0.193, which revealed good predictability. The squared correlation coefficient between experimental and predicted pIC50 values for the test set is also significant (R2 = 0.817). Figure 4 shows the quality of the fit. The estimated correlation coefficient between experimental and predicted pIC50 values with intercept (R2) and without intercept (R20) are 0.942 and 0.940, respectively. The value of [(R2 – R20)/R2] = (0.942 – 0.940)/0.942 = 0.0021 is also less than the stipulated value of 0.1.11,12 Values of R2test = 0. 817 and rm2 = 0.90 were in the acceptable range, thereby indicating the good external predictability of the QSAR model.11,12
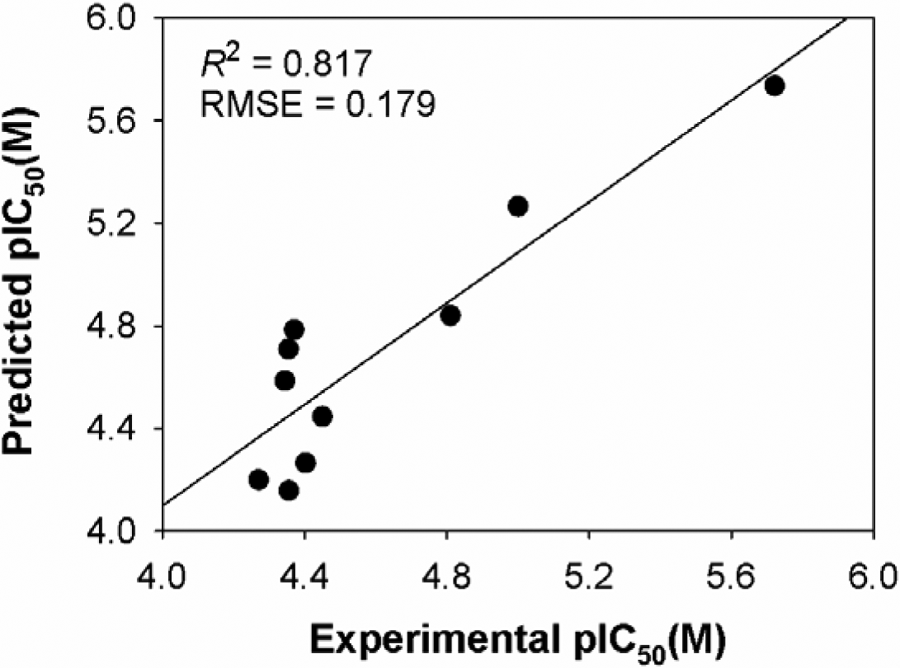
Relationship between predicted and experimental biological activities of test set compounds as per the quantitative structure activity relationship equation (equation 6). Biological activities are pIC50 = –log (IC50) in molar concentrations.
Discussion
In this article, we systematically investigated the relationship between the well-characterized structure and its antitumor activity by synthesizing strategic derivatives of noscapinoids. Geometrically optimized structures were in agreement with NAMFIS and crystal structures. To obtain quantitatively the effects of various structural parameters of the noscapine derivatives on their biological activity, QSAR analysis with different types of molecular descriptors was operated. We used the genetic function approximation algorithm of variable selection and generated robust QSAR models with high predictability for the external data set. We thus believe that this model would perform as a good rapid screening tool to uncover new and more potent antitumor drugs based on noscapine derivatizations. The appearance of the electronic descriptors such as electronegativity and electrophilicity in equation 5 as well as softness in equation 6 (calculated from HOMO and LUMO energies) demonstrates that these descriptors significantly influence the antitumor activity of noscapinoids. They favor columbic interaction between ligands and receptor. Therefore, the developed QSAR models guided us to substitute a functional group such as azido (N− = N+ = N−), satisfying the above descriptors in the scaffold structure of noscapine pertaining to better antitumor activity. To begin to test this, we built two noscapine derivatives using the molecular builder (9-azido noscapine and reduced-9-azido noscapine; Table 4 ) and predicted their biological activities by using the QSAR model. It was deduced that both molecules have superior activity in comparison with the lead molecule, noscapine.
To experimentally test the predictability of our QSAR model, we chemically synthesized both the molecules ( Scheme 1 ), and their activity was experimentally determined in CEM cells using the MTS assay described in the Materials and Methods section. As guided by our QSAR model, we chose to substitute an azido group at the C-9 position of the noscapine scaffold ( Fig. 1a ), producing 9-azido-noscapine, and we also chose to reduce the ketone group of 9-azido-noscapine on its isobenzofuronone ring, conjuring up a reduced 9-azido-noscapine. The predicted (5.731 and 5.710 M) and experimental (5.585 M) pIC50 values are included in Table 4 . The experimental results (with extremely small deviations of 0.146 M and 0.125 M) show that our model has a highly predictive power for the further design of better noscapinoids for anticancer drug discovery and development.
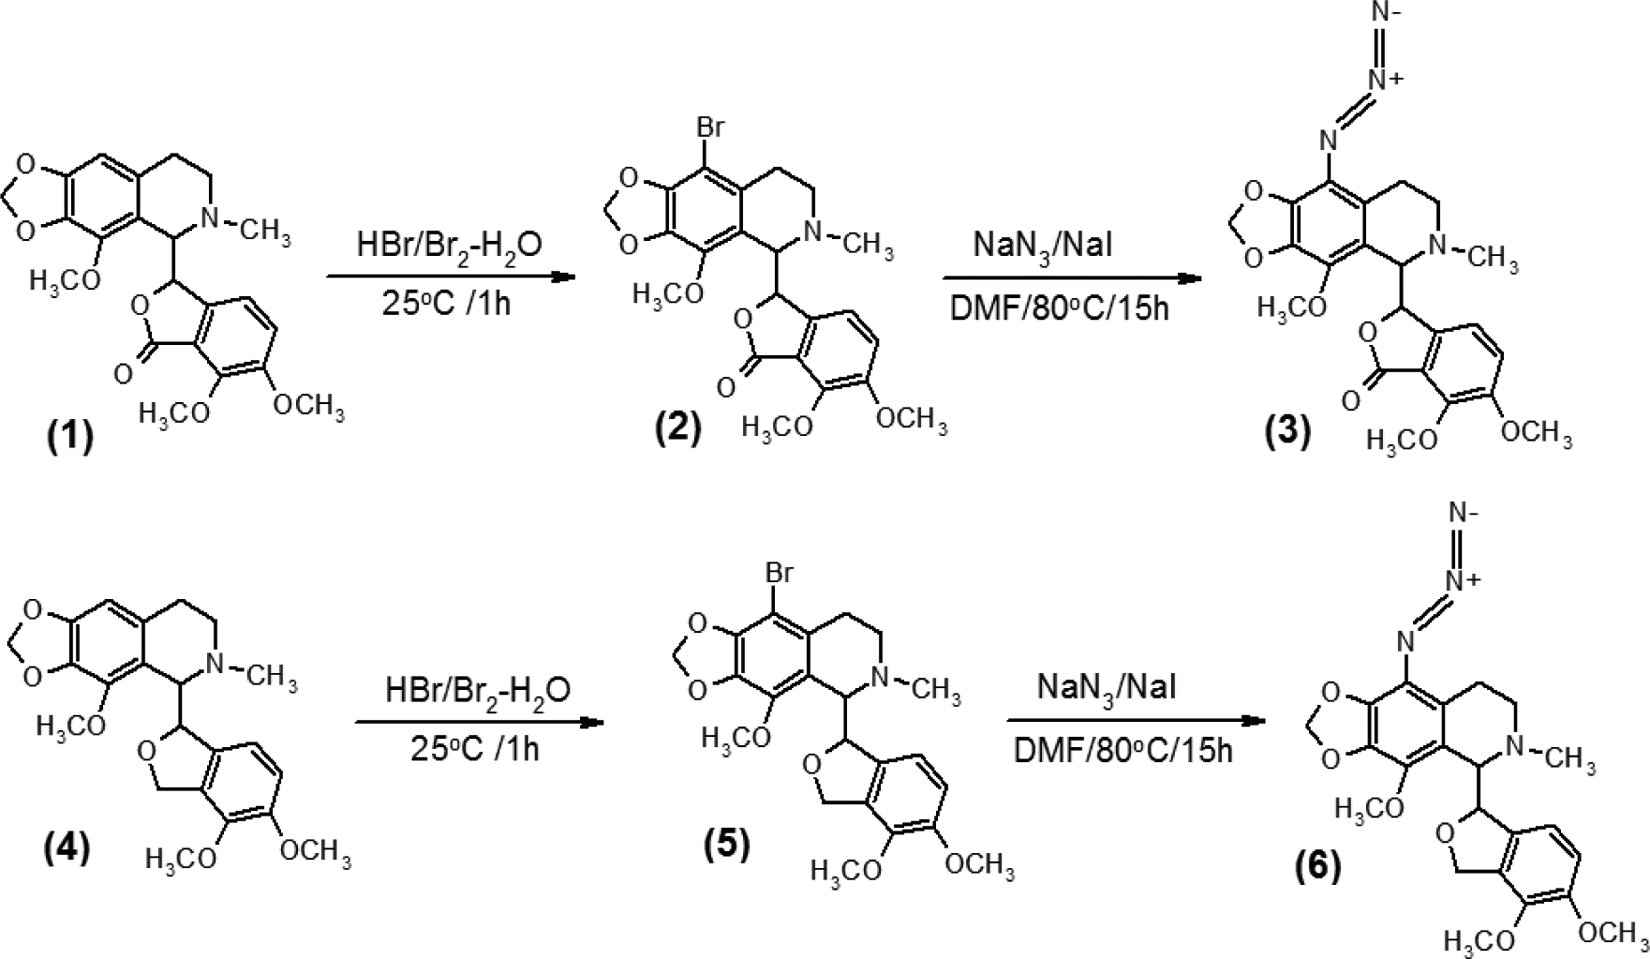
Synthesis of 9-azido-noscapine and reduced 9-azido-noscapine. (a) Synthesis of 9-azido-noscapine [(S)-3-((R)-9-azido- 4-methoxy-6-methyl-5,6,7,8-tetrahydro-[1,3]dioxolo[4,5-g]isoquinolin-5-yl)-6,7-dimethoxyisobenzofuran-1(3H)-one]
Synthesis of novel 9-azido-noscapine
Both 9-azido-noscapine and reduced 9-azido-noscapine were synthesized from noscapine (1) and reduced noscapine (4) as starting materials, respectively. The reduced noscapine (4) itself was synthesized from noscapine (1) as described previously. 7 Both synthetic schemes involved their respective intermediates, 9-bromo-noscapine and reduced 9-bromo-noscapine ( Scheme 1 ).
Twenty grams of noscapine (1) (48.4 mmol) was dissolved by adding a minimum amount of 48% hydrobromic acid solution (˜40 mL) in a flask. Freshly prepared bromine water (˜250 mL) was added dropwise to the reaction mixture until an orange precipitate appeared. The reaction mixture was then stirred at room temperature for 1 h and neutralized to pH 10.0 using ammonia solution to obtain a precipitate. The solid precipitate was then recrystallized in ethanol to yield 9-bromo-noscapine (2): yield, 82%; melting point (mp), 169 °C to 170 °C; IR, 2945 (m), 2800 (m), 1759 (s), 1612 (m), 1500 (s), 1443 (s), 1263 (s), 1091 (s), 933 (w) cm−1. 1H NMR (CDCl3, 400 MHz), δ 7.04 (d, 1H, J = 7 Hz), 6.32 (d, 1H, J = 7 Hz), 6.03 (s, 2H), 5.51(d, 1H, J = 4 Hz), 4.55 (d, 1H, J = 4 Hz), 4.10 (s, 3H), 3.98 (s, 3H), 3.89 (s, 3H), 2.52 (s, 3H), 2.8 to 1.93 (m, 4H); 13C NMR (CDCl3, 100 MHz), δ 167.5, 151.2, 150.5, 150.1, 148.3, 140.0, 135.8, 130.8, 120.3, 120.4, 120.1, 105.3, 100.9, 100.1, 87.8, 64.4, 56.1, 56.0, 55.8, 51.7, 41.2, 27.8. Mass spectrometry: fast atom bombardment ions (FAB), m/z (relative abundance percentage), 494 (93.8), 492 (100), 300 (30.5), 298 (35.4); matrix-assisted laser desorption ionization (MALDI), m/z 491.37 (M+), 493.34; electrospray ionization/tandem mass spectrometry, parent ion masses, 494, 492; daughter ion masses (intensity, percentage): 433 (51), 431 (37), 300 (100), 298 (93.3); high-resolution mass spectrometry (HRMS-ESI), m/z calculated for C22H23BrNO7 (M+1), 493.3211; experimentally determined, 493.3215 (M+1).
Sodium azide (2.641 g, 40.63 mmol) and sodium iodide (0.609 g, 4.063 mmol) were added to a 20 mL solution of the above compound 2 (4.063 mmol) in DMF, and the reaction mixture was stirred at 80 °C for 15 h. Then, the solvent was removed in vacuo and the resultant residue was dissolved in chloroform (40 mL), washed with water (2 × 40 mL), dried over sodium sulfate, and concentrated to obtain compound 3, which was recrystallized in ethanol:hexane (10:90): yield, 89%; mp 177.2 °C to 178.1 °C; IR: 1529, 1362 cm−1; 1H NMR (CDCl3, 400 MHz): δ 7.05 (d, 1H, J = 7.0 Hz), 6.4 (d, 1H,J = 7.0 Hz), 6.01 (s, 2H), 5.85 (d, 1H, J = 4.4 Hz), 4.40 (d, 1H, J = 4.4 Hz), 4.15 (s, 3H), 3.88 (s, 3H), 3.84 (s, 3H), 2.75 to 2.62 (m, 2H), 2.60 to 2.56 (m, 2H), 2.51 (s, 3H); 13C NMR (CDCl3, 100 MHz): δ 169.2, 157.7, 152.6, 147.9, 142.2, 140.5, 135.0, 134.0, 123.5, 121.8, 119.7, 119.3, 114.1, 100.5, 87.4, 64.1, 56.7, 56.5, 56.2, 51.4, 39.2, 27.2; HRMS (ESI): m/z calculated for C22H23N4O7 (M+1), 455.4335; experimentally determined, 455.4452 (M+1).
Synthesis of reduced 9-azido-noscapine [((S)-3-((R)-9-azido-4-methoxy-6-methyl-5,6,7,8-tetrahydro-[1,3]dioxolo[4,5-g]isoquinolin-5-yl)-6,7-dimethoxyisobenzofuran-1(3H))]. The synthetic scheme was quite parallel to the one described above. Briefly, reduced noscapine (4) (20.0 g, 48.8 mmol) was dissolved by slowly adding minimal 48% hydrobromic acid (˜40 mL) in a flask, freshly prepared bromine water (˜250 mL) dropwise until a precipitate appeared. Reaction mixture was stirred at room temperature for 1 h and neutralized with ammonia solution to pH 10.0 to obtain a solid precipitate of reduced 9-bromo-noscapine (5), which was then also recrystallized in ethanol. Yield, 80%; mp 113 °C to 114 °C; IR: 2950 (m), 2852 (m), 1635 (w), 1616 (m), 1450 (s), 1267 (s), 1226 (s), 1078 (s), 1035 (s) cm−1; 1H NMR (CDCl3, 400 MHz), δ 6.73 (d, 1H, J = 8 Hz), 6.11 (d, 1H, J = 8 Hz), 6.08 (s, 2H), 5.78 (s, 2H), 5.33 (dd, 1H, J = 12 Hz), 5.05 (dd, 1H, J = 12 Hz), 4.90 (s, 1H), 3.86 (s, 6H), 3.83 (s, 3H), 3.42 to 3.19 (m, 2H), 2.99 (s, 3H), 2.82 to 2.80 (m, 2H); 13C NMR (CDCl3, 100 MHz), δ 151.8, 151.6, 149.7, 148.8, 136.3, 135.8, 132.9, 131.1, 120.9, 121.5, 114.4, 106.0, 101.2, 97.9, 69.3, 65.2, 56.9, 56.6, 56.0, 52.5, 41.3, 27.9; MS (FAB): m/z (relative abundance, %), 480 (100), 478 (100), 462 (8), 460 (8.3), 300 (18), 298 (19), 179 (12.5); MALDI: m/z 478.5 (M)+, 480.5; ESI: parent ion mass, 480, 478; daughter ion masses (intensity, %), 462 (74), 460 (52.5), 447 (21), 445 (16.6), 431 (83.3), 429 (66.6), 300 (79), 298 (74.7), 193 (11), 191 (23.5), 179 (100); HRMS (ESI): m/z calculated for C22H25BrNO6 (M+1), 479.3345; experimentally determined, 479.3329 (M+1).
To obtain reduced 9-azido-noscapine (6), compound 5 was used as the starting material, and a parallel procedure was followed as described above for the synthesis of 9-azido-noscapine(3). Yield for compound 6 was 84%; mp 121 °C to 122 °C; IR: 1320, 1153 cm−1; 1H NMR (CDCl3, 400 MHz): δ 6.74 (d, 1H, J = 8.0 Hz), 6.19 (d, 1H, J = 8.0 Hz), 6.06 (s, 2H), 5.48 (s, 2H), 4.88 (dd, 1H, J = 12 Hz), 4.77 (dd, 1H, J = 12 Hz), 4.75 (s, 1H), 3.82 (s, 6H), 3.79 (s, 3H), 3.38 to 3.15 (m, 2H), 2.95 (s, 3H), 2.78 to 2.80 (m, 2H); 13C NMR (CDCl3, 100 MHz), δ 153.5, 151.2, 149.3, 148.4, 135.9, 135.4, 132.5, 130.7, 120.5, 121.1, 114.0, 105.6, 100.8, 97.5, 68.9, 64.8, 56.5, 56.2, 55.6, 52.1, 40.9, 27.5; HRMS (ESI): m/z calculated for C22H23N4O6 (M+1), 441.4469; experimentally determined, 441.4453 (M+1).
Footnotes
Acknowledgements
We thank Drs. Jim Nettles, James Snyder, Bing, Wu, Liotta, and Jun Zhou for 2D NMR and NAMFIS analysis. We are also thankful to Kenneth I. Hardcastle, Chemistry Department, Emory University, for the crystal structure of noscapine. We are indebted to the anonymous reviewers of this article for helpful suggestions. Grant support: National Institutes of Health grants CA-095317-01A2 (H. C. Joshi) and BOYSCAST fellowship (SR/BY/L-37/09) to Pradeep K. Naik (Department of Science and Technology, Government of India).
References
Supplementary Material
Please find the following supplemental material available below.
For Open Access articles published under a Creative Commons License, all supplemental material carries the same license as the article it is associated with.
For non-Open Access articles published, all supplemental material carries a non-exclusive license, and permission requests for re-use of supplemental material or any part of supplemental material shall be sent directly to the copyright owner as specified in the copyright notice associated with the article.