
Abstract
This study provides evidence that quinidine can be used as a probe substrate for ABCB1 in multiple experimental systems both in vitro and in vivo relevant to the blood–brain barrier (BBB). The combination of quinidine and PSC-833 (valspodar) is an effective tool to assess investigational drugs for interactions on ABCB1. Effects of quinidine and substrate–inhibitor interactions were tested in a membrane assay and in monolayer assays. The authors compared quinidine and digoxin as ABCB1 probes in the in vitro assays and found that quinidine was more potent and at least as specific as digoxin in ATPase and monolayer efflux assays employing MDCKII-MDR1 and the rat brain microcapillary endothelial cell system. Brain exposure to quinidine was tested in dual-/triple-probe microdialysis experiments in rats by assessing levels of quinidine in blood and brain. Comparing quinidine levels in dialysate samples from valspodar-treated and control animals, it is evident that systemic/local administration of the inhibitor diminishes the pumping function of ABCB1 at the BBB, resulting in an increased brain penetration of quinidine. In sum, quinidine is a good probe to study ABCB1 function at the BBB. Moreover, quinidine/PSC-833 is an ABCB1-specific substrate/inhibitor combination applicable to many assay systems both in vitro and in vivo.
Introduction
D
Digoxin is the prototypic ABCB1 probe substrate recommended by the regulatory agencies.2,3 However, a consensus has not been reached on this issue. 4 Quinidine is also considered an ABCB1-specific probe. 4 Several studies suggest that the entry of quinidine into the brain is restricted 5 and controlled by ABCB1 expressed in the BBB.6–8 Yet, even in recent reviews, quinidine is classified as an ABCB1 inhibitor.2,9 The aim of the present study was to provide further evidence that quinidine can be used as a probe substrate for ABCB1 at the BBB employing a battery of test systems, including membrane assays, cell-based assays, and dual-/triple-probe microdialysis assays in anesthetized and awake rats. We propose using quinidine and PSC-833 (valspodar), a clinically relevant ABCB1 inhibitor,10,11 as a probe substrate/reference inhibitor combination to assess investigational drugs for their interactions on ABCB1 in the in vitro and in vivo BBB models.
Materials and Methods
Chemicals and supplies for in vitro and in vivo assays
Quinidine, fetal calf serum (FCS), CPT-cAMP, hydrocortisone, collagen type IV, fibronectin, heparin, insulin-transferrin-sodium selenite media supplement, and puromycin were purchased from Sigma (Sigma-Hungary Kft, Budapest, Hungary). RO-201724 was purchased from Roche (Roche Hungary Kft, Budaörs, Hungary). Quinidine (9-3H) was purchased from American Radiolabeled Chemicals (St. Louis, MO). PSC-833 and the MDR1 PREDEASY ATPase assay kit were supplied by Solvo Biotechnology (Szeged, Hungary). LY-335979 was synthesized as described earlier. 12 For monolayer assays, the Millicell 24 device from Millipore (Millipore Kft, Budapest, Hungary), Dulbecco’s modified Eagle’s medium (DMEM)/F12 from Invitrogen (Csertex Kft, Budapest, Hungary), bFGF from Roche (Roche Hungary Kft), plasma-derived serum (PDS) from First Link (Birmingham, UK), and Transwell filters from Costar Corning (Zenon Bio Kft, Szeged, Hungary) were applied. Microdialysis probes, tubing adapters, and guide cannulae (CMA, Solna, Sweden) were obtained from Atmos Hörka Kft (Budapest, Hungary). FEP and PEEK tubings and sample vials were obtained from Microbiotech (Stockholm, Sweden).
In vitro assays
ATPase assay
The MDR1 PREDEASY ATPase assay kit (Solvo Biotechnology) was used. The assay was performed as suggested by the manufacturer with the following modifications: In activation experiments, quinidine or digoxin was applied at increasing concentrations (0.2–800 µM and 0.37–800 µM, respectively). In inhibition experiments, quinidine or digoxin was used as an activator instead of verapamil at a concentration of 50 µM and 300 µM, respectively.
Data analysis of ATPase experiments
Experimental data were analyzed by the use of Prism 4.0 (GraphPad Software, San Diego, CA). To determine EC50 values, a sigmoid dose–response curve was fitted onto the vanadate-sensitive ATPase-activity versus concentration plot by nonlinear regression:

where Y is the vanadate-sensitive ATPase activity, Bottom is the minimal activation observed, Top is the maximal activation observed, c is the concentration of the test drug, and Log EC50 is the concentration value when the response is halfway between Bottom and Top.
MDCKII monolayer assay
Transport assays across MDCKII–WT and MDCKII–MDR1 cells were performed as described. 13 Cells were seeded on Millicell 24 (Millipore Kft) plates according to the manufacturer’s instructions. Quinidine (10 µM) or digoxin (5 µM) was added to the donor compartment. The ABCB1 inhibitors, LY-335979 and PSC-833 (5, 1, 0.2 µM), were either absent or present in both the basolateral and apical compartments. In experiments with digoxin as a probe, LY-335979 and PSC-833 were applied in concentrations of 1 and 5 µM, respectively. In the digoxin MDCKII–MDR1 monolayer assay, the inhibitory potential of quinidine was also tested at various concentrations (3, 10, 30, 100 µM). Samples were taken from the receptor part after 60 min of incubation in the experiments with quinidine and 120 min in the experiments with digoxin.
Analytical determination of quinidine
Quinidine was measured by high-performance liquid chromatography (HPLC) with fluorescence detection. The HPLC system was a Merck-Hitachi LaChrom System, (Hitachi High-Technologies Corporation, Tokyo, Japan) consisting of a D 7000 interface, L 7100 pump, L 7200 autosampler, and L 2480 fluorescence detector. Separation of quinidine was achieved using a C18-RP column (Phenomenex [Torrance, CA] Luna C18, 5 µ, 100 Å, 150 × 2 mm RP) with an isocratic elution profile, consisting of 68% water (0.05% v/v H2SO4, 0.01 mol/L sodium octane-1-sulfonate monohydrate) and 32% acetonitrile with an excitation wavelength of 248 nm and an emission wavelength of 460 nm, with a flow rate of 0.4 mL/min. Then, 10-µL aliquots of samples were injected into the HPLC module. From the raw data of blood and brain dialysates, concentration–time profiles were generated with Microsoft Excel and with MicroCal Origin, including determination of area under the curves (AUCs).
Rat brain primary endothelial cell (RBEC) monolayer assay
Rat brain endothelial cells were isolated from 2-week-old rats, as described previously.14,15 Pericytes were obtained from cerebral microvessels plated onto noncoated dishes. Glial cultures were prepared from newborn rats and cultured on poly-L-lysine-coated surfaces.
Construction of the triple co-culture system
Rat brain pericytes were plated onto the backside of 12-well Transwell filters (pore size: 0.4 µm; 1.5 × 10⁴ cells/filter). The next day, endothelial cells were plated onto the upper surface of the filters. After reaching confluency, the endothelial monolayer was supplied with 550 nM hydrocortisone, 250 µM CPT-cAMP, and 17.5 µM RO-201724 and placed into dishes containing glial cultures for 24 h.
Permeability measurements
Transwell filters containing endothelial cells and pericytes were removed from the plates containing the glial culture. Filters were washed with Ringer-HEPES solution (pH 7.4). Quinidine or digoxin was applied at final concentrations of 0.1 µM and 10 µM, respectively. Radiolabeled quinidine and digoxin as tracers were also added to the radioactive concentration of 1 µCi/mL. The inhibitors were added together with the test compound at final concentrations of 1 µM (LY-335979 and PSC-833) or 100 µM (quinidine). Samples were taken from the basolateral or apical side, respectively, at 15, 30, and 60 min, and radioactivity was measured using a liquid scintillation counter (MicroBeta; PerkinElmer, Waltham, MA).
Data analysis of monolayer efflux experiments
Permeability coefficients and efflux ratios were calculated using the following formulas:

where dQ is the transported amount, dT is the incubation time, A is the surface of filter, and C0 is the initial concentration.

In vivo assays
Animals, surgical procedures, and administration of drugs
Male Wistar rats (ToxiCoop, Budapest, Hungary) weighing 280 to 360 g were used throughout this study and had free access to food and water. CMA/20 peripheral probes were implanted in the jugular vein, and the rats were placed in a stereotaxic frame for implantation of CMA/l2 brain probes in the frontal cortex (FC) and for performing the microdialysis experiments under chloral hydrate anesthesia (400 mg/kg, intraperitoneal). The stereotaxic coordinates 16 for FC with respect to the bregma were AP = +3.0 mm, ML = 1.5, and DV = −4.5. In retrodialysis experiments, a second brain probe was implanted in the same structure of the opposite side of the brain for perfusing vehicle through the probe. Anesthesia during the surgical procedures or the microdialysis experiments was maintained by further injections of chloral hydrate as needed. In experiments on anesthetized rats, quinidine and the ABCB1 inhibitors and vehicle for the inhibitors were administered intravenously via a catheter implanted in the femoral vein. In retrodialysis experiments with quinidine, a CMA/12 probe in the left FC was perfused with 10 mM PSC-833 in 15% cremophor EL and 3% ethanol containing cerebrospinal fluid (CSF). The contralateral brain probe was perfused with vehicle for PSC-833. In experiments with freely moving animals, a guide cannula was implanted above the targeted brain region 4 to 7 days prior to the experiment. In these experiments, the rats were treated with quinidine and with the inhibitors per orally (PO). All animal experiments were performed in full compliance with the guidelines of the Association for Assessment and Accreditation of Laboratory Animal Care International’s expectations for animal use, per the spirit of the licence issued by the Directorate for the Safety of the Food Chain and Animal Health, Budapest and Pest County Agricultural Administrative Authority, Hungary.
Microdialysis procedures and determination of quinidine in dialysate samples
Animals were sampled 90 to 120 min before and 210 to 240 min after intravenous (IV) or PO dosing. The peripheral and brain probes were perfused with peripheral perfusion fluid (PPF) or artificial CSF at a flow rate of 1.0 µL/min using a CMA 102 microdialysis pump. Samples were collected in polyethylene microtubes and placed on dry ice at the end of each collection period. After completing an experiment, the blood and brain dialysates were transferred to a deep freezer and kept at −70º C. Dialysate samples were later transferred to a bioanalytical laboratory and analyzed for concentrations of quinidine by HPLC with fluorescence detection as described above.
Data analysis of in vivo experiments
Analysis of variance (ANOVA) was performed on AUCs, Cmax values, and individual brain-to-blood ratios for testing possible treatment–group differences within the blood and brain dialysate samples followed by Duncan’s post hoc test. A paired-sample t test was used for comparing blood and brain means of AUCs and Cmax values in the three treatment groups.
Results
Interaction of quinidine with ABCB1—in vitro assays
Effects of quinidine on the function of ABCB1 were tested in a membrane assay, in an MDCKII–MDR1 monolayer, and in a rat brain capillary endothelial cell (RBEC) monolayer assay. In membranes prepared from insect cells overexpressing human ABCB1, quinidine increased the vanadate-sensitive ATPase activity ( Fig. 1A ), suggesting that the drug is a likely substrate for ABCB1. Digoxin, the preferred probe for ABCB1-based drug–drug interaction studies, was also characterized in our in vitro assay systems. It has exhibited lower potency and efficacy in stimulating the vanadate-sensitive ATPase than quinidine ( Fig. 1C , D ). The respective EC50 values were 7.8 and 68.5 µM.
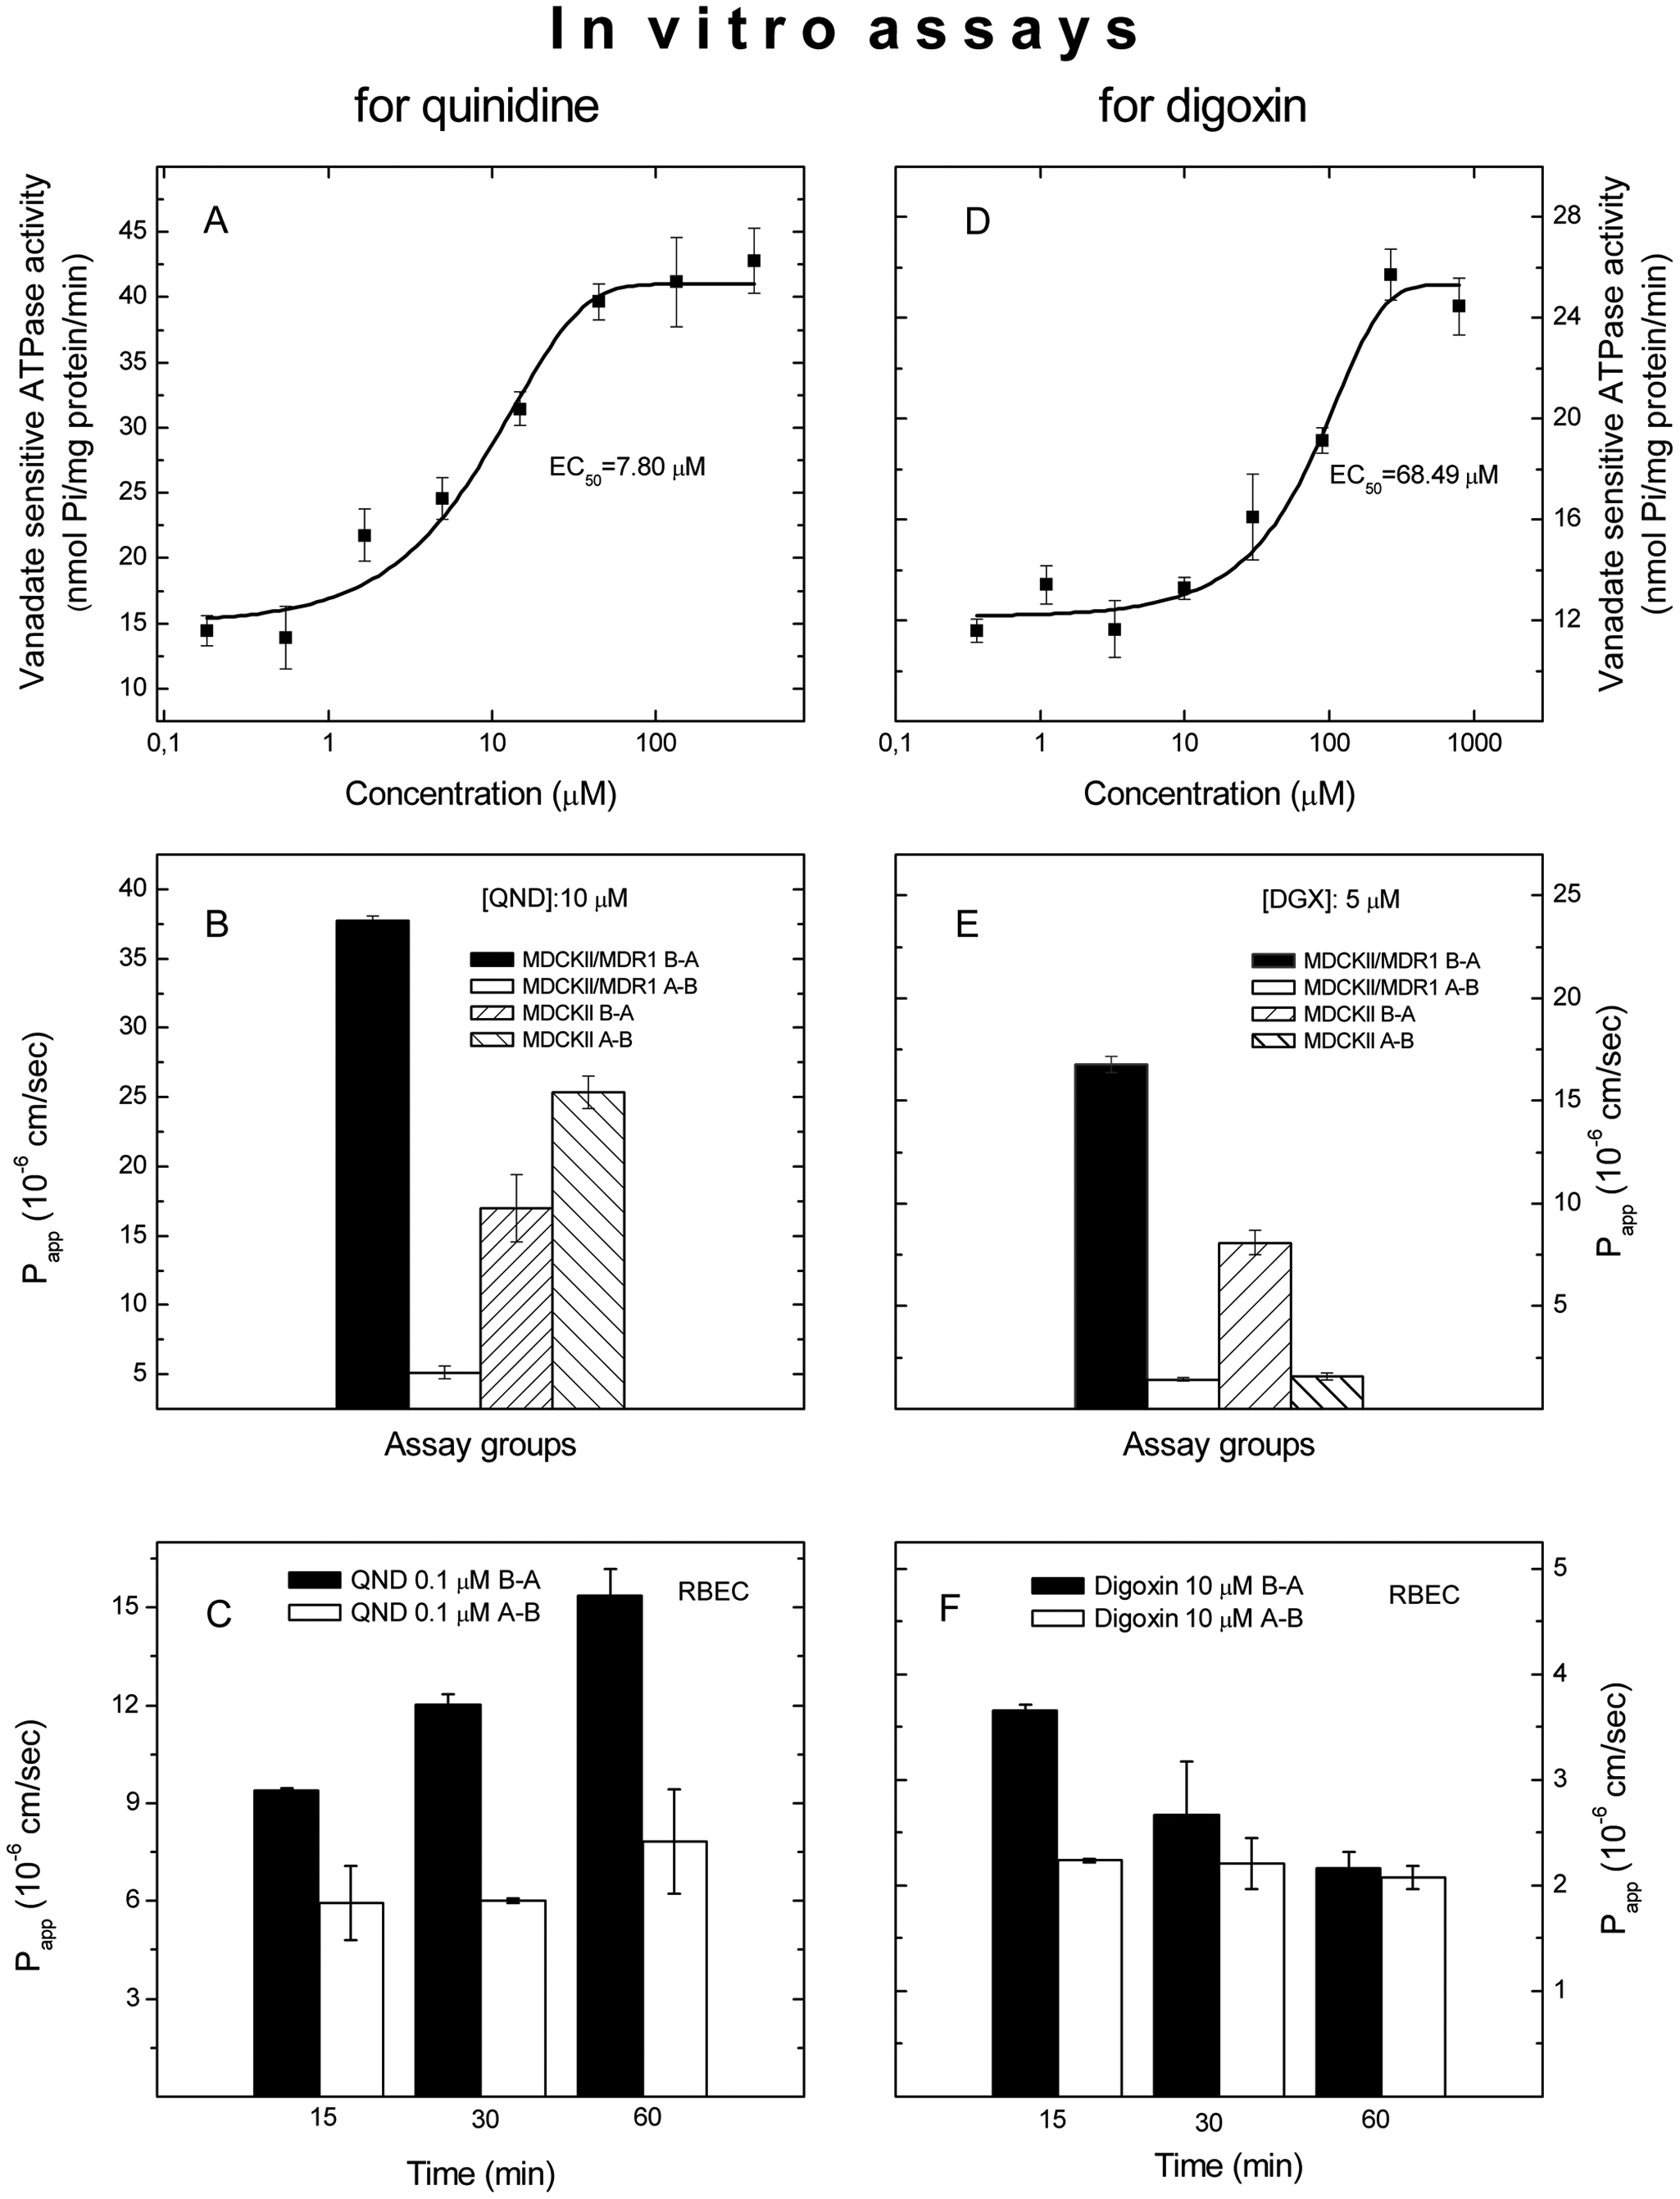
Interactions of quinidine and digoxin with ABCB1 in vitro. Activation of vanadate-sensitive ABCB1 ATPase by quinidine (
To show that this interaction affects penetration of quinidine through monolayers used as BBB models, the permeability of quinidine was tested in MDCKII–MDR1 and RBEC cells. In the MDCKII monolayer expressing human ABCB1, an efflux ratio of ~8 was observed ( Fig. 1B ), whereas in monolayers prepared from wild-type MDCKII cells, the permeability of quinidine in the basal-to-apical direction was somewhat lower than the permeability in the opposite direction ( Fig. 1B ). An efflux ratio of 11.6 was found for digoxin in MDCKII–MDR1 cells ( Fig. 1E ). Interestingly, though, an efflux ratio of 3.5 was observed for digoxin in wt MDCKII cells ( Fig. 1E ). This is likely due to the effect of the endogenous canine ABCB1 expression in this cell line.
In an RBEC monolayer, a 1.5- to 2.0-fold efflux ratio was found in quinidine transcellular transport depending on the length of the incubation time ( Fig. 1C ). An efflux ratio of 1.6 was observed for digoxin at 15 min that decreased at later time points ( Fig. 1F ). These data indicate a role for ABCB1 in the vectorial transport of quinidine through monolayers. It is also clear that quinidin outperforms digoxin in the assays used.
PSC-833 and LY-335979 antagonized the stimulatory effect of quinidine (50 µM) on vanadate-sensitive ATPase activity with IC50 values of 46.2 nM and 6.84 nM, respectively, in membranes prepared from human ABCB1 overexpressing insect cells ( Fig. 2A ). Neither PSC-833 nor LY-335979 had any effect on the vanadate-sensitive ATPase activity of the membranes prepared from control insect cell membranes (data not shown). Stimulation of vanadate-sensitive ATPase activity by digoxin (300 µM) was also effectively inhibited by PSC-833 and LY-335979 with IC50 values of 12.6 nM and 3.16 nM, respectively ( Fig. 2D ). Quinidine was less efficacious at inhibition of digoxin-stimulated ABCB1 ATPase ( Fig. 2D ).
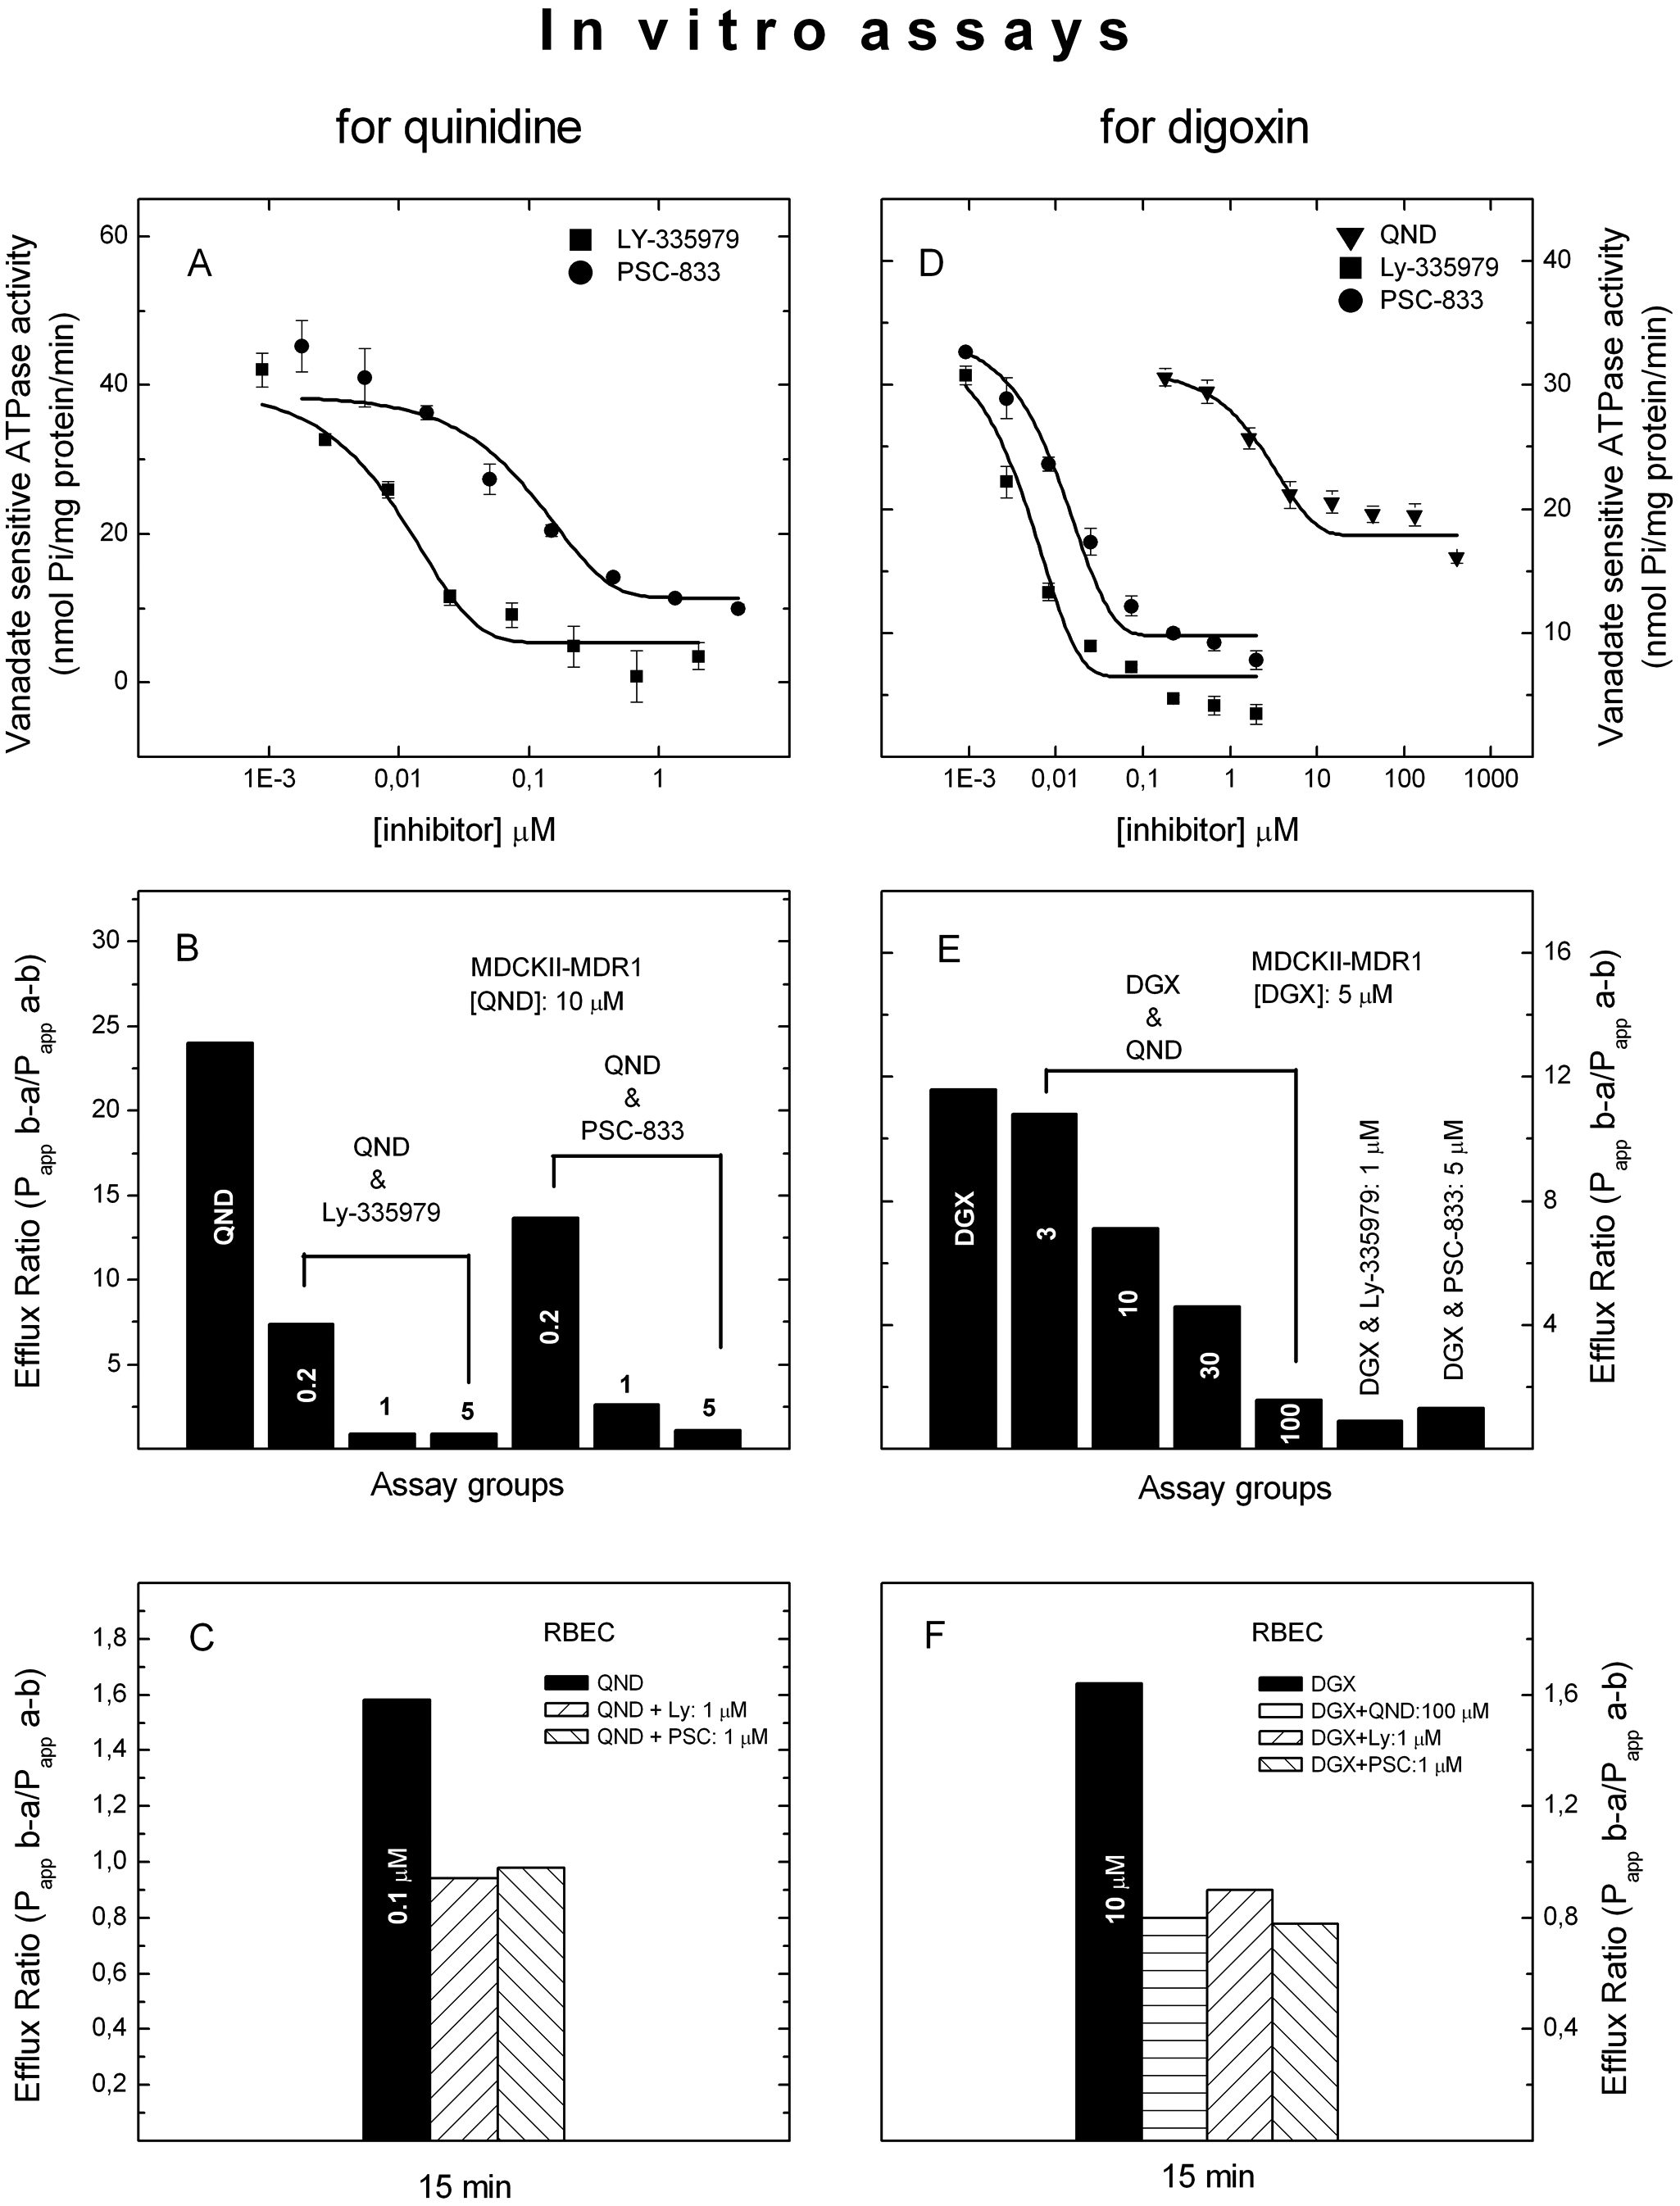
Modulation of quinidine and digoxin transport by PSC-833 and LY-335979 in vitro. Effects of ABCB1 inhibitors on ATPase activity stimulated by quinidine (
In MDCKII–MDR1 monolayers, LY-335979 and PSC-833 also inhibited the vectorial transport of quinidine in a concentration-dependent manner ( Fig. 2B ). LY-335979 was somewhat more potent than PSC-833 in MDCKII–MDR1 cells. In the RBEC monolayer assay, however, the two ABCB1 inhibitors were inhibiting the vectorial transport of quinidine with similar potency ( Fig. 2C ). The inhibitors reduced the efflux ratio of digoxin as potently as observed for quinidine ( Fig. 2E , F ). Quinidine also inhibited vectorial transport of digoxin in a dose-dependent manner ( Fig. 2E ).
Interaction of quinidine with ABCB1—in vivo methods
In rat brain microdialysis, concentration–time profiles of quinidine in dialysate samples and the pharmacokinetic parameters are shown in Figure 3 and Table 1 (dose of quinidine was 5 mg/kg, IV). The unbound quinidine in blood dialysate samples reached peak concentration (Cmax) at 1 h posttreatment in each group of anesthetized rats ( Fig. 3 ). The concentration–time profiles of quinidine from brain dialysates are somewhat different from those of blood dialysate samples. In the PSC-833-treated group (4 mg/kg IV, in two divided doses), the Cmax was reached at 2 h posttreatment time. There was an approximately threefold statistically significant difference between the quinidine AUC and the Cmax values of the brain and blood dialysate samples (ratio of AUCbrain/AUCblood: 0.32) in the absolute control group ( Fig. 3A , Table 1 ) and in the PAG vehicle group ( Fig. 3B , Table 1 ). The brain/blood ratio of AUC values was similar when quinidine was applied at a dose of 10 mg/kg in two pilot experiments (data not shown). In the PSC-833-treated group ( Fig. 3C , Table 1 ), however, the AUC and Cmax means in the brain and blood dialysates were very close. This indicates that the inhibition of ABCB1 by PSC-833 increases the brain exposure to quinidine ( Table 1 ).
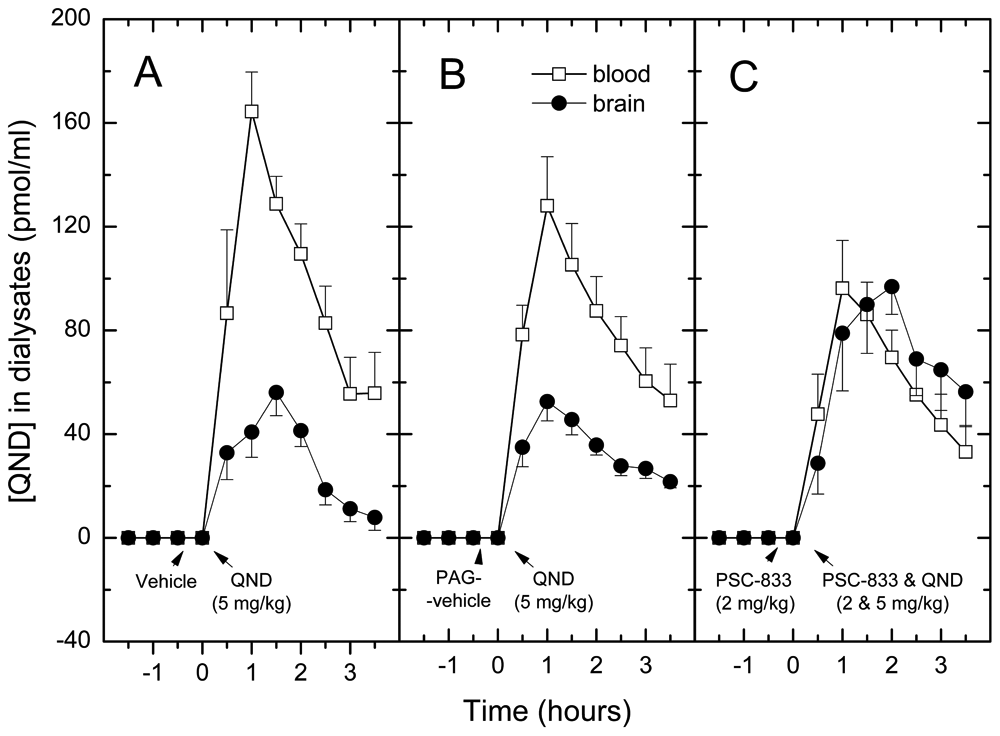
Concentration–time profiles of quinidine in dialysate samples from blood and brain. In the absolute control group (
Pharmacokinetic Parameters of Quinidine in Dialysates from Brain and Blood
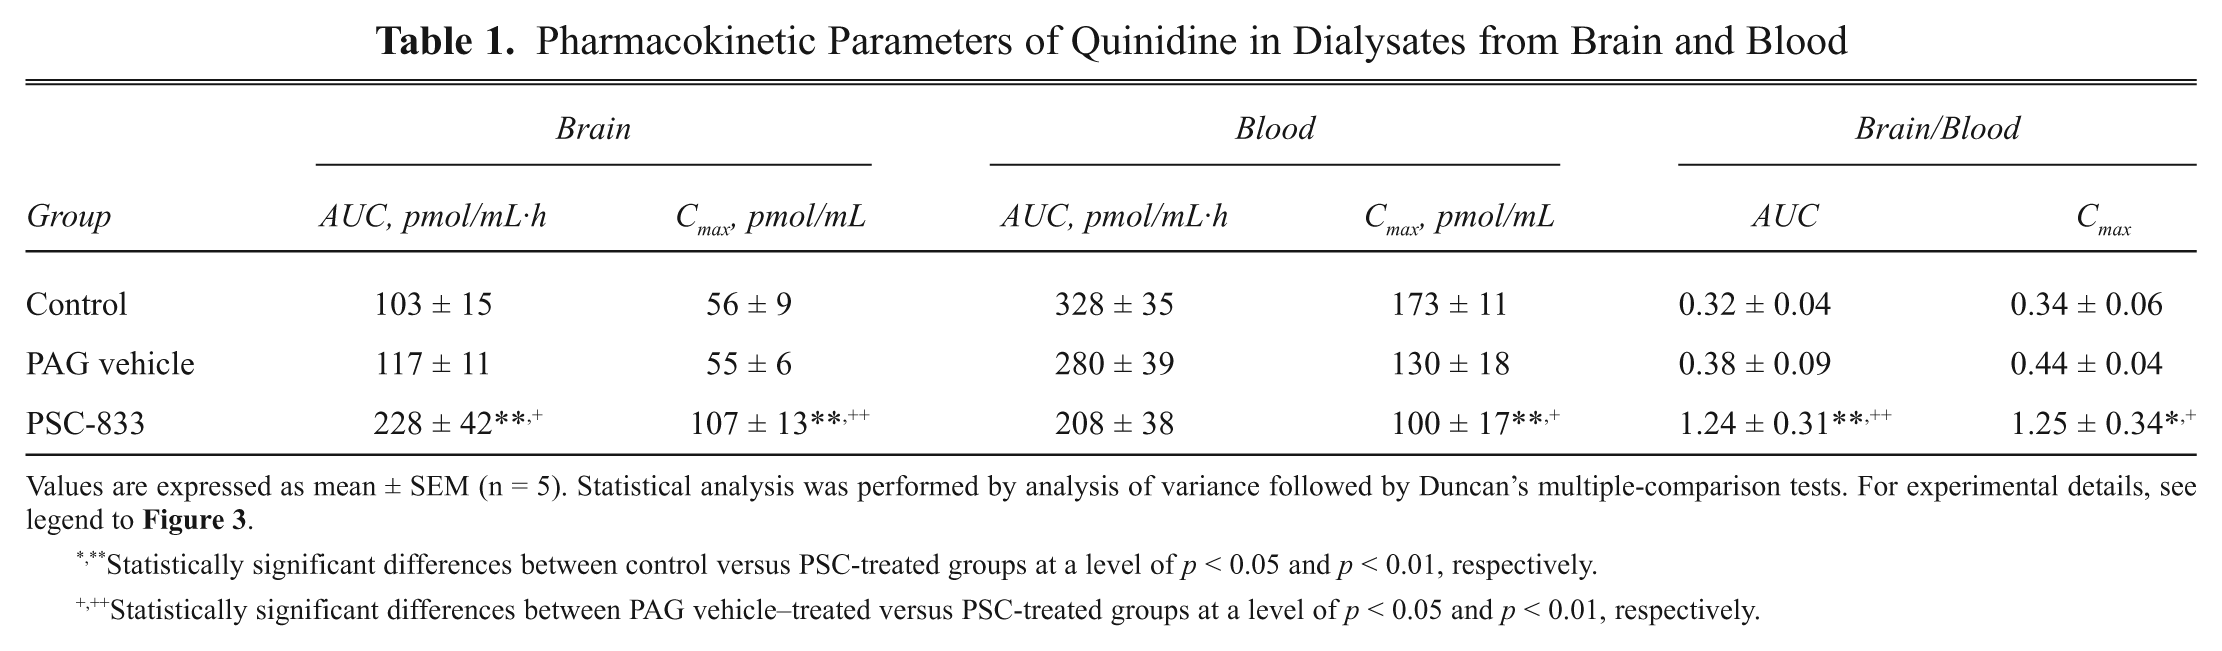
Values are expressed as mean ± SEM (n = 5). Statistical analysis was performed by analysis of variance followed by Duncan’s multiple-comparison tests. For experimental details, see legend to
Statistically significant differences between control versus PSC-treated groups at a level of p < 0.05 and p < 0.01, respectively.
Statistically significant differences between PAG vehicle–treated versus PSC-treated groups at a level of p < 0.05 and p < 0.01, respectively.
The AUC and the Cmax values determined from brain and blood dialysate samples of the treatment groups were analyzed by ANOVA and Duncan’s test. There were no statistical differences among the AUCs from brain dialysates of the absolute controls and PAG vehicle controls. In contrast, the AUC of the PSC-833-treated group significantly differed from the two control groups (F = 6.50, p < 0.01 and p < 0.05). Similarly, in blood dialysate samples, no differences in AUCs between the absolute controls and PAG vehicle controls were found. The decrease in the AUC of quinidine in the PSC-833-treated group relative to the control groups was not statistically significant. Cmax values showed a similar trend, except that the decrease of Cmax was significant ( Table 1 ).
The brain-to-blood ratios of quinidine levels in individual animals were also analyzed using ANOVA and Duncan’s test. The AUCbrain /AUCblood ratio in the PSC-833-treated group was significantly higher than in the control (F = 6.51, p < 0.01) or PAG vehicle group (p < 0.05). This shows that effluxing of quinidine to the blood by ABCB1 is decreased in the presence of PSC-833. Statistical analysis of the ratios of Cmax values gave a similar tendency ( Table 1 ). In pilot experiments, the effects of LY-335979 (20 mg/kg IV, in two divided doses) on the brain penetration of quinidine was determined at two different doses of quinidine (5 and 10 mg/kg) using the same treatment schedule as for PSC-833. Brain-to-blood ratios of AUCs and Cmax values were significantly increased by LY-335979 at both doses of quinidine (data not shown).
To test the dose dependency of the effect of PSC-833 on quinidine brain penetration in anesthetized rats, the inhibitor also was applied at a lower dose (2 × 1 mg/kg; Fig. 4 ). Data analysis (ANOVA followed by Duncan’s test) showed that PSC-833 did not increase significantly the brain-to-blood ratios of unbound quinidine at this dose; the effect was significantly weaker than at the higher inhibitor dose (p < 0.05).
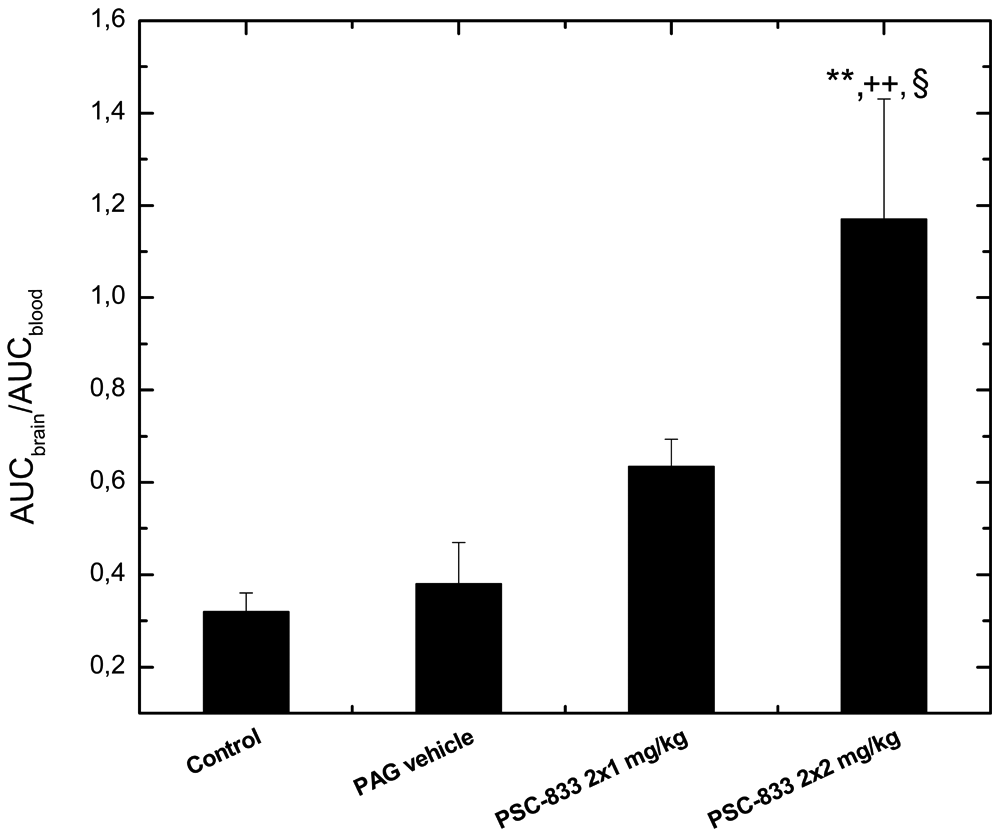
Dose dependency of the effect of PSC-833 on brain penetration of quinidine. For methodological details, see the legend to Figure 3. **p < 0.01 statistically significant difference compared to the absolute control group; ++p < 0.01 statistically significant difference compared to the PAG-vehicle treated group; §p < 0.05 statistically significant difference compared to the group treated with lower dose of PSC-833.
In a pilot experiment, quinidine brain exposure and the interaction of quinidine with PSC-833 at the BBB were studied by the same dual-probe microdialysis technique in freely moving rats placed into a movement-responsive animal system. A control animal received PAG vehicle treatment 20 min before quinidine administration (50 mg/kg, PO). Another animal received PSC-833 (25 mg/kg, PO) prior to coadministrating PSC-833 and quinidine (25 and 50 mg/kg, PO). The brain-to-blood ratios of unbound quinidine levels were 0.32 and 1.01 in the control and the PSC833-treated animals, respectively.
To further investigate the P-gp inhibitor–substrate interactions at the BBB, PSC-833 was locally applied via retrodialysis to anesthetized and freely moving rats. In an anesthetized rat, PSC-833 (10 mM) was perfused via the microdialysis probe in the left frontal cortex (FC), starting 60 min before systemic administration of quinidine (5 mg/kg, IV). The extracellular fluid (ECF) levels of quinidine in the left FC were much higher ( Fig. 5 ) than in the right FC, indicating that P-gp was inhibited at the BBB in the PSC-833-perfused side. A similar difference was found in the quinidine brain exposure between the PSC-833-perfused and untreated FC of a freely moving animal (data not shown).
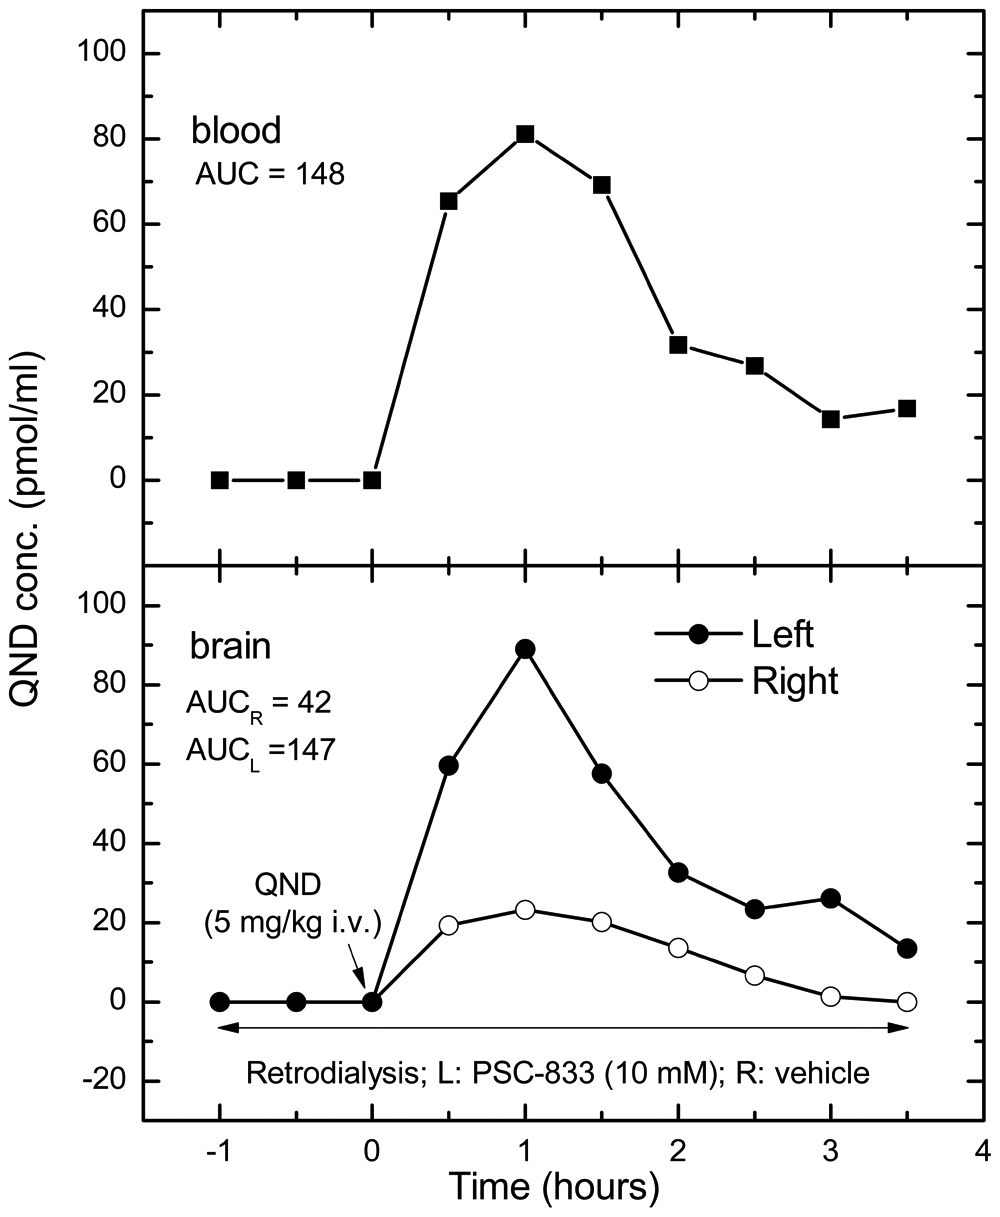
Effects of PSC-833 applied via retrodialysis on brain penetration of quinidine in an anesthetized rat. Vehicle (15% cremophor, 3% ethanol in cerebrospinal fluid) of PSC-833 (right side) or PSC-833 10 mM (left side) was perfused via microdialysis probes in the frontal cortex of rats with a flow rate of 1 µL/min. Quinidine was administered intravenously in a dose of 5 mg/kg at 0 time. The sample collection started at −90 min and finished at +210 min after quinidine injection. Quinidine levels in the samples from the left frontal cortex were corrected with the average fluorescence values in the samples collected prior to the treatment. There was no fluorescence background in the contralateral dialysate samples collected through vehicle-perfused probe. The results are from one of three experiments with similar trends.
Discussion
ABCB1 is the most important BBB efflux transporter that protects the brain from xenobiotics. The investigation of barrier function requires a variety of methods preferably using the same probes and inhibitors. Even though digoxin is the leading ABCB1 probe candidate, it has several disadvantages, such as low LD50 values in rodents. Its toxicity and difficulties of detection in dialysate samples hinder its application in microdialysis experiments. To date, no data on digoxin from intracerebral microdialysis experiments have been published. In pilot studies, we applied digoxin IV at doses of 0.5 and 1.0 mg/kg without detectable levels of digoxin in the dialysate samples (data not shown). Therefore, we chose quinidine as a potential universal probe for the various in vitro and in vivo BBB assay systems.
In vitro elements (ATPase and MDCKII–MDR1 monolayer assays) of the integrated panel in this study are among the most widely employed in vitro ABCB1 assays.17–19 A monolayer assay using primary RBECs co-cultured with astrocytes and pericytes14,15,20,21 completed the in vitro assay panel. For in vivo assays, dual-probe microdialysis and brain retrodialysis techniques in combination with peripheral sampling with microdialysis probes were used. Microdialysis sampling with simultaneous measurements of unbound concentrations of compounds in the blood and brain ECF over time allows a kinetic analysis of transport processes across the BBB. 22 To provide ABCB1 specificity, ABCB1-overexpressing membranes and cell lines, as well as control expression systems, were used in the ATPase and MDCKII assays. In the case of RBEC and in vivo systems, transporter specificity was ensured by employing ABCB1-specific inhibitors PSC-83310,11,23,24 and LY-335979.8,24,25
Despite published data that brain penetration of quinidine is controlled by ABCB16–8 and that it has been used as a substrate for ABCB1 in vitro, 26 quinidine is still referred to as an inhibitor.2,9 Our assay panel clearly confirmed that quinidine is an ABCB1 substrate with reasonable potency (EC50 = 7.80 µM; Fig. 1A ). In this study, quinidine proved to be a more robust probe than digoxin ( Figs. 1 and 2 ).
Nevertheless, quinidine is also considered a candidate probe along with digoxin, fexofenadine, and talinolol. 4 However, unlike other candidates, quinidine is metabolized. In the assays in the BBB panel, this does not seem to matter as clear ABCB1-dependent transport was established in cellular and in the in vivo assays. The quinidine/PSC-833 combination worked well both in traditional microdialysis and retrodialysis arrangements. In the absence of ABCB1 inhibitors, the AUCbrain/AUCblood value was around 0.3 ( Figs. 3 and 5 ; Table 1 ). Upon addition of the inhibitor, the AUCbrain/AUCblood ratios were close to 1, which is what is expected from a compound with an intermediate passive permeability ( Figs. 3 and 5 ; Table 1 ). The effect of PSC-833 on brain penetration of quinidine was dose dependent ( Fig. 4 ). Administration of the vehicle for PSC-833 containing PEG-300 caused a slight increase in the brain penetration of quinidine ( Fig. 3B ). This is in line with earlier findings indicating that PEG-300 interferes with the activity of ABCB1 27 similarly to some other excipients. 28
In sum, quinidine is a good probe to study ABCB1 function at the BBB as it works well in membrane-based, cellular, and in vivo studies. It meets the criteria of specificity, sensitivity, and technical feasibility. 4 Moreover, quinidine/PSC-833 is an ABCB1-specific substrate/inhibitor combination applicable to many assay systems both in vitro and in vivo.
Footnotes
Acknowledgements
Expert help by Gyuláné Berekhelyi and Eszter Patakiné Illés in the experimental procedures, as well as Judit Jánossy, Ph.D., and Timea Rosta, MS.c., in preparation of the manuscript is acknowledged.
The work was supported by the Hungarian National Office for Research and Technology, grant XTTPSRT1 (Xenobiotic Transporter Technology Platform Therapeutic and Toxicological Applications) and grant GOP 1.3.2. (development of an in vivo technological platform for pharmaceutical applications by enhancing R&D capacities), and the European Community Grants EUSTROKE (HEALTH-F2-2008-202213).